Highlights of Canada’s 2018 Merchandise Trade Performance
Kevin Jiang
Office of the Chief Economist
June 25, 2019
Table of Contents
Summary
Total Canadian merchandise trade posted a record high of nearly $1.18 trillion in 2018.Footnote 1 Exports increased for the second consecutive year in 2018, registering an all-time high of $584.2 billion, mainly on the back of higher average crude oil pricesFootnote 2 pushing up total energy exports to the United States. Proportionally, although the United States is still Canada’s largest export destination by far, the trend of slowly diversifying away from the United States continued in 2018, with the share of the U.S. in Canadian exports falling from 75.9% in 2017 to 75.0% in 2018. Imports also grew for the second consecutive year in 2018, reaching an historic level of $595.9 billion. This was led by energy product imports, primarily refined oil from the United States.
Figure 1: Merchandise Trade by Major Partners, 2018

Data: Statistics Canada
Source: Office of the Chief Economist, Global Affairs Canada
Figure 1 Text Alternative
| Exports | Value ($ Billion) | Share (%) |
|---|---|---|
| United States | 438.3 | 75.0 |
| China | 27.7 | 4.7 |
| United Kingdom | 16.3 | 2.8 |
| Japan | 13.0 | 2.2 |
| Mexico | 8.2 | 1.4 |
| ROW | 80.7 | 13.8 |
| All countries | 584.2 | 100.0 |
| Imports | Value ($ Billion) | Share (%) |
| United States | 304.7 | 51.1 |
| China | 75.6 | 12.7 |
| Mexico | 36.8 | 6.2 |
| Germany | 19.1 | 3.2 |
| Japan | 16.8 | 2.8 |
| ROW | 143.0 | 24.0 |
| All countries | 595.9 | 100.0 |
By commodity, rising average crude oil prices were behind the notable increase in exports of energy products, which accounted for nearly half of the growth in Canada’s merchandise exports in 2018. Other noteworthy growth occurred in machinery, pharmaceuticals, and wood pulp. Conversely, exports of automotive products and precious stones and metals saw large declines. On the import side, energy products led the growth, followed by machinery and electronic equipment.
Exports outperformed imports in 2018, so Canada’s merchandise trade deficit with the world narrowed from $15.2 billion in 2017 to $11.8 billion in 2018. Trade in resource-related commodities such as energy and wood products continued to be the drivers of exports for Canada, while trade in processed goods such as machinery and electronic equipment pulled down the overall trade balance.
Trade Overview
In 2018, merchandise exports increased 6.9% to a record high of $584.2 billion, which was $37.9 billion above the 2017 level. In comparison, merchandise exports grew at a compound annual growth rate of 2.6% from 2014 to 2018. Concurrently, 2018 merchandise imports rose 6.1% or $34.5 billion over the previous year to a record high of $595.9 billion. Between 2014 and 2018, imports recorded a compound annual growth rate of 3.9%.
As both merchandise exports and imports reached record levels, Canada’s total merchandise trade also reached an all-time high of $1,179 billion. Since exports outpaced imports, Canada’s merchandise trade deficit narrowed by $3.4 billion to $11.8 billion in 2018. Looking back at the decade following the Great Recession (2009-2018), Canada posted merchandise trade deficits in most years.
Figure 2: Canadian Merchandise Trade, 2009-2018

Data: Statistics Canada
Source: Office of the Chief Economist, Global Affairs Canada
Figure 2 Text Alternative
| Trade Type | 2009 | 2010 | 2011 | 2012 | 2013 | 2014 | 2015 | 2016 | 2017 | 2018 | 2014-18 (%) | 2009-18 (%) |
|---|---|---|---|---|---|---|---|---|---|---|---|---|
| Exports ($ Billion) | 359.8 | 398.9 | 446.7 | 455.2 | 471.9 | 526.8 | 524.1 | 516.8 | 546.2 | 584.2 | 10.9 | 62.4 |
| Imports ($ Billion) | 365.4 | 403.7 | 446.7 | 462.1 | 475.7 | 512.2 | 536.2 | 533.3 | 561.4 | 595.9 | 16.3 | 63.1 |
| Trade Balance ($ Billion) | -5.6 | -4.8 | 0.0 | -6.9 | -3.7 | 14.6 | -12.1 | -16.5 | -15.2 | -11.8 | - | - |
Trade by Country
Exports
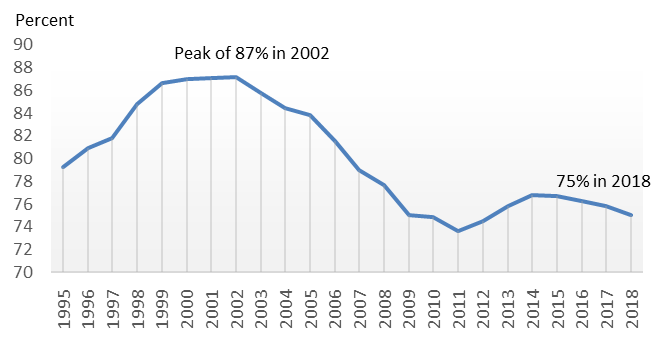
Canada’s merchandise exports to the United States grew for the second consecutive year in 2018, rising 5.8% to a record high of $438.3 billion. However, merchandise exports destined to countries other than the U.S. performed even better, growing at 10.6% to $145.9 billion. As a result, Canada’s exports continued the trend of diversification away from the United States with the U.S. share of Canada’s merchandise exports falling for the fourth consecutive year to 75.0% in 2018 and the non-US countries’ share of Canadian merchandise exports rising to 25.0%.
Figure 3: U.S. Share of Canadian Merchandise Exports, 1995-2018
Data: Statistics Canada
Source: Office of the Chief Economist, Global Affairs Canada
Figure 3 Text Alternative
| Year | U.S. Share of Canadian Exports (%) |
|---|---|
| 1995 | 79.2 |
| 1996 | 80.9 |
| 1997 | 81.8 |
| 1998 | 84.8 |
| 1999 | 86.7 |
| 2000 | 86.9 |
| 2001 | 87.0 |
| 2002 | 87.1 |
| 2003 | 85.7 |
| 2004 | 84.4 |
| 2005 | 83.8 |
| 2006 | 81.6 |
| 2007 | 79.0 |
| 2008 | 77.7 |
| 2009 | 75.1 |
| 2010 | 74.9 |
| 2011 | 73.6 |
| 2012 | 74.5 |
| 2013 | 75.8 |
| 2014 | 76.8 |
| 2015 | 76.7 |
| 2016 | 76.3 |
| 2017 | 75.9 |
| 2018 | 75.0 |
Just like in 2017, exports to the U.S. were driven by the growth of energy product exports in 2018, which increased 15.2% to $115.0 billion. The main component of energy exports, crude oil, accounted for almost the entire increase, growing 20.1%, or $13.9 billion, to $82.9 billion (largely due to a 16.0% increase in average crude oil prices). Consequently, the share of crude oil in total energy exports to the U.S. reached a record high of 72.1%, surpassing the previous high water mark of 70.5% in 2014. Growth of exports of non-energy products to the U.S. rebounded, up 2.8% in 2018 compared to a 1.1% decrease the previous year, led by machinery (+7.8%), pharmaceutical products (+27.1%), plastics (+7.4%), and organic chemicals (+22.4%). On the other hand, the second largest export commodity to the U.S., automotive products (-5.0%), saw the greatest decline, followed by precious stones and metals (-14.9%).
The European Union as a group is Canada’s second largest export market. With the implementation of Comprehensive Economic and Trade Agreement (CETA) as a catalyst, Canadian merchandise exports to EU members rose 7.0% to $44.5 billion in 2018, mainly on higher exports of energy products (+83.9%) and automotive products (+89.3%). Out of Canada’s top European export markets, exports to Germany and the Netherlands recorded double-digit growth of 16.8% and 51.1%, respectively. However, exports to the United Kingdom declined 7.7%, mostly due to a $1.9-billion decline in gold exports.
Growth of exports to top partners in Asia continued in 2018. Rising 17.1% or $4.0 billion, exports destined to China accelerated to the fastest rate since 2012. Last year’s growth was driven by exports of agriculture products (+32.0% or $2.5 billion, mainly oil seeds, cereals, and fats and oils), mineral ores (+35.7%), and wood pulp (+12.9%). Exports to Japan and South Korea also continued to grow in 2018, while those to India moved sideways. Most notably, merchandise exports to Hong Kong recorded the fastest growth by far among Canada’s top trading partners, surging 74.6% or $1.7 billion. This large increase was almost entirely due to the higher exports of gold and energy products (crude oil and coal).
For exports, the top ten export markets were responsible for 90.2% of total Canadian merchandise exports in 2018, down from 90.5% in 2017. Rank-wise, Germany (7th) and the Netherlands (8th) overtook India, which fell to 9th place, and Hong Kong jumped 3 places into the 10th spot. As a result of these changes, Belgium and France slipped out of the top 10 merchandise export markets in 2018.
| Country | Exports ($B, 2018) | Growth from previous year | Change from previous year ($B) | Share 2018 |
|---|---|---|---|---|
| World | 584.2 | 6.9% | 37.9 | 100.0% |
| United States | 438.3 | 5.8% | 23.9 | 75.0% |
| China | 27.7 | 17.1% | 4.0 | 4.7% |
| United Kingdom | 16.3 | -7.7% | -1.4 | 2.8% |
| Japan | 13.0 | 9.5% | 1.1 | 2.2% |
| Mexico | 8.2 | 4.7% | 0.4 | 1.4% |
| South Korea | 5.9 | 10.6% | 0.6 | 1.0% |
| Germany | 4.8 | 16.8% | 0.7 | 0.8% |
| Netherlands | 4.7 | 51.1% | 1.6 | 0.8% |
| India | 4.3 | 0.4% | 0.0 | 0.7% |
| Hong Kong | 3.9 | 74.6% | 1.7 | 0.7% |
| Top 10 | 527.1 | 6.6% | 32.7 | 90.2% |
| All Other Countries | 57.1 | 10.1% | 5.2 | 9.8% |
Imports
Imports from the United States accelerated in 2018, up 5.7% to reach $304.6 billion, although slightly slower than the growth of Canada’s overall imports. Consequently, the U.S. share of Canada’s imports decreased marginally, to 51.1% from 51.4% the year before. More than half of the $16.3 billion increase in imports from the US came from energy products (+34.7% or $8.6 billion, mainly refined and crude oil). Another key part of the increase was due to the 6.4% growth (or $2.6 billion) in machinery imports, mostly bulldozers and turbojets. Other leading import categories were precious stones and metals (+30.7%), plastics (+5.0%), and aircraft and parts (+12.1%). No single commodity import recorded a significant decline in 2018, with the largest being iron and steel (-8.1% or $0.5 billion).
Coming off of double digit growth in 2017, imports from China slowed down in 2018, only rising 6.5% or $4.6 billion to reach $75.6 billion. This expansion was led by electronic equipment (+8.5%) and machinery (+7.0%). Imports from the European Union increased by 10.8% or $7.2 billion on higher imports from Belgium (+40.2%, mainly organic chemicals, automotive products, and pharmaceuticals), Germany (+6.3%, mainly machinery), and France (+16.0%, mainly machinery and aircraft and parts). Of other top import sources, imports from Mexico, South Korea, and Taiwan increased significantly, while those from Japan declined.
In 2018, the top ten source countries were responsible for 82.8% of total Canadian merchandise imports, down from 83.3% in the previous year. In terms of ranking, other than South Korea surpassing the United Kingdom, the top ten source countries remained the same.
| Country | Imports ($B, 2018) | Growth from previous year | Change from previous year ($B) | Share 2018 |
|---|---|---|---|---|
| World | 595.9 | 6.1% | 34.5 | 100.0% |
| United States | 304.7 | 5.7% | 16.3 | 51.1% |
| China | 75.6 | 6.5% | 4.6 | 12.7% |
| Mexico | 36.8 | 3.7% | 1.3 | 6.2% |
| Germany | 19.1 | 6.3% | 1.1 | 3.2% |
| Japan | 16.8 | -3.9% | -0.7 | 2.8% |
| South Korea | 9.5 | 9.9% | 0.9 | 1.6% |
| United Kingdom | 9.2 | 3.4% | 0.3 | 1.5% |
| Italy | 9.0 | 10.4% | 0.8 | 1.5% |
| France | 7.2 | 16.0% | 1.0 | 1.2% |
| Taiwan | 5.9 | 8.1% | 0.4 | 1.0% |
| Top 10 | 493.7 | 5.6% | 26.2 | 82.8% |
| All Other Countries | 102.3 | 8.8% | 8.3 | 17.2% |
Trade by Commodity
Exports
In 2018, energy products fortified its position as Canada’s top export commodity with growth of 17.2%, reaching more than $128.6 billion in exports or 22.0% of overall Canadian merchandise exports. Nearly ninety percent of the growth was due to the 23.6% or $16.5 billion increase in crude oil exports (+6.0% in volume and +16.6% in average price), with the rest from refined oil and coal exports. With growth of exports to countries other than the U.S. being much higher (37.3% vs 15.2% for the U.S.), the share of energy products destined to the U.S. slipped to 89.4%, down 1.5 percentage points compared to that of 2017. In particular, EU members increased their total share by 1.3 percentage points as exports of energy products more than doubled to the Netherlands (crude and refined oil), were up 155.0% to the UK (crude oil and coal), and tripled to Spain (crude oil).
Excluding exports of energy products, Canadian merchandise exports were up 4.4%, much faster than the 0.5% recorded in 2017. Exports of machinery led the way, as they remained the third largest export commodity in 2018 at 7.7% of total Canadian exports. Following 5.7% growth a year earlier, machinery exports were up 6.8% in 2018, led by growth in exports of turbojets (+12.2% or $0.9 billion). Rebounding from a sharp decline in 2017, exports of pharmaceutical products grew 25.5% in 2018 or $2.1 billion on higher exports of antibiotics and medicaments. Other significant contributors to growth were wood pulp (+17.5%), plastics (+8.1%), and fertilizers (+21.1%).
In contrast, exports of automotive products, Canada’s second largest export commodity, saw the largest decline in value, down $2.5 billion or 3.1%. Lower exports of passenger vehicles to the United States were the main source of the decline, which was partially offset by increased exports of trucks and automotive parts. Automotive exports to Mexico increased slightly, while those to China decreased by nearly 15.0% percent (mainly passenger vehicles). Notably, exports of automotive products to the EU were up 89.3%, especially to Germany (+87.6%), Belgium (+317.6%), Italy (+295.7%), and Spain (+255.0%).
| Commodity Type | Exports ($B, 2018) | Growth from previous year | Change from previous year ($B) | Share 2018 |
|---|---|---|---|---|
| All Commodities | 584.2 | 6.9% | 37.9 | 100.0% |
| Energy Products | 128.6 | 17.2% | 18.9 | 22.0% |
| Automotive Products | 78.4 | -3.1% | -2.5 | 13.4% |
| Machinery | 44.7 | 6.8% | 2.8 | 7.7% |
| Precious Stones & Metals | 23.7 | -3.2% | -0.8 | 4.1% |
| Wood | 18.5 | 1.3% | 0.2 | 3.2% |
| Plastics | 17.6 | 8.1% | 1.3 | 3.0% |
| Electronic Equipment | 17.4 | 3.7% | 0.6 | 3.0% |
| Aircraft & Parts | 13.8 | 7.1% | 0.9 | 2.4% |
| Aluminum | 13.0 | 1.8% | 0.2 | 2.2% |
| Paper & Paperboard | 10.4 | 10.9% | 1.0 | 1.8% |
| Top 10 Products | 366.1 | 6.6% | 22.8 | 62.7% |
| All Other Products | 218.1 | 7.5% | 15.2 | 37.3% |
Imports
Top import commodities largely remain unchanged in 2018 from year earlier. Automotive products maintained its position as the top import product by rising 1.4% or $1.4 billion to reach $97.7 billion, led by imports of passenger vehicles (+4.5%, mainly Mexico and Japan) and tractors (26.2%, U.S. and Mexico), while imports of trucks posted a major decline of 11.6% or $2.4 billion (mostly from U.S. and Mexico). Since the growth of automotive imports was sluggish compared to the overall growth in Canadian imports, its share of total Canadian imports declined from 17.2% in 2017 to 16.4% in 2018.
Energy products were the main driver of import growth, advancing 23.5% or $9.1 billion, due to increased imports of refined oil (+37.0%, mainly from United States) and crude oil (+16.7%, mainly from United States and Saudi Arabia). Machinery imports, the second largest import product and the second largest driver of imports, saw a significant increase of 8.5% or $7.0 billion. As a result, its share of total Canadian imports increased by 0.3 percentage points to 15.0%. Growth in this category occurred primarily in imports of turbojets (+21.7%), computers (+8.8%), and bulldozers (22.8%). Imports of electronic equipment had the third largest contribution to growth, up 4.7% or $2.6 billion, mainly due to the $1.2 billion increase in cellphone imports (mostly from China and South Korea). Other top products worth highlighting include: articles of iron and steel (+10.1%), precious stones and metals (-9.8%, mainly gold from Japan), and organic chemicals (+14.5%).
| Commodity Type | Imports ($B, 2018) | Growth from previous year | Change from previous year ($B) | Share 2018 |
|---|---|---|---|---|
| All Commodities | 595.9 | 6.1% | 34.5 | 100.0% |
| Automotive Products | 97.7 | 1.4% | 1.4 | 16.4% |
| Machinery | 89.3 | 8.5% | 7.0 | 15.0% |
| Electronic Equipment | 58.2 | 4.7% | 2.6 | 9.8% |
| Energy Products | 47.7 | 23.5% | 9.1 | 8.0% |
| Plastics | 22.0 | 5.9% | 1.2 | 3.7% |
| Scientific Instruments | 16.3 | 2.2% | 0.4 | 2.7% |
| Pharmaceuticals | 16.2 | 6.6% | 1.0 | 2.7% |
| Articles of Iron & Steel | 14.0 | 10.1% | 1.3 | 2.4% |
| Furniture | 12.1 | 0.7% | 0.1 | 2.0% |
| Precious Stones & Metals | 11.4 | -9.8% | -1.2 | 1.9% |
| Top 10 Products | 385.0 | 6.3% | 22.8 | 64.6% |
| All Other Products | 210.9 | 5.9% | 11.7 | 35.4% |
Trade Balance
As Canada’s exports increased more than imports, the overall merchandise trade deficit narrowed $3.4 billion, from $15.2 billion in 2017 to $11.8 billion in 2018. Canada’s trade balance improved significantly with the United States (+$7.6 billion), Japan (+$1.8 billion), Hong Kong (+$1.7 billion), the Netherlands (+$1.1 billion), and Nigeria (+$0.6 billion). Conversely, trade balances worsened with the United Kingdom (-$1.7 billion), Belgium (-$1.0 billion), and France, Mexico, and India (each down nearly $1.0 billion).
By commodity, Canada continues to exhibit comparative advantage in resource-related categories, as the five largest trade surpluses were all related to resource exports. Specifically, crude oil led all products with a trade surplus of $67.3 billion, which was up $13.8 billion over 2017. On the other hand, four out of five largest trade deficits are in processed goods. These products largely remain the same as in 2017, with the only exception that articles of iron or steel replaced pharmaceutical products as the 5th largest trade deficit in 2018. Worth noting that even though trade balance in passenger vehicles remains positive, its trade surplus was down $8.9 billion to $14.3 billion in 2018.
| Commodity Type | 2018 Exports, $B (growth, %) | Share (%) | 2018 Imports, $B (growth, %) | Share (%) | 2018 Trade Balance, $B |
|---|---|---|---|---|---|
| All Commodities | 584.2 (6.9) | 100.0 | 595.9 (6.1) | 100.0 | -11.8 |
| Energy Products | 128.6 (17.2) | 22.0 | 47.7 (23.5) | 8.0 | 80.9 |
| Wood | 18.5 (1.3) | 3.2 | 4.0 (2.7) | 0.7 | 14.5 |
| Precious Stones & Metals | 23.7 (-3.2) | 4.1 | 11.4 (-9.8) | 1.9 | 12.3 |
| Wood Pulp | 9.7 (17.5) | 1.7 | 0.5 (13.4) | 0.1 | 9.2 |
| Oil Seeds | 9.8 (-4.2) | 1.7 | 1.4 (20.5) | 0.2 | 8.3 |
| Articles of Iron or Steel | 7.1 (9.9) | 1.2 | 14.0 (10.1) | 2.4 | -7.0 |
| Scientific Instruments | 9.1 (5.4) | 1.6 | 16.3 (2.2) | 2.7 | -7.2 |
| Automotive Products | 78.4 (-3.1) | 13.4 | 97.7 (1.4) | 16.4 | -19.3 |
| Electronic Equipment | 17.4 (3.7) | 3.0 | 58.2 (4.7) | 9.8 | -40.8 |
| Machinery | 44.7 (6.8) | 7.7 | 89.3 (8.5) | 15.0 | -44.6 |