Evaluation of the International Business Development Strategy for Clean Technology (2017-2018 to 2020-2021)
Final Report
Diplomacy, Trade and Corporate Evaluation Division (PRE)
Global Affairs Canada
June 3, 2020
Table of contents
Executive Summary
The Business Development Strategy for Clean Technology was funded as part of a broader Strategy to Advance Clean Technology in Canada's Natural Resource Sectors, led by NRCan. It is part of Canada's Clean Growth Hub, which aims to support clean technology in Canada and the growth of Canadian firms and exports in order to capitalize on the economic opportunities of the global transition to a low-carbon, low‑pollution, and resource‑efficient economy. Since launching in 2017‑18, the Strategy has played a role in increasing opportunities for Canadian firms in clean technology and climate finance, supporting discussions on trade and international assistance, and supporting Canada’s climate change objectives on an international scale.
The Strategy provided incremental funding to build upon activities of the Trade Commissioner Service (TCS) Clean Technology Sector and introduced novel approaches to advance efforts in this sector. More specifically, the introduction of Regional Trade Commissioners (RTCs) for Clean Technology and Climate Finance aimed to enhance the expertise of Trade Commissioners (TCs) and advance Canadian firm presence on an international level. These activities also contribute to Canada's role in addressing climate change. The Strategy achieved all of its performance targets to date and has been well received by those who have engaged with it.
Implementation of the Strategy and scaling up the roles of the RTCs took time. The RTCs have augmented the capacity of TCs to support firms engaging in clean tech and climate finance activities. However, the evidence found some gaps in the provision of services by these RTCs to TCs, as well as desire for more training and knowledge on clean technology and climate finance. Raising overall awareness of these positions could support better outcomes.
In addition, there are opportunities to take a more client‑focused approach in providing services. It was found that the needs of women and other under‑represented groups are not fully understood by the Branch. Having more awareness of these needs will allow the Branch to better serve its clients.
Further, the launch of the Climate Finance Business Development Team signaled the increasing role and importance of the private sector in supporting adaptation and mitigation activities to address climate change. Identifying and connecting Canadian firms to climate finance opportunities is a new role for the TCS. A foundation of good results and efforts to raise awareness has been built through the Strategy, though there is continued work to do in increasing the level of knowledge of Trade Commissioners and Canadian firms in order to ensure Canada benefits from these opportunities.
Assessing the performance of TCS activities in supporting climate finance also revealed missed opportunities to leverage synergies between trade and international assistance within Global Affairs. Cross-stream collaboration is limited by differing priorities, funding distribution, and changing trade/aid relationships. Closer examination of this at a Department level could enhance the effectiveness of the Strategy’s efforts moving forward.
Summary of Recommendations
The evaluation identified four recommendations to further ground the Strategy and ensure that it is meeting the needs of clients. In brief:
Improve overall efficiency effectiveness of the Strategy by:
- Clarifying expectations for the Regional Trade Commissioner positions and better communicate their services to the broader TCS network.
- Ensuring that climate finance experience and knowledge is shared across the TCS as part of formal training.
Develop a plan to expand the impact of the Strategy, which could include:
- Leveraging the trade‑development nexus opportunities in climate finance.
- Undertake a comprehensive review of the needs of firms, including women and other underrepresented entrepreneurs.
Further elaboration is identified in the Recommendations section of the report.
Program Background
In Budget 2017, the Government of Canada committed $15 million over four years (including an Employee Benefit Plan), for a Clean Tech Strategy to better support Canadian firms in international business development (IBD) and help them capitalize on growing opportunities in the clean tech sector, including accessing climate finance. The International Business Development Strategy for Clean Tech is delivered through the Trade Commissioner Service (TCS) and is funded until March 2021. The funding provided to Global Affairs Canada under the Strategy is delivered under the umbrella of the Strategy to Advance Clean Technology in Canada's Natural Resource Sectors, a horizontal initiative led by Natural Resources Canada.
The Strategy supports the Canadian clean tech firm exports
Prior to the Strategy, the TCS supported Canadian Clean Tech firms internationally through trade and investment promotion and innovation collaboration services. The Strategy was implemented as a way to further support the highly technical, increasingly competitive, and rapidly expanding clean technology industry.
Canada has many Clean Tech sub‑sector strengths including Renewable Energy, Water and Wastewater and Sustainable Resource Management, particularly in Clean Technology in Mining and Clean Technology in Oil and Gas verticals. Canada's clean technology firms specialize in areas that are in high demand globally.
Climate financing also supports the Global Clean Tech Sector
In addition to traditional export markets for Clean Tech, Canadian firms can compete for climate finance opportunities internationally.
Global Affairs Canada defines climate finance as local, national, or transnational financing for projects and programs that help developing countries mitigate the effects of and adapt to climate change. The financing may be drawn from public, private, and alternative sources. Firms compete with international counterparts for climate financing to carry out these projects.
This competitive environment requires the active support of the Government of Canada (GC) for Canada’s firms internationally, such as that provided by the Strategy.
Key Government of Canada Commitments in Support of Clean Tech and Global Climate Finance
- 2009 Canada pledges $1.2 billion in 'fast-start' climate finance to help developing countries mitigate and adapt to the causes of climate change
- 2014 Canada pledges $300M to the Green Climate Fund
- 2015 Canada adopts the 2030 Agenda for Sustainable Development, announces its participation in Mission Innovation and pledges $2.65 billion to tackle climate change
- 2016 Canada ratifies the Paris Agreement and adopts the Pan-Canadian Framework on Clean Growth and Climate Change
- 2017 Canada commits $15M over four years for the Clean Tech Strategy in Budget 2017
- 2018 The International Business Development Strategy for Clean Technology is announced at Globe 2018
Three Pillars of the International Business Development Strategy
The Strategy was articulated around three key pillars that provide the overall strategic direction for the incremental funding. This section describes each pillar, including the number and location of full time equivalents (FTEs). The performance section of the report is structured in large part around these three pillars.
Pillar 1: Creation of Clean Tech RTC (TC) Positions
In order to increase International Business Development (IBD) support to Canadian firms, the following positions were created as part of the Strategy:
- One (1) Canada‑based FTE located within the Clean Growth Hub in Ottawa to support a single-window approach to streamlined and improved services for clean tech firms seeking federal government support
- Four (4) locally engaged staff (LES) FTEs located in Bogotá, Berlin, Nairobi and Singapore to enhance clean tech resources in their respective regions
The Regional Trade Commissioners (RTCs) act as clean technology regional experts and undertake activities that include: mapping clean technology markets, developing networks of contacts and delivering targeted trade initiatives in partnership with other federal departments and provincial and territorial (P/T) governments.
Pillar 2: Creation of the Climate Finance Business Development Team (CFBDT)
The CCFT was established to help firms access international business opportunities generated by climate finance in developing countries. More specifically, the CFBDT aims at building the capacity of TCs and firms via training, market intelligence, building networks and relationships with multilateral development banks (MDBs), international financial institutions (IFIs), and private investors in order to identify climate finance opportunities for the private sector in and across regions. In order to deliver on these activities, the Strategy provided funding for the establishment of nine new FTEs:
- Four (4) locally engaged staff (LES) FTEs in Washington, Abidjan, London and Manila to act as regional focal points for climate finance, known as RTCs for Climate Finance
- Five (5) Canada‑based FTEs located at HQ that act as the business development knowledge hub for global climate finance
Pillar 3: Domestic Outreach Campaign
One (1) Canada‑based FTE position located at HQ to deliver a domestic outreach campaign to increase firms’ understanding of, and access to the growing number of Government of Canada programs and services available to support IBD opportunities.
Clean Tech Strategy Resources
The funding provided as part of the Strategy represents an incremental increase to the on‑going budget available to the Clean Tech Sector. Figure 1 illustrates the incremental nature of the Strategy and how it supports the broader Clean Tech Sector.
Currently, approximately 132 Trade Commissioners (TCs) located in Canada and at missions abroad work in the Clean Tech Sector of TCS. In addition to O&M, the Sector has access to approximately $500K in Integrative Trade Strategy Fund (ITSF) funding per year on an on-going basis. ITSF contributes to the expansion of Canadian business participation in global markets by funding strategic initiatives, projects, and key events within the scope of the TCS and executed by missions abroad and regional networks in Canada.
A detailed analysis of the planned expenditures stemming from the Strategy shows that year one was an outlier with a total spending of $2.8M. For the following three years, the expenditures were planned to reach approximately $3.65M per year (Figure 2).
The lower level of planned expenditure observed in 2017-18 can be explained by the fact that funding was released later in the fiscal year and that time was required to launch the Strategy and begin implementation (e.g., hire staff, provide training).
The funding provided as part of the Strategy was adequate to meet most of its performance targets. While some O&M funding was reprofiled to support the high demand for ITSF initiatives in support of Clean Tech and Climate Finance, funding has been expended as planned.
Figure 1: Visual representation of the Strategy and its context

Text version
The image depicts two perfectly fitting puzzle pieces that illustrates the incremental funding provided to the Clean Tech sector. One puzzle piece represents the Trade Commissioner Service clean technology sector core funding and the other represents the clean technology strategy funding of a total value of $15M over 4 years.
Clean Tech Sector
- 132 Trade Commissioners
- $500K / annually for ITSF Initiatives
- O&M Resources (Value N/A)
- Funding is on‑going
Clean Tech Strategy
- 15 Additional FTEs, including the new CFBDT
- $15M over 4 years in funding, including an additional $1.4M over the four‑year period in ITSF funding
- Funding ends March 2021
Figure 2: Planned Expenditures by Type and Fiscal Year (2017-18 to 2020-21)

*Note: Does not include funding for Employee Benefit Plan (EBP)
** Note: Does not include on‑going $500K provided to the Clean Tech sector annually
Text version
A bar chart showing Planned Expenditures by Type and Fiscal Year 2017‑18 to 2020‑21 by four categories of funds: Others PWGST/SSC, O&M Others, O&M Integrative Trade Strategy Fund and salaries
- Ratio of expenses from largest to smallest: Salaries, O&M Ot&hers, O&M ITSF, Others (PWGST/SSC)
- The following expenditures are presented in the table:
- 2017-18 ‑ $2,800,101
- 2018-19 ‑ $3,648,213
- 2019-10 ‑ $3,648,173
- 2020-21 ‑ $3,648,178
Evaluation Rationale, Objectives and Scope
The evaluation of the International Business Development (IBD) Strategy for Clean Technology is a Treasury Board Secretariat (TBS) requirement under the original submission and is part of Global Affairs Canada's Five‑Year Departmental Evaluation Plan. The timing for this evaluation is aligned with the renewal of the Strategy for which funding is planned to end in March 2021.
Evaluation Purpose
The purpose of the evaluation is to provide Senior Management with a neutral and evidence‑based assessment of the Strategy's design, implementation and results achieved to date. The evaluation was conducted between June 2019 and April 2020 by the Diplomacy, Trade and Corporate Evaluation (PRE) division. External resources were accessed on an ad hoc basis when specific expertise was required.
Evaluation Scope
The evaluation covers the activities of the Strategy in the period between FY 2017‑18 and FY 2019‑20, including ITSF‑funded initiatives.
In terms of reporting on the client impacts of the Strategy, the scope of the evaluation was broadened to include the activities performed by all resources available to the Clean Tech sector within the B‑branch (i.e., salary of all the Clean Tech Trade Commissioners and on‑going ITSF funding provided to the sector) ‑ i.e., both pieces of the puzzle presented in Figure 1 on page 3.
The evaluation complies with the requirements of TBS Policy on Results (2016) and covers the core evaluation issues of relevance, performance and efficiency.
Evaluation Questions
Relevance
- To what extent is the Strategy meeting the needs of Clean Tech companies?
- How could the strategy help Canadian business women compete more equitably in international markets?
Performance
- How does the Strategy compare to other countries’ strategies to support International Business Development (IBD)?
- Are RTC positions placed in the best markets?
- To what extent do TCs have the required knowledge and training on clean tech and climate finance to perform their duties?
- Is the TCS domestic outreach campaign effective?
- Has there been an increase in the number of Canadian firms accessing IBD opportunities for clean tech and climate finance opportunities?
Efficiency
- Are roles and responsibilities for managing and reporting on Clean Tech and climate finance clear?
- Are current reporting and performance monitoring systems capturing relevant information?
- Are opportunities for cross-stream collaboration between trade and development on climate finance and clean tech being realized?
- Is the Strategy aligned with and leveraging synergies with other trade programs at GAC?
Evaluation Approach and Methodology
In order to maximize the possibility of generating useful, valid and meaningful findings, the evaluation used a mixed methods approach, where both qualitative and quantitative data were collected. Extensive use of triangulation was undertaken as an analytical method, in which data from multiple lines of evidence were examined to help corroborate findings. The methods listed below were deemed to be the most appropriate ones to answer the evaluation questions based on data availability and project imperatives (i.e., timeline and resources available).
Document / Literature Review
A robust document / literature review was undertaken, which included:
- Internal program documents (TRIO2 and Strategia Reports, documents available on the Clean Tech and Climate Finance Sector wikis);
- GC reports and strategies on clean tech and climate finance;
- External reports on clean tech and climate finance;
A forward‑looking analysis and literature review of opportunities, gaps and emerging niche for Canadian leadership in clean technology abroad was conducted by an external consultant.
Review of Administrative / Performance Data
The evaluation relied on various administrative databases (e.g., ITSF initiatives database, Strategia) and performance management systems (i.e., TRIO2) to gather evidence about the Strategy's performance and efficiency.
The Tools, Analysis and Performance Division (BTB) was involved to avoid duplication of effort to leverage existing client survey data and to collect other relevant information.
Data from the MaRS Survey of Pureplay Clean Tech firms was also accessed to inform the evaluation.
Stakeholder interviews
A total of 75 interviews were conducted using semi‑structured guides. While various stakeholder’s groups such as other government departments and industry representatives were consulted, the majority of interviewees were Global Affairs employees from the B‑branch.
The following data show the number of interviewees consulted by type:
- GAC employees: 54
- OGDs: 5
- TC Client Firms: 13
- Industry Associations: 2
- Others: 1
Survey of Trade Commissioners
A targeted group of 212 TCs from the clean tech, infrastructure and agriculture sectors were surveyed with a goal to understand the impact of the RTCs and other elements of the Strategy. A total of 45 TCs fully completed the survey, resulting in a response rate of 21%. The response rate by questions varied.
The evaluation design also proposed a survey to TCS clients, however due to potential survey fatigue by clients and ability to rely on other data for this perspective, the survey was cancelled.
Evaluation Limitation and Mitigation Strategies
Methodological limitations were mitigated, where possible, through the use of multiple lines of evidence and the triangulation of data. This approach was taken in order to establish the reliability and validity of the findings and to ensure that the evaluation’s conclusions and recommendations are based upon neutral and documented evidence. The following five key limitations and mitigation strategies were identified.
1. Limited engagement with TC client firms
Although the evaluation design included a survey to TC clients, it was later cancelled. This was to prevent survey fatigue, as the TCS Client Survey is already a frequent exercise for clients. The timing of the COVID‑19 situation also coincided with some final interviews and may have impacted the participation rates in interviews.
Mitigation Strategy: The evaluation increased the number of interviews with client firms and relied on the TCS Client Satisfaction Survey to gather more in‑depth information about client experience with TCS.
2. Identification of survey population
The fact that clean tech opportunities can also be occurring in other sectors presented challenges in terms of identifying the right survey population of Trade Commissioners.
Mitigation strategy: BBH provided a list of TCs to be surveyed and contacted them ahead of time with a request to complete the survey.
3. Availability of open‑source data about other country strategies
There was limited open source data related to the ways in which like-minded countries support private sectors firms in accessing climate finance business opportunities.
Mitigation strategy: The evaluation relied on the information publically available and the results of a study commissioned by the B‑branch from Carleton University, as well as consultations with Pricewaterhouse Coopers on this topic.
4. Attribution of TRIO2 Successes Solely to the Strategy
Most of the TRIO2 successes and other KPIs used to assess the Strategy's performance are based on the efforts of all Clean Tech trade commissioners. Therefore, the results pulled from the TRIO2 system do not differentiate the work of the 15 FTEs hired as part of the Strategy.
No specific actions were deployed to mitigate this challenge as KPIs for the Strategy were developed to capture all of the efforts of the TC network.
5. Limited assessment of issues related to aid/trade
The assessment of the work performed by the CFFT raised fundamental challenges concerning the broader issues of IBD in developing countries and Global Affairs' ability to capitalize on the aid/trade nexus. While these issues were considered to be critical to Canada’s ability to engage the private sector in addressing Canada’s climate change commitments, the evaluation did not fully examine this topic.
Mitigation strategy: The evaluation's main contribution to this topic was to identify the issues raised by interviewees and to document the impacts and lost opportunities reported.
Findings
Relevance & Characteristics of the Industry
Key Finding 1: Certain characteristics of the Canadian Clean Tech Industry have an influence on the extent to which firms are able to engage in international business development.
The following characteristics identify key features that shape the Canadian context:
1. The Clean Tech industry is a major contributor to the Canadian economy and has a presence in international markets: The documents consulted as part of the evaluation indicate that Clean Tech firms are active in international markets. While the industry has a strong presence in the United States, Europe and to a limited extent, Asia, the documentation suggests that Canada’s rank on the international scale has remained stable since 2005.
2. The industry is primarily composed of SMEs and firms operate in a capital intensive sector: A study commissioned as part of the evaluation indicated that most SMEs continue to report a significant need for access to growth capital. Canadian clean tech firms operate in capital‑intensive sectors where investments in new technologies must often be combined with significant investments in equipment. The theme of poor access to capital in Canada remains consistent year over year. It reflects both low profits associated with the sector as well as balance sheets that are not strong enough to engage in competitive international markets.
3. The technologies developed by Clean Tech firms are ready for commercialization, however demonstration projects are needed: The Clean Tech survey conducted by MaRS provided valuable insight with regard to the level of maturity of the technologies developed by the Canadian industry.
Figure 3 on page 8 indicates the Technological Readiness Level (TRL) of surveyed Canadian Clean Tech firms by sub-sector of the industry. The data indicates that more than 70% of surveyed firms reported to have reached Technology Readiness Levels (TRL) 7, 8 or 9. This means that the technology is ready to be demonstrated in an operational environment.
Firms at a lower TRL level are more likely to require pilot projects. These pilots must demonstrate that the technologies meet the operational requirements and performance targets set by a client or a regulation. Several interviewees stated that demonstrating the capability of the technology is key to securing contracts in domestic or foreign markets.
It should also be noted that even if a project is successfully demonstrated in Canada, some clients want to see a demonstration in their own country prior to making agreements. The need to conduct demonstration projects and to scale up production levels can be costly for small firms, especially if the pilot project needs to take place abroad.
Clean Tech Industry Highlights
- 1300 Canadian “Pureplay” Clean Tech Firms in 2019 (MaRS Data)
- +55,000 Canadians employed in Clean Technology Sector in 2017 (2)
- $17B (CAD) Clean Technology Industry Revenue for 2017 (1)
- $9B (CAD) Clean Technology Exports in 2017 (1)
- 4th Canada’s Ranking on the 2017 Global Clean Technology Innovation Index (out of 40 countries) (3)
- Canada’s market share of key markets: 66.3% of the US, 15.3 % of Europe and 11.8 % of Asia.(5)
- $23T (USD) World Bank estimate of global clean technology opportunities through 2030 based on Paris Agreement commitments (5)
4. Climate Finance is creating unmatched opportunities to address climate change through International Business Development in developing countries for the Clean Tech, Infrastructure and Agriculture sectors: In 2015, Canada alongside 192 other United Nations member states adopted the 2030 Agenda for Sustainable Development. The adoption of the Sustainable Development Goals helped shift the conversation about the role of the private sector in climate adaptation and mitigation, particularly in developing country contexts. In the same year, Canada committed $2.65 billion over 5 years for a range of initiatives and programs to help developing countries tackle climate change. This funding delivers on the commitment that Canada made under the 2015 Paris Agreement to support developing countries' transition to low carbon economies and efforts to adapt to the increasingly severe impacts of climate change. It also supports Canada's commitment made under the 2009 Copenhagen Accord to work with partners to jointly mobilize, from a wide variety of sources, US $100 billion annually by 2020.
These agreements recognize the joint responsibility to address climate change and crucial role of the private sector in providing the technical solutions and part of the funding required to attain climate change objectives. The purpose of the Climate Finance Business Development Team (CFBDT), funded as part of the Strategy, is to raise awareness and provide training to both TCs and private sector firms in order to increase Canada’s private sector participation in global climate finance projects.
Currently, approximately 90% of Canada’s $2.65 billion contribution to climate finance is available through international financial institutions (IFIs), multilateral development banks (MDBs), bilateral and national agencies, private investors and financiers, and non-profits.
Figure 3: Proportion of Clean Tech Companies by Sub-Sectors and Self-Reported Technology Readiness Level (TRL) of Key Products (n=362).

Text version
A chart showing the Proportion of Clean Tech Companies by all Sub-Sectors Self-Reported Technology Readiness Level (TRL) of Key Products (n=362).
- Air, Environment & Remediation, TRL 1‑3 = 8%, TRL 4 = 4%, TRL 5‑6 = 4%, TRL 7 = 36%, TRL 8 = 8%, TRL 9 = 40%
- Biofuels & Bio‑products, TRL 1-3 = 13%, TRL 4 = 9%, TRL 5‑6 = 4%, TRL 7 = 26%, TRL 8 = 17%, TRL 9 = 30%
- Energy Efficiency, TRL 1‑3 = 4%, TRL 4 = 9%, TRL 5‑6 = 15%, TRL 7 = 19%, TRL 8 = 13%, TRL 9 = 41%
- Green Products & Services, TRL 1‑3 = 10%, TRL 4 = 10%, TRL 5‑6 = 10%, TRL 7 = 24%, TRL 8 = 24%, TRL 9 = 24%
- Materials, Manufacturing & Industry, TRL 1‑3 = 4%, TRL 4 = 16%, TRL 5‑6 = 16%, TRL 7 = 32%, TRL 8 = 12%, TRL 9 = 20%
- Monitoring and Analytics, TRL 1‑3 = 5%, TRL 4 = not available TRL 5‑6 = 5%, TRL 7 = 26%, TRL 8 = 26%, TRL 9 = 37%
- Precision Agriculture, Forestry & biodiversity, TRL 1‑3 = 5%, TRL 4 = 5%, TRL 5‑6 = 27%, TRL 7 = 23%, TRL 8 = 14%, TRL 9 = 27%
- Renewable and Non‑Emitting Energy Supply, TRL 1‑3 = 11%, TRL 4 = 11%, TRL 5‑6 = 8%, TRL 7 = 24%, TRL 8 = 13%, TRL 9 = 32%
- Smart Grid and Energy Storage, TRL 1‑3 = not available, TRL 4 = 11%, TRL 5‑6 = 7%, TRL 7 = 18%, TRL 8 = 29%, TRL 9 = 36%
- Transportation, TRL 1‑3 = 12%, TRL 4 = 8%, TRL 5‑6 = 20%, TRL 7 = 28%, TRL 8 = 12%, TRL 9 = 20%
- Waste and Recycling, TRL 1‑3 = 4%, TRL 4 = 4%, TRL 5‑6 = 11%, TRL 7 = 21%, TRL 8 = 14%, TRL 9 = 46%
- Water and Wastewater, TRL 1‑3 = 7%, TRL 4 = 13%, TRL 5‑6 = 7%, TRL 7 = 23%, TRL 8 = 17%, TRL 9 = 33%
The TRL scale was developed by NASA engineers to assess the extent to which a technology developed by contractors has reached the operational maturity and reliability needed before being integrated in the space shuttle program (i.e., the extent to which a technology is “Mission Ready”).
The MaRS data indicates a significant gap between TRL 7 (prototype testing) and 8 (developmental testing to meet operational requirements) in 10 of the 12 subsectors on the left. In the MaRS qualitative data, firms cite the high cost, capacity and time investment required to move from piloting to commercialization, which aligns with evaluation findings.
Relevance – Needs of Clean Tech Firms
Key Finding 2: The services provided by the Clean Tech Sector, including those funded as part of the Strategy, are aligned with the needs of Canadian firms.
This section presents the key needs of the Clean Tech and related industries concerning IBD and discusses the level of alignment between these needs and the services currently offered by the TCS.
Certain needs specific to climate finance are discussed in the performance section of the report, as these were also found to be key barriers to increasing access of Canadian firms to climate finance opportunities.
1. Access to capital to support demonstration projects abroad: As previously discussed, SMEs do not always have the capacity to finance complex IBD activities, especially in high risk markets. One of the key needs identified by interviewees and the document review is the need for public funding to support technology demonstration abroad. While there are funding programs to support domestic pilot projects, demonstration projects at the international level do not benefit from the same support. Although some programs, such as the National Research Council Canada (NRC) Industrial Research Assistance Program (NRC‑IRAP) and Sustainable Development Technology Canada (SDTC) have limited funding available for such projects, a few interviewees noted that the amount available does not match the level of funding required by the industry. However, with respect to alignment, the evidence shows that other federal organizations such as SDTC or NRC-IRAP, rather than the TCS, may be better placed to fund these activities given their technical expertise in technology deployment.
2. Access to market intelligence services: One main rationale for the creation of the RTC positions funded under the Strategy was to provide market intelligence services to Canadian firms (i.e., identification of opportunities and provision of information about the regulatory environment). The evidence shows that Canadian firms need these services and that the TCS services have been successful at addressing this industry need.
However, the evaluation found that certain sub-regions were not fully covered due to a limited capacity across the positions funded under the Strategy. For example, there is limited coverage of the Middle East region given the amount of work required to cover Europe. In addition, Asia was reported to be too vast to be covered by only two RTCs (i.e., one in Clean Tech and one in Climate Finance). In order to address this challenge, the program adopted a proactive approach to the South East Asian markets and a more reactive approach to the Chinese and Indian markets. In other words, firms who sought support in these two markets were served but the RTC was not actively seeking out contacts or market intelligence. This approach could be leading to missed opportunities as both India and China were identified as two high potential markets for Canadian Clean Tech firms. As such, there may be a need to provide increased support to the network of TCs located in China, India and the Middle East and to Canadian firms aiming for these markets.
3. Access to a network of local / regional contacts: Once a firm makes the decision to invest in IBD activities in a specific market, the company needs to have access to local contacts (e.g., private and public buyers and investors, Fund mangers in IFIs). This was found to be particularly important for Climate Finance opportunities as firms need to navigate through a highly complex business environment with a myriad of actors.
The TCS core services and the role of the new RTCs aimed at expanding Canada’s network of contacts across the world, are aligned with the needs of Clean Tech firms.
Relevance ‑ Gender‑based Plus Considerations (Women in Business)
Key Finding 3 – The Strategy does not have an explicit focus on advancing women or other under-represented groups of entrepreneurs in Clean Tech, however opportunities exist to better understand the needs of these groups.
The Strategy did not have an explicit focus on advancing women or other under‑represented groups of entrepreneurs in Clean Tech. It was found that women in Clean Tech face similar barriers as other Science, Technology, Engineering, and Mathematics (STEM) fields, including a lack of mentorship, low resources, limited networking opportunities, and the experience of business discrimination. Moving forward, a better understanding of the diversity of Canadian entrepreneurs in this sector could lead to a more tailored suite of services for the sector or the TCS as a whole. Collaboration with other trade programs that target similar demographics, such as the Business Women in International Trade (BWIT) program, could provide insights that would facilitate more targeted and coordinated activities across the department.
Proportion of women and foreign‑born entrepreneurs in Canada
The MaRS Data Centre survey of pureplay firms found that 94 firms of the 488 respondents included at least one female founder. In total, of the 1059 founders, 10% (108) founders are female. Clean technology sub‑sectors related to green products and services, and materials manufacturing and industry had the highest proportion of firms with at least one female founder (48% and 37%, respectively). In contrast, the lowest proportion of female founders were in the energy efficiency (5%) and renewable / non-emitting energy supply (7%) subsectors, both of which were identified in documentation consulted for the evaluation as key Canadian subsector strengths.
In addition, MaRS data on the number of Canadian-born founders notes that 336 of the 1059 founders (32%) are not Canadian-born. Monitoring and Analytics has the lowest proportion of Canadian-born founders (54%), which implies a high proportion of immigrant founders.
Opportunities exist to better integrate gender considerations
- A more proactive approach could be taken to identify and engage upcoming women entrepreneurs. For example, finalists in the Women in Clean Tech Challenge participate in a three year business development program, with one entrepreneur winning $1M. In the most recent Challenge, only one of the finalists was recorded as a client in TRIO2. Although participants may not yet be export-ready, making these connections early could support later success.
- Understanding the cultural context in export markets is an important element of relationship-building. Women entrepreneurs may face gender‑specific barriers due to cultural or personal factors, such as assumptions about their capacity in business or not being taken seriously, which affect the ways women entrepreneurs are doing business. To support clients, TCs could be equipped with GBA+ training, and diversity and inclusion considerations should be included in market factsheets.
- Climate change has differential impacts on women and girls in developing countries. Specific to climate finance activities, there is an opportunity to better understand the gendered impact of the projects that Canadian business is involved in as a way to communicate Canada's progress in advancing inclusive development. This would also be an opportunity to facilitate collaboration between trade and international assistance groups.
Performance ‑ Integrative Trade Strategy Fund (ITSF) Initiatives
Key Finding 4: The program surpassed ITSF funding targets in three out of the four fiscal years.
The Strategy provided an additional $1.4M over four years in ITSF funding to the Clean Tech sector in order to facilitate face to face IBD activities with clients and to expand the network via participation in key industry events. The additional initiatives funded under the Strategy allowed the RTCs and TCs in the Clean Tech sector to participate in an increased number of international events, trades shows and training opportunities, thus boosting the capacity of the Clean Tech sector to support Canadian firms in their export goals.
ITSF Funding ‑ Key Observations
The evaluation found that all ITSF funding provided under the Strategy was expended. Additional O&M funding was re‑profiled in fiscal year 2017‑18 to ensure that other non-ITSF Strategy funding was used efficiently to support the Clean Tech network’s IBD activities.
The data indicates that the demand for ITSF increased significantly over the period covered by the Strategy, as indicated by the increasing number of ITSF applicants in Figure 4. While the short term target of 147 funded projects in 2017‑18 was not met, this can be explained in part due to the implementation time lag between approval of the Strategy and when funds were released.
ITSF applications increased from 96 in 2017‑18 to 252 in 2020‑21. In order to meet the increasing demand, the Clean Tech sector reduced the amount of funding for each ITSF initiative and encouraged posts to leverage other sources of funding from partners, including other government departments and provinces who are also part of the broader Clean Growth Hub.
This indicates that although the Sector was successful at disbursing the additional $1.4M in ITSF funding, the Clean Tech ITSF is now oversubscribed. As such, there remains unfunded demand to support Canadian Clean Tech firms’ IBD activities.
Figure 4: Total Number of ITSF Applications and Funded Projects (2017‑18 to 2020‑21)

Text version
A double bar chart showing the total number of ITSF applications and funded projects by fiscal years 2017‑18 to 2020‑21.
- The chart shows that the performance target of 147 funded projects by fiscal year 2017‑18 was not met, but was met and exceeded in all subsequent fiscal years.
- The following data are presented for each fiscal year:
- 2017-18 ‑ 55 funded projects / 96 funding applications
- 2018-19 ‑ 154 funded projects / 134 funding applications
- 2019-20 ‑ 155 funded projects / 171 funding applications
- 2020-21 ‑ 156 funded projects / 252 funding applications
Performance ‑ Training Provided as Part of the Strategy
Key Finding 5: Current training activities are not providing trade commissioners with an adequate level of knowledge to perform their duties.
The Clean Tech Sector and the CFBDT are knowledge hubs for the TCS on clean tech and climate finance. Internal websites provide extensive information, including market intelligence and recent success stories, and the RTCs for clean tech and climate finance provide ad hoc training as part of their duties. However, there is a greater need for more formal training, particularly in climate finance which requires knowledge of IFIs and project proposals that are unique to this sector.
BBH staff and trade commissioners interviewed did not feel that they had sufficient training on clean tech or climate finance to perform their duties. This aligns with survey findings, which reveal that only 62% of TCs agree that they have received useful training on clean tech, with results dropping to only 29% for climate finance. Lower results for climate finance may be explained in part by the fact that these activities were new for the TCS and training up efforts took time to establish.
Interviewees noted a need for technical training on clean tech and more knowledge on the process of climate finance proposals in order to better deliver on their objectives. Although some workshops and webinars have been provided, interviewees noted that most training was "on the job" and focused on social learning (wikis, LinkedIn and other social networks), and market intelligence.
While there is interest in more training, the role of the TC, as well as frequent staffing changes, leaves little time to develop the technical knowledge required in clean tech and climate finance. A more organized training plan was suggested in order to help TCs in determining what professional learning is required. Given the information overload and workload constraints noted by some interviewees, consideration needs to be given to the way in which information is presented and training delivered. For example, differentiating between primary and secondary training, considering the delivery format (i.e. webinars that can be accessed any time rather than time‑bound sessions) and determining appropriate frequency.
Branch support for more professional development in technical areas would demonstrate acknowledgement of the complexity of the sector, particularly climate finance, and better equip TCs to support clients in these sectors.
Market intelligence has high value
Survey respondents were largely in agreement (91%) that they knew where to access information. However, qualitative survey responses and interviewees noted interest in more market and sector-specific information, including success stories to share with clients. This suggests that while TCs know where to access information, it may not always be most relevant or beneficial to perform their duties.
Figure 5: 91% of TCs know where to access clean tech and climate finance information to perform their duties

Text version
A bar chart showing that 91% of TCs agreed or strongly agreed that they know where to access clean tech and climate finance information to perform their duties and 9% disagreed or strongly disagreed.
Figure 6: 73% of TCs find the information on the wiki useful for finding information

Text version
A bar chart showing that 73% of Trade Commissioners found that the information on the wiki to be extremely useful or useful for finding information.
Figure 7: More TCs report receiving useful training to perform duties in clean tech rather than in climate finance

Text version
A bar chart showing that Trade Commissioners reported receiving more useful training on clean technology than climate finance.
- Trade Commissioners that agreed or strongly agreed that they received useful training on clean technology, 62%
- Trade Commissioners that agreed or strongly agreed that they received useful training on climate finance, 29%
- Trade Commissioners that disagreed or strongly disagreed that they received useful training on clean technology, 36%
- Trade Commissioners that disagreed or strongly disagreed that they received useful training on climate finance, 51%
- Trade Commissioners that don’t know/not applicable if they received useful training on clean technology, 2%
- Trade Commissioners that don’t know/not applicable if they received useful training on climate finance, 20%
Performance ‑ Achievement of Expected Outcomes (Clean Tech Sector)
Key Finding 6: The number of Canadian clean technology firms accessing international business development opportunities facilitated by the TCS increased.
The number of Canadian Clean Tech firms that received TCS services slightly surpassed the Strategy’s Treasury Board submission medium‑term target of 1246 firms by FY 2019‑20 (Figure 8)*. As such, the number of TCS international business development services provided to Canadian Clean Tech firms has been increasing.
More specifically, qualified contacts and market potential assessments were cited as key needs for Canadian firms and data indicates that the Sector has been increasing provision of these services. Qualified contacts increased 56% and market potential assessments increased 47% over the 5 year period reviewed (Figure 9).
In addition, there has been a rapid increase in Opportunities Pursed (OP) and a steady increase in Economic Outcomes Facilitated (EOF) over the 5 FYs reviewed. While not solely attributable to the Strategy, the increase in IBD services delivered and the increase in Clean Tech sector successes correlate with the implementation of the Strategy.
KPI Definitions:
Services: Provision of detailed information to a TCS client as per the four service areas (preparation for international markets, market potential assessment, qualified contacts, problem solving) or an additional service.
Successes: Include both opportunities pursued (OP), which are business leads that may purchase Canadian products or services or may forge strategic alliances, as well as economic outcomes facilitated (EOF), which are a measurable result that contributes to economic prosperity.
Figure 8: Number of unique Canadian Clean Tech firms that received TCS Services as of March 2020

Text version
A bar chart showing the number of Canadian clean technology firms that received Trade Commissioner Services as of March 06th 2020, the performance target 1246 firms by fiscal year 2019-20 was met.
- Fiscal year 2015‑16, 1038 firms
- Fiscal year 2019‑20, 1281 firms
Figure 9: Number of services delivered, by fiscal year as of March 6 2020

Text version
A stacked bar chart that shows the number of services delivered by Clean Tech Trade Commissioners type of services, including qualified contacts, market potential assessments, Prep for international markets, additional services, and problem solving by fiscal year as of March 6th 2020. The figure shows a steady increase for the period between fiscal year 2015‑16 and fiscal year 2019‑20. Only specific data for qualified contacts and market potential assessments are provided.
- Fiscal year 2015‑16, 3231 qualified contacts, 1727 market potential assessments
- Fiscal year 2019‑20, 5782 qualified contacts, 3708 market potential assessments
Figure 10: Number of OPs & EOFs, by fiscal year as of March 6 2020

Text version
A stacked bar graph showing the number of Opportunities Pursued and Economic Outcomes Facilitated, by fiscal year between fiscal year 2015‑16 and fiscal year 2019‑20 as of March 6 2020.
- Fiscal year 2015‑16, 69 opportunities pursued, 33 economic outcomes facilitated
- Fiscal year 2016‑17, 91 opportunities pursued, 26 economic outcomes facilitated
- Fiscal year 2017‑18, 120 opportunities pursued, 47 economic outcomes facilitated
- Fiscal year 2018‑19, 173 opportunities pursued, 73 economic outcomes facilitated
- Fiscal year 2019‑20, 167 opportunities pursued, 37 economic outcomes facilitated
* It should be noted that entries are often finished at the end of the fiscal year; access to systems due to the impact of COVID‑19 may have impacted the ability of TCs to enter final data.
Performance ‑ Climate Finance Opportunities
Key Finding 7: Climate finance is an increasing source of funding opportunities for Canadian firms in the Clean Tech, Infrastructure and Agriculture sectors.
There is recognition that climate finance is increasing globally, which is creating significant business opportunity. The Strategy dedicated resources, including the CFFT, to support efforts to increase access to climate finance by Canadian firms.
Global increase in climate finance
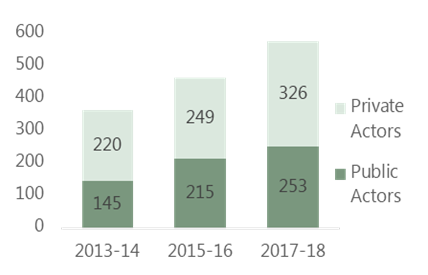
Global climate finance is increasing in scale in response to international commitments that reflect an urgency toward mitigation of and adaptation to climate change. The 2019 Global Landscape of Climate Finance, released by the Climate Policy Initiative, reports that annual tracked climate finance crossed the USD half‑trillion mark in 2017 and 2018, as noted in Figure 8. Average public climate finance in 2017‑18 represented 44% of total commitments, meaning that the majority of commitments were by private finance (56%).
The TCS connects Canadian firms to climate finance opportunities in the private sector channel
The private sector channel involves unsolicited proposals. The role of the Climate Finance TCs is to identify opportunities that may match Canadian capacity. For example, the firm would approach an IFI or private funders with a project, which they may choose to invest in as a co‑investor to receive climate finance funding. TCS helps to navigate the breadth of opportunities and the process to present a project proposal.
Figure 11: Total global climate flows, 2013‑18

Text version
A line graph showing the total global climate flows from 2013 to 2018.
- 2013 ‑ $342 Billion
- 2014 ‑ $388 Billion
- 2015 ‑ $472 Billion
- 2016 ‑ $455 Billion
- 2017 ‑ $612 Billion
- 2018 ‑ $546 Billion
Figure 12: Distribution of private and public involvement in climate finance, 2013‑18
Text version
A stacked bar chart showing the distribution of private and public involvement in climate finance from 2013 to 2018.
- 2013‑14, private actors 220, public actors 145
- 2015‑16, private actors 249, public actors 215
- 2017‑18, private actors 326, public actors 253
Climate finance supports mitigation and adaptation actions that address climate change
Adaptation refers to adjustments in systems in response to actual or expected climatic stimuli or their effects, which moderates harm or exploits beneficial opportunities.
Mitigation refers to interventions that reduce the source or enhance the sinks of greenhouse gases, such as using fossil fuels more efficiently or switching to wind power.
Canadian firms can access opportunities through either public or private sector channels
The public sector channel refers to the securing of a contract through a public procurement process for an initiative that is made possible through climate‑dedicated or climate‑relevant finance.
The private sector channel entails securing financing, through a grant, debt, equity or guarantee, for a climate‑related project from an IFI or other intermediary such as a private funder.
The Strategy focuses primarily on the private sector channel. While Regional Climate Finance TCs can bring public sector channel projects to the attention of Canadian firms, the primary focus of the CFBDT is to provide access to the private sector channel opportunities.
Performance ‑ Achievement of Expected Outcomes (CFBDT)
Key Finding 8: There has been an increase in the number of Canadian firms accessing global climate finance opportunities in developing countries.
The program significantly surpassed mid-term climate finance targets identified in the initial Treasury Board submission, despite information from interviews that the market for climate finance in Canada is small.
Strong results indicate that the CFBDT is achieving intended objectives as the awareness of climate finance by Canadian firms has increased through activities under the Strategy. The program surpassed its target of providing 130 services/year by 2018‑19, recording 243 services to 183 unique firms in 2018‑19 alone. The highest proportion of services provided to TCS clients fall under the qualified contacts category, demonstrating the role of the TCS in facilitating business relationships.
Interviewees noted that the personal element required to build sustainable business relationships in developing countries requires significant time and effort from RTCs and Trade Commissioners. This suggests that a lack of presence in certain markets may limit opportunities for Canadian businesses to receive information and support.
The majority of services provided were attributed to the 4 RTCs for Climate Finance, which is a reasonable expectation given that climate finance activities are relatively new to the TCS. To ensure sustainability over time and to capitalize on the significant opportunities in climate finance, it is expected that awareness‑raising activities of the RTCs will lead to more services provided by all TCs in the future.
In addition, the Strategy surpassed its target of achieving 10 successes/year by 2018‑19, recording 22 in 2018‑19 alone.
Overall, 70% of the 40 successes records in the reference period were for the Infrastructure and Building Services sector (15) and the Clean Technology sector (13). The top five target countries account for 68% of the successes and include: Jamaica (8), Mozambique (6), Belize (5), Cote d'Ivoire (4) and Madagascar (4).
Although there was a decline in the overall successes in 2019‑20, Economic Outcome Facilitated (EOF) have increased. EOFs have occurred primarily in infrastructure (4), clean tech (1) and professional services (1). This might be a reflection of the longer project development timeframe in climate finance.
Figure 13: Number of services provided by fiscal year*, climate finance
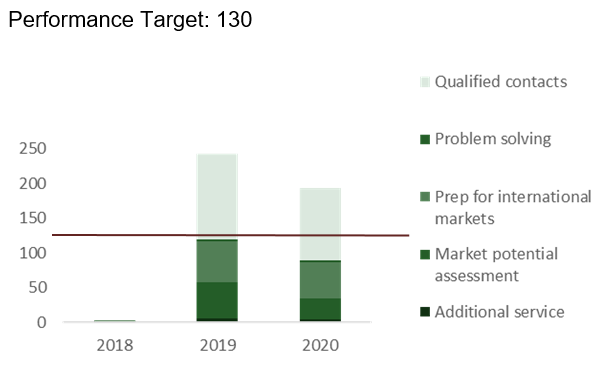
* Note: Data for 2019‑20 includes entries up to March 13, 2020. The fiscal year ends March 31, 2020.
Text version
A stacked bar chart that shows the number of services delivered by Climate Finance Trade Commissioners by type of services, including qualified contacts, market potential assessments, Prep for international markets, additional services, and problem solving by fiscal year as of March 6th 2020. Only three years of data are provided. A performance target of 130 was not met in 2018‑19.
- 2018
- Qualified contacts = 0
- Problem solving = 0
- Prep for international markets = 2
- Market potential assessment = 1
- Additional service = 0
- 2019
- Qualified contacts = 124
- Problem solving = 3
- Prep for international markets = 58
- Market potential assessment = 53
- Additional service = 5
- 2020
- Qualified contacts = 105
- Problem solving = 2
- Prep for international markets = 52
- Market potential assessment = 31
- Additional service = 4
Figure 14: Number successes by fiscal year*, climate finance

Text version
A stacked bar graph showing the number of climate finance Partnerships Pursued, Opportunities Pursued and Economic Outcomes Facilitated, by fiscal years 2018 to 2020. The performance target of 10 was not met in 2018, but was met and exceeded in 2019 and 2020. The total results for each fiscal year is the following:
- 2018
- Partnerships Pursued = 0
- Opportunities pursued = 4
- Economic Outcomes Facilitated = 0
- 2019
- Partnerships Pursued = 0
- Opportunities pursued = 21
- Economic Outcomes Facilitated = 1
- 2020
- Partnerships Pursued = 1
- Opportunities pursued = 8
- Economic Outcomes Facilitated = 5
Performance ‑ Factors Affecting Achievement of CFBDT Results
Key Finding 9: Canadian firms that compete for climate finance face a number of barriers, some of which are beyond the mandate of the Strategy. The broader suite of support provided to firms in like‑minded countries may put Canadian firms at a competitive disadvantage in comparison.
Approaches of Other Countries
Although other countries have different legislative and policy frameworks which limit comparability, some lessons may be offered in the following approaches:
Alternative funding mechanisms such as the Dutch Good Growth Fund, an ODA‑compliant fund which mitigates risks and encourages investment by financing Dutch SMEs operating in developing and emerging markets where risks are perceived as high.
Integrated, holistic policy ecosystems as in the UK where climate funding is funneled through six departments, which signals that it is prioritized across government. In Germany, the comprehensive policy frameworks and supporting programs facilitate private sector involvement in aid and climate finance initiatives.
Consortiums and clusters of smaller firms, such as the EU Cluster Collaboration Platform where EU SMEs come together through clusters based on regions or complementary business elements to form larger partnerships that compete for public contracts, including an EU funded program, the Strategic Cluster Partnership for Going International.
Findings from all lines of evidence identified the following barriers for firms seeking access to climate finance opportunities*.
Complexity of climate finance
Climate finance is a different way of doing business. Many of the barriers noted by external interviewees reflect the uncertainty of the climate finance space, such as how finance is accessed or how to partner with others. Particularly with respect to unsolicited proposals in MDBs and IFIs, transaction costs and opaque processes create disincentives to participation.
Some interviewees also noted the general risk aversion of operating in unfamiliar regions that are developing or conflict-prone. The viability of the investment is unclear at the outset. The long project timelines in development may also dissuade firms that do not have experience with climate finance. Much of the issues noted about complexity signal the need for the guidance and awareness-raising provided by the CFBDT.
Lack of innovative funding solutions
Canada does not have funding structures that comprehensively meet the needs of firms seeking climate finance.
However, Canada does not have a mechanism to support feasibility studies or technical assistance, which creates a cost barrier to entry for firms.
Select interviewees also noted that this type of support is provided by other countries to their firms, which helps to de‑risk a firm’s participation in complex projects in developing countries. Although some countries use Official Development Assistance (ODA) funds for such purpose, Canada’s reticence to do so reflects what some interviewees regarded as a rigid interpretation and application of ODA principles that other like‑minded countries do not always share.
Limited access to local market intelligence and local partners
The importance of personal relationships in developing and conflict prone states was highlighted many times throughout the evaluation. Some internal interviewees noted that Canadian firms are not accustomed to putting in the extra effort to build these relationships in export markets as they do not lead to fast return on investments. Within the TCS, there is also a need for the broader network of TCs to be adequately trained to identify and build strategic relationships with key local stakeholders in order to obtain market intelligence.
*Note: This is not a comprehensive list of barriers but rather the most relevant and noted across all lines of evidence.
Performance ‑ Factors Affecting Achievement of CFBDT Results, continued
Key Finding 10: Despite the existence of certain barriers and challengers, the increasing climate finance opportunities realized in the first three years of the Strategy have laid a strong foundation for the Sector to pursue further development in this area.
TCS Client Survey Results
The most recent TCS Client Survey results for 2018‑19 show that clients reported higher satisfaction with areas that are particularly important for climate finance, like developing networks. External interviewees noted the added value of a “warm introduction” by a TC as leading to better outcomes than a cold call. However, lower results were found in avoiding delays and accessing intelligence, which suggests barriers in the process of doing business that remain to be addressed.
Figure 15: Results of TCS Client Survey, climate finance (CF) clients and overall TCS clients

Text version
A table showing the results of the TCS Client Survey, Climate Finance clients and overall TCS clients in the area of impact on clients’ short term outcomes. The results for each impact is presented below:
- Provided confidence to explore or expand operation, climate finance 92%, overall TCS clients 83%
- Identify new opportunities, climate finance clients 91%, overall TCS clients 70%
- Improve profile in foreign markets, climate finance clients 83%, overall TCS clients 80%
- Avoid delays and costly mistakes, climate finance clients 60%, overall TCS clients 72%
- Overcome barriers to overseas business, climate finance clients 64%, overall TCS clients 69%
- Overcome barriers to overseas business, climate finance clients 64%, overall TCS clients 69%
The survey to TCs reveals that there is much work to be done in enhancing the capacity of Canadian firms to capitalize on global climate finance opportunities and addressing barriers to climate finance.
Figure 16: Only 16% of TCS respondents agree that Canadian firms have the knowledge to capitalize on climate finance opportunities (n=45)

Text version
A bar chart showing that only 16% of TCS respondents agree that Canadian firms have the knowledge to capitalize on climate finance opportunities.
- Disagree or strongly disagree, 40%
- Don’t know or not applicable, 44%
Figure 17: Only 35% of TCs think that the TCS is addressing barriers to climate finance (n=51)

Text version
A bar chart showing that only 35% of Trade Commissioners think that the TCS is addressing barriers to climate finance.
- Very little or not at all, 25%
- Don’t know or not applicable, 39%
Some interviewees noted that although there is a lot of climate finance internationally, not all of this is suitable for Canadian firms. The capacity to compete internationally may be limited and requires time and support to grow. Much of this industry growth may be out of the purview of the Strategy (i.e. requires education and supports to enter these fields), however the TCS can continue to support its TCs in enhancing their capacity to better meet needs of clients, mitigate barriers, and access opportunities.
Currently, climate finance guidance for TCs is found only within the guidance for clean technology and RTCs for Climate Finance develop personal annual regional action plans for initiatives to be carried out. Raising the profile of climate finance among TCs such as developing specific guidance and longer term strategies for regional areas may lead to better results.
Risk of non‑renewal of the Strategy
The program has made significant progress in increasing the opportunities for Canadian firms to access climate finance. While there are opportunities for improvement, more TCs are aware of climate finance, have started to develop local contacts necessary for business, and are navigating the plethora of development banks and funding options. More broadly, activities by the CFBDT, as well as the Clean Growth Hub, are driving and contributing to policy discussions about trade and international assistance collaboration, Canada’s efforts to address climate change, and whole‑of‑government collaboration. There is a risk that without this Strategy, international growth for Canadian firms would be limited and Canadian capacity would not be sufficiently utilized.
Performance ‑ Firm Awareness of Opportunities
Key Finding 11: Domestic outreach activities conducted as part of the Strategy have increased Canadian firms’ awareness of international business development support programs and services.
BBH, in collaboration with the Regional Office Network, has held a series of workshops across Canada since 2018. These workshops include guest speakers, training sessions, business development, and other activities that facilitate networking and support increased knowledge of clean technology. Interviewees noted one concern in the extent to which firms had the knowledge to capitalize on clean tech and climate finance, which reinforces the importance of awareness raising campaigns. The most recent figures from 2019‑20 indicate that 235 Canadian firms attended these sessions in FY 2019‑20 and 93% of those export ready firms accessed TCS IBD services as a result, greatly exceeding the targets set out in the Strategy’s Treasury Board Submission.
Since 2017‑18, domestic outreach efforts have resulted in:
- 11 Clean Technology Global Workshops held across Canada
- Attendance by over 450 firms
- 590+ Business to Business and Business to Government meetings facilitated
- 98% of firms agree that the workshops improved their knowledge of government export programs and services
- 89% of export‑ready firms are using IBD programs or services as a result of workshop attendance
- 15 additional climate finance focused workshops
Figure 18: Clean Tech domestic outreach workshops

Text version
A map of Canada showing locations and dates for clean tech domestic outreach workshops
- Vancouver, March 14 2018 and February 7 2020
- Calgary, November 6 2019 and June 11 2019
- Toronto, November 5 2018, March 6 and October 22 2019 and January 16 2020
- Montreal, May 25 2018 and November 6 2019
- St John’s, May 14 2018
Delivery of the Clean Tech Global Campaign is a coordinated effort across government
The objective of the Cleantech Global workshops is to inform and educate export‑ready Canadian clean technology firms of the wide array of the Government of Canada programs and services available to increase their export opportunities and capitalize on the growing global market opportunities.
BBH works in collaboration with the Canadian Regional Network of Trade Commissioners, and in partnership with other federal departments and agencies (including Export Development Canada, Innovation, Science and Economic Development Canada, and Natural Resources Canada, among many others), as well as provincial and territorial governments, to promote IBD support programs and services.
Interdepartmental and intergovernmental coordination is also facilitated by the Clean Growth Hub, the whole‑of‑government focal point for clean technology focused on supporting firms and projects, coordinating programs and tracking results.
31% of the TCs surveyed believe that Canadian firms have the required knowledge and guidance to capitalize on government programs and services for IBD for clean tech.
Efficiency and Effectiveness ‑ Roles and Responsibilities
Key Finding 12 ‑ Over time, awareness of the roles and responsibilities for the Climate Finance and Clean Technology RTCs has improved, although climate finance could be better understood throughout the TCS network.
The introduction of the new RTCs for clean technology and climate finance naturally led to a period of adjustment as TCs were informed of how this role is meant to augment their capacity. The evidence indicates that strong effort was made to communicate the role of the RTCs to the TCS network by the Branch at headquarters.
Different understanding of roles persists between climate finance and clean technology
The survey results reveal that 75% of survey respondents reported to understand the roles and responsibilities of the RTCs in their regions. However, responses diverged significantly when asked about the roles and responsibilities for managing and reporting on climate finance and clean technology, revealing a lack of clarity around climate finance generally, as illustrated by figures 15 and 16.
This may be in part due to some staffing turnover that occurred for Climate Finance TCs at headquarters, as well as the fact that climate finance requires a different way of doing business. The effort of the Branch to raise the profile of climate finance in general has been ongoing since the implementation of the Strategy. A few interviewees also noted that more could be done by the Branch to clarify expectations and communicate how the positions strategically fit within the broader TCS network. For example, questions were raised as to whether the performance of the RTCs should be captured differently than the standard KPIs for TCs. Additionally, a few internal interviewees noted that the implementation of the role has been different across regions leading to different outcomes. This may indicate that more standardization of the position is required (unless a high degree of flexibility is needed), including clarity of expectations from headquarters.
RTCs are well located for their role
Interviewees generally agreed that the RTCs are located in the best markets. The location of the climate finance RTCs was based on proximity to IFIs, which is important to access intelligence and maintain networks. The RTCs for clean tech were located in areas that were strategic in terms of travel and access to missions. Interviewees noted that some areas were too large for one person to cover, which came at the expense of other markets in the region. In addition, certain regions require a different allocation of resources. It was noted that Africa and Latin America could benefit from more climate finance capacity, and that limited clean tech capacity prevents sufficient coverage of the Middle East. Resourcing factors and capacity issues, rather than performance appear to be an explanation as to why 35% of survey respondents (n=43) did not think they received timely market intelligence on opportunities in their region from their RTC.
TCs were asked to what extent they agreed or disagreed that roles and responsibilities are clear for managing and reporting on climate finance and clean technology...
Figure 19: At my Mission (n=44)

Text version
A bar chart showing survey results where Trade Commissioners were asked to what extent they agreed or disagreed that roles and responsibilities are clear for managing and reporting on climate finance and clean technology at their Mission (n=44).
- Agree or strongly agree, clean technology 96%, climate finance 38%
- Disagree or strongly disagree, clean technology 4%, climate finance 24%
- Don’t know or not applicable, clean technology 0%, climate finance 38%
Figure 20: Between Mission and HQ (n=44)

Text version
A bar chart showing survey results where Trade Commissioners were asked to what extent they agreed or disagreed that roles and responsibilities are clear for managing and reporting on climate finance and clean technology between Mission and HQ (n=44).
- Agree or strongly agree, clean technology 80%, climate finance 36%
- Disagree or strongly disagree, clean technology 13%, climate finance 24%
- Don’t know or not applicable, clean technology 7%, climate finance 40%
Effectiveness ‑ Contribution of the Regional Trade Commissioners to the Enhancement of the Clean Tech Sector Capabilities
Key Finding 13: The Regional Trade Commissioners (RTCs) have contributed to enhancing and strengthening the capabilities of the Clean Tech Sector trade commissioners, although there are some opportunities to improve support.
The evidence shows that the RTCs’ positions have contributed to enhancing and strengthening the capabilities of the Clean Tech sector TCs, which in turn helps them to increase the level and quality of services they provide to TCS clients.
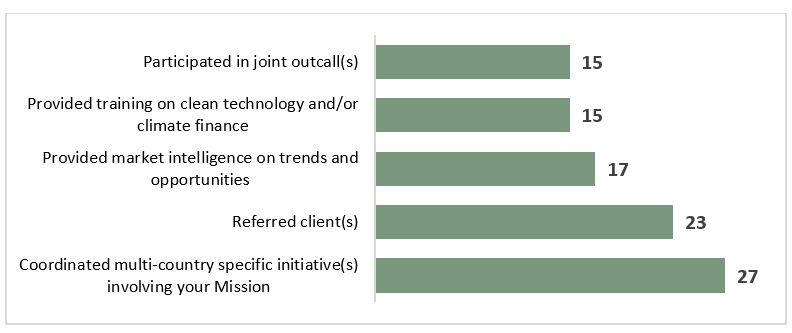
Figure 13 demonstrates that the services RTCs provided to TCs aligns with what was envisioned in the Strategy’s foundational documents. This figure also indicates that the RTCs play a pivotal role in strengthening the overall TCS network by coordinating multi‑country initiatives. They have also increased the ability of the Clean Tech sector to engage directly with firms looking for international business development opportunities through client referrals.
The survey data also revealed that 74% of TCs who reported accessing services from RTCs, have used more than one service since the Strategy was implemented. This suggests that the RTCs are providing a range of services to support different initiatives and that TCs are returning to them for additional supports.
One of the key observations of this analysis is the contrast between the level of service provided by the Clean Tech RTCs and the Climate Finance RTC, as illustrated in Figure 14. This may be explained in part because survey respondents spend less time working on climate finance (80% spend less than 10% of their time on climate finance), as well as the fact that the CFBDT was a new initiative in the TCS when the Strategy was launched.
The Clean Tech sector was already a defined and active sector within the TCS and the role of the Clean Tech RTC was to become a focal point of the Strategy moving forward. In contrast, the CFBDT had to be built up while providing services at the same time. Several months were required to staff the positions, explain their role to the broader network of TCs, build capacity and knowledge of climate finance, and develop their local network with IFIs. Many interviewees indicated that this affected the performance of the TCS.
71% of the TCs surveyed reported to have received adequate support and guidance from the RTC.
Figure 21: Type of services provided by the eight RTCs to the TCS network, as reported by survey participants (n=45)
Text version
A bar chart showing types of services provided by the eight Regional Trade Commissioners to the TCS network as reported by number of survey participants responding in the affirmative (n=45).
- Participated in joint outcall(s) = 15
- Provided training on clean technology and or climate finance = 15
- Provided market intelligence on trends and opportunities = 17
- Referred client(s) = 23
- Coordinated multi-country specific initiative(s) involving your Mission = 27

Text version
Number of survey participants who reported to have accessed the services of Regional Trade Commissioners for Clean Tech and Climate Finance.
- Yes, clean tech 78%, climate finance 43%
- No, clean tech 16%, climate finance 29%
- Don’t know or not applicable, clean tech 6%, climate finance 28%
Efficiency and Effectiveness ‑ Reporting Systems
Key Finding 14: Additional functionalities in reporting systems could provide better information for decision‑making related to clean technology and climate finance.
TRIO2 is the client management system used by the TCS to track key performance indicators (KPIs) related to activities conducted by TCs and services provided to clients. For example, activities include interactions such as participating in events, strategic outcalls with local contacts for information, facilitating opportunities for Canadian clients. In addition, it also acts as a primary tool to assess the performance of trade commissioners.
The TRIO2 system is more effective at capturing clean technology activities
As illustrated in Figure 17, survey respondents generally think that TRIO2 is more adequate in capturing information related to clean technology rather than climate finance.
As climate finance was not an area of focus for the TCS prior to the Strategy, significant work was done by the Branch, as well as the TCS Tools, Analysis and Performance Division, to establish KPIs and ensure results were being captured in TRIO2. Currently, TCs must manually enter a case number for each climate finance entry.
Although the case number requirement is well advertised on communications products and training materials, and featured prominently on the climate finance Wiki page, climate finance services and successes are frequently tagged under other sectors requiring a time intensive process of retagging under climate finance in TRIO2.
It was also noted that measuring success for climate finance was challenging, as results take longer to realize than other sectors.
Proposed solutions emphasize more granularity
Accuracy of information, as well as sufficient granularity, is extremely important to inform decision making and develop strategies that will lead to more targeted activities and improved outcomes.
Proposed TRIO2 improvements primarily emphasized the need to disaggregate the sectors better. For example, allowing double-tagging of sectors and/or a tracking mechanism for firms that operate partially, but not entirely, in the clean technology sector.
Figure 23: TC perception of the adequacy of TRIO2 for capturing relevant information

Text version
A bar chart showing Trade Commissioner perception of the adequacy for capturing relevant information in GAC reporting systems.
- Strongly agree and agree, climate finance 18%, clean tech 69%
- Disagree and strongly disagree, climate finance 22%, clean tech 22%
- Don’t know and not applicable, climate finance 60%, clean tech 9%
Current performance monitoring systems do not accurately capture all activities conducted by the RTCs
As mentioned in the section under Roles and Responsibilities, the work of an RTC is not quite the same as a traditional TC. Interviewees noted that defining and understanding the value added of these roles may be difficult because the performance monitoring mechanism does not adequately capture all activities.
A few interviewees noted that there are missing key performance indicators for relationship-building, demonstrating coordination and cooperation between missions, and providing support functions such as assisting event logistics and training.
It should be noted that although interactions, which include events and more network building aspects, are not key performance indicators, however they are reported quarterly to show a more complete picture of the work completed by TCs.
Efficiency and Effectiveness – Provision of Services to Clients
Key Finding 15: The TCS client satisfaction survey data show that there was an increase in the overall level of satisfaction, although it is not possible to attribute this increase solely to the Strategy.
The TCS Client Satisfaction Survey is sent to clients 60 days after a service is delivered and assesses different factors that affect client satisfaction, including timeliness, consistency, and type of information.
Notably, overall results for the clean technology sector increased by 11 percentage points just prior to the start of the Strategy in 2015‑16 to the most recent results available in 2018‑19, from 81% to 92%.
Strengths reveal value of relationships
The survey reveals that clean tech and climate finance results are higher than the TCS average in key areas that affect short term outcomes, as noted in Figure 18. For example, knowledge of a foreign market is a key function of the TCS and a key need of interviewed firms. The evidence indicated that a lack of knowledge is a barrier for firms to seek out foreign markets. High client satisfaction in these areas suggests that firms using TCS services are better positioned, and may be more competitive, as a result.
Timely information supports client activities
As previously noted, results of the survey to TCs identified some issues with respect to receiving support and timely information from RTCs. These same challenges have largely not affected the provision of services to clients. As noted in Figure 19, client satisfaction drivers, such as receiving accurate and up‑to‑date information, are comparable to the TCS average.
Figure 24: Impact on short term outcomes by overall TCS, clean tech sector (CT), and climate finance (CF), TCS Client Survey Results 2018-19.

Text version
A combination bar and line chart showing the impact on short term outcomes by overall TCS, clean tech sector and climate finance from the TCS Client Survey Results 2018‑19.
- Gain confidence to explore or expand operations, overall TCS 83%, clean tech 88%, climate finance 92%
- Connecting with contacts difficult without TCS, overall TCS 81%, clean tech 85%, climate finance 71%
- Identify a new opportunity in a foreign market(s), overall TCS 70%, clean tech 76%, climate finance 90%
- Improve knowledge of the environment, overall TCS 75%, clean tech 80%, climate finance 76%
Figure 25: Client satisfaction drivers by overall TCS, clean tech sector (CT), and climate finance (CF), TCS Client Survey Results 2018‑19

Text version
A table showing client satisfaction drivers by overall TCS, clean tech sector, and climate finance from the TCS Client Survey Results 2018‑19.
- Accurate information, overall TCS 92%, clean tech 89%, climate finance 94%
- Up‑to‑date information, overall TCS 91%, clean tech 88%, climate finance 94%
- I waited a reasonable amount of time, overall TCS 75%, clean tech 77%, climate finance 63%
- Improve knowledge of the environment, overall TCS 75%, clean tech 80%, climate finance 76%
Results are more variable in climate finance
As discussed in the performance section, climate finance had more variable client survey results, with some significantly lower than clean tech or the TCS results. As the TCS survey is a reflection of overall services provided to clients, not just those of the RTC, lower climate finance results may indicate that the capacity to provide services related to climate finance is limited across the network.
As previously acknowledged, the evaluation recognizes the newness of the activities of the CFBDT and need to scale up this knowledge to better equip TCs to serve clients. More effective provision of services to clients could be had by addressing the causes of these client satisfaction gaps.
Efficiency and Effectiveness ‑ Cross‑stream Collaboration
Key Finding 16: Opportunities for cross-stream collaboration across trade and international assistance business lines could be better realized in order to improve the effectiveness of the Strategy.
Although assessing the relationship between trade and international assistance at Global Affairs Canada goes beyond the scope of this evaluation, the close link between the two business lines in the context of climate finance points to a need for increased collaboration to achieve more effective and efficient results. Without collaboration in this area, Canadian firms are at risk of being at a competitive disadvantage when compared to competitors in other countries that have more complementary programs.
Links between business lines
Trade and international assistance are increasingly interlinked. International commitments such as the Paris Agreement and the Sustainable Development Goals explicitly include the role of the private sector in leveraging development outcomes. In addition, the mandate letters of the Minister of Foreign Affairs, Minister of International Development, and Minister of Small Business, Export Promotion, and International Trade make reference to closer collaboration between trade and aid. Evidence from TCS guidance and strategy documents suggests that TCS supports this direction. The Clean Tech Sector Guidance for 2020‑21 explicitly notes that priority for ITSF requests will be placed on “initiatives that, among other things, demonstrate collaboration and operationalize the trade/development nexus”. In addition, the B‑M Branch Climate Finance DG Working Group has met regularly over the past two fiscal years, with an objective of identifying steps for closer collaboration.
Challenges in collaboration
Although there has been strategic importance placed on the trade‑development nexus in the department, opportunities for cross‑stream collaboration at the operational level have not been fully realized. Interviewees noted differing priorities, the multilateral vs. bilateral and the evolution of trade/aid discussion internationally as key challenges in identifying the best approach for further collaboration.
Differing priorities
Interviewees noted a lack of understanding of each other’s business and different priorities as key barriers to collaboration. For example, trade is not always aware of the length of time to complete a development project or requirements of a development business cycle. At the same time, domestic economic benefit is not a primary objective or consideration for development work on climate change, which creates a disincentive to collaborate with trade.
Although differing priorities may pose a key challenge, some opportunities exist to build on current convergence point as case studies for future work. An analysis completed by PRE examined Strategia data to identify missions with both international development and trade priorities. Forty of 178 missions identified climate change as a key priority for at least one business line. Of the 40, 10 had a Head of Mission priority for clean technology that was shared by both international development and trade.
With the caveat that Strategia has data quality limitations due to inconsistent or incomplete data entry and that M-Branch programming may not be fully captured due to differences in how projects are managed and funding is distributed, these areas may present opportunities to further explore lessons learned and possible approaches for future collaboration. One example could be an integrated country profile, as suggested by a small number of interviewees, which would comprehensively include information on trade and aid priorities and funding. More accessible cross‑stream awareness may increase the likelihood of collaboration.
Figure 26: Only 9% of TCs frequently collaborate with development colleagues at mission on clean tech or climate finance (n=45)

Text version
A bar chart showing the frequency of collaboration between TCS and their development colleagues at mission on clean tech or climate finance (n=45).
- Frequently 9%
- Occasionally 13%
- Rarely 20%
- Never 16%
- Don’t know or not applicable 42%
Multilateral vs. bilateral funding
As previously noted, funding mechanisms are perceived to be a key barrier for Canadian firms accessing climate finance. One study noted that the OECD calculation method for the distribution of bilateral and multilateral funding considers funding that flow through multilateral institutions as bilateral. Using this calculation, Canada’s distribution was 31% bilateral, 68% multilateral in 2017. However, when considering the channel of flow, analysis of Canadian funding that either flows to or through multilateral channels revealed that 91% of Canada’s climate-related development finance was multilateral. Although 2017 was an exceptional year for agreements with multilateral development banks, the three‑year average (2015‑17) found that Canada’s multilateral share was 70%, which was the highest among the comparison group.
Interviewees noted that a higher proportion of multilateral funding than other countries may create a disadvantage in terms of relationship‑building. The bilateral relationship creates more opportunities for exchange that may be missed in a multilateral setting where there is less direct engagement with partners. It also enhances complexity for Canadian firms who noted the bureaucratic challenges of IFI requirements. At the same time, the human resource and other overhead costs requirements to manage bilateral relationships at the project level may exceed current capacity within the department.
Changing trade/aid relationship
ODA modernization has an increasingly greater allowance to consider private sector efforts as ODA. The OECD measure Total Official Support for Sustainable Development (TOSSD), which will support the SDG monitoring framework, will include assessment of the leveraging effects of ODA, use of blended finance, and use of innovative risk mitigation. These activities, coupled with an increasing appetite by developing countries to be more involved in trade, suggests an evolving space that could be best capitalized on by building closer collaboration between trade and development groups now.
Alignment with other Global Affairs Canada trade programs
Within Global Affairs Canada specifically, there are a broad range of funding mechanisms that provide support to different demographics and stages of a firm’s development, including the Canadian Technology Accelerator, CanExport, and Business Women in International Trade.
Analysis of Strategia data over the first three years of the reference period (2016‑17 to 2019‑20) indicates an increasing trend in the overall dollar value and number of initiatives that have a link to the clean technology sector. Primarily, these initiatives are tied to funding in ITSF envelopes, however BWIT has had an increasing presence over the previous two fiscal years.
Some sources, such as CanExport, are not linked in Strategia data, however, anecdotal evidence suggests referrals are exchanged between programs.
Many interviewees had limited to no anecdotal experience collaborating with other programs. A lack of formal collaboration prevents understanding of the extent to which programs are leveraged.
Conclusions
The Business Development Strategy for Clean Technology was launched in 2017 under the broader Strategy to Advance Clean Technology in Canada’s Natural Resource Sectors, which is a horizontal initiative led by NRCan that intends to support a whole‑of‑government, single window approach to advancing clean technology and innovation.
The Clean Tech Strategy specifically aimed to encourage and support Canadian firms in their efforts to capitalize on growing opportunities in the global market for clean technology. In addition to increased international business development support to Canadian clean technology firms, including launching a domestic outreach campaign to increase awareness, the Strategy proposed and implemented two novel approaches to support the Strategy: the creation of the RTC positions and the creation of the CFBDT. Although some implementation challenges were noted, the Branch was able to largely address and mitigate the associated risks, leading to successful achievement of all of its performance targets and a foundation for stronger involvement in this sector moving forward.
The Strategy has been implemented as planned and is producing results
The evaluation found that the Strategy aligns with the needs of Canadian firms and has helped to address certain sector gaps in the TCS network. The Strategy achieved all of its targets on time, and has helped to raise awareness and access to federal government programs by firms.
As one key example, the demand for ITSF exceeded its funding over the reference period. The fact that it is oversubscribed further demonstrates that there are significant opportunities to be pursued in this area.
The CFBDT has a unique role in supporting climate finance
One of the key observations of the evaluation is the fact that the CFBDT is the only federal government program that specifically aims to help firms access climate finance opportunities. In contrast, evidence suggests that other countries have a variety of supports for private sector involvement in climate finance. There is a risk that if the Strategy is not renewed and the CFBDT is disbanded, there will be missed opportunities for Canadian firms and their competitive advantage will be negatively affected. Further, there is an additional risk that all of the knowledge and corporate expertise in climate finance would be lost within the department. As this is a growing field internationally, lost skills in this area would lead to a large gap and blind spot for the TCS, preventing them from meeting client needs.
In addition, TCS involvement in climate finance revealed some challenges to collaboration between the trade and international assistance divisions at Global Affairs Canada. Given that the mandate letters for the three Ministers of Global Affairs Canada all indicate support for closer ties between trade and aid, and that climate finance specifically has an important nexus between these two business lines, opportunities exist to address barriers and capitalize on the strengths of each division.
Opportunities exist for improvement
Recognizing that the Strategy will be up for renewal by March 2021, key activities could support program refinements and improved results in the future, including:
- More granular assessment of the demographics and capacity levels of clean tech firms, in order to understand and support the needs of firms
- Analysis of the scope of government programming for business development in clean tech, in order to understand gaps, if any, that prevent firms from being market ready
- Assessment of the level of knowledge in climate finance across the TCS network, in relevant sectors, and expansion of training in this area
- Identification of opportunities, such as climate finance, for more formal collaboration between trade and international assistance
Considerations
The evaluation generated one key consideration for the revision and/or future iterations of the Clean Tech Strategy.
Cross‑Stream Opportunities
Clean technology, and climate finance in particular, have raised the need for, and added value of, closer collaboration between trade and international assistance business lines within Global Affairs Canada. Opportunities exist to better leverage each business lines’ strengths in order to more effectively and efficiently deliver on Government of Canada international commitments in the Paris Agreement, among others, and to engage the private sector in activities that support climate change adaptation and mitigation efforts. This would also support broader trade diversification objectives for the Department.
Recommendations
The evaluation has determined the following recommendations for the program:
Roles and Responsibilities
The Strategy should include measures to better communicate the services and value‑add of Regional Trade Commissioner (RTC) positions to the broader TCS network, and further clarify expectations. This should include review of the following to ensure that they align with the strategic purpose of augmenting the capacity and expertise of TCs in each region, and properly reflect the work conducted by the RTCs: services provided; key responsibilities; and performance metrics.
Knowledge Transfer
The Strategy should ensure that the learning and expertise developed by the CFBDT over the last three years be translated into formal knowledge and that this knowledge be available to Clean Tech, Infrastructure, Agriculture and other related sector teams and trade commissioners as part of formal training.
Client Needs
The Strategy should identify and address the needs of firms, including women and other underrepresented entrepreneurs. New measures should continue to take a client‑focused perspective and to ensure that TCS services are better tailored to respond to the international business development needs of firms.
Trade‑Development Nexus
The Strategy should continue to build on ongoing efforts to leverage the trade and development nexus to help Canadian firms access climate finance. The Strategy should take a pro‑active approach to exploring opportunities for cross‑stream collaboration with relevant divisions in B and M Branches in order to deliver coherent private sector engagement aligned with Canada’s sector strengths and expertise.
Management Response and Action Plan (MRAP)
Recommendation #1
The Strategy should include measures to further communicate the services and value-add of Regional Trade Commissioner (RTC) positions to the broader TCS network, and better clarify expectations. This should include review of the following to ensure that they align with the strategic purpose of augmenting the capacity and expertise of TCs in each region, and properly reflect the work conducted by the RTCs: services provided key responsibilities; and performance metrics.
Management Response
Agreed. A renewed and ongoing TCS International Business Development Strategy for Clean Technology will ensure better communication and clearer expectations for the RTC positions, communicated across the TCS network and reflected in KPIs.
Action plan #1
BBH Clean Technology and Climate Finance teams will conduct consultations with RTCs and their STCs on ways to broaden communication on key RTC responsibilities and to establish consistent RTC performance targets across the TCS network, to be reflected in target KPIs in 2020‑21 Strategia plans and performance metrics (current Strategia work plans do not have RTC‑specific metrics). BBH will maintain monthly regional calls with RTCs and the TCS network to support enhanced communication and monitor progress with quarterly reviews of performance metrics.
Timeline for Implementation: Q1 2020
BBH and RTCs will co‑develop & disseminate new explanatory one‑pager targeted at the TCS network on "How To Work with RTCs." This will articulate differentiated services provided by the RTCs from those of other Trade Commissioners (e.g. regional outcalls, regional TCS coordination and training, review of Commercial Action Plans) as well as provide best practices and reflect value‑added contributions and successes.
Timeline for Implementation: September 2020
BBH will update TCS Guidance document to be disseminated and published on the wiki for TCs that outlines RTC value‑added contributions and best practices for enhancing coherent client specific support across sectors and BBH will develop a similar new document for Climate Finance (to inform Strategia Planning FY2021‑22). BBH’s monthly regional calls with the TCS network will include RTCs and CF TCs to help align strategic objectives and enhance overall TC expertise and capacity in each region.
Timeline for Implementation: December 2020
Lead (Division / Bureau): BBH with support from BTB, BTU, geographic divisions, STCs / TPMs from missions and across Regional Offices in Canada
Recommendation #2
The Strategy should ensure that the learning and expertise developed by the Climate Finance Business Development Unit over the last three years be translated into formal knowledge and that this knowledge be available to Clean Tech, Infrastructure, Agriculture and other related sector teams and trade commissioners as part of formal training.
Management Response
Agreed. Prior to the Strategy sun setting in March 2021, and as part of a renewed Strategy, BBH will ensure knowledge gained through the Climate Finance pilot is shared across the TCS network.
Action plan #2
Building upon nine successful "knowledge-sharing" webinars delivered by the Climate Finance team, the team will continue to conduct a series of webinars & facilitated training sessions, including with climate finance experts, TCS clients that have successfully accessed climate finance and formal virtual training by Convergence on mobilizing private investment in blended finance.
Timeline for Implementation: August 2020 ‑ March 2021
BBH will develop formal training in cooperation with the Canadian Foreign Service Institute (CFSI) and BTR to provide training in climate and project finance. A combination of online and in‑person training, with the online component, covering the basics of climate finance, being a prerequisite for more in‑depth in‑class training. Part of the development of this training will include a needs‑based assessment developed in consultation with posts. Special attention will be paid to posts identified by the Evaluation as requiring more Climate Finance training.
Timeline for Implementation: Q3 for needs assessment
Delivery in 2021‑22
Concurrent to this, a guidance document, similar to the sector strategies created by BBD sector teams, will be developed for Climate Finance. Based off a thorough literature review and the experiences and lessons learned by TCs in the field, this will provide all TCs across the network (including infrastructure, agriculture and other related sector teams) with clear guidance on how to help clients as they develop a project funded by climate finance.
Timeline for Implementation: December 2020
Lead (Division / Bureau): BBH
with support from CFSI, BTR, Regional Offices, BBD sectors and in consultations with other GAC divisions (M‑branch) and OGDs
Recommendation #3
The Strategy should identify and address the needs of firms, including women and other underrepresented entrepreneurs. New measures should continue to take a client‑focused perspective and ensure that TCS services are tailored to respond to the IBD needs of firms.
Management Response
Agreed. A renewed and ongoing TCS International Business Development Strategy for Clean Technology will seek to address the needs of underrepresented groups.
Action plan #3
Further identify and address client‑focused IBD needs of women entrepreneurs in cleantech. BBH will continue to leverage Cleantech Advisory Group and existing gender‑based networks to identify and address needs of cleantech firms from under‑represented groups, such as the Regional Office Diversity Champions, The Globe Leading Change Initiative, MaRS, the Women in Renewable Energy Association, Equal by 30 (focused on women in clean energy transition and closing the gender gap), Women' chapters within sector associations, and other gender‑based business associations. BBH will articulate and leverage IBD advantages from GBA+ analysis and the Chief Economist’ report on women exporters to enhance TCS client support. Potentially expand research to other underrepresented populations (e.g. Aboriginal‑led companies, young‑entrepreneurs, new immigrant entrepreneurs).
Timeline for Implementation: Q2 ‑ Q4 (2020/21) & ongoing
TCS has identified the following needs of women in cleantech: Access to capital and access to investor & mentor networks. BBH will continue to collaborate with partners and stakeholders, such as the Clean Growth Hub and ECCC, and will develop/support a series of initiatives for women‑led firms: including continued support to the US CTA Network to replicate the highly successful Women in Cleantech CTA programming again (in partnership with NRCan and MaRS); ITSF funding for Women in Cleantech initiatives; Cleantech Global Workshops, and other client‑focused initiatives aimed at increasing sustainability in Agtech, Consumer Products, and Services ‑ clean technology / climate finance vertical sectors with higher business women representation.
Timeline for Implementation: Q2 ‑ Q4 (2020/21) & ongoing
Lead (Division / Bureau): BBH
with support from BBA/CTA, BPE/BWIT, Regional Office Diversity Champions, BTB, BBA, the CGH, ECCC, MSS
Recommendation #4
The Strategy should continue to build on ongoing efforts to leverage the aid and trade nexus to help Canadian firms access climate finance. The Strategy should take a pro‑active approach to exploring opportunities for cross‑stream collaboration with relevant divisions in B and M Branches in order to deliver coherent private sector engagement aligned with Canada’s sector strengths and expertise.
Management Response
Agreed. BBH will continue to collaborate closely with counterparts in M Branch working on Canada's climate finance international assistance envelope to include the Canadian private sector in Canada's international development commitments.
Action plan #4
BBH took the initiative to establish a DG‑Level Working Group with M‑Branch in FY 2019‑20. This has enhanced information‑sharing across streams and increased cooperation, laying the foundation to maximize opportunities for TCS clients, including with IFIs. BBH will aim to schedule 3 DG‑level meetings in FY2020/21.
Timeline for Implementation: Q2, Q3 & Q4 2020‑21
Furthermore, ECCC and GAC's M‑Branch will now include a private‑sector engagement strategy as part of their renewed Strategy scheduled for Fall 2020. BBH will assist in consultations with the Canadian private sector, leveraging TCS Sector Advisory Groups and industry networks.
Timeline for Implementation: Q2
BBH will incent TCs with ITSF to develop cross‑stream initiatives that support the promotion and adoption of Canadian climate solutions in developing markets. BBH will proactively reach out to a group of key missions and corresponding geographic divisions, who identified cleantech & climate change as shared priority by both international development and trade (in Strategia) with a goal of reviewing lessons learned and exploring possible approaches for collaboration.
Timeline for Implementation: Q3, Q4 and ongoing
Lead (Division / Bureau): BBH
with support from MLC, MSC, MLD, MEF, BPS, geographic divisions, the CGH, ECCC, and in consultations with Finance Canada
Appendices
Appendix A ‑ List of Finding Statements
The following provides a summary of all finding statements identified in the evaluation.
- Certain characteristics of the Canadian Clean Tech Industry have an influence on the extent to which firms are able to engage in international business development.
- The services provided by the Clean Tech Sector, including those funded as part of the Strategy, are aligned with the needs of Canadian firms.
- The Strategy does not have an explicit focus on advancing women or other under‑represented groups of entrepreneurs in Clean Tech, however opportunities exist to better understand the needs of these groups.
- The program surpassed ITSF funding targets three out of the four fiscal years.
- Current training activities are not providing trade commissioners with an adequate level of knowledge to perform their duties.
- The number of Canadian clean technology firms accessing international business development opportunities facilitated by the TCS increased.
- Climate finance is an increasing source of funding opportunities for Canadian in the Clean Tech, Infrastructure and Agriculture sectors.
- There has been an increase in the number of Canadian firms accessing global climate finance opportunities in developing countries
- Canadian firms that compete for climate finance face a number of barriers, some of which are beyond the mandate of the Strategy. The broader suite of support provided to firms in like‑minded countries may put Canadian firms at a competitive disadvantage in comparison.
- Despite the existence of certain barriers and challenges, the increasing climate finance opportunities realized in the first three years of the Strategy have laid a strong foundation for the Sector to pursue further development in this area.
- Domestic outreach activities conducted as part of the Strategy have increased Canadian firms' awareness of international business development support programs and services.
- Over time, awareness of the roles and responsibilities for the Climate Finance and Clean Technology RTCs has improved, although climate finance could be better understood throughout the TCS network.
- The RTCs (RTCs) have contributed to enhancing and strengthening the capabilities of the Clean Tech Sector trade commissioners, although there are some opportunities to improve support.
- Additional functionalities in reporting systems could provide better information for decision‑making related to clean technology and climate finance.
- The TCS client satisfaction survey data show that there was an increase in the overall level of satisfaction, although it is not possible to attribute this increase solely to the Strategy.
- Opportunities for cross‑stream collaboration across trade and international assistance business lines could be better realized in order to improve the effectiveness of the program.
Appendix B ‑ List of Acronyms
- BBH
- Clean Technology, Infrastructure and Life Sciences Division, responsible for implementing the Strategy
- BTB
- Trade Commissioner Service Tools, Analysis and Performance Division
- B2B
- Business to business meetings
- BWIT
- Business Women in International Trade Fund for commercial initiatives
- CCFT
- Climate Finance Facilitation Team
- CF
- Climate Finance
- FTE
- Full Time Employees
- FY
- Fiscal Year
- GC
- Government of Canada
- HQ
- Global Affairs Canada Head Quarters
- FIPA
- Foreign Investment Promotion and Protection Agreement
- IBD
- International Business Development
- IFIs
- International Financial Institutions
- ITSF
- Integrative Trade Strategy Fund
- LES
- Locally Engaged Staff
- MaRS
- Medical and Related Sciences
- MDB
- Multilateral Development Banks
- NRC
- National Research Council
- IRAP
- Canada Industrial Research Assistance Program
- ODA
- Official Development Assistance
- OECD
- Organization for Economic Co‑operation
- O&M
- Operations& Maintenance Funding
- P/T
- Provincial and Territorial Governments
- RTC
- Regional Trade Commissioner
- SDG
- United Nations Sustainable Development Goals
- SDTC
- Sustainable Development Technology Canada
- STEM
- Science, Technology, Engineering, and Mathematics
- TBS
- Treasury Board Secretariat
- TCs
- Trade Commissioners
- TCS
- Trade Commissioner Service
- TOSSD
- Total Official Support for Sustainable Development
- TRL
- Technology Readiness Level
Appendix C ‑ List of Sources
- Canadian Clean Technology Report, Analytica Advisors, 2017.
- Canadian Cleantech Companies and Global Climate Finance: Is It a Level Playing Field? Canadian International Development Platform (CIDP), 2019.
- Climate Investment Opportunities in Emerging Markets an International Finance Corporation Analysis, World Bank Group, 2016.
- Smart Prosperity leaders call on government to help clean innovators get ideas to market, creating wealth and jobs - Smart Prosperity Institute, Media Release, 2018/03/15
- Export development Canada Economic Insights: Shining a light on Canada’s cleantech future.
- Global Cleantech Innovation Index, 2017.
- Global Climate Finance Landscape, 2019.
- MaRS
- Survey on Financing and Growth of Small and Medium Enterprises, 2018.