
Economic Impact of the Canada–Chile Free Trade Agreement, 25th Anniversary
April 2023
Table of contents
- Highlights
- Executive summary
- Macroeconomic environment
- Bilateral merchandise trade under the CCFTA
- Investment
- Services trade
- Utilization of CCFTA preferences
- Assessing the effects of the CCFTA on trade
- Conclusion
- Appendixes
Information contained in this publication or product may be reproduced, in part or in whole, and by any means, for personal or public non-commercial purposes without charge or further permission, unless otherwise specified. Commercial reproduction and distribution are prohibited except with written permission from Global Affairs Canada.
For more information, contact:
Global Affairs Canada
125 Sussex Drive
Ottawa ON K1A 0G2
Canada
Telephone:
1-800-267-8376 (toll-free in Canada)
613-944-4000 (in the National Capital Region and outside Canada)
If you are deaf or hard of hearing, or if you have a speech impediment and use a text telephone, you can access the TTY service from 9 a.m. to 5 p.m. Eastern Time by calling 613-944-9136 (in Canada only)
Website: www.international.gc.ca
Email: info@international.gc.ca
© His Majesty the King in Right of Canada, as represented by the Minister of International Trade, Export Promotion, Small Business and Economic Development, 2023
Cat. No. FR5-215/2023E-PDF
ISBN 978-0-660-47031-3 (PDF)
Highlights
- Chile was Canada's first free trade agreement (FTA) partner in Latin America, other than Mexico. Chile has grown from being Canada's fifth-largest export destination in the region in 1997 to being Canada's third-largest today.
- Bilateral merchandise trade between Canada and Chile has more than quadrupled since the signing of the CCFTA. In 2021, Canadian merchandise exports to Chile exceeded $1.2 billion (US$972 million), compared to $392 million (US$283 million) in 1997. Canada's merchandise imports from Chile totalled $1.8 billion (US$1.4 billion) in 2021, relative to $326 million (US$235 million) in 1997.
- The Office of the Chief Economist, Global Affairs Canada, estimates that signing the CCFTA caused merchandise trade between Canada and Chile to grow 13% faster annually than if an FTA with Chile were never signed. This is a substantial increase in trade: over the course of the agreement, the total cumulative effect of the CCFTA on trade between Canada and Chile reached $7.0 billion (US$5.6 billion) in 2021.
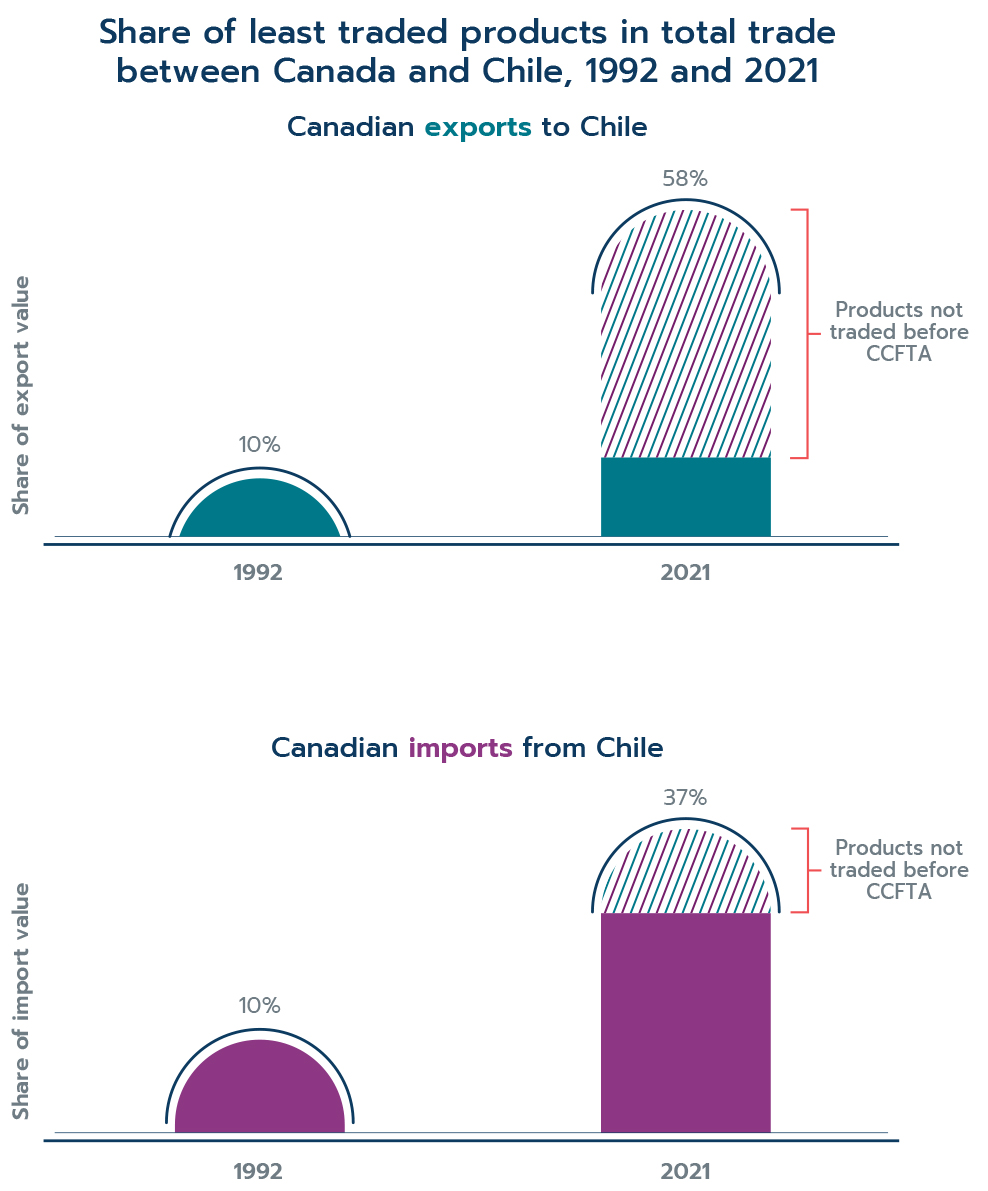
- A significant amount of the trade gains came from products that were previously not traded or traded in small amounts. These products accounted for 10% of Canada's exports to Chile in 1992 but grew to account for 58% of Canadian exports in 2021. Similarly, these products accounted for 10% of Canada's imports from Chile in 1992 but accounted for 37% in 2021.
- Small and medium-sized enterprises (SMEs) represented 90% of Canadian companies exporting to Chile and contributed almost half of total exports to Chile between 2005 and 2021.
- The utilization of CCFTA preferences in bilateral trade between Canada and Chile has been high and relatively stable over the years. In 2020, 72.9% of all eligible Canadian merchandise exports to Chile claimed CCFTA preferences. The utilization of CCFTA preferences of the Chilean exports to Canada was 80.9% in 2021.
- The CCFTA is supporting greater trade in environmental goods. From 1996 to 2021, Canada's exports of environmental goods to Chile grew at an annualized rate of 4.5%, for a net increase of $65 million (US$52 million). At the same time, Canada's imports of environmental goods from Chile grew at a compound annual rate of 15%, a net increase of $5.9 million (US$4.7 million).
- The stock of Canadian direct investment in Chile grew almost sevenfold, up from $3.9 billion (US$2.8 billion) in 1997 to a record high of $25.2 billion (US$18.8 billion) in 2020 before falling slightly to $22.3 billion (US$17.8 billion) in 2021.
Executive summary
The year 2022 marked the 25-year anniversary of the implementation of the Canada-Chile Free Trade Agreement (CCFTA), which entered into force on July 5, 1997. The agreement was groundbreaking in many aspects for both Canada and Chile. For Canada, it was the first free trade agreement signed with a South American country and one of the most comprehensive free trade agreements Canada made since signing the North America Free Trade Agreement. For Chile, it was the first trade agreement concluded with a leading industrialized country and the beginning of a series of subsequent FTAs it would sign with other countries.
The CCFTA has had a substantial impact on trade between the two countries. Bilateral merchandise trade has more than quadrupled since the CCFTA entered into force. In 2021, Canadian merchandise exports to Chile exceeded $1.2 billion (US$972 million) in value, compared to $392 million (US$283 million) in 1997. Canada's merchandise imports from Chile totalled $1.8 billion (US$1.4 billion) in 2021, relative to $326 million (US$235 million) in 1997. Analysis in this report estimates that trade between Canada and Chile grew 13% faster annually under the CCFTA than if an FTA were never signed. This represents a substantial increase in trade: over the course of the agreement, the total cumulative effect of the CCFTA on trade between Canada and Chile reached $7.0 billion (US$5.6 billion) in 2021.
While the growth in bilateral trade has been impressive, it is also interesting where the trade growth was concentrated. Products that were previously not traded or were traded in low amounts before the CCFTA accounted for more than half of the export gains. Fifty-eight percent of Canada's exports to Chile in 2021 were made up of these infrequently traded products, while they made up only 10% of Canada's exports in 1992. Canada's imports from Chile also saw similar growth, where these products made up 37% of imports in 2021 compared to just 10% in 1992. The data indicate that removing tariff barriers through the CCFTA led to new trade growth and was, therefore, an important contributor to the meteoric rise in bilateral trade between the two countries.
Looking at the utilization data, it is clear that both Canada and Chile have benefitted from claiming the tariff preferences under the agreement. The utilization rates of the CCFTA have been consistently high in recent years. In 2021, 80.9% of preference-eligible Chilean exports to Canada claimed CCFTA preferences. Similarly, Canadian exporters claimed preferences for 72.9% of preference-eligible imports in 2020.Footnote 1 These high and sustained utilization rates show that importers from both countries have been and continue to benefit from tariff liberalization under the agreement.
However, the CCFTA did more than just reduce tariffs between the two countries. The agreement also provided a framework to promote bilateral cooperation on investment between the two countries and environmental protection. The data indicates that the agreement was successful in these aspects as well. Canadian direct investment (CDI) in Chile has seen incredible growth since the agreement came into force. In 2021, the stock of CDI reached $22.3 billion (US$17.8 billion), nearly six times its value of $3.9 billion (US$2.8 billion) in 1997. In terms of environmental protection, trade in environmental goods has experienced strong growth since the implementation of the agreement. Canada's exports of environmental goods to Chile grew at a compound annual rate of 4.5% from 1996 to 2021, while Canada's imports of environmental goods grew at a compound annual rate of 15% over the same period. With Canada's exports of environmental goods reaching $98 million (US$78 million) in 2021, the CCFTA has furthered environmental protection and sustainability.
Despite being one of the most comprehensive free trade agreements for its time, Canada and Chile signed a series of amending agreements to modernize the CCFTA. These agreements, which entered into force in 2019, added new chapters on sanitary and phytosanitary measures, technical barriers to trade, improvements to the existing investment chapter, and for the first time in Canada's FTA history a standalone chapter on trade and gender. Canadian company-level data shows that female employment among Canadian exporters to Chile increased to 417,831 women in 2020, up from 355,823 in 2015, an increase of 62,008 jobs occupied by female workers. Furthermore, the share of female employment increased slightly, from 25% in 2015 to more than 28% in 2020.
Macroeconomic environment
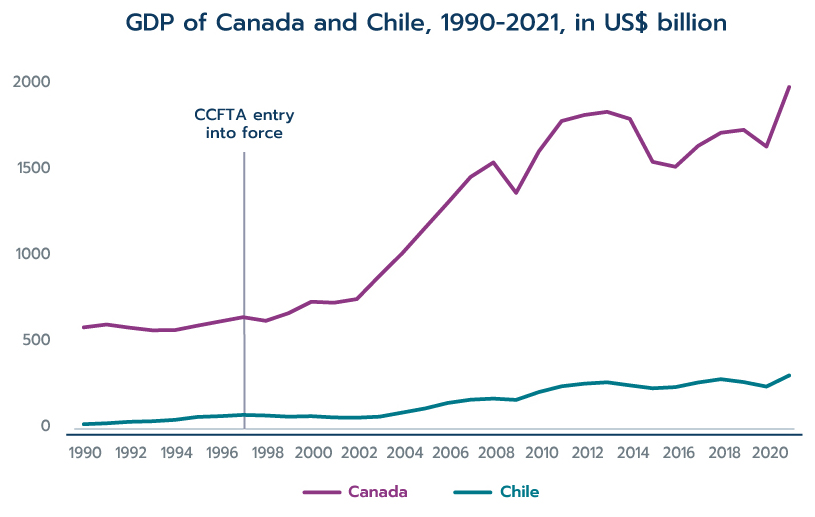
Canada's economy is approximately six times that of Chile in terms of gross domestic product (GDP, Figure 1) and has a per capita GDP of US$52,079 compared to Chile at US$16,069. Despite this size difference, the two economies share many similarities due to a reliance on commodity exporting. Both economies grew rapidly in the early 2000s, but had some setbacks during the 2008 financial crisis and during the collapse of commodity prices in 2015-16. Both economies also contracted during the COVID-19 recession in 2020, but rebounded to surpass pre-pandemic levels in 2021.
Figure 1
Data: IMF World Economic Outlook Online Database
Text version
Figure 1
| Year | Canada(US$ B) | Chile(US$ B) |
|---|---|---|
| 1990 | 596.1 | 34.2 |
| 1991 | 612.5 | 39.3 |
| 1992 | 594.4 | 47.9 |
| 1993 | 579.1 | 51.3 |
| 1994 | 579.9 | 59.2 |
| 1995 | 605.9 | 76.2 |
| 1996 | 630.6 | 80.8 |
| 1997 | 655.0 | 88.0 |
| 1998 | 634.0 | 84.5 |
| 1999 | 678.4 | 77.8 |
| 2000 | 744.6 | 80.6 |
| 2001 | 739.0 | 73.3 |
| 2002 | 760.1 | 71.8 |
| 2003 | 895.6 | 77.8 |
| 2004 | 1026.5 | 101.6 |
| 2005 | 1173.5 | 125.4 |
| 2006 | 1319.4 | 157.5 |
| 2007 | 1468.9 | 176.4 |
| 2008 | 1552.9 | 182.6 |
| 2009 | 1376.5 | 175.2 |
| 2010 | 1617.3 | 220.5 |
| 2011 | 1793.3 | 254.1 |
| 2012 | 1828.4 | 269.4 |
| 2013 | 1846.6 | 277.2 |
| 2014 | 1805.8 | 259.4 |
| 2015 | 1556.5 | 242.5 |
| 2016 | 1528.0 | 249.3 |
| 2017 | 1649.3 | 276.2 |
| 2018 | 1725.3 | 295.3 |
| 2019 | 1742.0 | 278.4 |
| 2020 | 1645.4 | 252.5 |
| 2021 | 1990.8 | 316.9 |
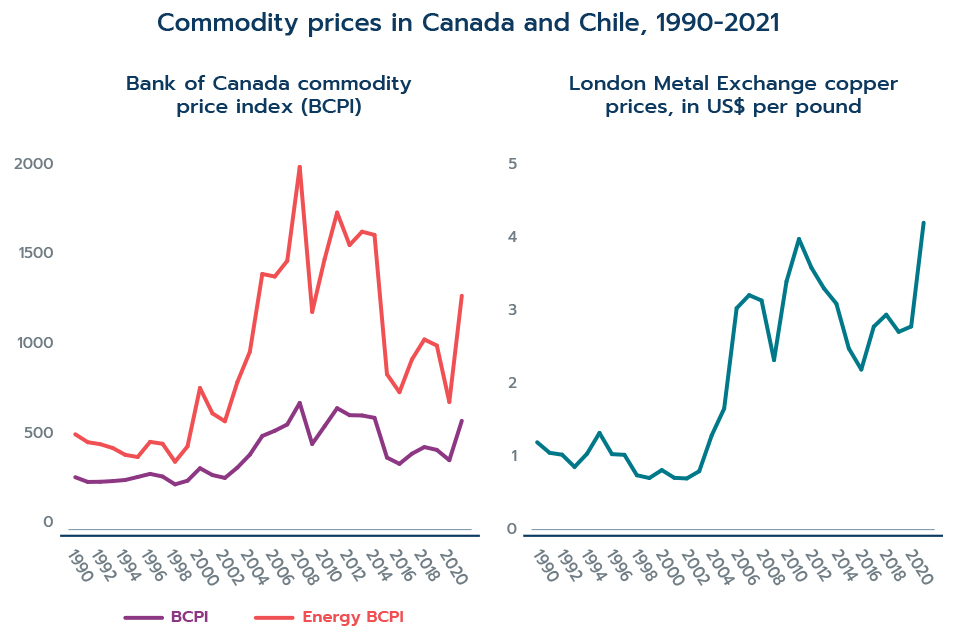
As commodity exporting countries, the significant price fluctuations over the last two decades have affected both Canada and Chile. In the early 2000s, commodity prices increased substantially, fuelled by growing demand from emerging-market economies. Canada and Chile benefitted greatly from these high commodity prices, such as the price of energy products and copper. However, the reliance on commodity prices—which are set in international markets—means that the economies of Canada and Chile are susceptible to commodity price fluctuations. This is clear in the slumps in commodity prices experienced after the 2008 financial crisis (Figure 2). In 2021, commodity prices spiked and while it created some pain for consumers, it contributed to the recovery from COVID-19 restrictions and shutdowns.
Figure 2
Data: Bank of Canada and Bank of Chile
Text version
Figure 2
Alternative text:
| Year | BCPI (Index) | Energy BCPI (Index) | Copper price (US$ per pound) |
|---|---|---|---|
| 1990 | 278.46 | 514.62 | 1.21 |
| 1991 | 252.52 | 471.12 | 1.06 |
| 1992 | 253.39 | 460.31 | 1.03 |
| 1993 | 257.23 | 439.24 | 0.87 |
| 1994 | 263.19 | 401.70 | 1.05 |
| 1995 | 279.75 | 389.58 | 1.33 |
| 1996 | 296.75 | 472.99 | 1.04 |
| 1997 | 282.33 | 462.60 | 1.03 |
| 1998 | 239.12 | 363.83 | 0.75 |
| 1999 | 259.20 | 447.96 | 0.71 |
| 2000 | 327.84 | 769.31 | 0.82 |
| 2001 | 290.31 | 629.68 | 0.72 |
| 2002 | 274.69 | 586.26 | 0.71 |
| 2003 | 331.58 | 802.06 | 0.81 |
| 2004 | 402.51 | 968.69 | 1.30 |
| 2005 | 505.53 | 1396.84 | 1.67 |
| 2006 | 533.97 | 1382.74 | 3.05 |
| 2007 | 568.77 | 1469.10 | 3.23 |
| 2008 | 687.10 | 1985.80 | 3.16 |
| 2009 | 461.54 | 1188.05 | 2.34 |
| 2010 | 559.21 | 1479.19 | 3.42 |
| 2011 | 658.19 | 1734.75 | 4.00 |
| 2012 | 619.87 | 1556.11 | 3.61 |
| 2013 | 618.24 | 1629.50 | 3.32 |
| 2014 | 605.22 | 1611.74 | 3.11 |
| 2015 | 386.54 | 844.95 | 2.50 |
| 2016 | 351.97 | 746.34 | 2.21 |
| 2017 | 407.66 | 926.40 | 2.80 |
| 2018 | 444.45 | 1036.47 | 2.96 |
| 2019 | 428.76 | 1002.87 | 2.72 |
| 2020 | 372.22 | 692.67 | 2.80 |
| 2021 | 588.58 | 1276.66 | 4.23 |
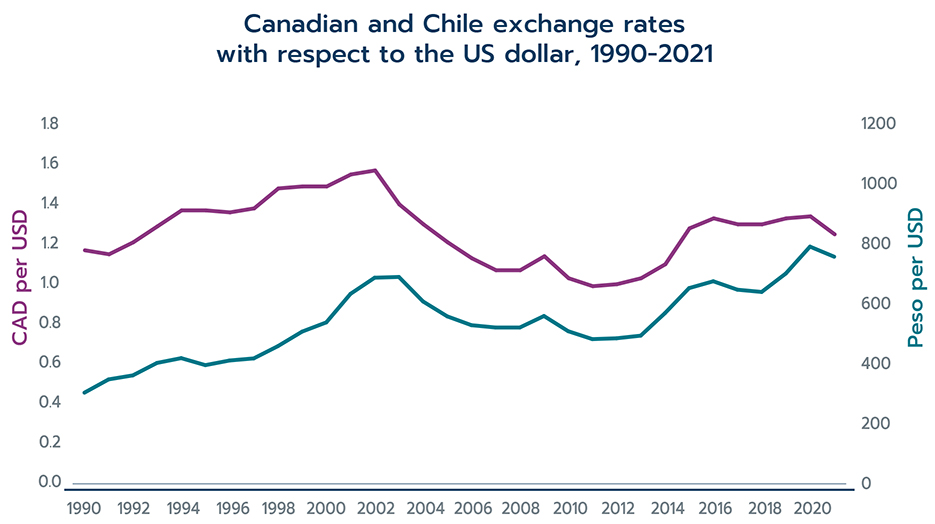
A second consequence of being reliant on international commodities is that Canada and Chile's currencies have been subject to large exchange rate fluctuations over the years (Figure 3). As commodity prices spiked, both Canada and Chile experienced appreciation relative to the U.S. dollar. Drops in commodity prices, however, weighed on Canada and Chile's currencies starting around 2014.
Figure 3
Data: IMF International Financial Statistics Database
Text version
Figure 3
| Year | CAD per USD | Peso per USD |
|---|---|---|
| 1990 | 1.17 | 304.9 |
| 1991 | 1.15 | 349.2 |
| 1992 | 1.21 | 362.6 |
| 1993 | 1.29 | 404.2 |
| 1994 | 1.37 | 420.2 |
| 1995 | 1.37 | 396.8 |
| 1996 | 1.36 | 412.3 |
| 1997 | 1.38 | 419.3 |
| 1998 | 1.48 | 460.3 |
| 1999 | 1.49 | 508.8 |
| 2000 | 1.49 | 539.6 |
| 2001 | 1.55 | 634.9 |
| 2002 | 1.57 | 688.9 |
| 2003 | 1.40 | 691.4 |
| 2004 | 1.30 | 609.5 |
| 2005 | 1.21 | 559.8 |
| 2006 | 1.13 | 530.3 |
| 2007 | 1.07 | 522.5 |
| 2008 | 1.07 | 522.5 |
| 2009 | 1.14 | 560.9 |
| 2010 | 1.03 | 510.2 |
| 2011 | 0.99 | 483.7 |
| 2012 | 1.00 | 486.5 |
| 2013 | 1.03 | 495.3 |
| 2014 | 1.10 | 570.3 |
| 2015 | 1.28 | 654.1 |
| 2016 | 1.33 | 677.0 |
| 2017 | 1.30 | 648.8 |
| 2018 | 1.30 | 641.3 |
| 2019 | 1.33 | 702.9 |
| 2020 | 1.34 | 792.7 |
| 2021 | 1.25 | 759.0 |
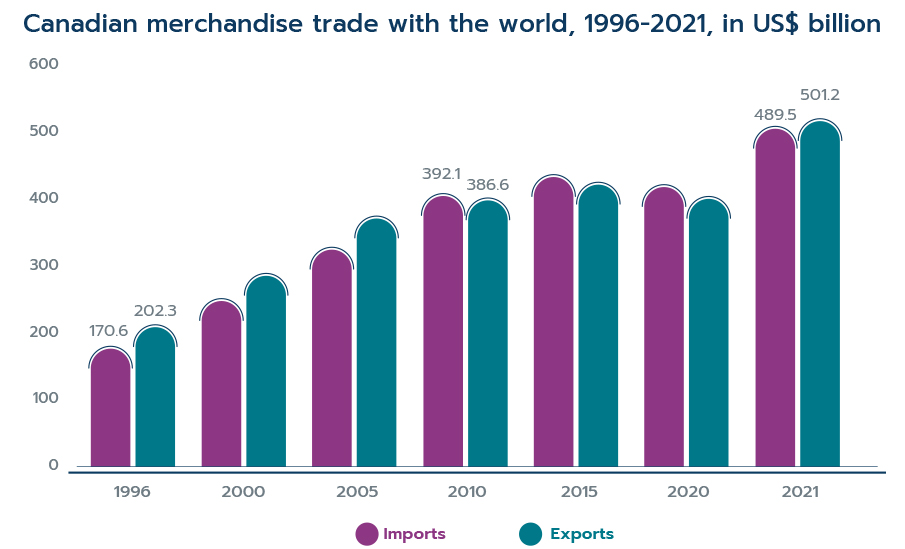
The Canadian economy is highly dependent on international trade. In 2021, Canada's total trade in goods and services were responsible for approximately 65% of its GDP.Footnote 2 Energy products accounted for nearly one quarter of Canada's total exports to the world in 2021, followed by exports of vehicles (9%) and machinery and equipment (7%). Canada also has a broad and growing trade network that offers Canadian businesses preferential access to a variety of markets around the globe. Currently, Canada has signed 15 FTAs with 51 countries. Despite these vast number of agreements, the United States remains Canada's largest trading partner, with more than 75% of Canada's merchandise exports in 2021, for example, directed to the United States.
Beginning in the mid-1990s, Canada's total trade with the world expanded rapidly until the trade collapse caused by the global financial crisis of 2008 (Figure 4). Since then, Canada's imports and exports with the world expanded at a slower rate, with brief contractions in the 2014 to 2016 period, resulting from a deterioration of commodity prices, and the COVID-19 recession in 2019-2020. In 2021, Canada's trade with the world reached record-high levels and both imports and exports surpassed their pre-pandemic levels.
Figure 4
Data: United Nations Comtrade database
Text version
Figure 4
| Year | Imports (US$ B) | Exports (US$ B) |
|---|---|---|
| 1996 | 170.6 | 202.3 |
| 2000 | 240.1 | 277.4 |
| 2005 | 314.4 | 360.6 |
| 2010 | 392.1 | 386.6 |
| 2015 | 419.4 | 408.7 |
| 2020 | 404.9 | 388.4 |
| 2021 | 489.5 | 501.2 |
Like Canada, Chile has focused on obtaining preferential access to markets around the world. Chile has negotiated 32 trade agreements covering 65 economies. This extensive network of trade agreements has significantly improved Chile's access to international markets. Exports of ore and refined metal (mostly copper) represented about 60% of Chile's exported products to the world in 2021. Chile's other large exports include fruits and nuts (7%) and fish (6%). Chile's largest trading partner is China, representing 38% of Chile's export value in 2021.
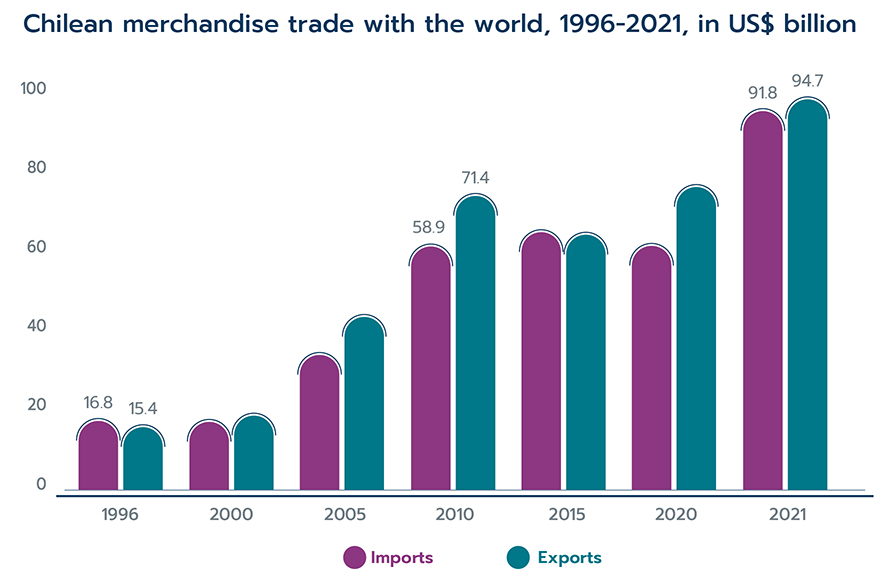
During most of the early 2000s, Chile's trade with the world rapidly expanded (Figure 5). However, its trade with the world, and in particular, imports from the world contracted substantially during the financial crisis of 2008-2009. After a brief recovery, Chilean exports to the world started to fall in 2010, following a stark decline in copper prices that took place from 2010 to 2016. In more recent years, both global imports and exports have recovered from the COVID-19 recession and reached record high values in 2021.
Figure 5
Data: United Nations Comtrade database
Text version
Figure 5
| Year | Imports (US$ B) | Exports (US$ B) |
|---|---|---|
| 1996 | 16.8 | 15.4 |
| 2000 | 16.6 | 18.2 |
| 2005 | 32.8 | 42.1 |
| 2010 | 58.9 | 71.4 |
| 2015 | 62.4 | 62.0 |
| 2020 | 59.2 | 73.5 |
| 2021 | 91.8 | 94.7 |
Bilateral merchandise trade under the CCFTA
Since the CCFTA entered into force in 1997, merchandise trade between the two countries has increased considerably. Total merchandise trade reached a record high of US$2.8 billion in 2011 and has been slightly decreasing ever since. Despite this, total merchandise trade between Canada and Chile increased from US$519 million in 1997 to US$2.4 billion in 2021, growing at a compound annual growth rate of 6.6% over that period.
Table 1 (below) enables comparisons of the value of trade growth between Canada and Chile, and between Canada and other leading South American countries with and without an FTA with Canada. From 1997 to 2021, Canadian imports from Chile grew at a compound annual growth rate of 7.8%. This fast growth rate was only surpassed by the annual growth rates of Peru (15.6%) and Brazil (8.0%) but was above the growth rate of Canada's imports from South America and from the world. Canada's exports to Chile grew at an annual rate of 5.3%, outperforming the export growth rates to other major South American countries except Peru, which is also a Canadian FTA partner country.
Table 1: Canada's trade with major South American countries
| Country | Imports (US$M) | Exports (US$M) | ||||
|---|---|---|---|---|---|---|
| 1997 | 2021 | Growth (%) | 1997 | 2021 | Growth (%) | |
| Argentina | 168.1 | 778.9 | 6.6% | 295.5 | 283.0 | -0.2% |
| Brazil | 953.0 | 5,976.4 | 8.0% | 1,222.6 | 1,812.8 | 1.7% |
| Chile | 235.2 | 1,438.7 | 7.8% | 283.4 | 972.2 | 5.3% |
| Colombia | 217.8 | 1,038.6 | 6.7% | 341.5 | 801.4 | 3.6% |
| Peru | 97.2 | 3,170.6 | 15.6% | 225.1 | 867.2 | 5.8% |
| Venezuela | 702.0 | 11.6 | -15.7% | 688.6 | 134.1 | -6.6% |
| South America | 2,536.9 | 13,085.0 | 7.1% | 3,167.6 | 5,427.1 | 2.3% |
| World | 197,010.9 | 489,490.0 | 3.9% | 216,037.3 | 501,200.6 | 3.6% |
Note: Growth is the compound annual growth rate Data: United Nations Comtrade database
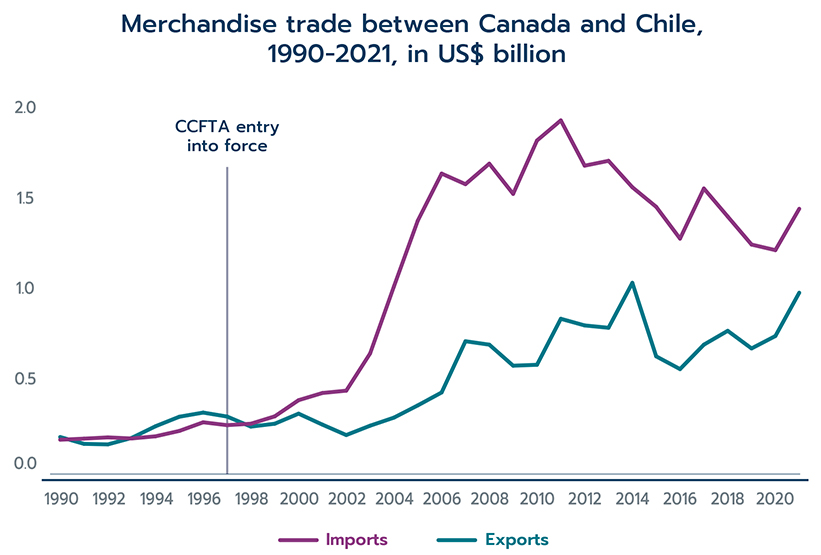
Figure 6 depicts the evolution of Canada-Chile bilateral trade from 1990 to 2021. Exports to Chile showed strong continuous growth until 2014, when they reached a maximum of US$1 billion and then slightly decreased until 2016. Since then, Canadian exports to Chile have mostly recovered to their maximum value achieved in 2014 despite the COVID-19 pandemic in 2020.
Figure 6
Data: United Nations Comtrade database
Text version
Figure 6
| Year | Imports (US$ B) | Exports (US$ B) |
|---|---|---|
| 1990 | 0.154 | 0.169 |
| 1991 | 0.160 | 0.131 |
| 1992 | 0.167 | 0.128 |
| 1993 | 0.161 | 0.164 |
| 1994 | 0.173 | 0.229 |
| 1995 | 0.203 | 0.282 |
| 1996 | 0.251 | 0.305 |
| 1997 | 0.235 | 0.283 |
| 1998 | 0.243 | 0.227 |
| 1999 | 0.284 | 0.243 |
| 2000 | 0.374 | 0.299 |
| 2001 | 0.414 | 0.238 |
| 2002 | 0.427 | 0.180 |
| 2003 | 0.634 | 0.232 |
| 2004 | 1.007 | 0.277 |
| 2005 | 1.373 | 0.345 |
| 2006 | 1.635 | 0.417 |
| 2007 | 1.576 | 0.702 |
| 2008 | 1.690 | 0.683 |
| 2009 | 1.522 | 0.566 |
| 2010 | 1.819 | 0.571 |
| 2011 | 1.931 | 0.827 |
| 2012 | 1.679 | 0.790 |
| 2013 | 1.706 | 0.777 |
| 2014 | 1.559 | 1.027 |
| 2015 | 1.450 | 0.618 |
| 2016 | 1.273 | 0.547 |
| 2017 | 1.552 | 0.683 |
| 2018 | 1.396 | 0.760 |
| 2019 | 1.240 | 0.662 |
| 2020 | 1.209 | 0.731 |
| 2021 | 1.439 | 0.972 |
Canada's imports from Chile reached a maximum value of US$1.9 billion in 2011 but have been declining since. To have a better understanding of the factors driving the observed decline in the import value from Chile in recent years, two further decompositions are performed. First, the change in the import value relative to its maximum in 2011 is decomposed into its price and volume effects (Figure 7).Footnote 3 This analysis suggests that while import prices have been increasing relative to their level in 2011, there have been substantial decreases in the volume of imports from Chile. In total, the decline in volume has outweighed any increase in prices, leading to lower imports from Chile overall.
Figure 7

Data: Statistics Canada, tables 12-10-0130-01 and 12-10-0126-01
Text version
Figure 7
| Logarithmic change from 2011 | |||
|---|---|---|---|
| Year | Quantity | Price | Value |
| 2011 | 0.00 | 0.00 | 0.00 |
| 2012 | -0.14 | 0.00 | -0.14 |
| 2013 | -0.10 | -0.03 | -0.12 |
| 2014 | -0.26 | 0.05 | -0.21 |
| 2015 | -0.39 | 0.10 | -0.29 |
| 2016 | -0.52 | 0.10 | -0.42 |
| 2017 | -0.33 | 0.12 | -0.22 |
| 2018 | -0.52 | 0.20 | -0.33 |
| 2019 | -0.65 | 0.21 | -0.44 |
| 2020 | -0.70 | 0.23 | -0.47 |
| 2021 | -0.60 | 0.31 | -0.29 |
The second decomposition aims to determine whether the observed decrease in imports after 2011 was concentrated in a few sectors or was the result of a broad-based decline. As shown in Figure 8, the largest reduction in import value was reported in harmonized system chapter 71 (HS 71), mostly composed of gold and silver, which decreased by almost US$858 million between 2011 and 2021. The only other sector contributing to the decline in recent years is edible fruits and nuts, etc. (HS 8), which experienced a small decrease in imports, though the sector remains a large component of Chile's exports to Canada. Thus, the decline in imports from Chile is largely due to Canada's redistribution of gold and silver purchases, which is not affected by the CCFTA.
Figure 8

Data: United Nations Comtrade database
Text version
Figure 8
Change relative to 2011 in US$ M
| Year | Gold and silver | Rest of imports | Total imports |
|---|---|---|---|
| 2011 | 0.0 | 0.0 | 0.0 |
| 2012 | -228.7 | -23.5 | -252.2 |
| 2013 | -485.1 | 260.4 | -224.7 |
| 2014 | -567.4 | 195.7 | -371.7 |
| 2015 | -554.4 | 73.7 | -480.7 |
| 2016 | -486.1 | -171.6 | -657.7 |
| 2017 | -697.5 | 318.9 | -378.6 |
| 2018 | -865.8 | 330.8 | -535.0 |
| 2019 | -875.0 | 183.7 | -691.3 |
| 2020 | -869.3 | 147.0 | -722.3 |
| 2021 | -878.6 | 386.5 | -492.1 |
Sectoral performance
Five HS chapters contributed to nearly 85% of the increase of Canadian imports from Chile between 1997 and 2021 (Table 2). Unequivocally, the most outstanding growth was concentrated in copper and articles thereof (HS 74), which expanded from US$378,000 in 1997 to nearly US$544 million in 2021. Imports of food products also registered significant increases. Between 1997 and 2021, Canadian imports from Chile of fish and crustaceans, molluscs, and other aquatic invertebrates (HS 3) increased by US$188.7 million; fruit and nuts, edible, peel of citrus fruit or melons (HS 8) increased by US$167.6 million; and beverages, spirits and vinegar (HS 22), by US$49.8 million. Ores, slag, and ash (HS 26) is the fifth product sector showing strong growth, a change of $76.4 million in that period.
Table 2: Canadian imports from Chile in 1997 and 2021 by product sector, in US$ million
| HS chapter | Description | 1997 | 2021 | Change |
|---|---|---|---|---|
| 74 | Copper and articles thereof | 0.4 | 544.0 | 543.6 |
| 3 | Fish and crustaceans, molluscs, and other aquatic invertebrates | 6.2 | 194.9 | 188.7 |
| 8 | Fruit and nuts, edible; peel of citrus fruit or melons | 85.6 | 253.2 | 167.6 |
| 26 | Ores, slag, and ash | 25.9 | 102.2 | 76.4 |
| 22 | Beverages, spirits, and vinegar | 37.2 | 87.0 | 49.8 |
| Total import value | 235.4 | 1,438.7 | 1,203.4 | |
Data: United Nations Comtrade database
Most of the increases in goods exports to Chile between 1997 and 2021 were driven by exports of natural resources (Table 3). Exports of mineral fuels and oils (HS 27), the top export sector in 2021, expanded by US$248.7 million to reach a record high of US$281.5 million in 2021. Also increasing over that period were exports of animal or vegetable fats and oils (HS 15), which increased by US$107.1 million, and cereals (HS 10), by US$79.8 million.
Table 3: Canadian exports to Chile in 1997 and 2021 by product sector, in US$ million
| HS chapter | Description | 1997 | 2021 | Change |
|---|---|---|---|---|
| 27 | Mineral fuels, mineral oils and products of their distillation | 32.8 | 281.5 | 248.7 |
| 15 | Animal or vegetable fats and oils and their cleavage products | 0.2 | 107.4 | 107.1 |
| 10 | Cereals | 51.6 | 131.4 | 79.8 |
| 84 | Nuclear reactors, boilers, machinery, and mechanical appliances; parts thereof | 52.3 | 107.6 | 55.3 |
| 30 | Pharmaceutical products | 1.5 | 43.9 | 42.3 |
| Total export value | 283.4 | 972.2 | 691.0 | |
Data: United Nations Comtrade database
Canadian company-level data was used to examine the extent to which Canadian exporters rely on wholesale traders to export to Chile. In 2020, nearly 20% of Canadian exports to Chile were processed through wholesale traders, indicating a large reliance on wholesalers for enabling trade. This is not unexpected, as Canadian exporters tend to rely on wholesalers for trading partners who are further away from Canada geographically. In contrast, Canadian companies relying on wholesalers for exports to the United States represent only about 5% of total exports.
Trade growth by CCFTA preferences
Further comparisons can be made to examine the trade creation effects of tariff reductions under the CCFTA. As expected, products that received the highest tariff reductions under the CCFTA experienced more trade growth compared to products that received lower reductions or were already identified as most-favoured nation (MFN) duty-free before the agreement.
Figure 9 depicts the compound annual growth rate of Canada's imports from Chile by the size of the tariff reduction under the CCFTA. The largest growth rates were concentrated in the products that experienced large tariff reductions under the CCFTA. Between 1996 and 2021, imports of products with tariff reductions between 5 and 10 percentage points grew at an annualized rate of 10.2%, and products with tariff reductions greater than 10 percentage points grew by 9.8%. Similarly, Canada's imports from Chile grew at an annualized rate of 7.4% for duty-free products, and at 4.4% for products with tariff reductions between zero and 5 percentage points.
Figure 9

Note: Growth is the compound annual growth rate
Data: Statistics Canada, Canada Border Services Agency and World Integrated Trade Solutions
Text version
Figure 9
Duty free: 7.4%
Between 0 and 5 percentage points: 4.4%
Between 5 and 10 percentage points: 10.2%
More than 10 percentage points: 9.8%
In terms of Canada's exports to Chile, the tariff reductions were only in two categories because Chile's MFN schedule only had duty-free tariffs or 11% tariffs. Exports of duty-free products had a minor contraction of -1.1% between 1996 and 2021. Products imported from Canada that received a tariff reduction of more than 10 percentage points under the CCFTA were the bulk of the products. These products recorded an annualized growth rate in import value of 4.3% from 1996 to 2021 (Figure 10).
Figure 10

Note: Growth is the compound annual growth rate
Data: Government of Chile, World Integrated Trade Solutions
Text version
Figure 10
Duty free: -1.1%
More than 10 percentage points: 4.3%
Overall, trade growth for products that received the largest tariff reductions under the CCFTA
(5 percentage points or more) outperformed the trade growth for products with modest or no tariff cuts.
Company-level exports from Canada to Chile
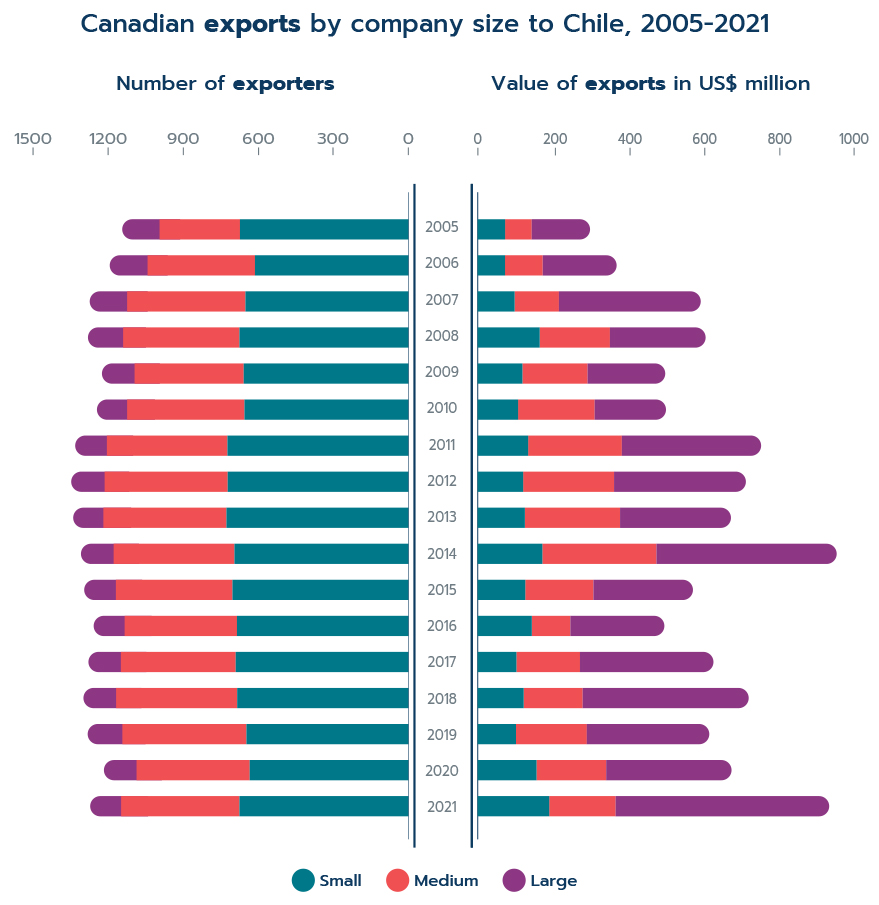
At the company level, most Canadian enterprises exporting to Chile were small (with 49 or fewer employees) and medium sized (between 50 and 499 employees) (Figure 11). On average, between 2005 and 2021 a total of 1,273 enterprises exported to Chile; of them, 679 (53.3%) were small, 461 (36.2%) were medium-sized and only 133 (10.5%) were large companies (with 500 employees or more). The distribution of the number of exporters by company size mostly remained constant across categories over that period.
A completely different picture is portrayed when analyzing the value of exports to Chile by company size. Although representing only 10% of the number of enterprises exporting to Chile, large companies accounted on average for half (50.6%) of the total export value. The remaining was split between small (20.5%) and medium-sized companies (28.9%), suggesting an important role in exports to Chile for small and medium-sized enterprises. While SMEs routinely make up about half of exports to South American countries, small enterprises play a larger role in the value of exports to Chile (20.5% on average) compared to other South American countries like Argentina (12.7%), Brazil (9.0%), Colombia (15.6%) and Peru (12.3%).
Figure 11
Data: Statistics Canada, Table 12-10-0095-01
Text version
Figure 11
| Number of exporters | Value of exports in US$ M | |||||
|---|---|---|---|---|---|---|
| Year | Small | Medium | Large | Small | Medium | Large |
| 2005 | 675 | 322 | 151 | 72.5 | 70.7 | 154.8 |
| 2006 | 615 | 430 | 152 | 72.3 | 100.0 | 196.0 |
| 2007 | 653 | 474 | 150 | 97.7 | 117.6 | 376.6 |
| 2008 | 677 | 466 | 141 | 164.2 | 186.3 | 253.9 |
| 2009 | 660 | 437 | 131 | 118.5 | 172.9 | 206.0 |
| 2010 | 657 | 470 | 121 | 107.0 | 203.2 | 189.2 |
| 2011 | 725 | 483 | 127 | 133.7 | 248.5 | 369.4 |
| 2012 | 724 | 493 | 134 | 120.5 | 241.3 | 349.5 |
| 2013 | 729 | 493 | 121 | 125.0 | 252.6 | 294.1 |
| 2014 | 697 | 484 | 131 | 171.3 | 302.8 | 478.0 |
| 2015 | 705 | 467 | 127 | 126.1 | 180.9 | 263.9 |
| 2016 | 687 | 450 | 124 | 143.4 | 102.4 | 249.2 |
| 2017 | 692 | 460 | 130 | 102.5 | 168.6 | 354.1 |
| 2018 | 686 | 485 | 131 | 121.8 | 156.5 | 440.5 |
| 2019 | 649 | 497 | 139 | 101.5 | 187.9 | 324.8 |
| 2020 | 636 | 453 | 131 | 155.9 | 184.8 | 332.5 |
| 2021 | 677 | 474 | 124 | 189.5 | 176.2 | 566.5 |
An interesting pattern uncovered by Figure 11 is that large companies played a significant role in the recovery of the total export value to Chile in the post-pandemic period. In 2021, large enterprises accounted for 60.8% of the export value while small and medium-sized companies accounted for 20.3% and 18.9%, respectively. Moreover, small exporters were resilient to the economic downturn caused by the pandemic as both the number of exporters and the export value accounted for increased in 2021.
Trade by exporter characteristics for selected product groups
For a more detailed analysis of the evolution of exports from Canada to Chile from 2015 to 2020 by company size, a selected set of five product groups was studied: base metals (HS 72 to 83), electrical machinery (HS 85), machinery (HS 84), plastics and rubber (HS 39 to 40), and wood and pulp (HS 44 to 49). Together, these product groups accounted for 86% of Canadian companies exporting enterprises to Chile and for 20% of the value of all exports in 2020.
Overall, the number of exporters to Chile has been following a decreasing trend in all the product groups considered. Wood and pulp, and base metals registered the largest declines in the number of exporters, recording a decrease of 38.5% and 19.8%, respectively, between 2020 and 2015. Milder declines were seen in electrical machinery, with 15.5%, and machinery, 12.4%. In 2020, plastics and rubber mostly recovered the number of exporters to Chile reported in 2015, and the number of exporting enterprises only declined by 0.5% in this period (Table 4).
At the product group level, the bulk of exporters were SMEs, but the distribution of the number of exporters by company size exhibited some variations relative to the aggregate (Table 4). The highest share of large companies was recorded in the wood and pulp group, where nearly 25% of exporters to Chile were large companies, whereas machinery had the lowest share of large companies. On average, between 2015 and 2020, only 10% of machinery exporters were large companies. In the base metals and electrical machinery groups, SMEs made up, on average, 86% of exporters to Chile and large companies represented 14%. Similarly, in the plastics and rubber group, SMEs made up, on average, 87% of exporters, with the remaining 13% composed of large companies. The percentage of SMEs increased over time mainly due to a disproportionate reduction in the number of large companies exporting to Chile.
Table 4: Canadian exporters to Chile by HS group and company size, number of enterprises
| HS group | Company size | 2015 | 2016 | 2017 | 2018 | 2019 | 2020 |
|---|---|---|---|---|---|---|---|
| Base metals (HS 72‑83) | All | 217 | 199 | 205 | 191 | 191 | 174 |
| Large | 26 | 30 | 26 | 28 | 27 | 26 | |
| Small and medium | 191 | 169 | 179 | 163 | 164 | 148 | |
| Electrical machinery (HS 85) | All | 251 | 233 | 265 | 252 | 242 | 212 |
| Large | 29 | 32 | 36 | 36 | 35 | 30 | |
| Small and medium | 222 | 201 | 229 | 216 | 207 | 182 | |
| Machinery (HS 84) | All | 458 | 449 | 428 | 442 | 419 | 401 |
| Large | 44 | 39 | 47 | 43 | 42 | 46 | |
| Small and medium | 414 | 410 | 381 | 399 | 377 | 355 | |
| Plastics and rubber (HS 39, 40) | All | 202 | 210 | 212 | 198 | 179 | 201 |
| Large | 29 | 34 | 26 | 31 | 17 | 26 | |
| Small and medium | 173 | 176 | 186 | 167 | 162 | 175 | |
| Wood and pulp (HS 44-49) | All | 104 | 101 | 105 | 97 | 89 | 64 |
| Large | 25 | 26 | 25 | 26 | 19 | 15 | |
| Small and medium | 79 | 75 | 80 | 71 | 70 | 49 |
Data: Special tabulates provided by Statistics Canada
All five product groups reported large declines in the export value to Chile between 2015 and 2020 (Table 5). The three product groups with the largest declines were base metals with 60%, wood and pulp with 58% and plastics and rubber, 38%. Electrical machinery and machinery reported negative growth rates of 14% and 13%, respectively.
The distribution of export value to Chile by company size showed a substantial degree of variance across product groups. By far the most surprising shift in the composition of export value by company size was in plastics and rubber. In 2015, small and medium-sized enterprises in that group exported a total of
US$8.4 million to Chile, accounting for 17% of the total exports within that group. By 2020, SMEs more than doubled their exports, reaching almost US$16.9 million and accounting for 78% of the export value that year. To a lesser extent, SMEs increased their share of export value within the wood and pulp group, from 64% in 2015 to 74% in 2020. For the rest of the groups, the distribution of export value to Chile by company size was stable over the period of analysis. On average, SMEs traded most of the exports in base metals, accounting for 89% of export value, electrical machinery, with 57%, and machinery, 70%.
Table 5: Canadian exports to Chile by company size and HS group, 2015-2020, in US$ million
| HS group | Company size | 2015 | 2016 | 2017 | 2018 | 2019 | 2020 |
|---|---|---|---|---|---|---|---|
| Base metals (HS 72-83) | All | 32.3 | 22.3 | 15.7 | 17.7 | 17.0 | 13.0 |
| Large | 2.3 | 1.9 | 2.1 | 2.4 | 1.8 | 1.7 | |
| Small and medium | 30.0 | 20.4 | 13.6 | 15.3 | 15.2 | 11.3 | |
| Electrical machinery (HS 85) | All | 22.8 | 18.8 | 21.4 | 22.2 | 21.6 | 19.6 |
| Large | 7.7 | 8.0 | 8.9 | 11.8 | 9.8 | 7.9 | |
| Small and medium | 15.1 | 10.8 | 12.5 | 10.4 | 11.8 | 11.7 | |
| Machinery (HS 84) | All | 77.3 | 87.2 | 92.9 | 108.8 | 105.2 | 67.0 |
| Large | 23.2 | 28.0 | 34.1 | 32.2 | 28.4 | 16.7 | |
| Small and medium | 54.1 | 59.1 | 58.8 | 76.6 | 76.8 | 50.3 | |
| Plastics and rubber (HS 39, 40) | All | 48.7 | 26.7 | 25.3 | 23.5 | 18.2 | 21.8 |
| Large | 40.3 | 20.0 | 16.2 | 15.1 | 4.4 | 4.9 | |
| Small and medium | 8.4 | 6.7 | 9.0 | 8.4 | 13.8 | 16.9 | |
| Wood and pulp (HS 44‑49) | All | 9.6 | 16.0 | 14.3 | 7.5 | 10.2 | 6.0 |
| Large | 3.5 | 10.6 | 7.5 | 2.4 | 4.0 | 1.6 | |
| Small and medium | 6.1 | 5.4 | 6.8 | 5.1 | 6.2 | 4.4 |
Data: Special tabulates provided by Statistics Canada
Trade and gender
The most recent overhaul of the CCFTA is a modernization that was implemented in 2019. The modernized CCFTA includes a new chapter for sanitary and phytosanitary measures, a new chapter on technical barriers to trade, an improved investment chapter and technical amendments to the government procurement chapter. The Government of Canada broke new ground by incorporating a trade and gender chapter as part of the modernization process of the CCFTA. The chapter constituted a first in terms of Canadian FTAs and a first for any G20 country. Among its main objectives, the trade and gender chapter articulated the importance of applying a gender perspective in economic and trade issues to ensure inclusive economic growth, and provided a framework for Canada and Chile to collaborate on trade policy as it relates to gender.
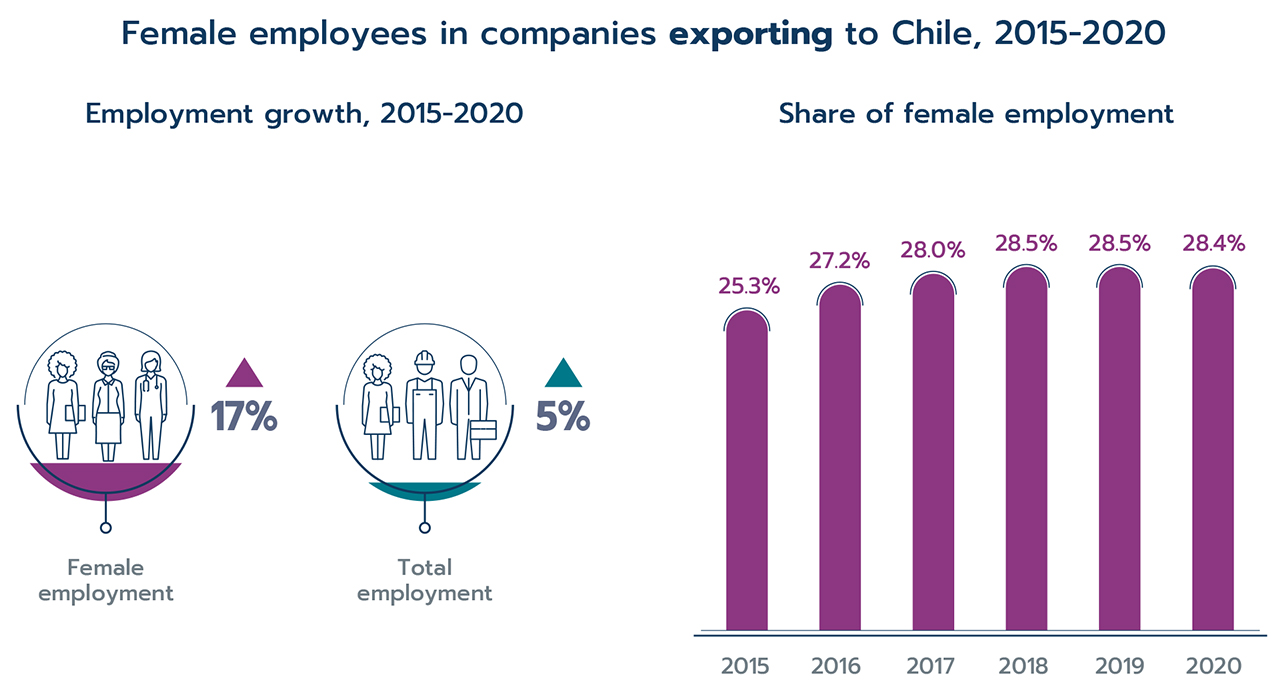
The availability of detailed company-level data enables the study of women employed by companies exporting to Chile. Between 2015 and 2020, the number of jobs occupied by women that support merchandise exports to Chile has grown vigorously. Female employment among Canadian exporters to Chile increased from 355,823 in 2015 to 417,831 in 2020, which is a net increase of 62,008 jobs occupied by female workers (Figure 12). Between 2019 and 2020, total employment among Canadian exporters to Chile fell abruptly due to disruptions caused by the COVID-19 pandemic. Interestingly, although female employment decreased, it declined less than total employment. Consequently, the share of female employment across exporters rose to 28% in 2020, compared to 25% in 2015.
Figure 12
Data: Special tabulates provided by Statistics Canada
Text version
Figure 12
| 2015-2020 | |
|---|---|
| Female employment growth | 17% |
| Total employment growth | 5% |
| 2015 | 2016 | 2017 | 2018 | 2019 | 2020 | |
|---|---|---|---|---|---|---|
| Share of female employment | 25.3% | 27.2% | 28.0% | 28.5% | 28.5% | 28.4% |
Trade in environmental goods
The original CCFTA included chapters to promote and encourage trade in environmental goods and green technologies. From 1996 to 2021, Canada's imports of environmental goods from Chile grew at an impressive compound annual growth rate of 15% (or by US$4.7 million). The value of Canada's exports of environmental goods to Chile grew at an annualized rate of 4.5% (or by US$52 million) over the same period.
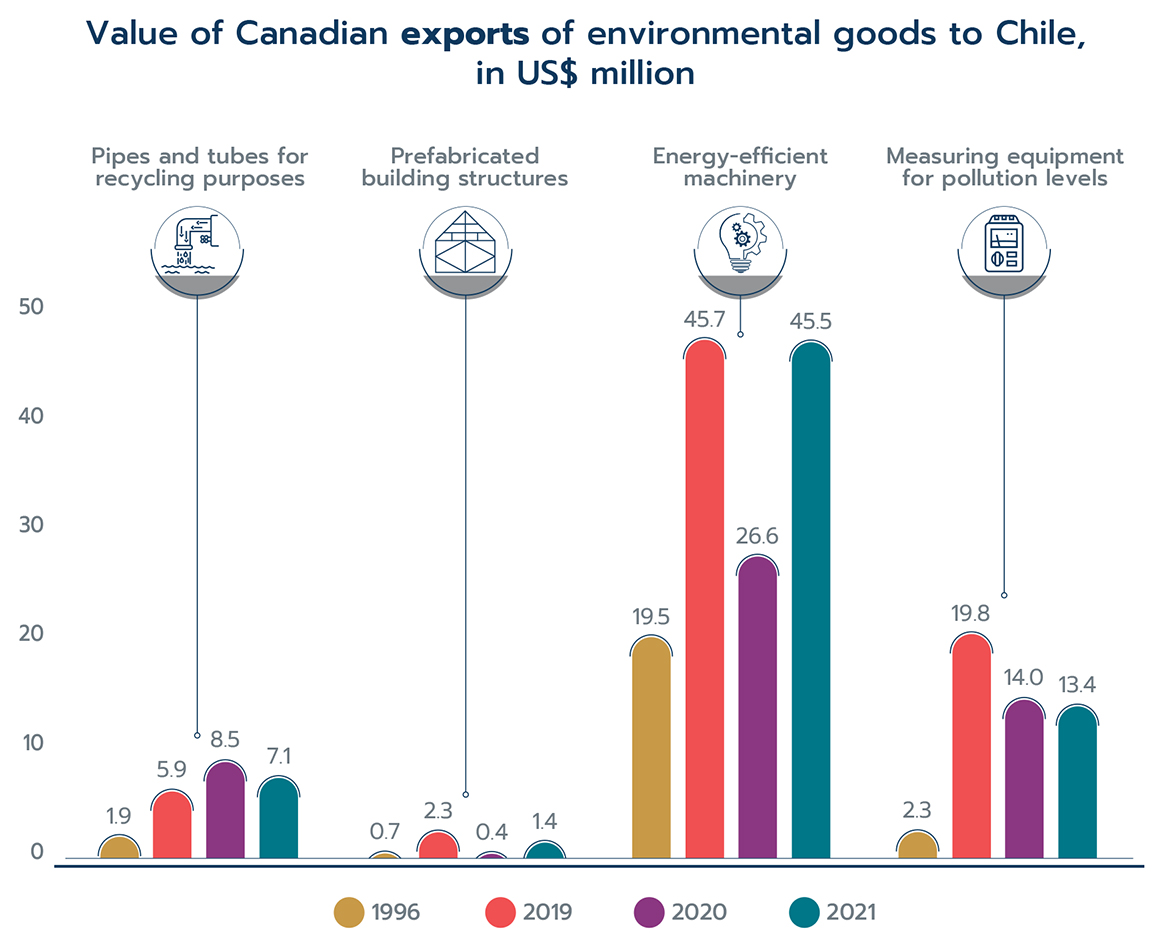
Figures 13 and 14 show changes in import and export value across four categories of environmental goods: pipes and tubes for recycling purposes (HS 39, 40), prefabricated building structures (HS 73), energy-efficient machinery (HS 84, 85) and measuring equipment for pollution levels (HS 90). Canada's imports of environmental goods from Chile reported large increases in pipes and tubes for recycling purposes, and energy-efficient machinery. The former increased from US$10,000 in 1996 to nearly US$1.16 million in 2021. The latter increased from US$106,000 in 1996 to US$1.1 million in 2021. Imports of prefabricated building structures from Chile increased by US$1.6 million between 1996 and 2019, but the import value largely contracted in 2020 and 2021.
Figure 13

Data: Statistics Canada
Text version
Figure 13
| 1996 (US$ M) | 2019 (US$ M) | 2020 (US$ M) | 2021 (US$ M) | |
|---|---|---|---|---|
| Pipes and tubes for recycling purposes | 0.01 | 0.69 | 0.95 | 1.16 |
| Prefabricated building structures | 0.02 | 1.62 | 0.15 | 0.23 |
| Energy-efficient machinery | 0.11 | 0.54 | 0.77 | 1.10 |
| Measuring equipment for pollution levels | 0.01 | 0.04 | 0.16 | 0.29 |
As for exports of environmental goods from Canada to Chile, the export value of energy-efficient machinery rose from US$19.5 million in 1996 to US$45.5 million in 2021. Canadian exports of measuring equipment for pollution levels to Chile expanded from US$2.3 million to US$13.4 million, after reaching a record high of US$19.8 million in 2019. Milder increases were observed in Canadian exports to Chile of pipes and tubes for recycling purposes, and prefabricated building structures.
Figure 14
Data: Statistics Canada
Text version
Figure 14
| 1996 (US$ M) | 2019 (US$ M) | 2020 (US$ M) | 2021 (US$ M) | |
|---|---|---|---|---|
| Pipes and tubes for recycling purposes | 1.9 | 5.9 | 8.5 | 7.1 |
| Prefabricated building structures | 0.7 | 2.3 | 0.4 | 1.4 |
| Energy-efficient machinery | 19.5 | 45.7 | 26.6 | 45.5 |
| Measuring equipment for pollution levels | 2.3 | 19.8 | 14.0 | 13.4 |
Investment
Chile already had a robust foreign direct investment (FDI) regime prior to the implementation of the CCFTA. The investment provisions contained in the CCFTA, which are along the lines of a standard foreign investment treaty, further enhance Chile's investment regime. Therefore, the agreement provides Canadian investors with greater confidence and certainty, which is expected to have a positive impact on Canadian direct investment flows into the Chilean economy.
Data for Canadian direct investment in Chile depict a clear upward trend since CCFTA implementation. The stock of Canadian direct investment in Chile grew almost sevenfold, up from US$2.8 billion in 1997 to a record high of US$18.8 billion in 2020, then down to US$17.8 billion in 2021 (Figure 15). As of 2021, Chile ranked as the 12th-most important destination for Canadian outward investment worldwide and the most important destination in South America.
Figure 15

Data: Statistics Canada, Table 36-10-0008-01
Text version
Figure 15
| Year | Canadian FDI in Chile (US$ B) |
|---|---|
| 1997 | 2.80 |
| 1998 | 3.29 |
| 1999 | 3.40 |
| 2000 | 3.65 |
| 2001 | 3.97 |
| 2002 | 4.23 |
| 2003 | 4.30 |
| 2004 | 4.33 |
| 2005 | 4.40 |
| 2006 | 4.08 |
| 2007 | 6.58 |
| 2008 | 10.17 |
| 2009 | 11.62 |
| 2010 | 11.69 |
| 2011 | 10.49 |
| 2012 | 17.09 |
| 2013 | 17.69 |
| 2014 | 16.98 |
| 2015 | 12.29 |
| 2016 | 13.30 |
| 2017 | 14.94 |
| 2018 | 18.71 |
| 2019 | 15.52 |
| 2020 | 18.79 |
| 2021 | 17.84 |
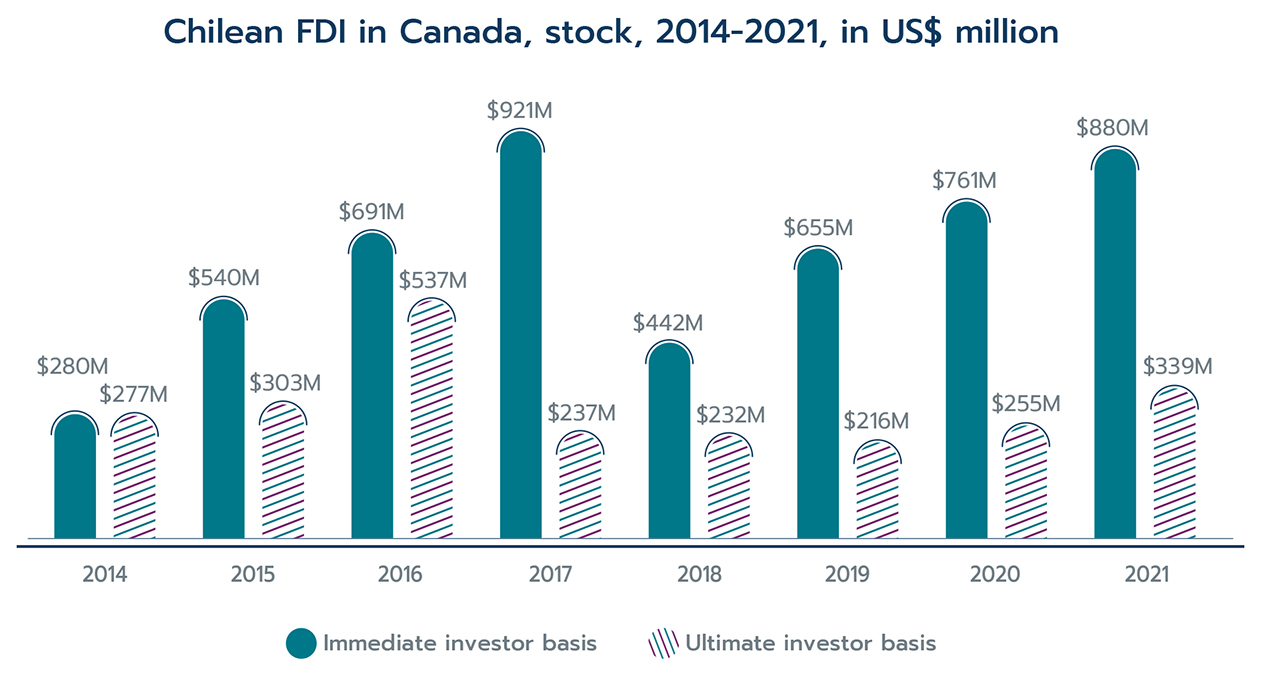
In 2021, the stock of the Chilean direct investment in Canada rose by US$119.2 million to reach
US$880.5 million, compared to US$761.3 million in 2020 (Figure 16). Although Chilean investors held only a small fraction of foreign direct investments in Canada (approximately 0.10%), Chile had the second-largest Canadian holdings among South American countries, only surpassed by Brazil.
Figure 16
Data: Statistics Canada, tables 36-10-0008-01 and 36-10-0433-01
Text version
Figure 16
| 2014 (US$ M) | 2015 (US$ M) | 2016 (US$ M) | 2017 (US$ M) | 2018 (US$ M) | 2019 (US$ M) | 2020 (US$ M) | 2021 (US$ M) | |
|---|---|---|---|---|---|---|---|---|
| Chilean FDI in Canada, immediate investor basis | 280.6 | 540.4 | 691.0 | 920.7 | 442.2 | 655.0 | 761.3 | 880.5 |
| Chilean FDI in Canada, ultimate investor basis | 277.0 | 302.6 | 537.1 | 236.5 | 231.5 | 216.3 | 255.0 | 338.9 |
Foreign direct investment in Canada can also be measured on an ultimate investor country basis to show the country that ultimately controls the investment in Canada. FDI from Chile on an ultimate investor country basis tells a different story, with only US$338.9 million of Canadian investments controlled by Chile in 2021. This indicates that at least US$541.6 million (nearly 62%) of Chilean FDI on an immediate investor basis was ultimately from other source countries.
Services trade
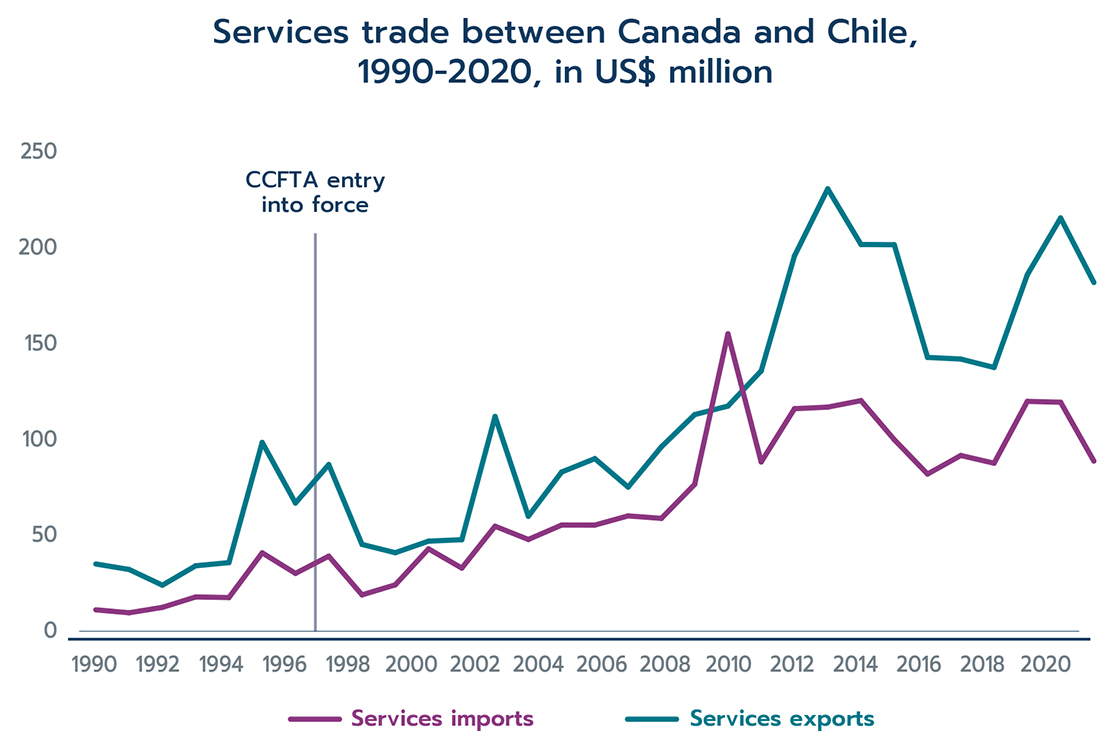
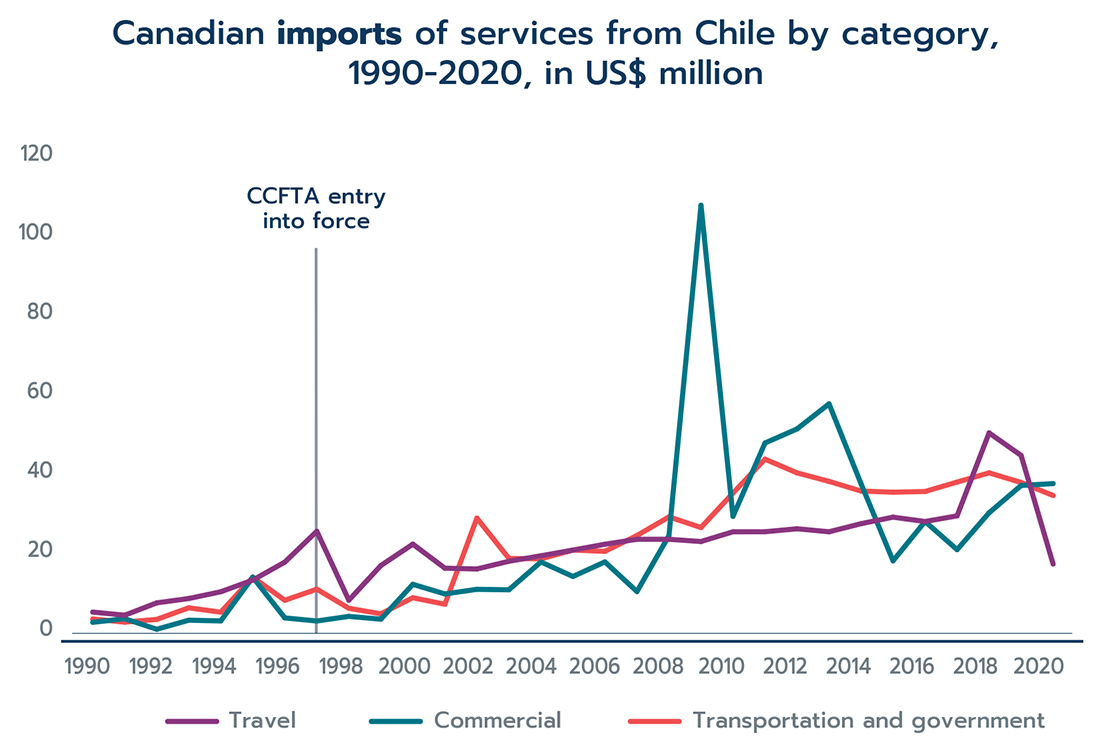
Both Canada and Chile have seen outstanding growth in services trade since the CCFTA was implemented in 1997 (Figure 17). Canadian imports of services from Chile grew by US$58.7 million at an annualized growth rate of 4.6%, increasing from US$30.1 million in 1996 to nearly US$88.8 million in 2020. Canada's imports from Chile reached a record high of US$155.3 million in 2009. Across categories, most of the growth was driven by increases in imports of commercial services, up US$33.6 million from 1996 to 2020, and transportation and government services, up US$26.2 million (Figure 18). These data imply annualized growth rates of 10.1% in commercial services and 6.2% in transportation and government services. On the other hand, imports of travel services recorded a slight decline of US$500,000, equivalent to an annualized growth rate of -0.1%.
Figure 17
Data: Statistics Canada, table 36-10-0007-01
Text version
Figure 17
| Year | Services imports (US$ M) | Services exports (US$ M) |
|---|---|---|
| 1990 | 11.1 | 35.0 |
| 1991 | 9.6 | 32.2 |
| 1992 | 12.4 | 24.0 |
| 1993 | 17.8 | 34.1 |
| 1994 | 17.5 | 35.8 |
| 1995 | 40.9 | 98.5 |
| 1996 | 30.1 | 66.9 |
| 1997 | 39.1 | 87.0 |
| 1998 | 18.9 | 45.3 |
| 1999 | 24.2 | 40.9 |
| 2000 | 43.0 | 47.0 |
| 2001 | 32.9 | 47.7 |
| 2002 | 54.8 | 112.1 |
| 2003 | 47.9 | 60.0 |
| 2004 | 55.4 | 83.1 |
| 2005 | 55.4 | 90.1 |
| 2006 | 60.2 | 75.2 |
| 2007 | 58.9 | 96.3 |
| 2008 | 76.6 | 113.1 |
| 2009 | 155.3 | 117.5 |
| 2010 | 88.3 | 135.9 |
| 2011 | 116.2 | 196.0 |
| 2012 | 117.0 | 231.0 |
| 2013 | 120.4 | 201.9 |
| 2014 | 100.0 | 201.8 |
| 2015 | 82.0 | 143.0 |
| 2016 | 91.7 | 142.1 |
| 2017 | 87.7 | 137.7 |
| 2018 | 120.0 | 186.2 |
| 2019 | 119.5 | 215.8 |
| 2020 | 88.8 | 182.1 |
The negative impacts of COVID-19 public health restrictions imposed in 2020 considerably restricted trade in services between Canada and Chile. With respect to 2019, Canadian services imports from Chile fell by 25.7% or US$30.7 million in 2020. These negative impacts were mostly concentrated in categories involving face-to-face interactions; travel services decreased by 61.3% or US$27.2 million and transportation and government services, by 8.7% or US$3.3 million. Imports of commercial services from Chile increased by 1.3% to reach US$37.3 million in 2020.
Figure 18
Data: Statistics Canada, Table 36-10-0007-01
Text version
Figure 18
| Travel (US$ M) | Commercial (US$ M) | Transportation and government (US$ M) | |
|---|---|---|---|
| 1990 | 5.1 | 2.6 | 3.4 |
| 1991 | 4.3 | 3.5 | 2.6 |
| 1992 | 7.4 | 0.8 | 3.3 |
| 1993 | 8.5 | 3.1 | 6.2 |
| 1994 | 10.2 | 2.9 | 5.1 |
| 1995 | 13.1 | 13.9 | 13.9 |
| 1996 | 17.6 | 3.7 | 8.1 |
| 1997 | 25.4 | 2.9 | 10.9 |
| 1998 | 8.1 | 4.1 | 6.1 |
| 1999 | 16.8 | 3.4 | 4.7 |
| 2000 | 22.1 | 12.1 | 8.7 |
| 2001 | 16.1 | 9.7 | 7.1 |
| 2002 | 15.9 | 10.8 | 28.7 |
| 2003 | 17.9 | 10.7 | 18.6 |
| 2004 | 19.2 | 17.7 | 18.5 |
| 2005 | 20.7 | 14.0 | 20.7 |
| 2006 | 22.1 | 17.7 | 20.4 |
| 2007 | 23.4 | 10.3 | 24.3 |
| 2008 | 23.4 | 24.3 | 29.0 |
| 2009 | 22.8 | 107.0 | 26.3 |
| 2010 | 25.2 | 29.1 | 35.0 |
| 2011 | 25.3 | 47.5 | 43.4 |
| 2012 | 26.0 | 51.0 | 40.0 |
| 2013 | 25.2 | 57.3 | 37.9 |
| 2014 | 27.3 | 37.3 | 35.5 |
| 2015 | 28.9 | 18.0 | 35.2 |
| 2016 | 27.8 | 27.8 | 35.3 |
| 2017 | 29.2 | 20.8 | 37.7 |
| 2018 | 50.0 | 30.0 | 40.0 |
| 2019 | 44.4 | 36.8 | 37.6 |
| 2020 | 17.2 | 37.3 | 34.3 |
Canadian exports of services to Chile grew from US$67 million in 1996 to nearly US$182 million in 2020, reaching a compound annual growth rate of 4.3%. The peak was achieved in 2011, when exports of services to Chile were US$231 million. The growth in exports of services to Chile between 1996 and 2020 was sparked by exports of commercial services, which increased by US$58.7 million, implying an annual growth rate of 5.1%. Exports of travel services and transportation and government services grew at modest annualized rates of 1.6% (US$6.2 million) and 1.8% (US$3.8 million), respectively (Figure 19).
Figure 19

Data: Statistics Canada, Table 36-10-0007-01
Text version
Figure 19
| Travel (US$ M) | Commercial (US$ M) | Transportation and government (US$ M) | |
|---|---|---|---|
| 1990 | 16.2 | 10.3 | 7.7 |
| 1991 | 12.2 | 12.2 | 7.8 |
| 1992 | 9.9 | 7.4 | 6.6 |
| 1993 | 8.5 | 19.4 | 7.0 |
| 1994 | 8.8 | 19.7 | 8.0 |
| 1995 | 11.7 | 77.4 | 9.5 |
| 1996 | 13.2 | 45.6 | 7.4 |
| 1997 | 9.4 | 71.0 | 6.5 |
| 1998 | 12.2 | 25.7 | 8.1 |
| 1999 | 10.1 | 25.5 | 5.4 |
| 2000 | 9.4 | 30.9 | 6.0 |
| 2001 | 9.7 | 32.3 | 5.8 |
| 2002 | 11.5 | 94.3 | 6.4 |
| 2003 | 7.9 | 45.0 | 7.1 |
| 2004 | 12.3 | 57.7 | 13.1 |
| 2005 | 17.4 | 55.4 | 17.4 |
| 2006 | 20.4 | 37.2 | 17.7 |
| 2007 | 19.6 | 57.9 | 18.7 |
| 2008 | 20.6 | 72.0 | 20.6 |
| 2009 | 21.1 | 80.7 | 15.8 |
| 2010 | 28.2 | 87.4 | 21.4 |
| 2011 | 29.3 | 144.4 | 22.2 |
| 2012 | 34.0 | 178.0 | 19.0 |
| 2013 | 37.9 | 146.6 | 17.5 |
| 2014 | 28.2 | 157.3 | 16.4 |
| 2015 | 34.4 | 93.8 | 14.8 |
| 2016 | 32.3 | 94.0 | 16.5 |
| 2017 | 43.1 | 76.2 | 18.5 |
| 2018 | 45.4 | 119.2 | 21.5 |
| 2019 | 48.9 | 147.4 | 20.3 |
| 2020 | 19.4 | 151.5 | 11.2 |
At the onset of the COVID-19 pandemic and subsequent lockdown measures, services exports to Chile strongly contracted. Exports of services to Chile declined by 15.6% between 2020 and 2019; travel and transportation and government services recorded the largest contractions by falling by 60.3% and 44.9%, respectively. Surprisingly, exports of commercial services to Chile continued to grow in 2020 and registered an increase of 2.8% (or US$4.1 million) relative to 2019.
Utilization of CCFTA preferences
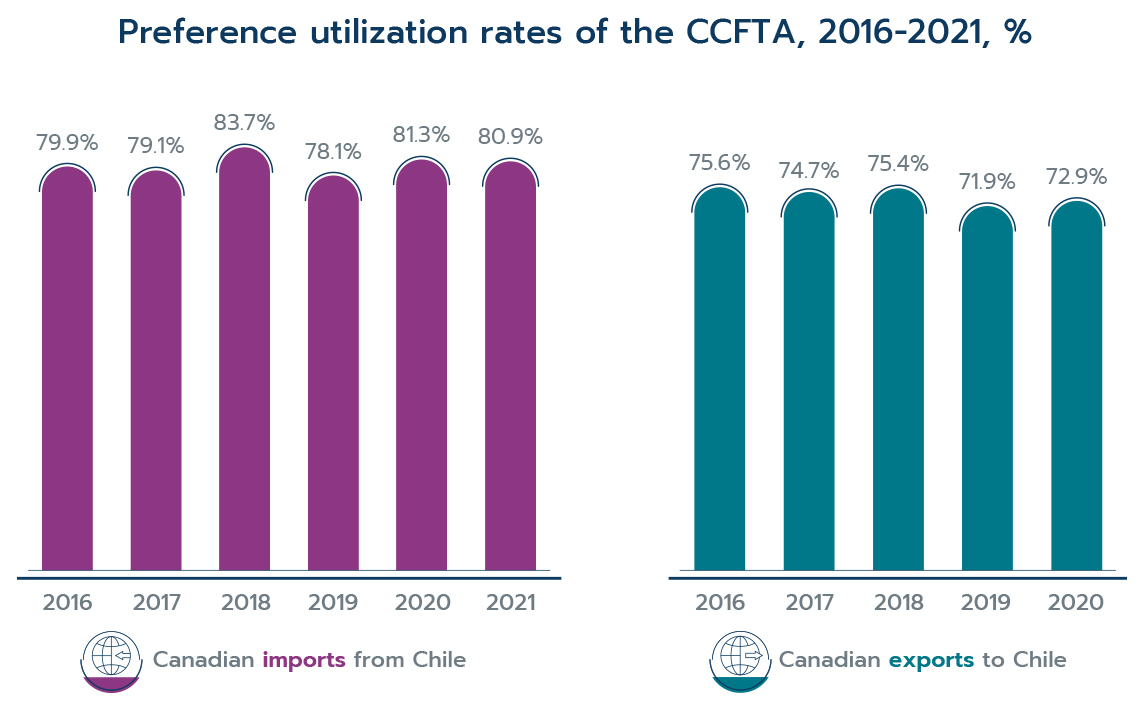
A key indicator in determining whether FTA partners are using the benefits provided by the trade agreement is the preference utilization rate. This rate measures to what extent businesses from the partner countries are claiming the preferences offered by the agreement, assuming they can demonstrate they meet the requirements to receive the preferential tariffs. The preference utilization rate is an important indicator that can be used to monitor the extent to which trade agreements are utilized.
The preference utilization rate of the CCFTA is calculated as the value of imports that claimed preferential treatment divided by the value of imports that were eligible to receive CCFTA preferences. Imports that do not claim or qualify to receive the CCFTA preferences (for instance, if they do not meet rules-of-origin requirements) would have to pay the MFN duties at the border. Preference utilization rates have been calculated for the period going from 2016 and 2021 for Canadian imports from Chile and from 2016 to 2020 for Chilean imports from Canada (Figure 20).
The level of utilization of the CCFTA preferences has been high and relatively stable over the period (Figure 20). In 2021, nearly 81% of eligible merchandise imports from Chile claimed CCFTA preferences, while in 2020, 72.9% of Chilean importers of Canadian merchandize utilized CCFTA preferences.
Figure 20
Note: 2021 preference utilization data in Chile was not available at the time this report was written.
Data: Statistics Canada, Government of Chile
Text version
Figure 20
| 2016 | 2017 | 2018 | 2019 | 2020 | 2021 | |
|---|---|---|---|---|---|---|
| Canadian imports from Chile | 79.9% | 79.1% | 83.7% | 78.1% | 81.3% | 80.9% |
| Canadian exports to Chile | 75.6% | 74.7% | 75.4% | 71.9% | 72.9% |
At the sector level, the utilization rate of CCFTA preferences for Canadian exports to Chile varied significantly; in 2020, more than half of the HS chapters recorded utilization rates higher than 60%. Figure 21 shows the sectors with the highest utilization of CCFTA preferences for Canadian exports to Chile. Among the sectors with almost full utilization rates are meat and edible meat offal (HS 2), explosives; pyrotechnic products; matches (HS 36), dairy produce; birds' eggs; natural honey (HS 4), animal or vegetable fats and oils (HS 15), and preparations of cereals, flour, starch or milk (HS 19).
Figure 21

Data: Government of Chile
Text version
Figure 21
| CCFTA-eligible exports (US$ M) | Utilization rate (%) | |
|---|---|---|
| Preparations of cereals | 9.3 | 99.8 |
| Fats and oils | 105.1 | 99.9 |
| Dairy and related | 1.8 | 100.0 |
| Explosives and related | 6.3 | 100.0 |
| Meat | 11.0 | 100.0 |
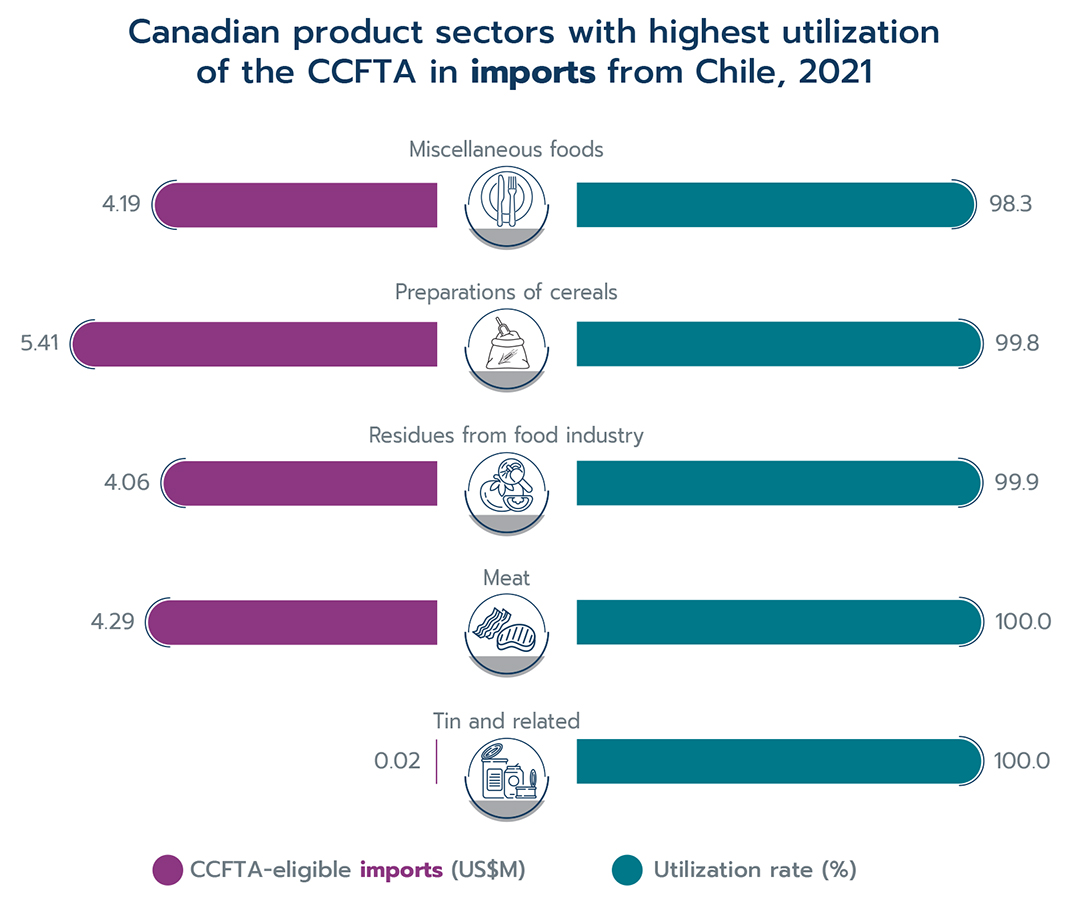
Canadian import sectors with the largest utilization rates of CCFTA preferences in 2021 include tin and articles thereof (HS 80) and meat and edible meat offal (HS 2), which reported utilization rates close to 100%. The list of top sectors is completed by residues and waste from the food industries (HS 11), preparations of cereals, flour, starch or milk (HS 19), and miscellaneous edible preparations (HS 21) with preference utilization rates of 99.9%, 99.8% and 98.3%, respectively (Figure 22).
Figure 22
Data: Statistics Canada
Text version
Figure 22
| CCFTA-eligible imports (US$ M) | Utilization rate (%) | |
|---|---|---|
| Miscellaneous foods | 4.19 | 98.3 |
| Preparations of cereals | 5.41 | 99.8 |
| Residues from food industry | 4.06 | 99.9 |
| Meat | 4.29 | 100.0 |
| Tin and related | 0.02 | 100.0 |
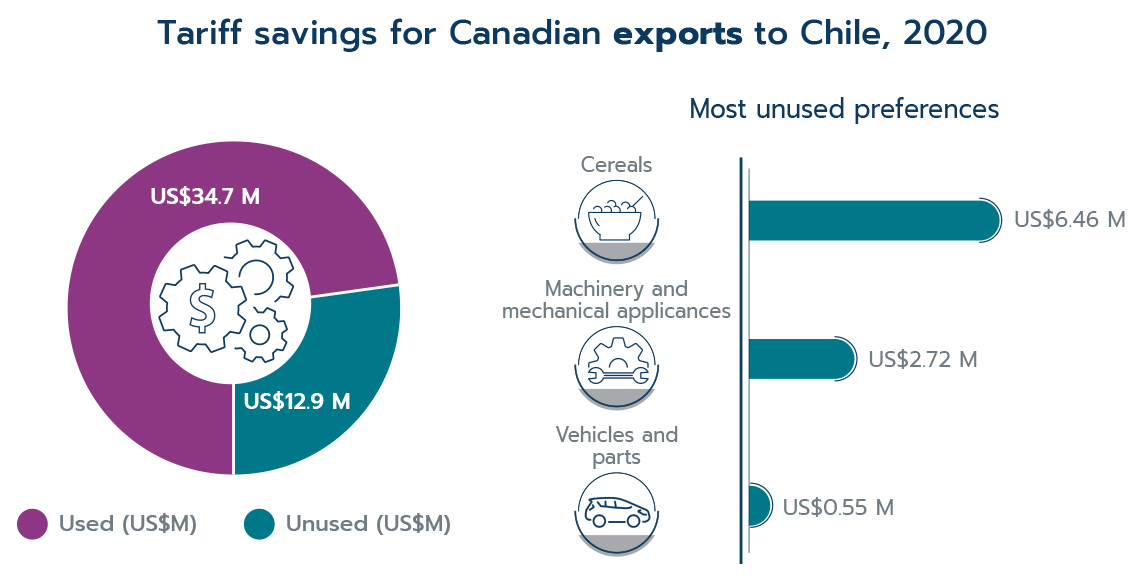
Tariff reductions enjoyed by Canadian products exported to Chile can contribute to lower prices and improve competitiveness of Canadian companies in the Chilean market. Close to US$793.4-million worth of Canadian exports were eligible to receive CCFTA preferences in 2020, and Canadian companies saved an estimated US$34.7 million in duties (Figure 23). Given that the CCFTA preferences are not fully utilized, however, an additional US$12.9 million of duty savings were not realized (assuming the traded goods qualify for duty-free status under the CCFTA). Among the sectors with the most unused tariff savings were cereals (approximately US$6.5 million), machinery and mechanical appliances (approximately US$2.7 million), and vehicles and parts (approximately US$550,000).
Figure 23
Data: Government of Chile
Text version
Figure 23
Tariff savings for Canadian exports to Chile, 2020
Used US$ 34.7 M
Unused US$ 12.9 M
Canada exports to Chile: Most unused preferences
Cereals US$ 6.46 M
Machinery and mechanical appliances US$ 2.72 M
Vehicles and parts US$ 0.55 M
The benefits of tariff savings can also pass to Canadian consumers, who could see lower prices for Chilean imports. In 2021, total Canadian imports from Chile covered by the CCFTA amounted to almost US$167.1 million. While US$5.9 million in duties have been saved (Figure 24), as much as US$1.6 million in paid duties might have been avoided if CCFTA preferences were fully utilized. The sectors with large amounts of unused tariff savings include rubber (approximately US$1.2 million), animal and vegetable fats and oils (approximately US$60,000) and beverages, spirits and vinegar (approximately US$50,000).
Figure 24

Data: Statistics Canada
Text version
Figure 24
Tariff savings for Canadian imports from Chile, 2021
Used US$ 5.9 M Unused US$ 1.6 M
Canada imports from Chile: Most unused preferences
Rubber and related US$ 1.18 M
Fats and oils US$ 0.06 M
Beverages and related US$ 0.05 M
Assessing the effects of the CCFTA on trade
Average treatment effect of the CCFTA
It is clear that bilateral trade between Canada and Chile has expanded considerably since the agreement entered into force in 1997. Not all the expansion in trade can be attributed to the CCFTA, however, because international trade is influenced by a variety of other factors, such as changes in the exchange rate, commodity prices and market conditions in partner countries. In addition, much like stock markets, prices and GDP, international trade tends to increase over time, which makes isolating the effect of any one policy difficult. As a result, more rigorous analysis needs to be undertaken to estimate the effect the CCFTA had on bilateral trade between Canada and Chile.
For this analysis, the average treatment effect (ATE) methodology is used. This methodology aims to measure the extent to which a free trade agreement increases trade flows between trading partners by comparing the growth in trade under the agreement (the treated products) to a second set of products not affected by the CCFTA (the untreated products). This comparison gives the average treatment effect of the agreement.
The difficulty in this analysis lies in selecting the untreated products. In an ideal world, the best comparison would be the level of bilateral trade between Canada and Chile if an agreement had never been signed—a counterfactual scenario. This scenario is not observable in the data because the agreement was signed and implemented in 1997. Instead, the second-best option is to find for each traded product between Canada and Chile a similar product where the main difference between the two products is that one was treated by the CCFTA, and the matched product was not. These matched products then become part of the counterfactual scenario; since they were so similar to the products traded between Canada and Chile, it is possible to observe how they grew over time while not being affected by the CCFTA. The difference in growth rates between CCFTA-treated products and the matched untreated products is the average treatment effect, or the average effect the CCFTA had on bilateral trade growth between Canada and Chile.
The ATE technique offers some advantages relative to alternative methods. It establishes a casual link between the treatment—in this case, the CCFTA—and the trade performance. It also allows the creation of a valid counterfactual scenario that would otherwise be unobservable. Finally, the approach allows for extension and for the incorporation of regression methods that control for other covariates and improve the precision of the estimates. A more detailed explanation of the dataset creation, the models used for the analysis and more technical discussion is available in the appendix. This section presents the high-level results from the analysis.
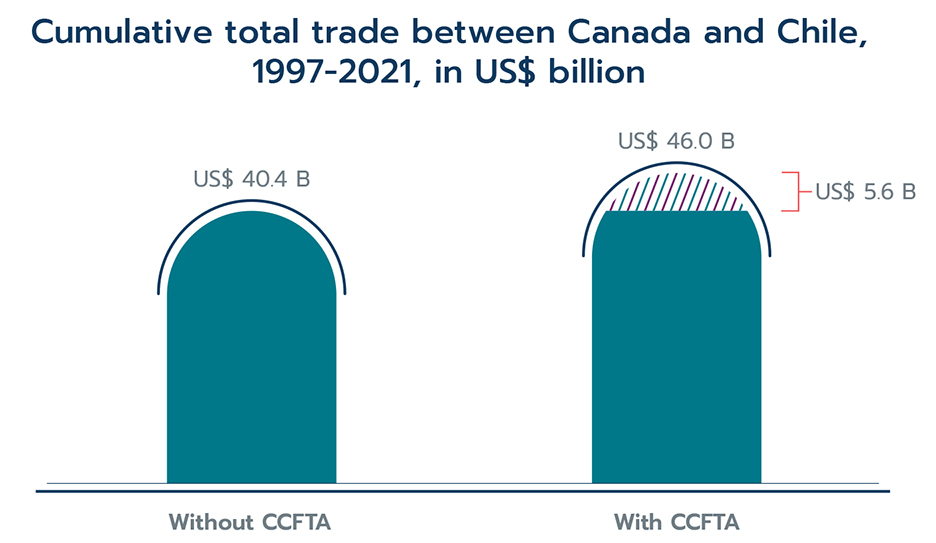
Overall, the average treatment effect analysis finds that the CCFTA increased trade between Canada and Chile by 13% per year on average. This is to say that the CCFTA enabled bilateral trade to grow by 13% more every year on average compared to trade not affected by the CCFTA. Over the length of the agreement, this estimated 13% additional trade growth is substantial: in 2021, the total cumulative effect of the CCFTA on trade between Canada and Chile reached US$5.6 billion (Figure 25).
Figure 25
Note: Based on the estimated average treatment effect of the CCFTA
Data: United Nations Comtrade database
Text version
Figure 25
Cumulative total trade between Canada and Chile 1997-2021 in US$ billion
Without CCFTA 40.4
With CCFTA 46.0
Cumulative effect of CCFTA 5.6
Trade in intensive and extensive margins
The data presented above support the view that the CCFTA had a significant trade-enhancing effect on bilateral trade between Canada and Chile. The analysis, however, does not describe whether the gains from trade were concentrated in products that Canada and Chile traded prior to the agreement (known as the intensive margin) or products that started to be traded after the CCFTA was implemented (the extensive margin). This is an important consideration because while free trade agreements can enhance trade where trade already exists, it is generally believed that FTAs can reduce barriers to trade that prevented or limited trade from taking place. This section examines whether the CCFTA was successful in creating trade in the intensive and extensive margins.
For this purpose, the methodology proposed by Kehoe and Ruhl (2013)Footnote 4 is adopted. This methodology provides a measure of the extensive margin by focusing on the set of products that had zero trade before the CCFTA entered into force, as well as products with small but positive trade values. This set of products is denoted as the least-traded products. To construct the set of least-traded products, all the HS 8-digit product codes are ordered by their average value of trade in the pre-CCFTA period ranging from 1992 to 1996. Taking the average value over five years reduces the dependence of the results on the choice of the base year. The ordered products codes are combined to form 10 sets, where each set represents one tenth of the total import or export value in the base year (in this case, 1992). The first set, which is the set of least-traded products, is constructed starting with the codes with zero average trade value and following with codes with the smallest amount of trade. Product codes are added until the sum of their trade reaches one tenth of the total import or export value in 1992. The next set is formed by summing the smallest remaining codes until the value of the set reaches the next one tenth of the import or export value in 1992, and so on. It is worth mentioning that to create sets that account exactly one tenth of total trade, some product codes must be split across different sets.
Figure 26
Data: Statistics Canada
Text version
Figure 26
| 1992 | 2021 | |
|---|---|---|
| Share of export value of least traded products | 10% | 58% |
| Share of export value of products not traded before CCFTA | 0% | 44% |
| Share of import value of least traded products | 10% | 37% |
| Share of import value of products not traded before CCFTA | 0% | 11% |
Figure 26 shows that the first group—the group of products that had zero trade and very small but positive trade—went from accounting for 10% of exports in 1992 to 58% in 2021. In addition, much of the export increase comes from products that were previously not traded before the CCFTA came into effect. Similarly, on the import side, products in the first group went from accounting for 10% of imports in 1992 to 37% in 2021. Most of the growth for imports of least-traded products were products that had very small, but positive, trade prior to the CCFTA.
Figure 27
Data: Statistics Canada
Text version
Figure 27
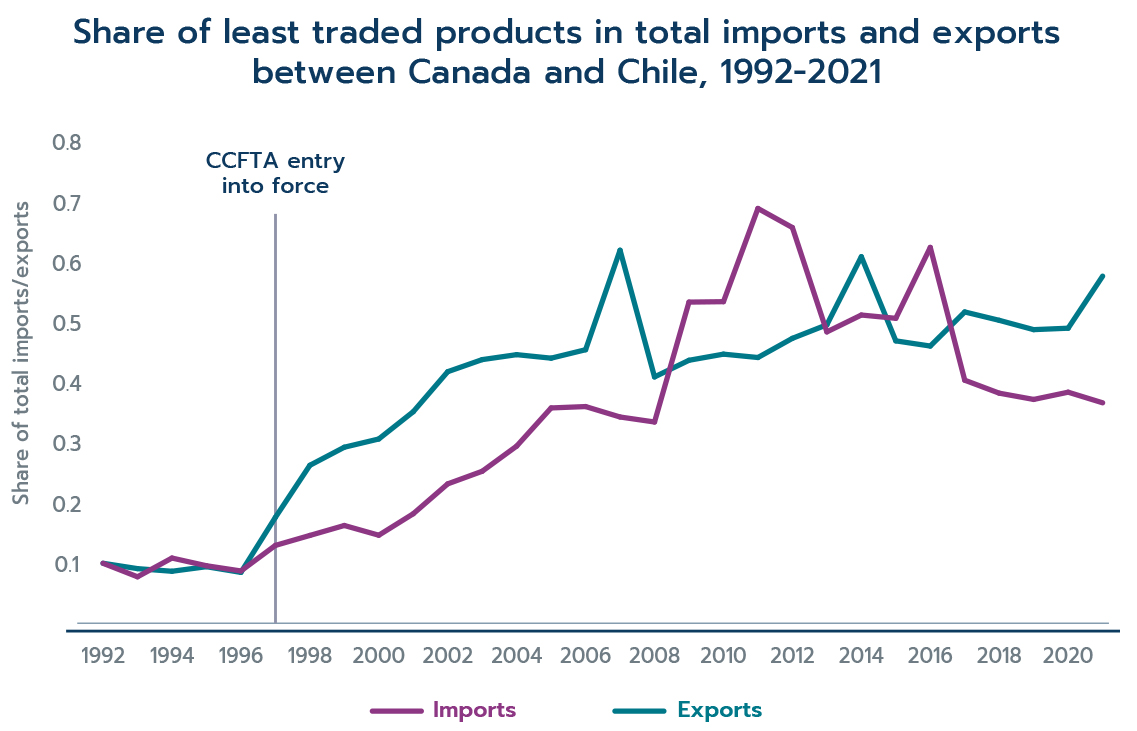
| Year | Share of least traded products in Canadian imports from Chile | Share of least traded products in Canadian exports to Chile |
|---|---|---|
| 1992 | 0.10 | 0.10 |
| 1993 | 0.08 | 0.09 |
| 1994 | 0.11 | 0.09 |
| 1995 | 0.10 | 0.09 |
| 1996 | 0.09 | 0.08 |
| 1997 | 0.13 | 0.18 |
| 1998 | 0.15 | 0.26 |
| 1999 | 0.16 | 0.29 |
| 2000 | 0.15 | 0.31 |
| 2001 | 0.18 | 0.35 |
| 2002 | 0.23 | 0.42 |
| 2003 | 0.25 | 0.44 |
| 2004 | 0.29 | 0.45 |
| 2005 | 0.36 | 0.44 |
| 2006 | 0.36 | 0.45 |
| 2007 | 0.34 | 0.62 |
| 2008 | 0.33 | 0.41 |
| 2009 | 0.53 | 0.44 |
| 2010 | 0.53 | 0.45 |
| 2011 | 0.69 | 0.44 |
| 2012 | 0.66 | 0.47 |
| 2013 | 0.48 | 0.50 |
| 2014 | 0.51 | 0.61 |
| 2015 | 0.51 | 0.47 |
| 2016 | 0.62 | 0.46 |
| 2017 | 0.40 | 0.52 |
| 2018 | 0.38 | 0.50 |
| 2019 | 0.37 | 0.49 |
| 2020 | 0.38 | 0.49 |
| 2021 | 0.37 | 0.58 |
Figure 27 demonstrates how trade in least-traded products evolved since the CCFTA was signed. It can be observed that the growth in the least-traded products—the extensive margin—coincided with the signing of the CCFTA. Moreover, the years in which the extensive margin grew at a fast pace either overlap or precede the periods of accelerated growth in Canada's trade with Chile, reinforcing the idea that the extensive margin played a significant role in explaining the observed growth in bilateral trade flows between Canada and Chile. A gravity model analysis confirms that the CCFTA positively and significantly affected the extensive margin of trade between Canada and Chile. More details on the gravity model analysis are available in the appendix.
Conclusion
Trade between Canada and Chile has seen an impressive growth since the CCFTA entered into force in 1997. Canadian imports of merchandise from Chile expanded from US$235 million in 1997 to US$1.4 billion in 2021, implying a compound annual rate growth of 7.8%. In the same period, Canadian merchandise exports to Chile rose to an annualized rate of 5.3%, going from US$283 million in to more than US$972 million.
Estimates presented in this analysis show that trade between Canada and Chile grew on average 13% faster per year due to the CCFTA. This is a substantial increase in trade. Over the course of the agreement, its total cumulative effect on trade between Canada and Chile reached US$5.6 billion in 2021. This figure represents trade that would not have existed if the CCFTA were not signed.
This analysis also found that an important part of the trade gains came from products that were not previously traded or traded in small quantities prior to the CCFTA. The least-traded products that accounted for 10% of Canadian exports to Chile in 1992 accounted for 58% in 2021. Similarly, the least-traded products that accounted for 10% of Canadian imports from Chile in 1992 accounted for 37% in 2021. Additionally, after the entry into force and implementation period of the CCFTA, the relative contribution of least-traded products to Canada's total trade with Chile substantially increased, suggesting that the extensive margin played a significant role in explaining the observed expansion in bilateral trade flows.
Moreover, Canadian imports from Chile of products that saw the largest tariff reductions between 1996 and 2021 also experienced the largest growth rates. Imports of products with a tariff reduction between 5 and 10 percentage points and more than 10 percentage points recorded annualized rates of 10.2% and 9.8%, respectively. Canada's imports of duty-free products grew by 7.4%, and for products with tariff reductions between zero and 5%, by 4.4%.
Small and medium-sized enterprises represented almost 90% of the total number of Canadian companies exporting to Chile and accounted for half of the value exported between 2005 and 2021.
Furthermore, the CCFTA generated benefits beyond those associated with tariff elimination. Measures to liberalize investment and services, along with the improved certainty under the CCFTA, have manifested in substantial increases in investment value, trade in environmental goods and trade in services with Chile. The stock of Canadian direct investment in Chile grew almost sevenfold, up from US$2.8 billion in 1997 to a record high of US$18.8 billion in 2020, and then down to US$17.8 billion in 2021. Canada's imports of environmental goods from Chile grew at a compound annual rate of 15%, or by US$4.7 million. The value of Canada's exports of environmental goods to Chile grew at an annualized rate of 4.5% or by US$52 million over the same period. Canadian exports of services to Chile grew from US$67 million in 1996 to nearly US$182 million in 2020, reaching a compound annual growth rate of 4.3%, while imports of services from Chile grew by US$58.7 at an annualized growth rate of 4.6% over the same period.
In 2017, the Government of Canada broke new ground by incorporating a trade and gender chapter as part of the modernization process of the CCFTA. Since then, women have increased their involvement in trade with Chile in terms of employment. The share of female employees within Canadian exporters to Chile was up from 25% in 2015 to 28% in 2020, representing an increase of 62,008 jobs occupied by female workers.
Appendixes
Technical discussion on the average treatment effect estimation
As previously discussed, the entirety of growth in bilateral trade between Canada and Chile over the last 25 years cannot be attributed to the CCFTA alone. This section explains the average treatment effect (ATE) analysis that is used to estimate the impact of the CCFTA on Canada-Chile bilateral trade.
The analysis is conducted using a dataset containing bilateral trade flows, tariffs and characteristics of Canada and its top trading partners. Bilateral trade data at the HS 6 product level from 1995 to 2019 is obtained from the United Nations Comtrade database.Footnote 5 Tariff data for the same period is obtained from World Integrated Trade Solutions and is aggregated at the HS 6 product level.Footnote 6 Structural variables at the country level, such as GDP, GDP per capita and population, are taken from the international economic research institute CEPII's gravity database.Footnote 7
The estimation of the ATE of the CCFTA is performed in two stages.
In the first stage, the likelihood of having received preferential treatment (called the propensity score) is estimated over the full sample by means of a probit regression. With the propensity scores generated, each of the observations in the "treated" group is matched with an equivalent observation in the "control" group. The purpose of calculating the propensity scores is to select two balanced groups of observations with their only apparent difference being whether they have received treatment. In this sample, an observation corresponds to a product k imported by country i from country j in time t. The treated group contains all the observations in which the importing country is Canada, the exporting country is Chile (or vice versa) and the year is equal to or greater than 1997. Similarly, the control group contains all the other products traded between pairs of countries that do not belong to the CCFTA, or products traded between Canada and Chile before 1997. Henceforth, the sample for the subsequent analysis would include only observations from the treated group and the propensity-score-matched observations from the control group.
Once the matched dataset is constructed, the second stage is to estimate the average treatment effect of the CCFTA using the inverse-probability-weighted estimator. The baseline estimating equation is:

Text version
lnyijkt is equal to alpha plus beta1 times CCFTAijt plus beta2 times Tijkt plus beta3 times lnGDPit plus beta4 times lnGDPjt plus epsilonjkt
where ln yijkt represents the logarithm of the imports by country i from county j of product k in time t; the treatment variable is denoted by CCFTAijt which is a binary variable that takes a value of 1 whenever country i and country j are Canada and Chile (or vice versa) and t ≥ 1997, and 0 otherwise; Tijkt denotes one plus the tariff of product k applied from country i to county j at time t; ln GDPit and ln GDPjt represents the logarithm of the GDP at a specific time t of countries i and j, respectively; and Eijkt is the error term. However, this baseline specification lacks sufficient control variables to control for variation in the estimation. As such, this equation is augmented, as explained below.
In the baseline specification, the outcome variable contains four dimensions (product k, country i, country j and time t), and most of the controls employed only include two dimensions (country i or j and time t), leaving much of rest of the variation uncontrolled for. To address this issue, the baseline specification is augmented so that it can incorporate additional control variables such as ln imrikt, which measures the logarithm of the import penetration ratio in the importing country i, of product k at time t and is aimed to capture the import demand at the product-level. Additional variables added include the productivity of the exporting country at time, with ln pcgjt, representing its production capacity; ln popit accounting for the size of the import market at time t; and ftaijt, which is a binary variable that controls for the existence of free trade agreements other than the CCFTA. On top of that, the specification is estimated using fixed effects at the product-year level to absorb any shocks affecting trade at the product level. Thus, the augmented specification given by:

Text version
lnyijkt is equal to alpha plus beta1 times CCFTAijt plus beta2 times Tijkt plus beta3 times ln GDPit plus beta4 times ln GDPjt plus beta5 times ln imrikt plus beta6 times ln pcgjt plus beta7 times ln popit plus beta8 times ftaijt plus gammakt plus epsilonijkt
In this set-up, the variable of interest is the treatment variable, CCFTAijt, as its coefficient, B1, measures the average difference of the outcome variable: the treated and untreated observations. The estimated coefficients of any remaining controls are only to be considered as additional effects that help give precision to the effect of CCFTAijt on the trade of the treated products. Some of the variables are expected to behave the same with or without the added layer of interpretation in the presence of the CCFTA.
The estimation results are reported for three variations of the augmented specification that produce different interpretations of the coefficient of interest, B1. First, variable Tijkt is excluded from the estimation. Then it is argued that coefficient B1 measures the average treatment effect of the CCFTA on trade between Canada and Chile. Second, with the aim of capturing the "all in" effect of the CCFTA, tariff Tijkt is standardized by dividing it by one plus the tariff applied for the same product under the CCFTA. By doing so, the identifying variation used to estimate the effect of tariffs on trade flows is the one that comes from the effect of non-CCFTA tariffs net of the CCFTA tariff effect. Third, one plus the tariff level, Tijkt, is included in the specification without standarization. Thus, the total effect of the CCFTA could be decomposed into two components: the "level effect," captured by B1 and the "slope effect," measured by B2.
Table A1: ATE estimations of the CCFTA
| (1) ln yijkt b/se | (2) ln yijkt b/se | (3) ln yijkt b/se | |
|---|---|---|---|
| CCFTAijt | 0.125*** | 0.120*** | 0.098*** |
| (0.03) | (0.04) | (0.04) | |
| Tijkt | -0.109 | -0.523** | |
| (0.23) | (0.24) | ||
| ln GDPjt | 1.560*** | 1.559*** | 1.556*** |
| (0.04) | (0.04) | (0.04) | |
| ln GDPit | 0.510*** | 0.507*** | 0.494*** |
| (0.02) | (0.02) | (0.02) | |
| ln imrikt | 0.555*** | 0.554*** | 0.550*** |
| (0.02) | (0.02) | (0.02) | |
| ln pcgjt | 0.240*** | 0.240*** | 0.239*** |
| (0.05) | (0.05) | (0.05) | |
| ln popit | 0.049** | 0.053** | 0.066*** |
| (0.02) | (0.02) | (0.03) | |
| ftaijt | 0.060 | 0.058 | 0.050 |
| (0.07) | (0.07) | (0.07) | |
| Fixed effects | Year-Product | Year-Product | Year-Product |
| Standardized tariff | Yes | No | |
| Parametric weighting | Yes | Yes | Yes |
| CCFTA Effect | 0.134 | 0.127 | 0.130 |
| Clustered standard errors at the year-product level included in parenthesis. * p < 0.10, ** p < 0.05, *** p < 0.01 | |||
The results are depicted in Table A1. In all the specifications, estimation is carried out by applying both matching and inverse-propensity-score weighting. On top of that, the estimation includes fixed effects at the year-product level. Reported in the table are the estimated coefficients and the standard errors clustered at the year-product level are shown in brackets. The bottom of the table specifies the fixed effect structure employed, whether the estimation uses matching and parametric weighting, if the tariff level is standardized or not, and the estimated average treatment effect expressed in percentage terms.
The quantitative estimates in columns (1) and (2) suggest that the imports involving countries that belong to the CCFTA grew on average between 13.4% = 100*(exp[.125] – 1) and 12.7% = 100*(exp[.125] – 1) faster relative to pairs of countries not involved in the CCFTA. In column (3), the estimated coefficient on CCFTAijt is .098 and on tariff level Tijkt, is -.523. From these two coefficients, it is possible to compute the average effect of the CCFTA as a sum of the level and slope effect. The average effect of the CCFTA implied in column (3) is 13.0% = 100*(exp[B1 + B2 (TT - TU)] - 1), where TT and TU correspond to the weighted average tariffs of the treated and untreated observations, respectively. Overall, the results depicted in the different columns indicate that the treatment effect of the CCFTA did contribute to an increase in the trade between Canada and Chile. Moreover, the coefficients of interest are precisely estimated and are statistically different from zero in all cases. Finally, the estimated ATE of the CCFTA is similar across the different specifications in a range approximately equal to 13%.
The coefficient on Tijkt shows some variation depending on the specification. When the tariff is not standardized, in column (3), the coefficient is negative and statistically significant, which is consistent with the expectancy that higher tariffs deter trade. With standardized tariffs, however, not only is the coefficient considerably smaller in magnitude, it is also no longer statistically different from zero. Although the negative sign of the standardized tariff might seem counterintuitive, it simply reflects the fact the many of the countries of the sample, including Canada, have considerably reduced their most-favoured nation tariffs in recent years. Therefore, the importance of the preference margins offered by the CCFTA, and other agreements has declined.
The rest of the control variables behave according to what was expected. The gravity-related variables, GDPit and GDPjt, are strongly positive and statistically significant, suggesting that the size of the economy of the importing and exporting countries increase bilateral imports. The production capacity of the exporting country, measured by ln pcgjt, also depicts a positive and precisely estimated coefficient, suggesting that an increase in production capabilities of the exporting country might lead to more bilateral trade. The variables capturing the size of the import market and its demand, ln popit and ln imrikt, exhibit a positive coefficient, suggesting that both variables stimulate bilateral imports of country i from country j. Lastly, the coefficient on ftaijt is positive but not statistically significant. This suggests that there is not enough evidence that the presence of free trade agreements different from the CCFTA might stimulate bilateral imports in the selected data. This could be due to insufficient variation in the control group for observations affected by other free trade agreements.
Table A2: ATE estimations of the CCFTA, restricted sample
| (1) ln yijkt b/se | (2) ln yijkt b/se | (3) ln yijkt b/se | |
|---|---|---|---|
| CCFTAijt | 0.106*** | 0.097*** | 0.097*** |
| (0.03) | (0.03) | (0.03) | |
| Tijkt | -0.144*** | -0.148*** | |
| (0.02) | (0.01) | ||
| ln GDPjt | 1.407*** | 1.406*** | 1.407*** |
| (0.06) | (0.06) | (0.06) | |
| ln GDPit | 0.821*** | 0.817*** | 0.816*** |
| (0.03) | (0.03) | (0.03) | |
| ln imrikt | 0.561*** | 0.560*** | 0.560*** |
| (0.02) | (0.02) | (0.02) | |
| ln pcgjt | 0.432*** | 0.433*** | 0.433*** |
| (0.08) | (0.08) | (0.08) | |
| ln popit | -0.267*** | -0.258*** | -0.257*** |
| (0.05) | (0.05) | (0.05) | |
| Fixed effects | Year-Product | Year-Product | Year-Product |
| Standardized tariff | Yes | No | |
| Parametric weighting | Yes | Yes | Yes |
| CCFTA effect | 0.111 | 0.102 | 0.111 |
| Clustered standard errors at the year-product level included in parenthesis. * p < 0.10, ** p < 0.05, *** p < 0.01 | |||
As a robustness exercise, the same set of specifications are estimated but only include countries that do not have an FTA signed with Canada in the control group. That restriction has implications mostly on the matching procedure, as now the pool of observations from the control group that are matched with equivalent observations in the treated group is considerably restricted. Although this might be a stringent assumption, it guarantees that the units in the control group have not received treatment of any kind (neither the CCFTA nor any other FTA). Table A2 describes the results. It is reassuring to see that the estimated coefficients obtained from this restricted sample are very similar in magnitude, and the statistical significance in the parameters of interest is preserved.
In summary, the econometric analysis suggests that the CCFTA delivered on its promises by allowing both countries to expand their bilateral trade significantly. The estimations suggest that the CCFTA increased bilateral trade growth between Canada and Chile between 12.7% and 13.4% faster than would have been the case in the absence of the CCFTA.
Technical discussion on trade in intensive and extensive margins
The data presented in the main support suggest that a significant amount of bilateral trade growth between Canada and Chile occurred in the extensive margin, where there was little or no trade prior to the agreement. To statistically confirm and quantify the effect of the CCFTA on the extensive margin of trade, a gravity model is estimated.Footnote 8
Data used for the gravity model estimation come from the BACI-CEPII database, which contains bilateral trade flows for 200 countries at the 6-digit HS product level over the period from 1995 to 2019.Footnote 9 The extensive margin is measured as the sum of the trade value of the set of the least-traded products, and the set of products is constructed using the methodology proposed by Kehoe and Ruhl (2013). The intensive margin is measured as the total trade value minus the trade value of the set of least-traded products. The estimating equation is:

Text version
ymijt is equal to the exponential of bracket alpha plus beta1 times CCFTAijt plus beta2 times Tijkt plus beta3 times lnDistij plus beta4 times Contigij plus beta5 times ComLangij plus beta6 times Colonyij plus gammait plus miujt plus epsilonijt bracket
where ymijt represents the import value (in US$ thousand) by country i from county j in time t, and m = {EM, IM, TOT} denote the extensive margin, the intensive margin and total imports, respectively. The variable of interest is CCFTAijt which is a binary variable that takes a value of 1 whenever country i and country j are Canada and Chile (or vice versa) and t ≥ 1997; the variable is 0 otherwise. Additionally, FTAijt is a binary variable that takes a value of 1 if countries i and j have a free trade agreement (different from the CCFTA) in time t; ln Distij is the distance (in km) between country i and county j; variables Contigij, Comlangij and Colonyij denote whether countries i and j share a border, share a common language or belong to the same colony, respectively; Eijt is the error term. The fixed effects, yit and μit at the importer-year and exporter-year level control for the multilateral resistance terms of the gravity equation.
The results depicted in Table A3 indicate that the CCFTA produced a positive and statistically significant effect on the trade in the extensive margin between Canada and Chile (column 1). Moreover, the CCFTA produced a negative but not significantly different from zero effect on trade in the intensive margin, suggesting that majority of trade expansion between the CCFTA countries was due to new products or products that were traded in small quantities before 1997. Lastly, column 3 shows that the effect of the CCFTA was positive overall on total imports when both the extensive and intensive margin are combined, which is consistent with the average treatment effect estimates discussed earlier.
Table A3: Effect of the CCFTA on the margins of trade
| (1) yEMijt b/se | (2) yEMijt b/se | (3) yEMijt b/se | |
|---|---|---|---|
| CCFTAijt | 0.444*** | -0.013 | 0.116** |
| (0.08) | (0.07) | (0.06) | |
| ln Distij | -0.503*** | -0.566*** | -0.533*** |
| (0.01) | (0.01) | (0.01) | |
| Contigij | 0.467*** | 0.676*** | 0.637*** |
| (0.03) | (0.03) | (0.03) | |
| Comlangij | 0.060*** | 0.053* | 0.015 |
| (0.02) | (0.03) | (0.02) | |
| Colonyij | 0.272*** | 1.144*** | 0.939*** |
| (0.05) | (0.07) | (0.06) | |
| ftaijt | 0.230*** | 0.379*** | 0.356*** |
| (0.02) | (0.03) | (0.02) | |
| Importer-Year FE | Yes | Yes | Yes |
| Exporter-Year FE | Yes | Yes | Yes |
| Clustered standard errors at the country-pair level included in parenthesis * p < 0.10, ** p < 0.05, *** p < 0.01 | |||
The results highlight the importance of the extensive margin under the CCFTA. The CCFTA not only stimulated the expansion of existing trade (the intensive margin) by lowering tariffs, but also encouraged new trade through the creation of new trading activities, such as the introduction of new products and new trading relationships. This is the direct result of the CCFTA, which reduced tariff barriers for all affected products, including products that had not been traded before or were traded in low quantities.
- Date modified: