
An overview of Canada’s trade performance under the CPTPP after three years
Has the CPTPP delivered on its promise?
June 2023
Cette publication est aussi disponible en français sous le titre : Aperçu des résultats commerciaux du Canada dans le cadre du PTPGP après trois ans.
Information contained in this publication or product may be reproduced, in part or in whole, and by any means, for personal or public non-commercial purposes without charge or further permission, unless otherwise specified. Commercial reproduction and distribution are prohibited except with written permission from Global Affairs Canada.
For more information, contact:
Global Affairs Canada
125 Sussex Drive
Ottawa ON K1A 0G2
Canada
Telephone:
1-800-267-8376 (toll-free in Canada)
613-944-4000 (in the National Capital Region and outside Canada)
If you are deaf or hard of hearing, or if you have a speech impediment and use a text telephone, you can access the TTY service from 9 a.m. to 5 p.m. Eastern Time by calling 613-944-9136 (in Canada only)
Website: www.international.gc.ca
Email: info@international.gc.ca
© His Majesty the King in Right of Canada, as represented by the Minister of International Trade, Export Promotion, Small Business and Economic Development, 2023
Cat. No. FR5-217/2023E-PDF
ISBN 978-0-660-48592-8 (PDF)
Key points
- The CPTPP is economically significant with the 11 CPTPP members together forming a regional trading bloc that accounts for 13.5% of global GDP and 15% of global trade.
- Three years after CPTPP entered into force, total merchandise trade between Canada and new FTA partners (Australia, Japan, New Zealand, Singapore and Vietnam) increased by 10.0% from $47.3 billion in 2018 to $52.1 billion in 2021.
- Despite the economic slowdown brought on by the COVID-19 pandemic, Canada’s merchandise exports to these five markets reached a record high of $22.7 billion in 2021, an increase of 8.3% from 2018, outpacing the growth of Canada’s merchandise exports to the world. Canadian merchandise imports experienced an even stronger growth over this period, rising 11.3% to reach $29.3 billion in 2021.
- Canadian exports that received tariff reductions from these five markets jumped 18.0% between 2018 and 2019, driven by higher exports of meat products to Japan and automotive products to Australia. Meanwhile, imports that received tariff reductions increased 10.4%, propelled by higher imports of electrical machinery and textile products from Vietnam.
- The products that saw the largest tariff reductions also experienced the largest growth; exports with a tariff reduction of more than 10 percentage points increased by 329.0% or $618 million during the first year of the agreement.
- Large and medium-large firms (firms with more than 250 employees) benefited the most from the tariff reductions. Notably, large firms saw their dutiable exports grow by 24.0% or $499 million, and medium-large firms recorded an increase of 61.1% from 2018 to 2019.
- The utilization of CPTPP preferences has steadily improved in both trade directions over the last few years, although the rates have varied widely across countries. For instance, Canada’s exports to Japan reached a utilization rate of 88.1% in 2020, while lower rates were recorded for Canada’s exports to countries with overlapping FTAs, such as Mexico (0.2%).
- In 2020, an estimated $580 million in duties were saved as a result of claiming CPTPP preferences for Canadian exports. These tariff savings can encourage businesses to increase their competitiveness and lower prices for consumers. Nevertheless, if CPTPP preferences were fully utilized, it would represent an additional $52 million in tariff savings.
- The CPTPP is supporting increased trade in environmental goods. Total trade in environmental goods between Canada and these new partners grew 16.9% in 2021 relative to 2018.
Introduction
The Comprehensive and Progressive Agreement for Trans-Pacific Partnership (CPTPP) is a mega regional trade agreement that involves 11 countries spanning the entire the Asia-Pacific region, including Australia, Brunei, Canada, Chile, Japan, Malaysia, Mexico, New Zealand, Peru, Singapore and Vietnam. Canada is among the first six countries to have ratified the CPTPP on December 30, 2018, along with Australia, Japan, Mexico, New Zealand and Singapore. The Agreement was later ratified by Vietnam on January 14, 2019, and most recently by Peru on September 19, 2021.
The agreement is economically significant with the 11 CPTPP members together forming a regional trading bloc that accounts for 13.5% of global GDP and 15% of global trade. Moreover, the agreement represents a new milestone in contemporary international trade treaties, as it embodies many new trade policy issues that go beyond the traditional template of trade agreements. The CPTPP establishes new standards in trade rules and commits member countries to reaffirm the importance of corporate social responsibility, inclusive trade, and sustainable development.
Three years after its entry into force, the Agreement has provided Canadians new opportunities to tap into the dynamic and high-growth Asia-Pacific markets. This report provides the first review of Canada’s trade performance under the CPTPP since the agreement was ratified. In particular, it reviews the trade performance under the agreement to date and evaluates whether the improved market access obligations under the CPTPP have in fact led to increased trade between its partner countries.
Since Canada has already established FTA arrangements with certain CPTPP member countries prior to the CPTPP, the report distinguishes between two groups of markets: existing markets and new markets. Mexico and Peru constitute the existing markets, while Australia, Japan, New Zealand, Singapore and Vietnam represent the new markets of preferential access for Canada under the CPTPP.
The following analysis focuses on the trade gains resulting from Canada’s preferential access to the new markets under the CPTPP and is divided into five sections. The first section provides an overview of Canada’s trade and investment with CPTPP partner countries, with a focus on new markets. In the second section, trade growth under the CPTPP is evaluated for all products covered by the CPTPP. The third section focuses on Canada’s trade in environmental goods with the new markets, and the fourth section reviews the utilization of CPTPP tariff preferences by partner country. Finally, the fifth section looks at Canada’s exports to the new CPTPP markets from the inclusive trade perspective.
1. An overview of trade and investment under the CPTPP
1.1. Merchandise trade
Canada’s total merchandise trade with the new CPTPP markets has experienced steady growth over the past decade, increasing by $14.8 billion or 45.4% between 2010 and 2018. Despite the challenges brought on by the COVID-19 pandemic, Canada’s merchandise trade with the new markets continued to expand over the first three years of the CPTPP, with the exception of a contraction in 2020.
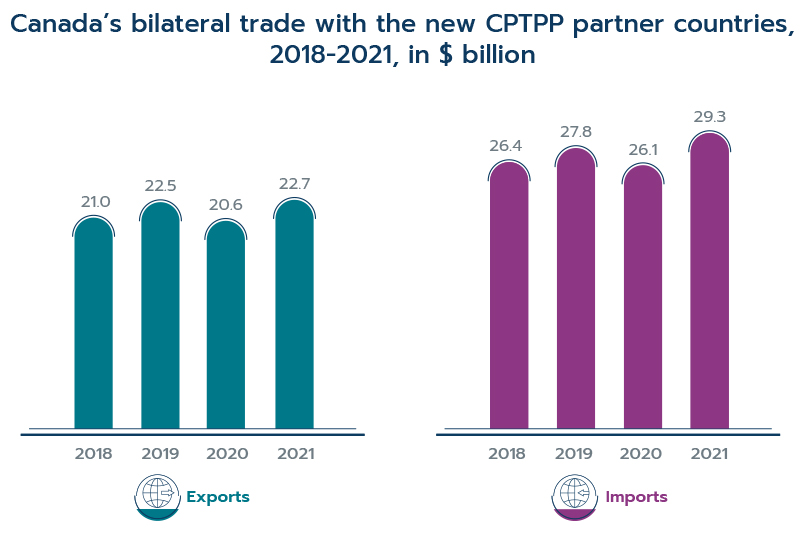
Canadian merchandise exports to the new CPTPP markets increased 7.1% from $21.0 billion in 2018, one year before the CPTPP came into force, to $22.5 billion in 2019, the first year under the CPTPP (see Figure 1). Most of the growth from 2018 to 2019 was driven by higher exports to Singapore and Japan. The onset of the COVID-19 pandemic in 2020 rocked the global economy and substantially disrupted the growth of bilateral trade between CPTPP countries. However, by 2021, Canada’s exports to the new markets grew sufficiently to recoup all pandemic-inflicted losses, reaching a historical high of $22.7 billion, which is equivalent to an 8.3% increase relative to 2018, outpacing the growth of Canada’s merchandise exports to the world of 8.1% over the same period. The growth in Canadian exports from 2018 to 2021 was primarily driven by exports to Japan and Australia.
Canadian imports from the new markets expanded by 5.5% during the first year of the agreement, increasing from $26.4 billion in 2018 to $27.8 billion in 2019. With the exception of a contraction in 2020, imports continued to grow throughout the pandemic and reached $29.3 billion in 2021, an increase of 11.3% from 2018. The majority of this growth can be attributed to increased imports from Vietnam, while imports from Japan contracted over this period.
Figure 1Footnote 1:
Data: Global Trade Atlas
Text version
Figure 1: Canada’s bilateral trade with the new CPTPP partner countries, 2018-2021, in $ billion
| Year | Exports ($ billion) | Imports ($ billion) |
|---|---|---|
| 2018 | 21.0 | 26.4 |
| 2019 | 22.5 | 27.8 |
| 2020 | 20.6 | 26.1 |
| 2021 | 22.7 | 29.3 |
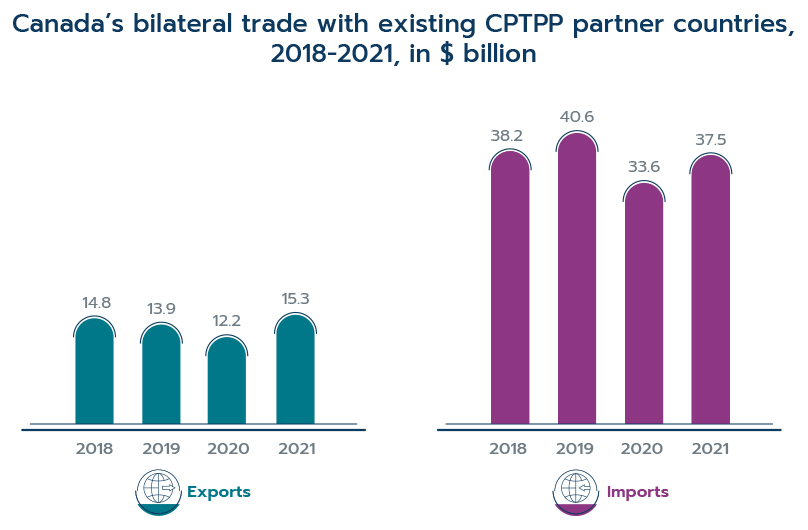
In contrast to Canada’s flourishing trade with the new markets, Canadian exports to existing markets grew by only 3.0% from 2018 to 2021, while imports fell by 2.0% (see Figure 2). In particular, Canadian imports from Mexico shrunk 9.0% over this time and the majority of trade between Canada and Mexico continued to claim CUSMA preferences instead of claiming CPTPP preferences. On the other hand, Canada’s trade with Peru thrived: exports increased by 33.3% and imports jumped by 179.3% over the same period. However, this surge cannot be associated with CPTPP commitments as the agreement was only ratified by Peru near the end of 2021.
Figure 2 Footnote 2:
Data: Global Trade Atlas
Text version
Figure 2: Canada’s bilateral trade with existing CPTPP partner countries, 2018-2021, in $ billion
| Year | Exports ($ billion) | Imports ($ billion) |
|---|---|---|
| 2018 | 14.8 | 38.2 |
| 2019 | 13.9 | 40.6 |
| 2020 | 12.2 | 33.6 |
| 2021 | 15.3 | 37.5 |
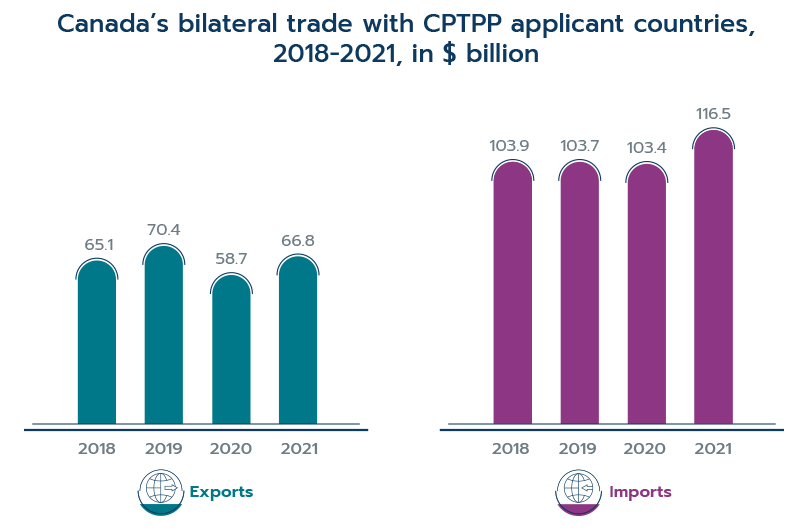
There are also a number of countries that have applied to join the CPTPP, including China, Ecuador, South Korea, Taiwan, Thailand and United Kingdom. These countries represent a sizeable amount of trade, particularly in the Asia-Pacific region. Canadian exports to CPTPP applicant countries grew significantly during the CPTPP’s initial implementation period, rising by 8.1% or $5.3 billion between 2018 and 2019, and imports remained relatively stable (see Figure 3). However, from 2018 to 2021, the growth in imports climbed to 12.2%, while exports increased by only 2.5%. China was the key contributor behind the dollar growth in imports and exports. Moreover, Canada’s trade with Ecuador and Taiwan has been particularly impressive. From 2018 to 2021, Canadian exports to these two countries surged by 117.0% and 15.6%, respectively, and imports increased by 77.6% and 33.2%. This strong growth highlights the significant opportunities associated with expanding the CPTPP to capture the dynamic and high-growth markets in the Asia Pacific region.
Figure 3 Footnote 3:
Data: Global Trade Atlas
Text version
Figure 3: Canada’s bilateral trade with CPTPP applicant countries, 2018-2021, in $ billion
| Year | Exports ($ billion) | Imports ($ billion) |
|---|---|---|
| 2018 | 65.1 | 103.9 |
| 2019 | 70.4 | 103.7 |
| 2020 | 58.7 | 103.4 |
| 2021 | 66.8 | 116.5 |
At the sector level, most of the increase in Canada’s exports to the new CPTPP markets during the first year of the agreement derived from the sale of mechanical machinery, pharmaceutical products, meat, mineral fuels, and ores, slag and ash. On the import side, electrical machinery was the key sector driving growth and made up more than 80% of Canada’s total import gains from the new CPTPP markets between 2018 and 2019.
1.2. Services trade and foreign direct investment
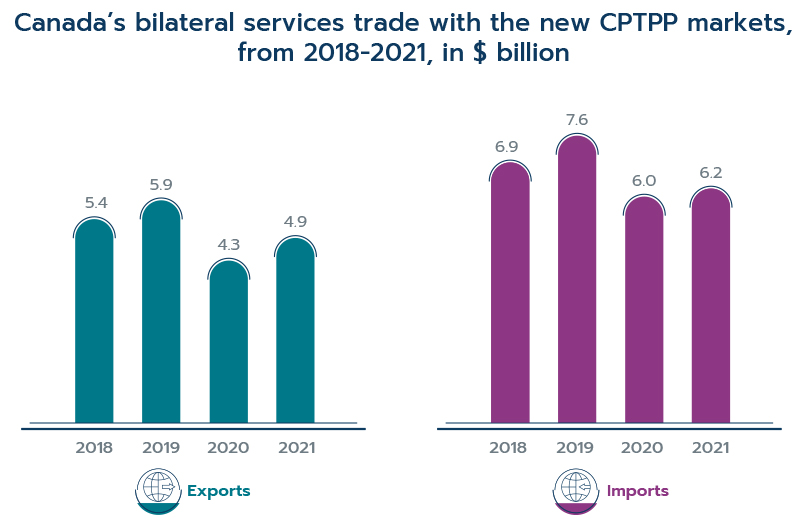
Canadian services exports to the new markets increased by $576 million to reach $5.9 billion in 2019, up 10.7% from its level of $5.4 billion in 2018 (see Figure 4). The growth in exports was spearheaded by new trade with Japan, which accounted for more than half of the increase. Vietnam also played a major role and contributed to more than one-third of the increase. Canadian services imports from the new markets reached a peak of $7.6 billion in 2019, an increase of 10.7% from 2018. Once again, Japan dominated the growth in imports, accounting for more than half of the increase. Despite seeing a decline in exports to Australia, the second largest contributor behind Canada’s import gains was Australia, while imports from New Zealand dropped by nearly 10%.
In contrast to the proliferation of trade that occurred in 2018 and 2019, Canada’s trade with the new markets was hit hard by the pandemic. Canadian services exports contracted by 19.0%, or $1.0 billion, to hit a seven-year low of $4.3 billion in 2020. Exports to Australia took the brunt of the blow, while exports to Singapore and Vietnam increased over this period. Moreover, imports from the new markets fell to $6.0 billion in 2020, 12.0% below its level in 2018; imports from Japan and Singapore accounted for the majority of the fall. However, trade in services started to recover its losses in 2021. Exports increased by $511 million, or 11.8%, in 2021 relative to 2020, while imports saw a moderate growth of 3.1% or $189 million.
Figure 4:
Data: Statistics Canada
Text version
Figure 4: Canada’s bilateral services trade with the new CPTPP markets, from 2018 to 2021, in $ billion
| Year | Exports ($ billion) | Imports ($ billion) |
|---|---|---|
| 2018 | 5.4 | 6.9 |
| 2019 | 5.9 | 7.6 |
| 2020 | 4.3 | 6.0 |
| 2021 | 4.9 | 6.2 |
In terms of trade by service category, commercial services accounted for the majority of Canada’s exports to the new CPTPP FTA partners in 2019, while most of its imports came from the transport sector. From 2018 to 2019, the growth in Canada’s services exports was driven by the travel sector, and the commercial services sector led the growth in imports.
Although the travel sector saw some of the largest gains from 2018 to 2019, this sector also suffered the largest losses during the COVID-19 pandemic with the implementation of global travel restrictions. Canadian exports and imports of travel services plunged by 53.5% and 63.8%, respectively, between 2018 and 2021. Transport services also declined relative to 2018: exports fell by nearly 30%, while imports saw a slight contraction of 2.8%. Despite the economic slowdown brought on by the pandemic, Canada’s exports and imports of commercial services increased by 41.9% and 13.7%, respectively, between 2018 and 2021.
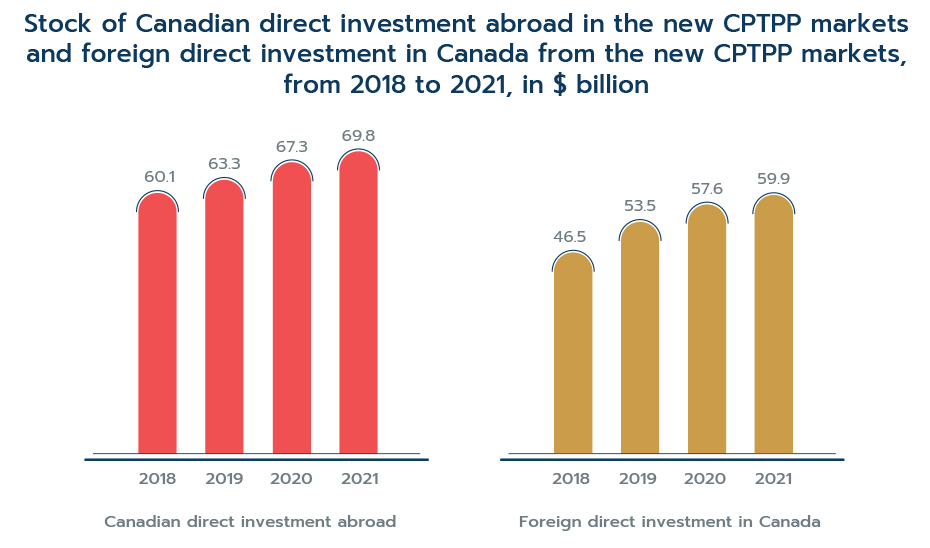
With respect to foreign direct investment (FDI), Canada’s direct investment in the new CPTPP markets reached $63.3 billion in 2019 (see Figure 5), a moderate increase of 5.4% from the previous year. The majority of this expansion can be attributed to an increase of investment in Australia and Japan, while Canada’s investments in Singapore fell by 33.5%.
In terms of inward investment, the value of new CPTPP FTA partners’ FDI in Canada reached $53.5 billion in 2019, an increase of 15.2% in the first year following the CPTPP’s ratification. The growth was largely due to increased investment from Australia, which jumped by 52.1% or $6.1 billion.
Unlike the contraction that occurred in services trade during the first year of the pandemic, the value of Canada’s inward and outward investment proved to be resilient and continued to expand into 2021. Canadian outward FDI in the new CPTPP markets hit a peak of $69.8 billion that year, an increase of 16.1% from 2018. Canada’s inward FDI saw even stronger growth, increasing by 28.9% to reach $59.9 billion in 2021.
Figure 5:
Data: Statistics Canada
Text version
Figure 5: Stock of Canadian direct investment abroad in the new CPTPP markets and foreign direct investment in Canada from the new CPTPP markets, from 2018 to 2021, in $ billion
| Year | Canadian direct investment abroad ($ billion) | Foreign direct investment in Canada ($ billion) |
|---|---|---|
| 2018 | 60.1 | 46.5 |
| 2019 | 63.3 | 53.5 |
| 2020 | 67.3 | 57.6 |
| 2021 | 69.8 | 59.9 |
2. Trade growth under the CPTPP: dutiable and duty-free trade
While the previous section showed that Canada’s trade with new CPTPP markets has grown overall, this section aims to identify how much of that growth was likely due to the CPTPP. This is accomplished by decomposing the trade growth into two categories: dutiable and duty-free trade. This breakdown is useful because the CPTPP provides preferential tariff access to almost all goods, but only products that had a positive (non-zero) most-favoured nation (MFN) tariff rate would benefit from these reduced tariffs. Goods that were already MFN duty-free would not benefit further from tariff reductions. Thus, growth in dutiable trade after the implementation of the CPTPP could provide an initial indication of the benefits of tariff liberalization.
While these comparisons help illustrate the trade gains that occurred under the CPTPP, they do not imply a causal effect of the CPTPP on trade. Although tariff reductions have a strong influence on bilateral trade, there are numerous other factors that can also impact trade flows, such as changes in commodity prices, exchange rate fluctuations, and general market conditions in partner countries. In particular, by observing trade flows for the years of 2018 to 2021, the data is affected by the first two years of the COVID-19 pandemic and the recent trend of rising commodity prices. From April 2020 to December 2021, the IMF’s commodity index increased from 84.79 to 186.18, a surge of 120%.
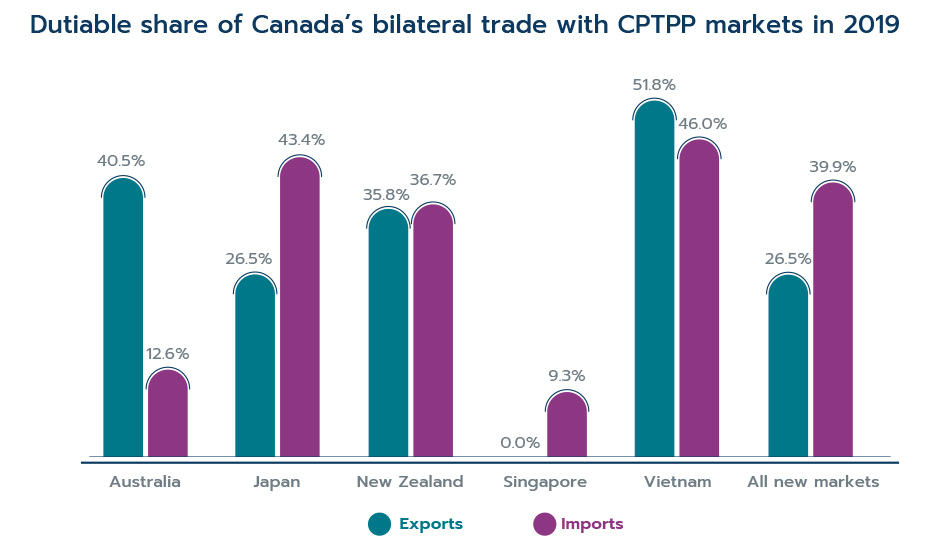
Moreover, as shown in Figure 6 below, the majority of commodities traded between Canada and the new CPTPP markets are already duty-free. In fact, only 26.5% of Canadian exports to the new CPTPP markets and 39.9% of Canadian imports from these markets were considered to be dutiable in 2019. The share of Canada’s dutiable exports to the new CPTPP markets varied greatly across partners, ranging from nearly 0% in the free-port market of Singapore to 40.5% in Australia. On the import side, over 85% of products that Canada imported from Singapore and Australia were already duty-free, while dutiable imports from Japan and Vietnam accounted for more than 40% of Canada’s imports from each country.
Figure 6 Footnote 4:
Data: Statistics Canada, World Integrated Trade Solutions, Canada Border Services Agency, customs websites of individual CPTPP partners, exchanged data
Text version
Figure 6: Dutiable share of Canada’s bilateral trade with CPTPP markets in 2019
| Market | Exports | Imports |
|---|---|---|
| Australia | 40.5% | 12.6% |
| Japan | 26.5% | 43.4% |
| New Zealand | 35.8% | 36.7% |
| Singapore | 0.0% | 9.3% |
| Vietnam | 51.8% | 46.0% |
| All new markets | 26.5% | 39.9% |
Therefore, rising commodity prices could have led to inflated gains in duty-free trade, thereby making it challenging to evaluate the CPTPP’s effect on trade growth by comparing the trade performance of dutiable and duty-free products. However, with access to additional data, a more sophisticated econometric analysis could be performed in the near future to isolate the trade creation effect of the CPTPP.
2.1. Comparison of dutiable and duty-free trade by imports and exports
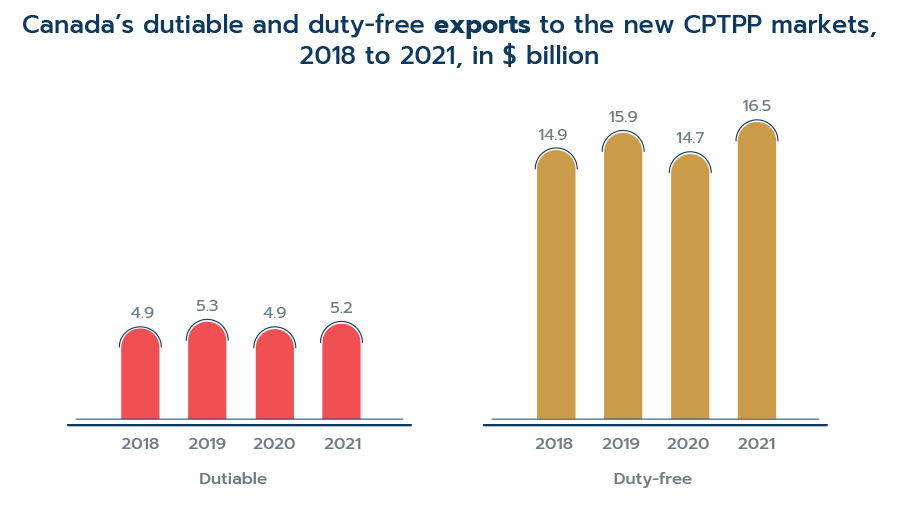
As shown in Figure 7, Canada’s dutiable exports to the new CPTPP markets stood at $4.9 billion in 2018, and duty-free exports totalled $14.9 billion. Canadian dutiable exports experienced solid growth during the first year of the CPTPP, increasing by 9.0% to reach $5.3 billion in 2019, while duty-free exports grew by only 6.8% over this period. The net growth of dutiable exports was driven by exports to Japan and Australia.
With the onset of the COVID-19 pandemic, economic activity was brought to a near standstill and international trade plunged as countries imposed drastic restrictions on travel. In the wake of this slowdown, the growth of Canada’s dutiable exports to Australia and New Zealand nosedived into negative territory between 2018 and 2021. However, despite the contraction of global trade, dutiable exports to Japan continued to expand throughout the pandemic. Overall, dutiable exports increased 6.9% from 2018 to 2021, slightly lower than its growth in the year following the CPTPP’s entry into force. Meanwhile, Canada’s duty-free exports recorded a stronger performance during the pandemic, rising 10.5% from 2018 to 2021, compared to its growth of 6.8% from 2018 to 2019. This boom was largely due to a surge in commodity prices that year, which continued its upward trend into 2022.
Figure 7 Footnote 5:
Data: Statistics Canada, World Integrated Trade Solutions, Canada Border Services Agency, customs websites of individual CPTPP partners
Text version
Figure 7: Canada’s dutiable and duty-free exports to the new CPTPP markets, 2018 to 2021, in $ billion
| Year | Dutiable ($ billion) | Duty-free ($ billion) |
|---|---|---|
| 2018 | 4.9 | 14.9 |
| 2019 | 5.3 | 15.9 |
| 2020 | 4.9 | 14.7 |
| 2021 | 5.2 | 16.5 |
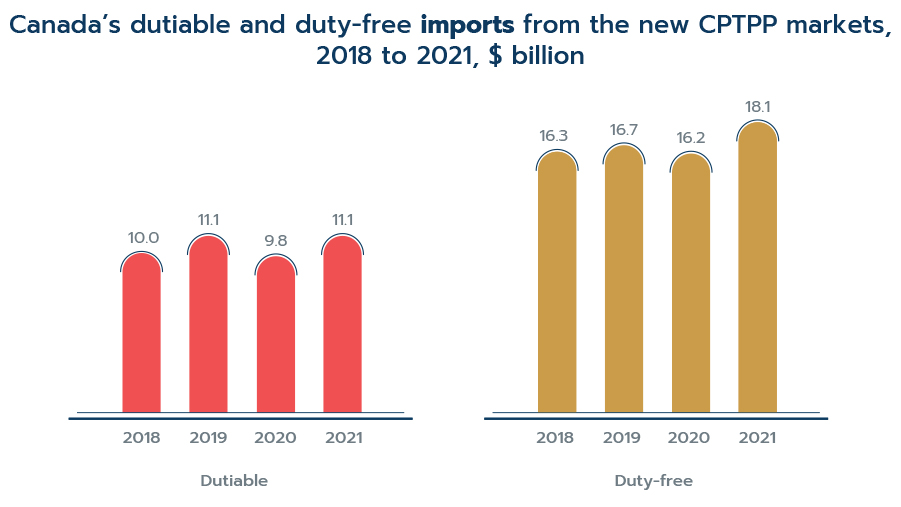
In terms of imports, Canada brought in $10.0 billion worth of dutiable products and $16.3 billion in duty-free products from the new CPTPP markets in 2018 (see Figure 8). Canada’s dutiable imports recorded an impressive growth in the first year of the CPTPP, increasing by 10.4%, while duty-free imports grew by a mere 2.4%. Among the new markets, Vietnam and Japan benefited the most from the CPTPP tariff reductions. Dutiable imports from Vietnam continued to expand during the pandemic and totalled $3.8 billion in 2021, an increase of 41.0% from its value in 2018.
Figure 8:
Data: Statistics Canada, World Integrated Trade Solutions, Canada Border Services Agency, customs websites of individual CPTPP partners
Text version
Figure 8: Canada’s dutiable and duty-free imports from the new CPTPP markets, 2018 to 2021, $ billion
| Year | Dutiable ($ billion) | Duty-free ($ billion) |
|---|---|---|
| 2018 | 10.0 | 16.3 |
| 2019 | 11.1 | 16.7 |
| 2020 | 9.8 | 16.2 |
| 2021 | 11.1 | 18.1 |
2.2. Product-level comparison of dutiable trade
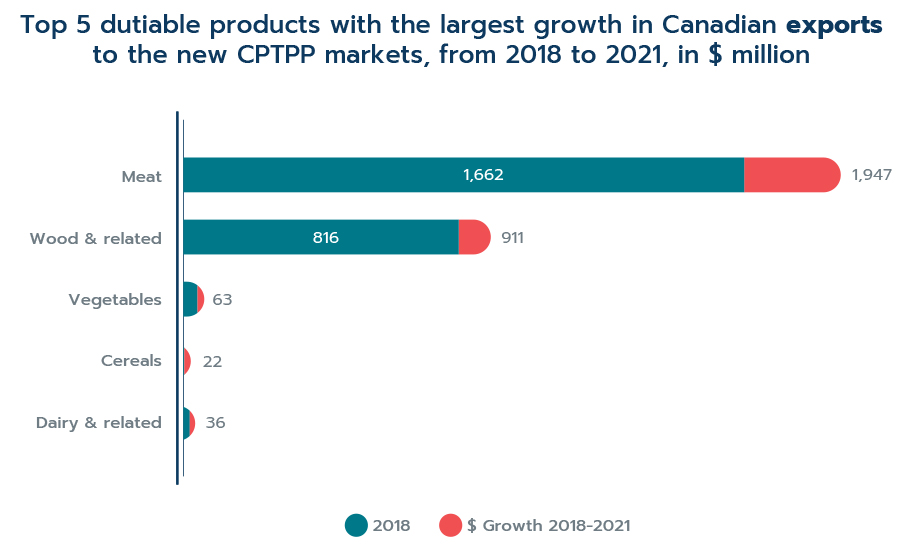
At the product-level, Canadian exports of meat products recorded the largest increase in dutiable exports to the new CPTPP markets from 2018 to 2021, growing by $286 million, or 17.2% (see Figure 9). The majority of this growth was propelled by exports to Japan. Moreover, Canada’s exports of cereal products increased by more than 500%, and dairy products nearly doubled over this period.
Figure 9:
Data: Statistics Canada, World Integrated Trade Solutions, Canada Border Services Agency, customs websites of individual CPTPP partners
Note: The numbers to the right of the stacked bars represent the values for 2021.
Text version
Figure 9: Top 5 dutiable products with the largest growth in Canadian exports to the new CPTPP markets, from 2018 to 2021, in $ million
| Product sector | Exports in 2018 ($ million) | Growth from 2018 to 2021 ($ million) | Exports in 2021 ($ million) |
|---|---|---|---|
| Meat | 1,662 | 286 | 1,947 |
| Wood & related | 816 | 95 | 911 |
| Vegetables | 42 | 20 | 63 |
| Cereals | 3 | 19 | 22 |
| Dairy & related | 19 | 16 | 36 |
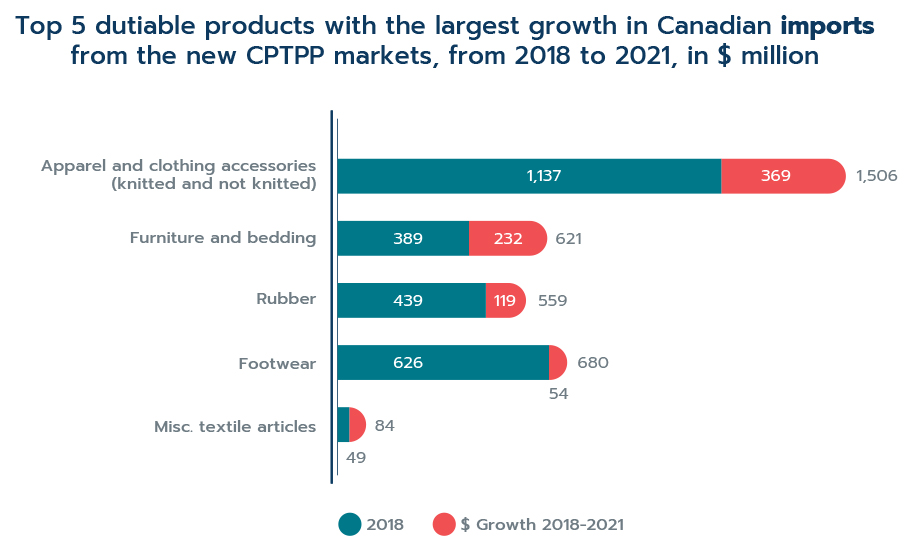
The growth in Canada’s dutiable imports from the new CPTPP markets between 2018 and 2021 was driven by increases in imports of apparel products (including both knitted and not knitted), furniture and bedding, rubber, footwear and made-up textile articles (see Figure 10). These products were predominantly imported from Vietnam.
Figure 10:
Data: Statistics Canada, World Integrated Trade Solutions, Canada Border Services Agency, customs websites of individual CPTPP partners
Note: The numbers to the right of the stacked bars represent the values for 2021.
Text version
Figure 10: Top 5 dutiable products with the largest growth in Canadian imports from the new CPTPP markets, from 2018 to 2021, in $ million
| Product sector | Exports in 2018 ($ million) | Growth from 2018 to 2021 ($ million) | Exports in 2021 ($ million) |
|---|---|---|---|
| Apparel and clothing accessories (knitted and not knitted) | 1,137 | 369 | 1,506 |
| Furniture and bedding | 389 | 232 | 621 |
| Rubber | 439 | 119 | 559 |
| Footwear | 626 | 54 | 680 |
| Misc. textile articles | 35 | 49 | 84 |
3. Trade in environmental goods under the CPTPP
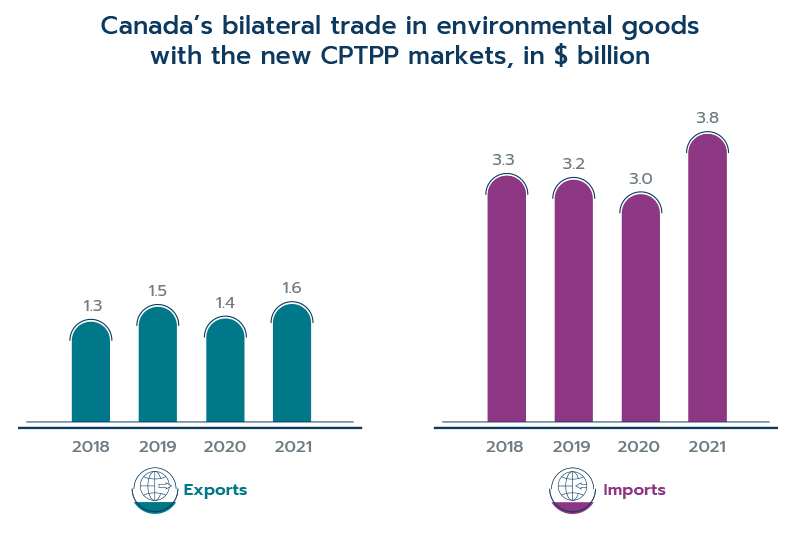
In 2019, Canada exported $1.5 billion in environmental goods to the new CPTPP markets, up by 14.6% from its value of $1.3 billion in 2018 (see Figure 11). Japan was the main destination for these exports, receiving nearly 40% of total Canadian exports to this region, followed by Australia and Singapore. In terms of growth, Singapore experienced the largest increase in dollar and percentage terms, with its exports from Canada rising by 35.2% or $102 million from 2018 to 2019.
Following a slight contraction in 2020, Canadian exports climbed to $1.6 billion in 2021, an increase of 16.8% relative to 2018. Notably, the composition of growth from 2018 to 2021 differs greatly from that of 2018 to 2019; while the increase in Canadian exports during the first year of the Agreement was mostly led by Singapore, the growth from 2018 to 2021 was driven by Japan, which saw its exports from Canada increase by 36.9%, or $213 million.
Canadian imports of environmental goods from these new markets totalled $3.2 billion in 2019, down $47 million or 1.4% from its value of $3.3 billion in 2018 (see Figure 11). The growth from 2018 to 2019 varied greatly across partners; while imports from Japan decreased by 10.7%, imports from Vietnam expanded by 83.2%.
From 2018 to 2021, Canadian imports of environmental goods grew by 16.9% to reach $3.8 billion in 2021. The composition of growth over this period mirrors the pattern observed from 2018 to 2019, as imports from Vietnam surged by 327.2%, while imports from Japan fell by 11.5%.
Figure 11:
Data: Global Trade Atlas, Statistics Canada
Text version
Figure 11: Canada’s bilateral trade in environmental goods with the new CPTPP markets, in $ billion
| Year | Exports ($ billion) | Imports ($ billion) |
|---|---|---|
| 2018 | 1,342 | 3,257 |
| 2019 | 1,538 | 3,210 |
| 2020 | 1,378 | 3,018 |
| 2021 | 1,568 | 3,809 |
During the first year of the CPTPP, the dollar growth in Canada’s exports of the most traded environmental goods was dominated by energy-efficient machinery products, which expanded by $178 million. However, from 2018 to 2021, exports of measuring equipment for pollution levels recorded the largest dollar increase, increasing by $67 million, while exports of energy efficient machinery declined by $3 million. On the other hand, this pattern is inversed for Canada’s imports of the most traded environmental goods. From 2018 to 2019, the growth in Canadian imports was led by measuring equipment products, and the growth from 2018 to 2021 was spearheaded by imports of energy-efficient machinery.
4. Utilization of preferential tariffs under the CPTPP
The preference utilization rate (PUR) is a key indicator in determining whether FTA partners are reaping the benefits of a trade agreement. The PUR measures the extent to which tariff preferences under a given trade agreement are being used when products cross the borders. For an economy to benefit from an FTA, its businesses must take advantage of the preferences obtained under the agreement. To that end, businesses need to claim the preferences and demonstrate that they meet the requirements in order to receive the preferential tariffs. Therefore, preference utilization rates are important indicators as they reflect the extent to which trade agreements are being utilized. This section begins with a cross-country comparison of the utilization rates of CPTPP preferences, followed by an overview of the tariff savings that could have been avoided had the CETA preferences been claimed.
4.1. Preference utilization rates by country
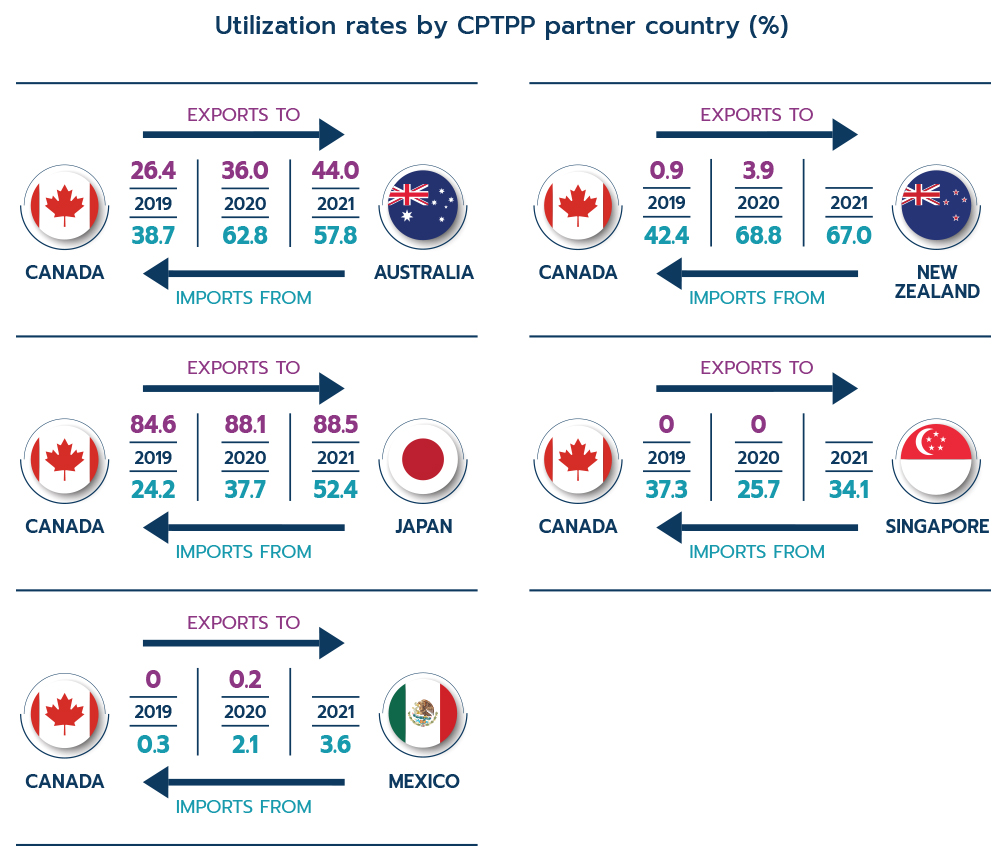
As demonstrated in Figure 12, the PURs for Canadian imports from CPTPP partner countries are higher than those for Canadian exports, with the exception of Japan. Over the last few years, the PURs of CPTPP members have been steadily improving for both exports and imports. For instance, the PURs for Canadian exports to Australia grew from 26.4% in 2019 to 36.0% in 2020. Likewise, the PURs for Canadian imports from Australia also surged, rising from 38.7% in 2019 to 57.8% in 2021. In other words, nearly 60% of Australian exports to Canada that were eligible for CPTPP preferences made use of these preferences. Furthermore, it is worth noting that the PURs for both exports and imports increased during the pandemic.
Figure 12:
Data: Special data tabulation from Statistics Canada; data exchanges with Australia, Japan, Mexico, New Zealand and Singapore.
Note: Data exchanges tend to take time to establish, therefore, calculations can only be performed for 2021 for some member countries. Blank cells indicate years for which data were unavailable.
Text version
Figure 12: Utilization rates by CPTPP partner country (%)
| Year | Canadian Exports to Australia | Canadian Imports from Australia |
|---|---|---|
| 2019 | 26.4 | 38.7 |
| 2020 | 36.0 | 62.8 |
| 2021 | 44.0 | 57.8 |
| Year | Canadian Exports to New Zealand | Canadian Imports from New Zealand |
| 2019 | 0.9 | 42.4 |
| 2020 | 3.9 | 68.8 |
| 2021 | 67 | |
| Year | Canadian Exports to Japan | Canadian Imports from Japan |
| 2019 | 84.6 | 24.2 |
| 2020 | 88.1 | 37.7 |
| 2021 | 88.5 | 52.4 |
| Year | Canadian Exports to Singapore | Canadian Imports from Singapore |
| 2019 | 0 | 37.3 |
| 2020 | 0 | 25.7 |
| 2021 | 34.1 | |
| Year | Canadian Exports to Mexico | Canadian Imports from Mexico |
| 2019 | 0 | 0.3 |
| 2020 | 0.2 | 2.1 |
| 2021 | 3.6 |
Although the PURs under the CPTPP have improved overall, there are large variations in the utilization rates across member countries. Canadian exports to Japan reached high utilization rates of CPTPP preferences rather quickly, with businesses taking full advantage of preferences from the beginning of the CPTPP’s implementation. The PURs for these exports stood at 84.6% in 2019, and further increased to 88.1% in 2020. PURs for Canadian imports from Japan also improved steadily, rising from 24.2% in 2019 to 52.4% in 2021.
Nevertheless, utilization rates can be very low for countries with overlapping FTAs because they can be claiming preferences under a different agreement. For instance, in 2020, Mexico reported PURs of only 0.2% for its imports from Canada under the CPTPP. This low utilization can be explained by the fact that 64.2% of Mexican imports that were eligible to claim the CPTPP preferences claimed other preferences. While the data provided by the Mexican government does not specify which other preferences were used, it would be reasonable to suspect that they applied the CUSMA preferences or the preferences under the WTO aircraft agreement.
Similarly, the PURs for Canada’s exports to New Zealand and Australia in 2020 were also low, standing at 3.9% and 36.0%, respectively. Once again, many businesses involved in these exports did not take advantage of the CPTPP’s preferences since they were already claiming preferences under Canada’s pre-existing trade agreements with these countries. Specifically, Canada and Australia agreed on preferential tariff rates for a limited range of products under the Canada-Australia Trade Agreement (the Australia Treaty [AUT]), which was ratified in 1960 and amended in 1973. Later on, Canada and New Zealand granted each other preferential rates for certain products under the Agreement on Trade and Economic Cooperation between Canada and New Zealand (the New Zealand Treaty [NZT]), which they established in 1982.
With the NZT preferences already in place, 63.8% of New Zealand’s total imports from Canada that were eligible to claim the CPTPP preferences in 2020 instead claimed the NZT preferences, compared to the 3.9% that utilized the CPTPP preferences. As for Australia, 10.1% of its total imports from Canada that were eligible to claim the CPTPP preferences in 2020 actually claimed the AUT preferences, compared to the 36.0% of imports that claimed the CPTPP preferences.
Conversely, Canada’s imports from New Zealand and Australia recorded reasonably high CPTPP utilization rates. In 2020, 67.0% of Canada’s imports from New Zealand took advantage of the CPTPP preferences, and 57.8% of imports from Australia used the preferences. Meanwhile, only 12.2% of Canada’s total imports from New Zealand that were eligible to claim CPTPP preferences actually claimed the NZT preferences, and 6.0% of all Canadian imports from Australia that were eligible to claim the CPTPP preferences instead claimed the AUT preferences.
It is worth noting the variation in PURs across countries; in particular, certain CPTPP members recorded relatively low utilization rates. There are many factors that could influence the use of the preferences by businesses, such as low business awareness of the agreement, difficulty obtaining the rules of origin certificates from exporters, trade through third countries, composition of trade, complicated customs procedures, low preference margins and, as has been noted, overlapping trade agreements.
4.2. Unused tariff savings by country
One of the reasons why countries focus on the preference utilization rate of agreements after they have been signed is because the preferences enable tariff savings on trade. If the preferences are not fully utilized, the amount of duties paid that could have been avoided is known as unused tariff savings, and the tariffs that were avoided through preference claims represent the amount of used tariff savings. The countries with the highest PURs save the most tariffs.
In 2020, Canadian exports to the new markets saved an estimated $580 million in duties as a result of claiming CPTPP preferences. These tariff savings can encourage businesses to increase their competitiveness and lower their prices for consumers. Nevertheless, if the CPTPP preferences were fully utilized, an additional $52 million in savings could have been realized.
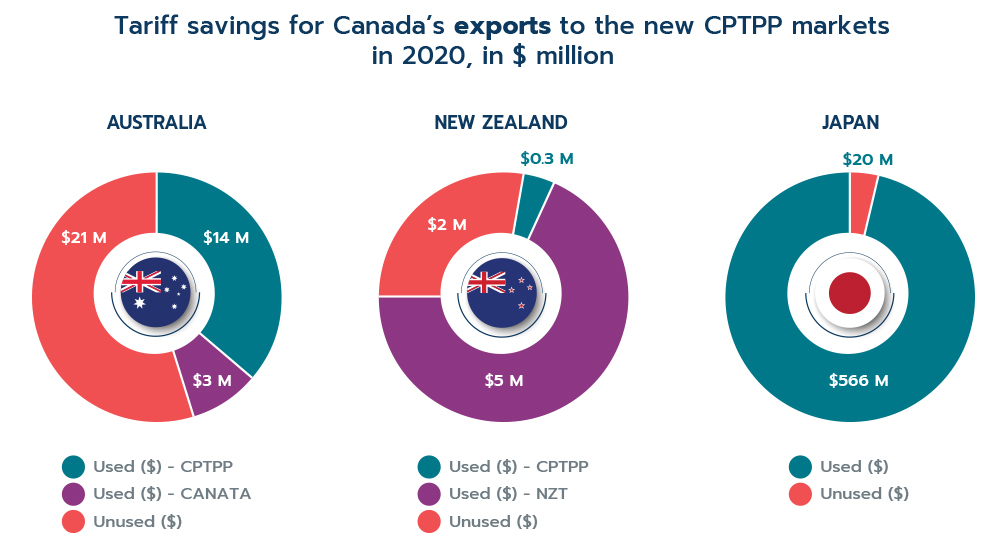
Japan recorded the largest share of used tariff savings for Canadian exports to the new markets in 2020 (see Figure 13). As seen in the previous section, Japan also reported the largest utilization rate under the CPTPP (88.1%). On the other hand, the actual tariff savings for New Zealand and Australia represented considerably smaller shares of their total possible savings under the CPTPP, which aligns with the lower PURs reported by both partners.
Figure 13 Footnote 6:
Data: Special data tabulation from Statistics Canada; data exchanges with Australia, Japan and New Zealand.
Text version
Figure 13: Tariff savings for Canada’s exports to the new CPTPP markets in 2020, in $ million
| Australia | Canadian Exports ($ million) |
|---|---|
| Used ($) - CPTPP | 13.6 |
| Used ($) - CANATA | 3.4 |
| Unused ($) | 20.5 |
| New Zealand | Canadian Exports ($ million) |
| Used ($) - CPTPP | 0.3 |
| Used ($) - NZT | 5 |
| Unused ($) | 2.0 |
| Japan | Canadian Exports ($ million) |
| Used ($) | 566.23 |
| Unused ($) | 20.36 |
In terms of imports, the countries with the highest shares of used tariff savings in 2020 were Australia and New Zealand (see Figure 14). Meanwhile, Vietnam, Japan and Singapore saved smaller shares of their maximum possible savings. These three countries also reported utilization rates that were considerably lower than those for Australia and New Zealand.
Figure 14:

Data: Special data tabulation from Statistics Canada; data exchanges with Australia, Japan, New Zealand, Singapore and Vietnam.
Text version
Figure 14: Tariff savings for Canada’s imports from the new CPTPP markets in 2020, in $ million
| Australia | Canadian Imports ($ million) |
|---|---|
| Used ($) - CPTPP | 10 |
| Used ($) - CANATA | 0.3 |
| Unused ($) | 4 |
| New Zealand | Canadian Imports ($ million) |
| Used ($) - CPTPP | 4 |
| Used ($) - NZT | 1 |
| Unused ($) | 2 |
| Japan | Canadian Imports ($ million) |
| Used ($) | 92.1 |
| Unused ($) | 183.1 |
| Singapore | Canadian Imports ($ million) |
| 1.1 | |
| 3.6 | |
| Vietnam | Canadian Imports ($ million) |
| 134.9 | |
| 249.4 |
5. Exports from the inclusive trade perspective
The CPTPP agreement embodies new trade policies that go beyond the traditional template of trade agreements, such as committing member countries to reaffirm the importance of corporate social responsibility, inclusive trade, and sustainable development. The agreement encourages member countries to undertake cooperative activities to ensure the benefits of trade are more widely shared in society at large, including those that are traditionally under-represented such as women, SMEs and indigenous people.
This section of the report will review the inclusive aspects of Canada’s trade performance under the CPTPP, in particular whether or not the CPTPP has provided enhanced opportunities for SMEs and women. SMEs, women, and other traditionally underrepresented groups often have less access to resources and may encounter more barriers in their access to trade opportunities compared to larger enterprises. Thus, these underrepresented groups may be affected by the CPTPP in a different manner, and would therefore display distinct behaviours under the trade agreement.
The following analysis utilizes Statistics Canada’s data on trade by exporter characteristics to shed light on the trade performance of Canadian SME exporters under the CPTPP. Furthermore, it evaluates the degree to which Canadian SME exporters, workers, and female employees have benefited from the CPTPP tariff reduction commitments. A comprehensive review of the trade performance of underrepresented groups in a broader market defined by the CPTPP would help illuminate the trade dynamics of FTA obligations and demonstrate the sustainability and inclusivity benefits of the agreement.
5.1. Growth of SMEs’ exports
By facilitating economic integration, trade agreements allow SMEs to access a broader market, enabling them to grow. This aspect is particularly important for firms that seek opportunities in overseas markets. Other advantages of trade liberalization include the reduction of production costs through increased economies of scale, and direct access to intermediate inputs and natural resources required for production.
While Canada’s exporter population is mostly comprised of SMEs with fewer than 500 employees, they accounted for less than half (41.1%) of Canada’s total merchandise exports in 2018. In contrast, large firms were responsible for 58.9% of total exports, despite making up only 2.7% of all exporting firms; this trend has been consistent for many decades.
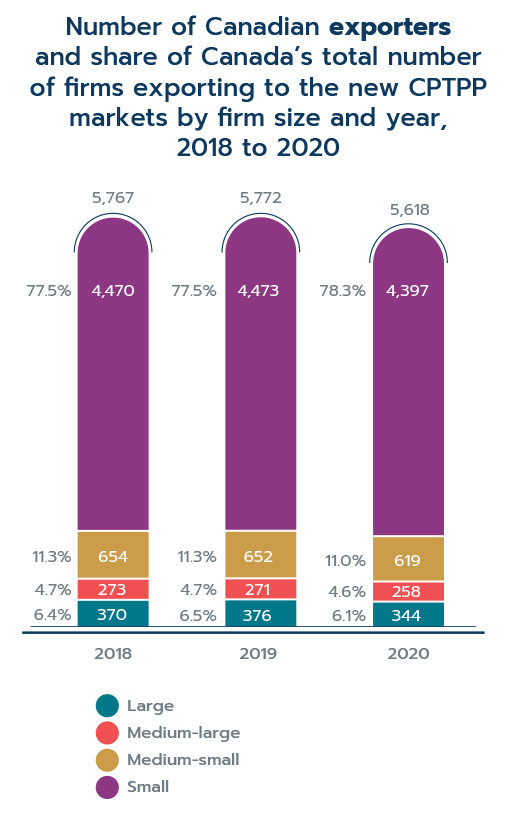
In the context of the CPTPP, approximately 5,397 Canadian SMEs exported to the new CPTPP markets in 2018 (see Figure 15). Small firms represented over three-quarters of all exporters, and their exports were concentrated in Australia, Japan and Singapore. Medium-small firms were the second largest category of firms, making up 11.3% of total exporters, followed by large firms (6.4%) and medium-large firms (4.7%). Combined, SMEs accounted for 93.6% of all Canadian firms exporting to the new CPTPP partners in 2018.
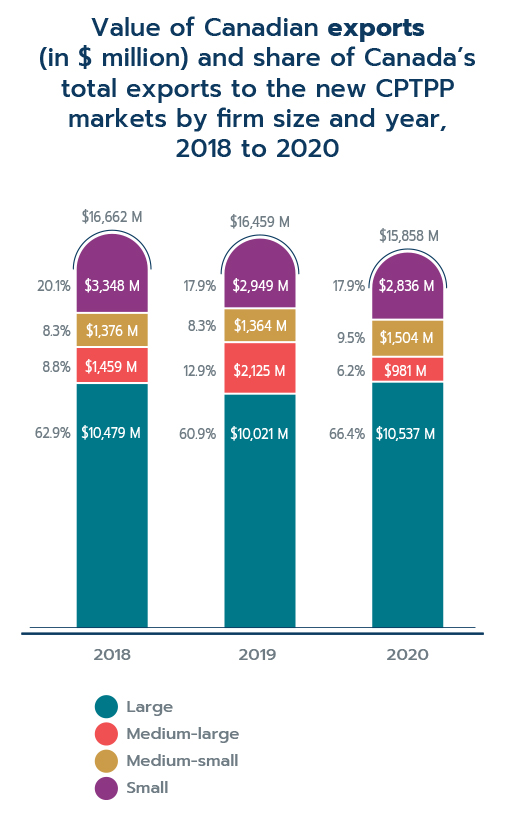
In terms of value, Canadian firms exported $16.7 billion worth of products to the new CPTPP markets in 2018. 62.9% of these exports came from large firms, and SMEs made up 37.1% of total exports to this region (see Figure 16). Most of the exports by SMEs were done by small firms, while medium-large firms accounted for the smallest share of exports.
The total number of Canadian SMEs exporting to the new CPTPP markets remained relatively stable in the first year of the CPTPP, and their exports edged up slightly to $6.4 billion in 2019, an increase of 4.1% from 2018. Most of the export gains were led by medium-large firms, which saw their exports jump from $1.5 billion in 2018 to $2.1 billion in 2019, an increase of 45.7%. Although the number of large firms exporting to the new CPTPP markets grew slightly between 2018 and 2019, the value of their exports dropped by 4.4%.
Figure 15:
Data: Statistics Canada
Note: The values above the bars represent the totals for the corresponding year.
Text version
Figure 15: Number of Canadian exporters and share of Canada’s total number of firms exporting to the new CPTPP markets by firm size and year, 2018 to 2020
| Firm Size | Number of Exporters | Share of Total (%) | ||||
|---|---|---|---|---|---|---|
| 2018 | 2019 | 2020 | 2018 | 2019 | 2020 | |
| Large | 370 | 376 | 344 | 6.4 | 6.5 | 6.1 |
| Medium-large | 273 | 271 | 258 | 4.7 | 4.7 | 4.6 |
| Medium-small | 654 | 652 | 619 | 11.3 | 11.3 | 11.0 |
| Small | 4,470 | 4,473 | 4,397 | 77.5 | 77.5 | 78.3 |
| Total | 5,767 | 5,772 | 518 | 100 | 100 | 100 |
Figure 16:
Data: Statistics Canada
Note: The values above the bars represent the totals for the corresponding year.
Text version
Figure 16: Value of Canadian exports (in $ million) and share of Canada’s total exports to the new CPTPP markets by firm size and year, 2018 to 2020
| Firm Size | Value of Exports ($ million) | Share of Total (%) | ||||
|---|---|---|---|---|---|---|
| 2018 | 2019 | 2020 | 2018 | 2019 | 2020 | |
| Large | 10,479 | 10,021 | 10,537 | 62.9 | 60.9 | 66.4 |
| Medium-large | 1,459 | 2,125 | 981 | 8.8 | 12.9 | 6.2 |
| Medium-small | 1,376 | 1,364 | 1,504 | 8.3 | 8.3 | 9.5 |
| Small | 3,348 | 2,949 | 2,836 | 20.1 | 17.9 | 17.9 |
| SMEs | 6,182 | 6,438 | 5,321 | 37.1 | 39.1 | 33.6 |
| Total | 16,662 | 16,459 | 15,858 | 100.0 | 100.0 | 100.0 |
5.2. Growth of SMEs’ dutiable exportsFootnote 7
After reviewing the overall trade trajectory of SMEs and large firms, the following section focuses on Canadian exports of dutiable products that received tariff reductions under the CPTPP by firm size.
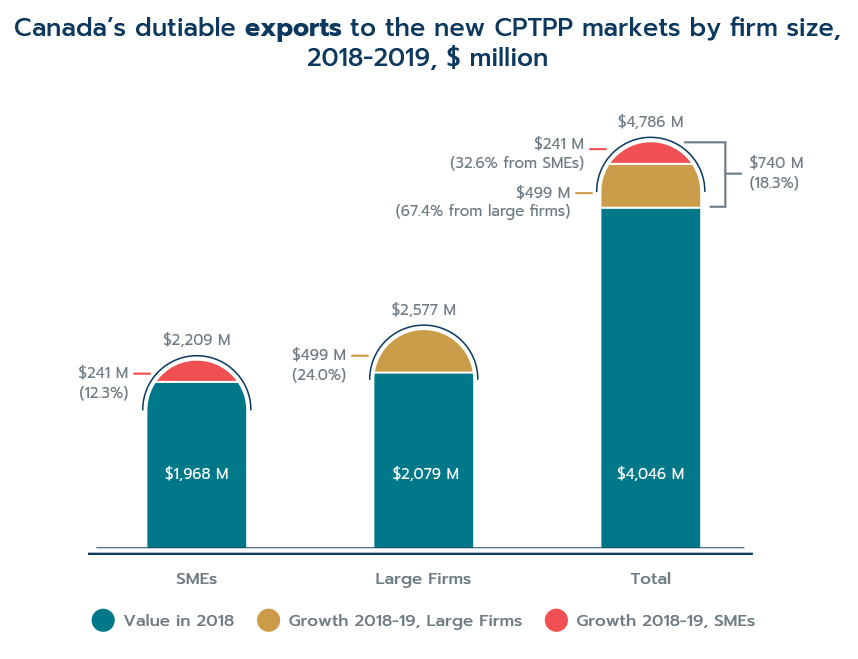
Canadian exporters have seen their dutiable exports to the new CPTPP markets increase by 18.3% or $740 million in the year following the CPTPP’s entry into force (see Figure 17).Footnote 8 While large firms saw their exports grow by $499, or 24.0%, SMEs also managed to increase their dutiable exports by
$241 million from 2018 to 2019.
Figure 17:
Data: Statistics Canada
Text version
Figure 17: Canada’s dutiable exports to the new CPTPP markets by firm size, 2018-2019, $ million
| Value in 2018 ($ million) | Growth from 2018-19, Large Firms ($ million) | Growth from 2018-19, SMEs ($ million) | Value in 2019 ($ million) | Growth 2018-2019, in % | Share of Total Growth 2018-19, in % | |
|---|---|---|---|---|---|---|
| SMEs | 1,968 | - | 241 | 2,209 | 12.3 | 32.6 |
| Large Firms | 2,079 | 499 | - | 2,577 | 24.0 | 67.4 |
| Total | 4,046 | 499 | 241 | 4,786 | 18.3 | 100.0 |
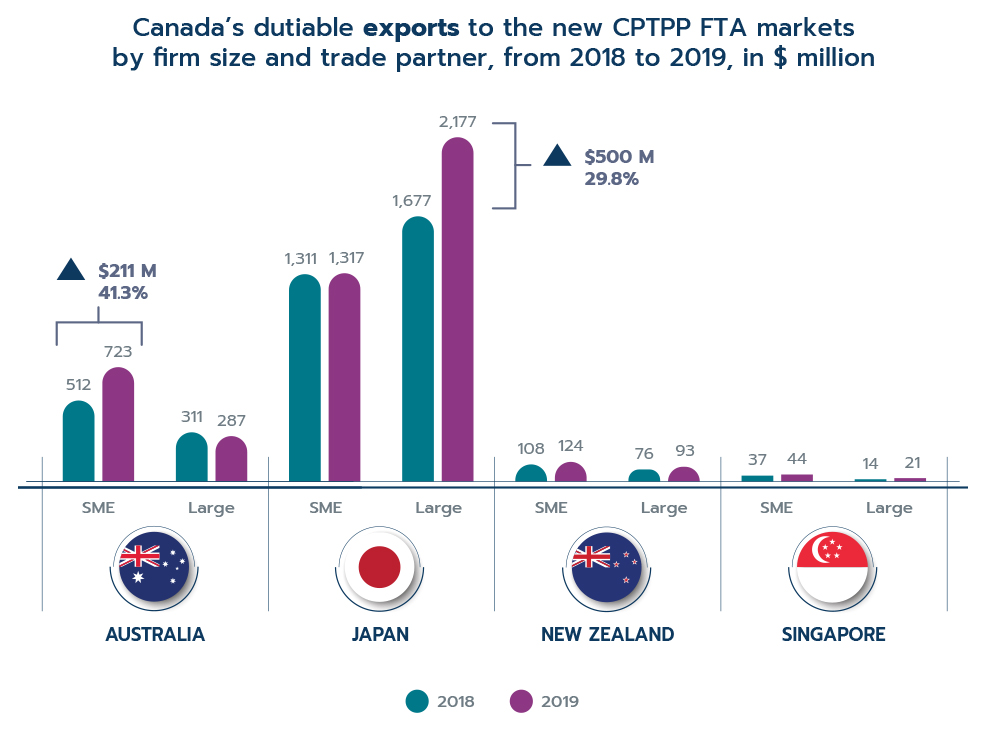
In terms of destination, Japan was the primary recipient of Canada’s dutiable exports for both SMEs and large firms (see Figure 18). Japan also experienced the largest increase of dutiable exports from large firms, which jumped by $500 million from 2018 to 2019. As for SMEs, Australia accounted for the majority of the growth, with dutiable exports increasing by $211 million.
Figure 18:
Data: Statistics Canada
Text version
Figure 18: Canada’s dutiable exports to the new CPTPP FTA markets by firm size and trade partner, from 2018 to 2019, in $ million
| Market | Firm Size | Exports in 2018 ($ million) | Exports in 2019 ($ million) | Growth from 2018-2019, in $ million | Growth from 2018-2019, in % |
|---|---|---|---|---|---|
| Australia | SME | 512 | 723 | 211 | 41.3 |
| Large | 311 | 287 | -24 | -7.7 | |
| Japan | SME | 1,311 | 1,317 | 6 | 0.5 |
| Large | 1,677 | 2,177 | 500 | 29.8 | |
| New Zealand | SME | 108 | 124 | 17 | 15.5 |
| Large | 76 | 93 | 16 | 21.3 | |
| Singapore | SME | 37 | 44 | 7 | 18.4 |
| Large | 14 | 21 | 7 | 46.5 |
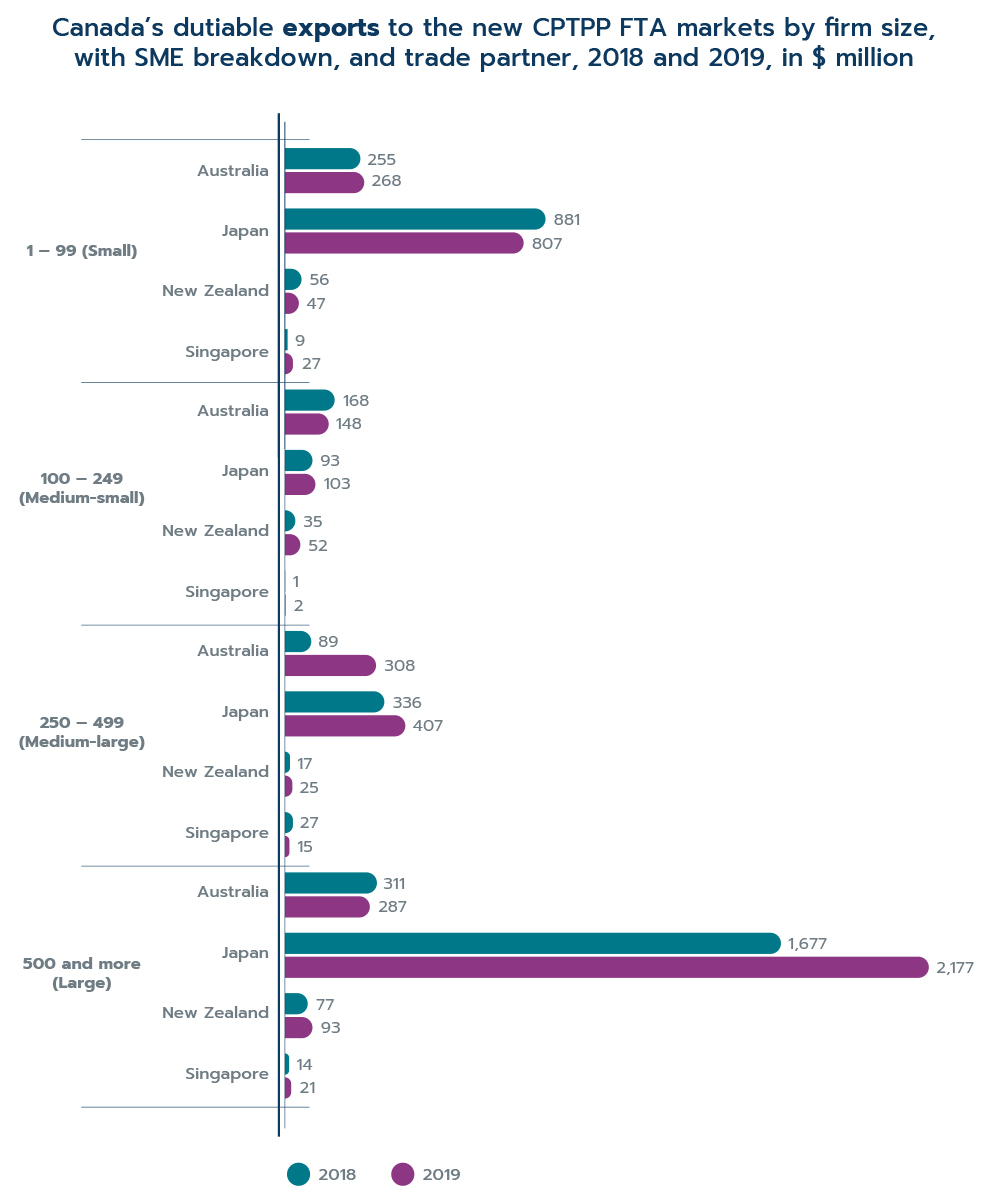
Figure 19 categorizes Canada’s dutiable exports by destination country and type of SME. Notably, most of Australia’s gains in dutiable products exported by SMEs can be attributed to medium-large firms. Their exports more than tripled from 2018 to 2019, increasing from $89 million to $308 million. This increase corresponds to the second largest dollar increase for all firm sizes and countries, following only the gains of large firms exporting to Japan.
Figure 19:
Data: Statistics Canada
Text version
Figure 19: Canada’s dutiable exports to the new CPTPP FTA markets by firm size, with SME breakdown, and trade partner, 2018 and 2019, in $ million
| Firm Size | Market | Exports in 2018 ($ million) | Exports in 2019 ($ million) |
|---|---|---|---|
| 1 – 99 (Small) | Australia | 255 | 268 |
| Japan | 881 | 807 | |
| New Zealand | 56 | 47 | |
| Singapore | 9 | 27 | |
| 100 – 249 (Medium-small) | Australia | 168 | 148 |
| Japan | 93 | 103 | |
| New Zealand | 35 | 52 | |
| Singapore | 1 | 2 | |
| 250 – 499 (Medium-large) | Australia | 89 | 308 |
| Japan | 336 | 407 | |
| New Zealand | 17 | 25 | |
| Singapore | 27 | 15 | |
| 500 and more (Large) | Australia | 311 | 287 |
| Japan | 1677 | 2177 | |
| New Zealand | 77 | 93 | |
| Singapore | 14 | 21 |
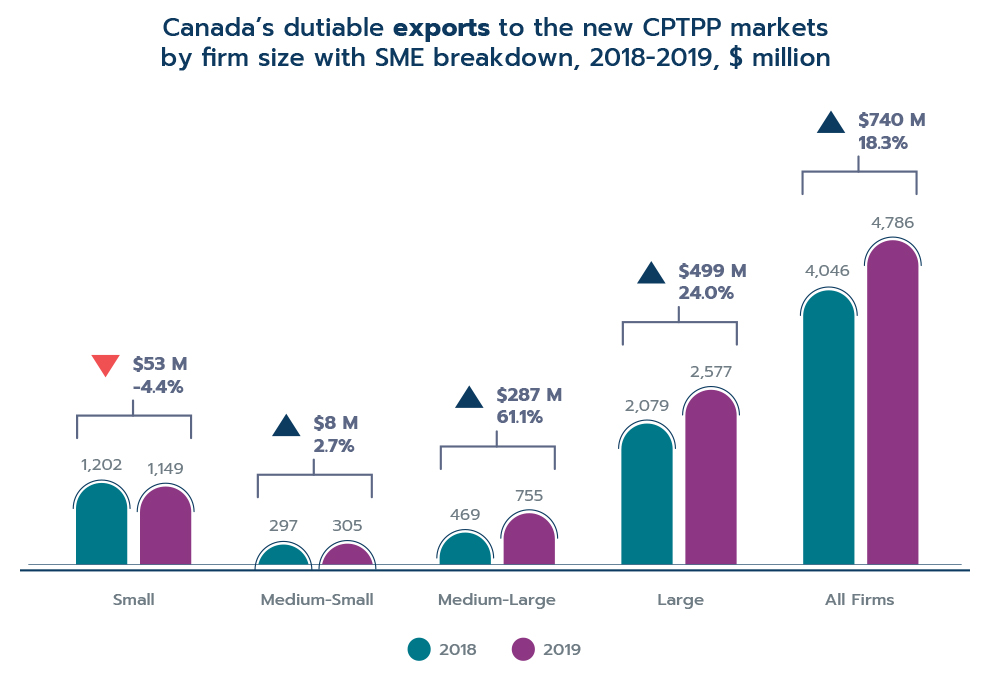
A more detailed breakdown of firms by type of SME (see Figure 20) reveals that medium large firms were the only category of SMEs that saw significant gains under the CPTPP. Dutiable exports for this group surged by 61.1% or $287 million, while dutiable exports dropped slightly for small firms and remained stable for medium-small firms.
Figure 20:
Data: Statistics Canada
Text version
Figure 20: Canada’s dutiable exports to the new CPTPP markets by firm size with SME breakdown, 2018-2019, $ million
| Firm Size | Exports in 2018 ($ million) | Exports in 2019 ($ million) | Share of total in 2018 (%) | Share of total in 2019 (%) | Growth from 2018-2019, in $ million | Growth from 2018-2019, in % |
|---|---|---|---|---|---|---|
| Small | 1,202 | 1,149 | 29.7 | 24.0 | - 53 | -4.4 |
| Medium-Small | 297 | 305 | 7.3 | 6.4 | 8 | 2.7 |
| Medium-Large | 469 | 755 | 11.6 | 15.8 | 287 | 61.1 |
| Large | 2,079 | 2,577 | 51.4 | 53.8 | 499 | 24.0 |
| All Firms | 4,046 | 4,786 | 100.0 | 100.0 | 740 | 18.3 |
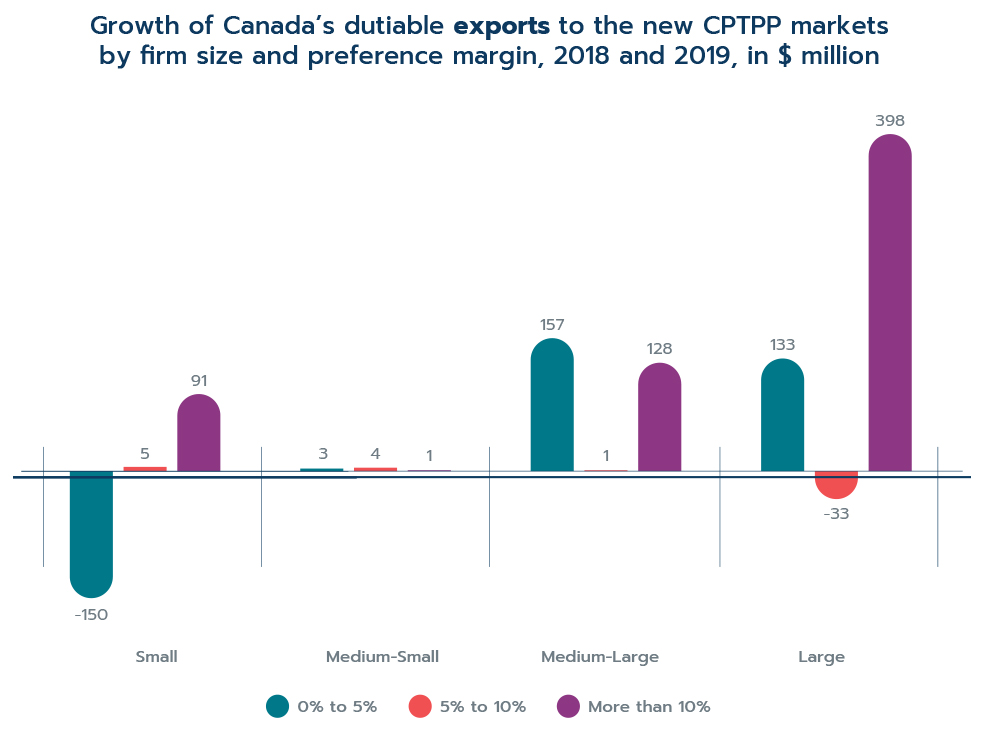
To complement the above analysis of Canada’s dutiable exports at the aggregate level, a breakdown of dutiable exports by size of MFN tariff reduction, or preference margin, provides deeper insights into the effectiveness of the agreement.
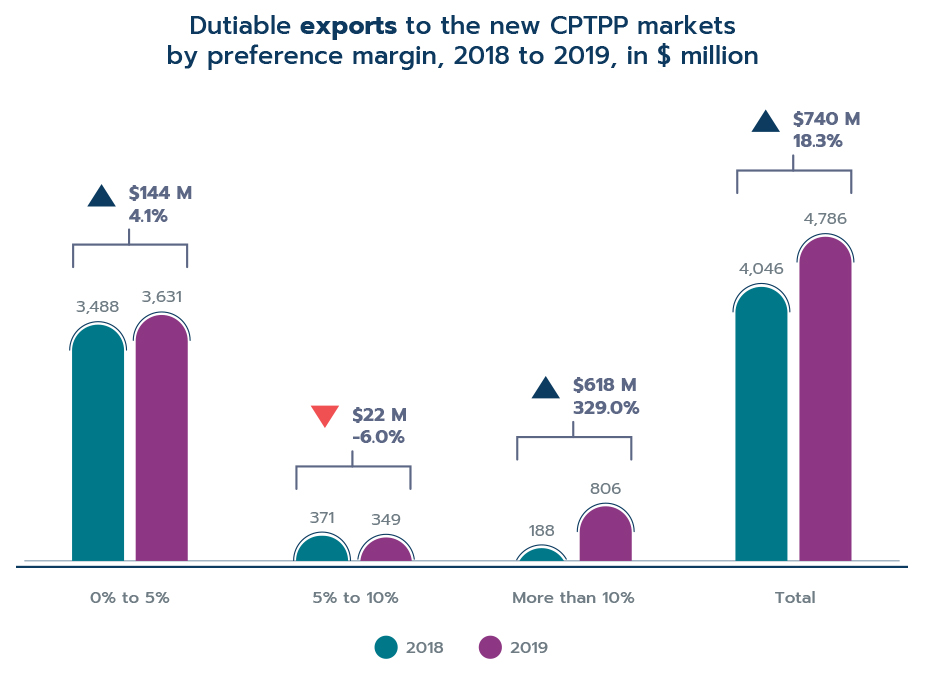
Figure 21 shows the value of Canada’s dutiable exports to the new CPTPP markets by preference margin.Footnote 9 The growth in dutiable exports was spearheaded by products with preference margins greater than 10 percentage points, which highlights the effectiveness of the CPTPP. These exports skyrocketed by 329.0% or $618 million during the first year of the agreement, a jump that accounts for more than 80% of the total increase in dutiable exports. On the other hand, exports with the smallest tariff reductions recorded minor gains from 2018 to 2019, despite making up more than 85% of total dutiable exports in 2019, and exports with tariff reductions between 5 and 10 percentage points decreased slightly.Footnote 10
Figure 21:
Data: Statistics Canada
Text version
Figure 21: Dutiable exports to the new CPTPP markets by preference margin, 2018 to 2019, in $ million
| 0% to 5% | 5% to 10% | More than 10% | Total | |
|---|---|---|---|---|
| Exports in 2018 ($ million) | 3,488 | 371 | 188 | 4,046 |
| Exports in 2019 ($ million) | 3,631 | 349 | 806 | 4,786 |
| Growth of Exports from 2018-19 ($ million) | 144 | -22 | 618 | 740 |
A closer analysis of dutiable exports by preference margin and destination country reveals that Japan was the primary destination for Canada’s dutiable exports across all ranges of preference margins. In terms of growth, Japan led the increase for exports with preference margins greater than 10%, which surged by 330.4% or $618 million from 2018 to 2019, and Australia was the key driver behind the gains for preference margins from 0% to 5%. On the other hand, exports with tariff reductions between 5% and 10% dropped by 5.9% for Japan and 33.9% for New Zealand.
With respect to firm size, the growth in dutiable exports with preference margins less than 5% was propelled by medium-large firms (see Figure 22). Large firms saw an important increase as well, while small firms suffered a decline of $150 million, or 13.8%. In contrast, the opposite is observed for preference margins between 5% and 10%; small firms experienced the largest dollar increase and large firms recorded a drop in exports. Finally, dutiable exports that received a tariff reduction above 10% increased for all firm sizes. Large firms reported the largest dollar increase, as their exports ballooned by nearly $400 million or 238.8%. Medium-large firms and small firms also saw their exports explode between 2018 and 2019.
Figure 22 Footnote 11:
Data: Statistics Canada
Text version
Figure 22: Growth of Canada’s dutiable exports to the new CPTPP markets by firm size and preference margin, 2018 and 2019, in $ million
| Firm Size | 0% to 5% | 5% to 10% | More than 10% |
|---|---|---|---|
| Small | -150 | 5 | 91 |
| Medium-Small | 3 | 4 | 1 |
| Medium-Large | 157 | 1 | 128 |
| Large | 133 | -33 | 398 |
5.3. Growth in firm employment
The following section provides an overview of employment in firms that export under the CPTPP. Seeing that most of these exporting firms also export to other major destinations, such as the United States and Europe, it is not possible to associate the change in employment with exports to CPTPP countries.
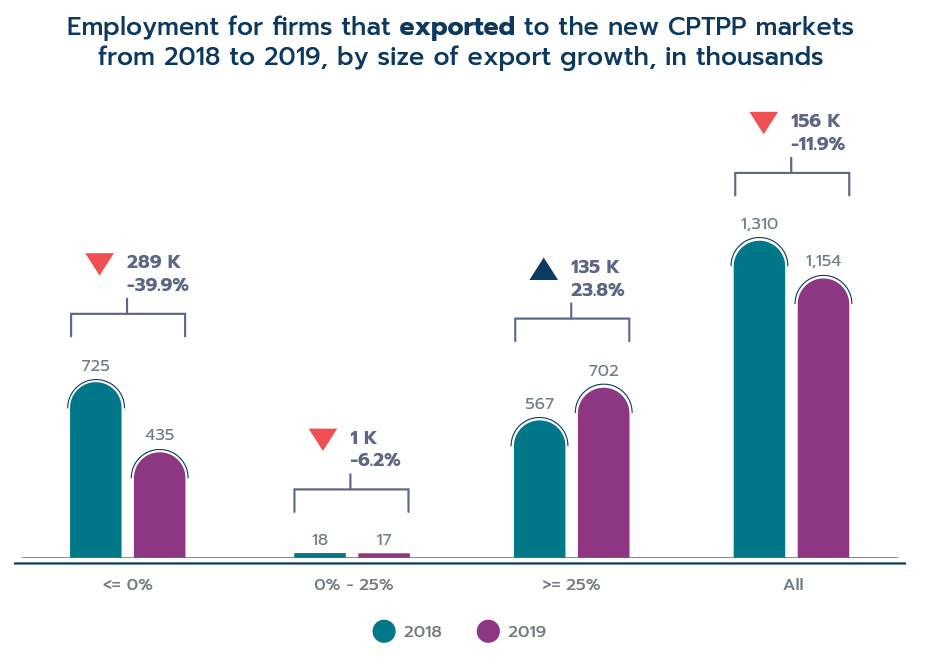
The number of employees in firms that exported to the new CPTPP markets totalled 1.3 million in 2018, which represented 7.1% of total Canadian employment that year. Males accounted for 68.2% of the workforce, while 31.8% of workers were female.
When employment is broken down by the amount of export growth reported by firms between 2018 and 2019, as shown in Figure 23, firms with exports that increased by more than 25%, or high-growth firms, experienced an increase in employment, indicating a correlation between employment growth and CPTPP trade. Specifically, their workforce expanded by 23.8% or 135,000 employees in the year following the CPTPP’s entry into force.
Figure 23:
Data: Statistics Canada
Text version
Figure 23: Employment for firms that exported to the new CPTPP markets from 2018 to 2019, by size of export growth, in thousands
| Export growth from 2018 to 2019 | Employment in 2018, in thousands | Employment in 2019, in thousands | Growth from 2018-2019, in thousands | Growth from 2018-2019, in % |
|---|---|---|---|---|
| <= 0% | 725 | 435 | - 289 | -39.9 |
| 0% - 25% | 18 | 17 | - 1 | -6.2 |
| >= 25% | 567 | 702 | 135 | 23.8 |
| All | 1,310 | 1,154 | - 156 | -11.9 |
5.4. Growth in female employment
It is a common belief that trade can create better environments for women, be it through better jobs or higher income. By providing enhanced access to foreign markets, FTAs allow firms engaging in trade to produce more, earn more and hire more. Women employed in these firms can in turn benefit from the improved market access through direct and indirect channels.
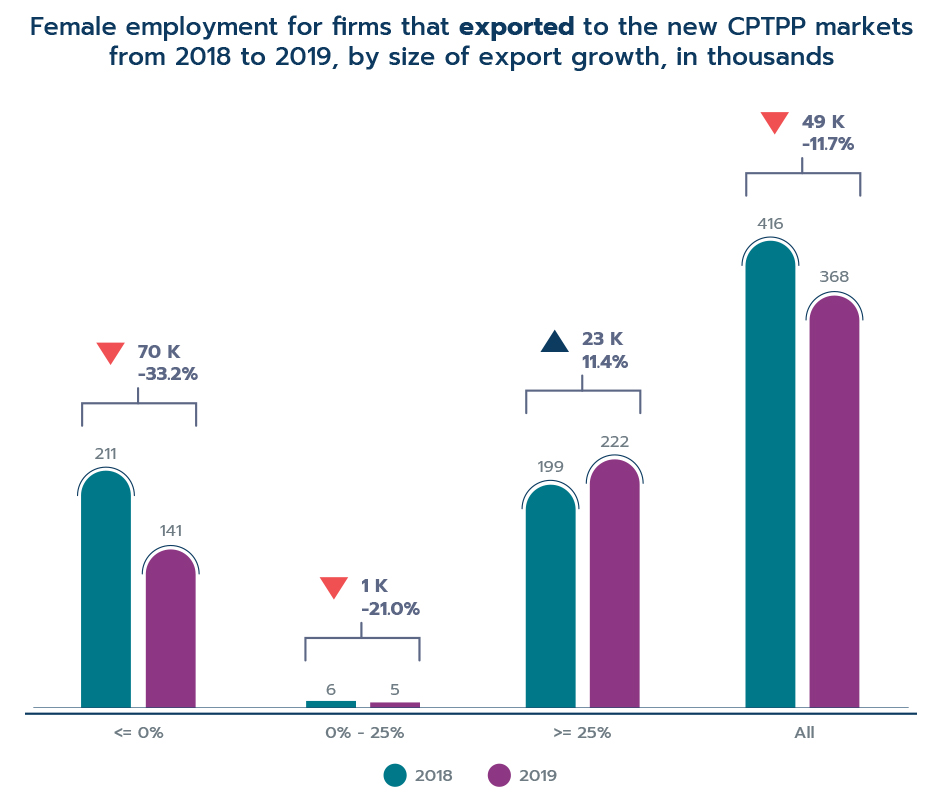
In the case of the CPTPP, female employment for high-growth firms grew 11.4% in the year following the agreement’s implementation (see Figure 24). In contrast, low-growth firms saw their female workforce shrink by 21.0%, and the number of female workers dropped by 33.2% for firms that reported negative export growth from 2018 to 2019.
Figure 24:
Data: Statistics Canada
Text version
Figure 24: Female employment for firms that exported to the new CPTPP markets from 2018 to 2019, by size of export growth, in thousands
| Export growth from 2018 to 2019 | Employment in 2018, in thousands | Employment in 2019, in thousands | Growth from 2018-2019, in thousands | Growth from 2018-2019, in % |
|---|---|---|---|---|
| <= 0% | 211.4 | 141.2 | - 70 | -33.2 |
| 0% - 25% | 6.1 | 4.8 | - 1 | -21.0 |
| >= 25% | 198.9 | 221.5 | 23 | 11.4 |
| All | 416.4 | 367.5 | - 49 | -11.7 |
Unsurprisingly, the trends in female employment follow the overall employment trends identified in the previous section. There are two takeaways from this analysis. The first takeaway is that high export growth to new markets is associated with growth in total employment and female employment. The second takeaway is that it appears that women are somewhat shielded from employment losses stemming from negative export growth, but women also do not benefit from high export growth at the same rate as men. For example, despite making up 31.8% of workers, female job losses accounted for just 24.2% of job losses. However, females also only accounted for 17.0% of the job growth in high growth firms. Thus, female employment is somewhat sticky: while females appear to be less likely to lose their jobs relative to their male colleagues, they are also less likely to benefit from new hiring associated with rapid export growth. The reason for this finding is unclear, however.
Conclusion
This report has provided a first look at the impact of the CPTPP on Canada’s trade, particularly with new FTA partner countries. So far, early indications show that the CPTPP has been a success, with Canada’s total merchandise trade with the new CPTPP markets growing by 10% since the agreement’s entry into force, even despite the pandemic.
An examination of the trade data by size of MFN tariff has shown that Canada’s exports benefitting from tariff reductions under the CPTPP increased by 18.3% in the first year after the agreement was signed, and the growth in exports was largest for products that received the highest tariff reductions. In fact, exports that had a tariff reduction of larger than 10 percentage points grew by 329.0% or or $618 million during the first year of the agreement, representing over 80% of the dutiable export gains.
In terms of exports by firm size, large and medium-large firms benefited the most from the tariff reductions. Notably, large firms saw their dutiable exports expand by 24.0% or $499 million from 2018 to 2019, and medium-large firms recorded an increase of 61.1%.
The utilization of CPTPP preferences has steadily improved in both trade directions over the last few years, although the rates have varied widely across countries. While Canadian exporters were quick to begin utilizing the agreement to take advantage of large tariff cuts in countries like Japan, utilization of the agreement has been lower for countries with overlapping FTAs, though this is not unexpected with agreements such as CUSMA already being in place.
Finally, Canadian employment data revealed that high export growth firms grew the most in terms of employment, though the employment gains mostly accrued for men. On the other hand, firms that experienced negative export growth over the same time period experienced significant employment losses mostly for men, while women were a little more insulated from the job losses.
- Date modified: