
Economic Impact of the Canada-Colombia Free Trade Agreement
Overview
The year 2021 marks the 10-year anniversary of the implementation of the Canada-Colombia Free Trade Agreement (CCoFTA) which entered into force on August 15, 2011. Although the tariff reductions committed to in the agreement are not yet fully implemented, Canadian exporters have already benefited from reduced or eliminated tariffs on nearly all of their exports to Colombia.Footnote 1 The implementation of CCoFTA also provides a more predictable, transparent and rules-based trading environment for Canadian investors and businesses.Footnote 2
The 10-year post-implementation period has provided enough facts and data that a thorough and objective assessment of the CCoFTA can now be performed to examine whether the agreement has delivered on its benefits and potential. This report will review the trade performances of the two partners by comparing the pre-CCoFTA period (prior to 2011) with the post-CCoFTA period (from 2012 onward) with a focus on trade advances since the implementation and the effect of tariff reductions.Footnote 3
Canadian and Colombian economies
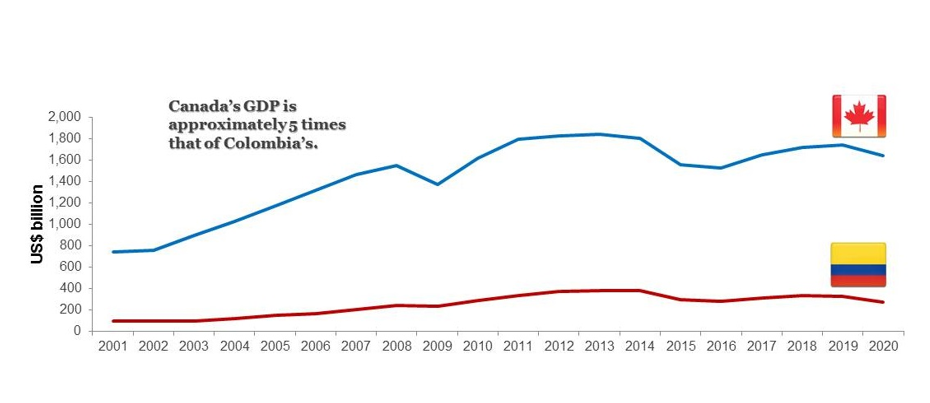
Canada’s economic size is approximately five times that of Colombia in terms of gross domestic product (GDP, Figure 1). Overall, Canada and Colombia were both on the paths of economic growth when the CCoFTA was signed. Canada experienced some setback in 2015-2016 but had regained the growth momentum thereafter. It was similar for Colombia, albeit on a smaller scale. Both countries are commodity-exporting economies that had faced a multitude of commodity price declines in the last decade that significantly affected the respective trade growths of both countries. Compared to 2014, the world commodity prices in 2019 and in 2020 were 38% and 56% lower, respectively. As shown in Figure 2, the commodity price of energy fell abruptly in 2014 and only recovered slightly from 2016 onward. These lower commodity prices in particular the oil prices, posed serious challenges to economies that rely heavily on commodity exports.
Figure 1: GDP of Canada and Colombia, 2001-2020, in US$ billions
Text version - Figure 1
| Year | GDP of Canada | GDP of Colombia |
|---|---|---|
| 2001 | 739 | 98 |
| 2002 | 761 | 98 |
| 2003 | 896 | 95 |
| 2004 | 1,027 | 117 |
| 2005 | 1,173 | 146 |
| 2006 | 1,319 | 162 |
| 2007 | 1,469 | 206 |
| 2008 | 1,553 | 242 |
| 2009 | 1,375 | 232 |
| 2010 | 1,617 | 287 |
| 2011 | 1,793 | 335 |
| 2012 | 1,828 | 371 |
| 2013 | 1,847 | 382 |
| 2014 | 1,806 | 381 |
| 2015 | 1,557 | 293 |
| 2016 | 1,528 | 283 |
| 2017 | 1,649 | 312 |
| 2018 | 1,729 | 334 |
| 2019 | 1,742 | 323 |
| 2020 | 1,643 | 271 |
Data: World Bank
Source: Office of the Chief Economist, Global Affairs Canada
The lower commodity prices had led to large exchange rate fluctuations that further dampened the economic situation. The Canadian dollar had depreciated by more than 25% against the US dollar in nominal terms since 2012; and the Colombian peso had also depreciated by approximately 51% in the same period (Figure 3). After a brief stabilization from 2016 to 2018, the Canadian dollar dipped again slightly in 2019 while the Colombian peso continued to depreciate against the US dollar. These exchange rate fluctuations can weaken the ability of export-oriented economies to purchase foreign goods.
Figure 2: Bank of Canada commodity price (BCP) indices, 2001-2020

Text version - Figure 2
| Year | Total | Energy |
|---|---|---|
| 2001 | 290 | 630 |
| 2002 | 275 | 586 |
| 2003 | 332 | 802 |
| 2004 | 403 | 969 |
| 2004 | 506 | 1,397 |
| 2006 | 534 | 1,383 |
| 2007 | 569 | 1,469 |
| 2008 | 687 | 1,986 |
| 2009 | 462 | 1,188 |
| 2010 | 560 | 1,479 |
| 2011 | 659 | 1,735 |
| 2012 | 621 | 1,556 |
| 2013 | 619 | 1,630 |
| 2014 | 606 | 1,612 |
| 2015 | 387 | 845 |
| 2016 | 352 | 746 |
| 2017 | 408 | 926 |
| 2018 | 444 | 1,035 |
| 2019 | 427 | 1,000 |
| 2020 | 381 | 690 |
Data: Bank of Canada
Source: Office of the Chief Economist, Global Affairs Canada
The Canadian economy
Canada was ranked the 10th largest economy by the World Bank with a GDP of $2.30 trillion (US$1.74 trillion)Footnote 4 and a population of 37.6 million in 2019.Footnote 5 Its per capita GDP stood at $61,289 (US$46,326).Footnote 6 There are few barriers to trade and investment, which makes Canada one of the world’s most open economies.
In 2019, Canada’s total trade in goods and services equaled approximately 65% of Canada’s GDP.Footnote 7 In fact, Canada’s merchandise trade with the world grew since the early 2000s but both imports and exports declined profoundly in 2008. After that, the growth momentum of the early 2000s had resumed in 2010, and exports and imports appear to be mostly in sync with each other, moving closely in their growth and decline. From 2001 to 2020, Canada’s total merchandise exports grew at an annual rate of 2.0% while total merchandise imports grew at close to 3.1%. Even though Canada trades with many countries, the United States remains Canada’s largest trading partner, with over 75% of its merchandise exports destined to that market.
Figure 3: Exchange rates of Canadian dollar and Colombian peso per US dollar, 2001-2020

Text version - Figure 3
| Year | Canadian dollar | Colombian peso |
|---|---|---|
| 2001 | 1.548416 | 2,299.77 |
| 2002 | 1.57036 | 2,507.96 |
| 2003 | 1.401462 | 2,877.50 |
| 2004 | 1.30152 | 2,626.22 |
| 2005 | 1.211632 | 2,320.77 |
| 2006 | 1.134094 | 2,357.98 |
| 2007 | 1.074781 | 2,078.35 |
| 2008 | 1.066014 | 1,966.26 |
| 2009 | 1.141977 | 2,156.29 |
| 2010 | 1.029939 | 1,897.89 |
| 2011 | 0.989069 | 1,848.17 |
| 2012 | 0.99958 | 1,798.23 |
| 2013 | 1.029915 | 1,868.90 |
| 2014 | 1.104466 | 2,000.68 |
| 2015 | 1.278711 | 2,746.47 |
| 2016 | 1.324806 | 3,053.42 |
| 2017 | 1.2986 | 2,951.15 |
| 2018 | 1.2957 | 2,956.55 |
| 2019 | 1.3269 | 3,282.39 |
| 2020 | 1.3415 | 3,691.27 |
Data: Bank of Canada, Banco de la República
Source: Office of the Chief Economist, Global Affairs Canada
Service-producing industries are the leading sectors in the Canadian economy, making up 70.8% of Canada’s GDP in 2019, and employing 79.3% of the total Canadian labour force. In the past decade, the share of services in Canada’s GDP increased steadily as the importance of other sectors in Canadian GDP declined.
The Canadian economy has been expanding at an average annual rate of 2.1% in terms of real GDP during the past decade. However, as a major commodity producer, Canada was also one of the developed economies hardest-hit by declining commodity prices. The energy sector, which accounted for one-fifth of total Canadian merchandise exports, was the most affected in the recent years. Over the last few years, Canada’s international exports have mostly experienced favourable growth except in the natural resources sector. In fact, both exports and imports reached their peak levels in 2019 before the pandemic.
Figure 4: Canadian merchandise trade with the world, 2001-2020, in US$ billions

Text version - Figure 4
| Year | Exports | Imports |
|---|---|---|
| 2001 | 261.0 | 221.6 |
| 2002 | 252.4 | 222.2 |
| 2003 | 272.4 | 240.3 |
| 2004 | 317.5 | 274.2 |
| 2005 | 360.7 | 314.6 |
| 2006 | 388.3 | 350.2 |
| 2007 | 420.3 | 380.7 |
| 2008 | 456.5 | 408.9 |
| 2009 | 316.5 | 321.7 |
| 2010 | 387.5 | 392.1 |
| 2011 | 451.6 | 451.7 |
| 2012 | 455.5 | 462.4 |
| 2013 | 458.2 | 461.8 |
| 2014 | 476.9 | 463.8 |
| 2015 | 410.1 | 419.7 |
| 2016 | 390.0 | 402.9 |
| 2017 | 420.7 | 433.2 |
| 2018 | 450.7 | 459.7 |
| 2019 | 446.6 | 453.4 |
| 2020 | 390.8 | 405.6 |
Data: Global Trade Atlas
Source: Office of the Chief Economist, Global Affairs Canada
The Colombian economy
With a population of 50.4 million, Colombia is the third most populous country in Latin America, behind only Brazil and Mexico.Footnote 8 Colombia’s impressive economic growth over the past two decades can be attributed to pro-market economic policies, improved domestic security and careful fiscal management, with an inflation-targeting regime and flexible exchange rates. These policies have allowed Colombia to achieve consistent economic growth. Colombia’s GDP grew 229.3% from US$98.2 billion in 2001 to US$323.4 billion in 2019.Footnote 9
The Colombian economy depends heavily on its energy and agricultural exports. Through the 17 FTAs it signed since 1994, some of which with major economies including the U.S. and the EU, Colombia managed to strengthen its position as a major global supplier of coffee, cut flowers, bananas and mineral fuels. However, as a major supplier of mineral fuels, it is greatly exposed to the large fluctuations in commodity prices. The commodity price decline since 2014 was the main contributor to Colombia’s GDP falling from its peak of US$382.1 billion in 2013.
As of 2019, Colombia also has a high unemployment rate at close to 10%.Footnote 10 The low productivity of the country can be attributed to a large infrastructure gap and low skill levels. Nevertheless, Colombia has continued to improve and sustain its economic growth through removing trade barriers.
Figure 5: Colombian merchandise trade with the world, 2000-2019, in US$ billions

Text version - Figure 5
| Year | Exports | Imports |
|---|---|---|
| 2001 | 12.2 | 12.7 |
| 2002 | 11.6 | 12.3 |
| 2003 | 12.9 | 13.6 |
| 2004 | 16.4 | 16.5 |
| 2005 | 21.1 | 21.1 |
| 2006 | 23.7 | 25.5 |
| 2007 | 29.1 | 32.6 |
| 2008 | 37.6 | 39.7 |
| 2009 | 32.9 | 32.9 |
| 2010 | 39.6 | 40.7 |
| 2011 | 56.5 | 54.7 |
| 2012 | 60.7 | 59.1 |
| 2013 | 58.8 | 59.4 |
| 2014 | 54.8 | 64.0 |
| 2015 | 35.7 | 54.1 |
| 2016 | 31.8 | 44.9 |
| 2017 | 37.8 | 46.1 |
| 2018 | 41.8 | 51.2 |
| 2019 | 39.5 | 52.7 |
| 2020 | 31.1 | 43.5 |
Data: Global Trade Atlas
Source: Office of the Chief Economist, Global Affairs Canada
From 2001 to 2012, Colombia’s trade with the world was on a rising trend. By 2012, the total Colombian exports had peaked at US$60.7 billion while the total imports reached a high of US$64.0 billion in 2014. Subsequent to the commodity price decline in 2014, Colombian exports to the world dropped quite sharply possibly due to the lower commodity prices (Figure 5). One intriguing observation is that the lower commodity prices that reduced Colombian exports did not rein in too much of its purchase of foreign goods. Another interesting phenomenon is that Colombia did not appear to finance its imports with exports as it imported more than exported in both goods and services since 2014. As shown in both Figures 5 and 6, Colombia’s bilateral trade in goods and services exhibit a similar pattern with imports larger than exports in the recent years.
Figure 6: Colombian services trade with the world, 2000-2019, in US$ billionsFootnote 11

Text version - Figure 6
| Year | Exports | Imports |
|---|---|---|
| 2010 | 6.024 | 10.626 |
| 2011 | 6.526 | 12.135 |
| 2012 | 7.548 | 13.968 |
| 2013 | 8.284 | 14.714 |
| 2014 | 8.528 | 16.219 |
| 2015 | 8.434 | 13.96 |
| 2016 | 8.706 | 12.981 |
| 2017 | 9.536 | 14.013 |
| 2018 | 10.731 | 14.893 |
| 2019 | 10.668 | 14.952 |
Data: International Monetary Fund
Source: Office of the Chief Economist, Global Affairs Canada
Bilateral merchandise trade under CCoFTA
From 2010, the year before CCoFTA came into effect, to the year 2019, merchandise trade has been steadily rising between the two partner countries. Total merchandise trade between Canada and Colombia reached a record high of $2.1 billion in 2018, but dropped slightly to $2.0 billion in 2019 (Figure 7). The decline was due to the decrease in Colombian exports to Canada in the last quarter of 2019. Despite this, when compared to the pre-CCoFTA level in 2010, total merchandise trade between Canada and Colombia in 2019 had increased by 28.5%.
Figure 7: Merchandise trade between Canada and Colombia, 2001-2020, in $ millions

Text version - Figure 7
| Year | Canadian exports | Colombian exports |
|---|---|---|
| 2001 | 528.0 | 415.5 |
| 2002 | 416.3 | 393.0 |
| 2003 | 429.5 | 373.9 |
| 2004 | 492.3 | 418.6 |
| 2005 | 469.3 | 583.6 |
| 2006 | 551.8 | 640.4 |
| 2007 | 681.0 | 468.6 |
| 2008 | 848.4 | 638.8 |
| 2009 | 765.8 | 733.6 |
| 2010 | 847.6 | 717.3 |
| 2011 | 952.8 | 799.4 |
| 2012 | 1,140.4 | 664.7 |
| 2013 | 1,032.7 | 691.4 |
| 2014 | 1,284.4 | 891.8 |
| 2015 | 1,120.7 | 829.0 |
| 2016 | 1,014.5 | 787.0 |
| 2017 | 1,027.2 | 982.3 |
| 2018 | 1,097.9 | 1,038.6 |
| 2019 | 1,179.8 | 830.4 |
| 2020 | 1,007.7 | 848.8 |
Data: Global Trade Atlas
Source: Office of the Chief Economist, Global Affairs Canada
Canadian exports to Colombia have seen an impressive increase, reaching close to $1.2 billion in 2019 from the pre-CCoFTA level of $847.6 million in 2010, an increase of 39.2% (Figure 7). From 2010 to 2019, exports by Canada to Colombia grew at an average annual growth rate of 4.5%. On the other hand, Colombian exports to Canada increased about 15.8% from the pre-CCoFTA level of $717.3 million in 2010 to $830.4 million in 2019.
In 2020, COVID-19 negatively affected the global trade as plenty of international shipments entered a standstill for many countries. The trade between Canada and Colombia also experienced decreases in both directions: total trade dropped approximately 7.7% from around $2.0 billion in 2019 to around $1.9 billion in 2020. However, the drop was mainly attributed to the decrease in Canadian exports to Colombia (Figure 7).
Growth in exporters
Firms that engaged in the Canada-Colombia bilateral trade have been predominantly small and medium-sized enterprises (SMEs), which consist of 0 to 499 employees per firm. Of the 810 Canadian businesses that exported to Colombia in 2010, 695 of them (85.8%) were SMEs. The implementation of CCoFTA appears to encourage businesses in this size group to engage more in exporting to Colombia. In 2019, the number of SMEs exporting to Colombia grew to 828 out of 926 exporters (89.4%). However, the number of large exporters (with 500 and more employees) reduced quite sharply from 2010 to 2019, falling by more than 14% (Table 1). The trend of more SMEs engaging in trade with Colombia is similar when it comes to imports. In 2010, 1,312 of the 1,506 firms (87.1%) that imported from Colombia were SMEs, while in 2019, 1,558 of the 1,783 businesses were SMEs (87.4%), representing an increase of over 18% (Table 1).
Table 1: Canadian firms exporting to and importing from Colombia, pre- and post- CCoFTA
Exporters
| Firm size | 2010 | 2019 | 2020 | Growth 2010-2019 (%) | Growth 2010-2020 (%) |
|---|---|---|---|---|---|
| Small and medium | 695 | 828 | 707 | 19.1 | 1.7 |
| Large | 115 | 98 | 88 | -14.8 | -23.5 |
| Total | 810 | 926 | 795 | 14.3 | -1.9 |
Importers
| Firm size | 2010 | 2019 | 2020 | Growth 2010-2019 (%) | Growth 2010-2020 (%) |
|---|---|---|---|---|---|
| Small and medium | 1,132 | 1,558 | 1,375 | 18.8 | 4.8 |
| Large | 194 | 225 | 199 | 16.0 | 2.6 |
| Total | 1,506 | 1,783 | 1,574 | 18.4 | 4.5 |
Data: Statistics Canada
Source: Office of the Chief Economist, Global Affairs Canada
Sectoral performance
Agricultural products represented as much as 51.6% of total bilateral trade in goods between Canada and Colombia in 2019. Trade in agricultural products was 60.6% higher in 2019 compared to the pre-CCoFTA level in 2010; much of this growth can be attributed to growth in Canadian exports of agricultural products to Colombia. Between 2010 and 2019, Canadian exports of cereals, edible vegetables and meat to Colombia were the agricultural products that increased most significantly. For non-agricultural products, the post-CCoFTA growth in 2019 was quite mild, up by only 5.8% compared to the pre-CCoFTA level in 2010 (Table 2).
Table 2: Total Canada-Colombia merchandise trade, sectors with largest growth, in
$ millionsFootnote 12
| 2010 | 2019 | 2020 | Growth 2010-2019 (%) | Growth 2010-2020 (%) | |
|---|---|---|---|---|---|
| Agricultural products | 646 | 1,037 | 1,123 | 60.6 | 73.8 |
| Non-agricultural products | 919 | 972 | 732 | 5.8 | -20.2 |
| Cereals | 187 | 421 | 458 | 125.7 | 145.3 |
| Coffee and tea | 169 | 252 | 280 | 49.7 | 66.4 |
| Live trees & plants | 70 | 107 | 88 | 51.8 | 25.0 |
| Pharmaceutical products | 26 | 61 | 55 | 131.4 | 110.9 |
| Plastics | 33 | 53 | 53 | 60.2 | 57.8 |
Data: Global Trade Atlas
Source: Office of the Chief Economist, Global Affairs Canada
At the sector level, the largest increases by absolute value in total Canada-Colombia trade in goods between 2010-2019 have taken place in cereals (HS chapter 10), coffee and teas (HS Chapter 9), live trees and plants (HS chapter 6), pharmaceutical products (HS Chapter 30), and plastics (HS Chapter 39).Footnote 13 One thing to note is that the trade in live trees and plants was entirely due to Colombia exporting to Canada. These five chapters together accounted for 44.5% of total Canada-Colombia trade in 2019 (Table 2).
In 2020, however, while Canada and Colombia continued to trade heavily in all of these five chapters, under the adverse influence of COVID-19 pandemic, trade in edible vegetables (HS Chapter 7) and miscellaneous edible preparations (HS Chapter 21) displaced live trees and plants, and plastics in the top five traded product sectors, with an increase of 52.5% (or $33.4 million) and 188.3% (or $21.3 million) respectively, in 2020 compared to 2010.
Table 3: Sectors with largest exports growth, in $ millionsFootnote 14
Canadian exports to Colombia
| 2010 | 2019 | 2020 | Growth 2010-2019 (%) | Growth 2010-2020 (%) | |
|---|---|---|---|---|---|
| Agricultural products | 288 | 548 | 599 | 90.1 | 107.8 |
| Non-agricultural products | 559 | 631 | 409 | 12.9 | -26.9 |
| Cereals | 187 | 421 | 458 | 125.7 | 145.3 |
| Mineral fuels and oils | 15 | 75 | 3 | 409.1 | -78.8 |
| Pharmaceutical products | 23 | 56 | 50 | 142.9 | 116.3 |
| Medical equipment | 11 | 27 | 17 | 138.4 | 47.9 |
| Misc. edible preparations | 2 | 16 | 18 | 889.3 | 977.3 |
Colombian exports to Canada
| 2010 | 2019 | 2020 | Growth 2010-2019 (%) | Growth 2010-2020 (%) | |
|---|---|---|---|---|---|
| Agricultural products | 358 | 490 | 524 | 36.9 | 46.5 |
| Non-agricultural products | 359 | 340 | 323 | -5.2 | -10.0 |
| Coffee and tea | 169 | 252 | 280 | 49.7 | 66.4 |
| Live trees & plants | 70 | 107 | 88 | 51.8 | 25.0 |
| Articles of iron or steel | 1 | 17 | 9 | 1,195.1 | 575.3 |
| Fish & crustaceans | 1 | 12 | 18 | 912.8 | 1,383.5 |
| Electrical machinery | 1 | 9 | 12 | 550.8 | 802.6 |
Data: Global Trade Atlas
Source: Office of the Chief Economist, Global Affairs Canada
Canada’s exports to Colombia of cereals (HS Chapter 10), mineral fuels and oils (HS Chapter 27), pharmaceutical products (HS Chapter 30), medical equipment (HS Chapter 90) and miscellaneous edible preparations (HS Chapter 21) increased the most in 2019 compared to pre-CCoFTA levels in 2010. However, in 2020, under the influence of the COVID-19 pandemic, only exports of cereals and edible preparations continued to grow (Table 3).
Colombian exports to Canada that increased the most in 2019 compared to pre-CCoFTA include coffee and tea (HS Chapter 9), live trees and plants (HS Chapter 6), articles of iron or steel (HS Chapter 73), fish and crustaceans (HS Chapter 3), and electrical machinery (HS Chapter 85). Among these five sectors, exports of live trees and plants and articles of iron or steel decreased noticeably in 2020 while Colombian exports to Canada in the other three continued to grow (Table 3).
Dutiable and duty-free trade under CCoFTA
All goods trade comprises duty-free trade and dutiable trade. The latter is subject to Most Favoured Nation (MFN) duties, which are usually reduced to duty-free under FTAs. As such, almost all dutiable products traded between Canada and Colombia are expected to have their tariffs removed under CCoFTA (unless they are exempted from CCoFTA commitments). In other words, increases in dutiable trade can reflect the extent to which the benefits of an FTA are being realised as the lower preferential rates encourage trade that was previously sluggish.
In 2019, approximately 29.8% of total Canadian merchandise exports to Colombia were dutiable. Compared to 2010, Canadian dutiable exports to Colombia dropped by 49.7% to $351 million in 2019 (Table 4).Footnote 15 The following Canadian dutiable exports to Colombia demonstrated the strongest performance in 2019: edible vegetables (HS Chapter 7), pharmaceutical products (HS Chapter 30), airplanes and parts (HS Chapter 88), motor vehicles and parts (HS Chapter 87) and machinery (HS Chapter 84) (Table 5). These five HS chapters made up 67.1% of total dutiable exports to Colombia.
During the COVID-19 pandemic, Canadian dutiable exports to Colombia in 2020 have decreased by 22.2% compared to 2019 to $273 million (Table 4). In 2020, edible vegetables (HS Chapter 7), pharmaceutical products (HS Chapter 30), and machinery (HS Chapter 84) continued as the top dutiable exports. However, among the top exports, edible preparations (HS Chapter 21) and rubber articles (HS Chapter 39) displaced airplanes and parts and motor vehicles and parts.
Table 4: Dutiable and duty-free trade between Canada and Colombia, 2010 and 2019, in $ millionsFootnote 16Footnote 17
Canadian exports to Colombia
| 2010 | 2019 | 2020 | Growth 2010-2019 ($) | Growth 2010-2019 (%) | |
|---|---|---|---|---|---|
| Dutiable | 698 | 351 | 273 | -347 | -49.7 |
| Duty-free | 138 | 828 | 734 | 690 | 499.4 |
| Total | 836 | 1,179 | 1,007 | 343 | 41.0 |
Colombian exports to Canada
| 2010 | 2019 | 2020 | Growth 2010-2019 ($) | Growth 2010-2019 (%) | |
|---|---|---|---|---|---|
| Dutiable | 121 | 159 | 135 | 38 | 31.6 |
| Duty-free | 596 | 671 | 714 | 75 | 12.6 |
| Total | 717 | 830 | 849 | 113 | 15.8 |
Data: Global Trade Atlas, Government of Colombia, Statistics Canada
Source: Office of the Chief Economist, Global Affairs Canada
Figure 8: Dutiable exports, in $ millions

Text version - Figure 8
| Year | Canadian exports to Colombia |
|---|---|
| 2010 | 698 |
| 2019 | 351 |
| 2020 | 273 |
| Year | Colombian exports to Canada |
|---|---|
| 2010 | 121 |
| 2019 | 159 |
| 2020 | 135 |
Data: Global Trade Atlas
Source: Office of the Chief Economist, Global Affairs Canada
Compared to 2010, dutiable exports by Colombia to Canada grew 31.4% to reach $159 million in 2019 (representing 16.9% of total merchandise exports by Colombia to Canada). The top Colombian dutiable exports to Canada in 2019 include live trees and plants (HS Chapter 6), sugar and confectionery (HS Chapter 17), apparel (HS Chapters 61 and 62) and articles of stone and cement (HS Chapter 68). Dutiable exports from these five HS chapters made up as much as 83.9% of total Colombian dutiable exports. In 2020, live trees continued to be the top Colombian dutiable export to Canada even though the amount exported had reduced by more than 17% (Table 5).
Table 5 shows that the value of Canadian dutiable exports in machinery in 2019 decreased compared to 2010, which was due to the unilateral tariff reductions rather than an actual decline in dutiable exports of Canadian machinery.
Table 5: Top dutiable exports, 2010, 2019 and 2020, in $ millionsFootnote 18
Canadian exports to Colombia
| 2010 | 2019 | 2020 | Growth 2010-2019 (%) | Growth 2010-2020 (%) | |
|---|---|---|---|---|---|
| Edible vegetables | 63 | 77 | 94 | 22.0 | 50.1 |
| Pharmaceutical products | 23 | 55 | 49 | 136.3 | 112.5 |
| Airplanes and parts | 2 | 51 | 1 | 2,744.5 | -61.9 |
| Motor vehicles and parts | 17 | 33 | 10 | 97.0 | -43.1 |
| Machinery | 114 | 20 | 15 | -82.5 | -86.7 |
Colombian exports to Canada
| 2010 | 2019 | 2020 | Growth 2010-2019 (%) | Growth 2010-2020 (%) | |
|---|---|---|---|---|---|
| Live trees & plants | 70 | 106 | 87 | 50.8 | 23.7 |
| Sugar & confectionery | 17 | 9 | 5 | -47.3 | -69.3 |
| Apparel, knitted | 3 | 7 | 6 | 166.7 | 107.1 |
| Apparel, not knitted | 4 | 7 | 4 | 67.8 | -15.4 |
| Articles of stone & cement | 4 | 5 | 5 | 29.4 | 39.9 |
Data: Global Trade Atlas, Government of Colombia, Canada Border Services Agency
Source: Office of the Chief Economist, Global Affairs Canada
The large decline in Canadian dutiable exports to Colombia in 2019 compared to 2010 was partly the result of the unilateral tariff reduction by Colombia in 2012 when more than 3,000 lines of dutiable HS codes were changed to duty-free (to be discussed next). In other words, most of the exports from Canada to Colombia that might have benefited from the tariff reductions provided by CCoFTA had already been turned into duty-free exports facing zero MFN duties. This minimizes somewhat the obvious benefit of tariff reductions preferential to Canada under CCoFTA.
Table 6 shows the growth in dutiable trade by preference margin based on the tariffs rates in 2019. Trade by all preference margins had grown with the exception of Colombian exports to Canada under the category “0 to 5 percentage points tariff reduction”. For Canadian exports to Colombia, the strongest growth is in the category “5 to 10 percentage points tariff reduction”, which increased over 40% in 2019 compared to 2010. On the other hand, for Colombian exports to Canada, the strongest growth is in the category “More than 10 percentage points tariff reduction” which grew over 100% in 2019 compared to 2010.
Table 6: Trade by preference margin, 2010 and 2019, in $ millionsFootnote 19Footnote 20
| Preference margin (% points) | 2010 | 2019 | Growth 2010-2019 ($) | Growth 2010-2019 (%) |
|---|---|---|---|---|
| Duty-free | 576 | 825 | 249 | 43.3 |
| 0 to 5 | 86 | 120 | 33 | 38.8 |
| 5 to 10 | 64 | 91 | 27 | 41.4 |
| More than 10 | 110 | 142 | 31 | 28.5 |
| Affected | 261 | 352 | 91 | 35.1 |
| Not affected | 587 | 828 | 241 | 41.0 |
Colombian exports to Canada
| Preference margin (% points) | 2010 | 2019 | Growth 2010-2019 ($) | Growth 2010-2019 (%) |
|---|---|---|---|---|
| Duty-free | 602 | 671 | 69 | 11.5 |
| 0 to 5 | 16 | 11 | -4 | -27.5 |
| 5 to 10 | 67 | 81 | 15 | 22.0 |
| More than 10 | 33 | 67 | 34 | 101.1 |
| Affected | 115 | 159 | 44 | 38.0 |
| Not affected | 602 | 672 | 70 | 11.6 |
Data: Statistics Canada, Government of Colombia, Canada Border Services Agency, World Integrated Trade Solutions
Source: Office of the Chief Economist, Global Affairs Canada
In 2019, Canadian duty-free exports to Colombia increased by 497.5% to $825 million (Figure 9) compared to 2010. The strongest Canadian duty-free exports to Colombia in 2019 were cereals (HS Chapter 10), fertilizers (HS Chapter 31), mineral fuels and oils (HS Chapter 27), machinery (HS Chapter 84) and paper and paperboard (HS Chapter 48) (Table 7). Duty-free exports from these five HS chapters made up about 81.4% of total Canadian duty-free exports to Colombia in 2019. One thing worth noticing is that cereals exports to Colombia were entirely dutiable in 2010, but the bulk of cereals exports to Colombia were now duty-free after Colombia’s unilateral tariff reductions. Similarly, Canadian exports of fertilizers and mineral fuels and oils were also dutiable in 2010 and became mostly duty-free.
Figure 9: Duty-free exports, in $ millions

Text version - Figure 9
| Year | Canadian exports to Colombia |
|---|---|
| 2010 | 138 |
| 2019 | 825 |
| 2020 | 734 |
| Year | Colombian exports to Canada |
|---|---|
| 2010 | 596 |
| 2019 | 671 |
| 2020 | 713 |
Data: Global Trade Atlas
Source: Office of the Chief Economist, Global Affairs Canada
Canadian duty-free exports to Colombia decreased by 11.0% from $825 million in 2019 to $734 million in 2020. The top duty-free exports in 2020 were cereals (HS Chapter 10), fertilizers (HS Chapter 31), machinery (HS Chapter 84), rubber articles (HS Chapter 39) and airplanes and parts (HS Chapter 88). Duty-free exports of mineral fuels and oils dropped from $75 million in 2019 by as much as 95.9% to only $3 million in 2020 (Table 7).
Colombian duty-free exports to Canada grew by 12.6% to $671 million in 2019 compared to 2010 (Figure 9). Top Colombian duty-free exports to Canada in 2019 include coffee and tea (HS Chapter 9), mineral fuels and oils (HS Chapter 27), edible fruits and nuts (HS Chapter 8), articles of iron or steel (HS Chapter 73) and plastics (HS Chapter 39) (Table 7). Duty-free exports from these five HS chapters made up as much as 86.8% of total Colombian duty-free exports to Canada. In 2020, coffee and tea, mineral fuels and oils, and edible fruits and nuts remained the top three duty-free exports from Colombia to Canada; fish and crustaceans (HS Chapter 3) and miscellaneous chemical products (HS Chapter 38) supplanted articles of iron or steel and rubber articles.
Table 7: Top duty-free exports, 2010, 2019 and 2020, in $ millions
Canadian exports to Colombia
| 2010 | 2019 | 2020 | Growth 2010-2019 (%) | Growth 2010-2020 (%) | |
|---|---|---|---|---|---|
| Cereals | - | 413 | 451 | ||
| Fertilizers | - | 77 | 63 | ||
| Mineral fuels and oils | - | 75 | 3 | ||
| Machinery | 2 | 74 | 56 | 3,397.3 | 2,549.6 |
| Paper and paperboard | 55 | 35 | 20 | -35.9 | -62.8 |
Colombian exports to Canada
| 2010 | 2019 | 2020 | Growth 2010-2019 (%) | Growth 2010-2020 (%) | |
|---|---|---|---|---|---|
| Coffee and tea | 169 | 252 | 280 | 49.7 | 66.3 |
| Mineral fuels and oils | 293 | 233 | 226 | -20.5 | -22.9 |
| Edible fruits and nuts | 83 | 67 | 85 | -18.8 | 2.5 |
| Articles of iron or steel | 1 | 17 | 9 | 210.3 | 578.0 |
| Plastics | 2 | 14 | 8 | 586.0 | 289.0 |
Data: Statistics Canada, Government of Colombia, Canada Border Services Agency, World Integrated Trade Solutions
Source: Office of the Chief Economist, Global Affairs Canada
Effect of the Colombian Unilateral Tariff Reduction
Trade between Canada and Colombia was characterised by little growth and few fluctuations in the variety of products traded. The number of HS 8-digit tariff lines that Canada exported to Colombia had continuously been between 20% and 25% of the total number of lines in the full Colombian tariff schedule; and most of these products were dutiable. However, the unilateral tariff reduction by Colombia in 2012-2013 had drastically lowered the number of dutiable products on its tariff schedule.
Table 8: Changes in Colombian tariff schedule and Canadian exports to Colombia, 2010-2019
Colombian tariff schedule
| Year | Dutiable lines | Total lines | Share of total (%) |
|---|---|---|---|
| 2010 | 6,864 | 7,105 | 96.6 |
| 2011 | 6,865 | 7,105 | 96.6 |
| 2012 | 3,787 | 7,105 | 53.3 |
| 2013 | 3,993 | 7,267 | 54.9 |
| 2014 | 3,288 | 7,267 | 45.2 |
| 2015 | 3,095 | 7,276 | 42.5 |
| 2016 | 3,076 | 7,276 | 42.3 |
| 2017 | 3,855 | 7,474 | 51.6 |
| 2018 | 3,855 | 7,474 | 51.6 |
| 2019 | 3,455 | 7,475 | 46.2 |
Canadian exports to Colombia
| Year | Dutiable lines | Total lines | Share of total (%) |
|---|---|---|---|
| 2010 | 1,580 | 1,617 | 97.7 |
| 2011 | 1,771 | 1,807 | 97.9 |
| 2012 | 1,727 | 1,757 | 98.3 |
| 2013 | 1,652 | 1,721 | 96.0 |
| 2014 | 835 | 1,685 | 49.6 |
| 2015 | 738 | 1,646 | 44.8 |
| 2016 | 685 | 1,538 | 44.5 |
| 2017 | 788 | 1,583 | 49.8 |
| 2018 | 671 | 1,613 | 41.6 |
| 2019 | 669 | 1,627 | 41.1 |
Data: Government of Colombia, World Integrated Trade Solutions
Source: Office of the Chief Economist, Global Affairs Canada
As shown in Table 8, the unilateral tariff reduction reduced a large proportion of MFN duties to zero duty, which subsequently lowered the number of dutiable HS 8-digit tariff lines in the Colombian tariff schedule. Dutiable tariff lines which represented over 90% of the schedule consequently accounted for only around 50% after the reduction. Many of the products that went from MFN-dutiable to duty-free belonged to machinery (HS Chapter 84), electrical machinery (HS Chapter 85), copper (HS Chapter 74), mineral fuels and oils (HS Chapter 27), and plastics (HS Chapter 39). These tariff changes complicated the examination into the effects of CCoFTA, especially in examining whether dutiable trade increased after the CCoFTA implementation.
Table 9: Transition of Canadian dutiable exports to Colombia in 2010, $ millionsFootnote 21
| Status | Value 2010 | Value 2019 | Increase in value | ||
|---|---|---|---|---|---|
| 2010 | 2019 | From products that were exported in 2010 | From products that were not exported in 2010 | ||
| Dutiable | Dutiable | 212 | 351 | 66 | 63 |
| Dutiable | Duty-free | 382 | 787 | 375 | 30 |
Data: Government of Colombia, World Integrated Trade Solutions
Source: Office of the Chief Economist, Global Affairs Canada
Table 9 further shows the effect of the unilateral tariff reduction. The dutiable exports by Canada to Colombia in 2010 were $698 million. Approximately $594 million worth of the 2010 dutiable exports were in products that are traceable as to whether these products continued to be dutiable in the Colombian tariff schedule in 2019.
Products that were dutiable in 2010 and continued to be dutiable in 2019 (“continued-to-be-dutiable”) made up approximately $212 million worth of the 2010 dutiable exports and $351 million worth of the 2019 dutiable exports. The increase in exports of these “continued-to-be-dutiable” products is $139 million. If only the “continued-to-be-dutiable” products that Canadian had exported to Colombia in 2010 are considered, the increase in exports is only $66 million. This indicates that between 2010 and 2019, the increase in exports of the “continued-to-be-dutiable” products that were not exported before the implementation of CCoFTA is $63 million. On the other hand, products that were dutiable in 2010 but became duty-free in 2019 made up approximately $382 million worth of the 2010 dutiable exports. The Canadian exports to Colombia of these “turned-duty-free” (formerly dutiable) products were $787 million in 2019. If only the “turned-duty-free” products that Canadian had exported to Colombia in 2010 are considered, the value of exports in 2019 is $757 million which means the increase in exports is $375 million. This indicates that between 2010 and 2019, the increase in exports of the “turned-duty-free” products that were not exported before the implementation of CCoFTA is $30 million.Footnote 22
If the unilateral tariff reductions had not been applied and all “turned-duty-free” products remained dutiable in 2019, then the increase in the value of exports of these products ($405 million) between 2010 and 2019 would have been classified as an increase in dutiable exports (Table 9). In other words, the observable benefit of CCoFTA in terms of growth in dutiable trade was profoundly reduced after the unilateral tariff reductions. While the “continued-to-be-dutiable” products still grew $139 million in 2019 compared to 2010, the total Canadian dutiable exports to Colombia under CCoFTA could have been much higher than the reported $351 million in 2019 (Figure 8).
Services trade
Both Canada and Colombia have seen outstanding growth in services trade since CCoFTA was implemented in 2011. Canadian exports in services to Colombia grew by a substantial 79.9% to reach $286 million in 2019. Colombian exports in services to Canada were even more remarkable, increasing from 2010 to 2019 by 267.2% to a total of $224 million. Comparing Canada’s services trade with Colombia to its services trade with other South American countries like Chile and Argentina (Table 10), total services trade between Canada and FTA partner countries (Colombia or Chile) recorded stronger growth than between Canada and non-FTA partner countries (Argentina).
Table 10: Canada’s services trade with South American countries, 2010 and 2019, in $ millionsFootnote 23
| Partner country | Exports | Imports | ||||
|---|---|---|---|---|---|---|
| 2010 | 2019 | Growth 2010-2019 (%) | 2010 | 2019 | Growth 2010-2019 (%) | |
| Colombia | 159 | 286 | 79.9 | 61 | 224 | 267.2 |
| Chile | 140 | 287 | 105.0 | 91 | 159 | 74.7 |
| Argentina | 96 | 204 | 112.5 | 144 | 151 | 4.9 |
Data: Statistics Canada
Source: Office of the Chief Economist, Global Affairs Canada
Growth in bilateral services trade was sparked by an increase in travel services. The increase in travel services exported by Canada to Colombia had grown by 133.3% from $63 million in 2010 to $147 million in 2019. At the same time, both commercial and transportation services had only increased moderately. For Colombian services exports to Canada, travel services had increased by 314.8% from $27 million in 2010 to $112 million in 2019. Commercial services had increased by 363.2% to $88 million in 2019, and transportation services had increased by 60.0% over the same period (Figure 10).
Figure 10: Canada’s services trade with Colombia, 2010 and 2019, in $ millions

Text version - Figure 10
| Year | Travel | Commercial | Transportation |
|---|---|---|---|
| 2010 | 63 | 62 | 34 |
| 2019 | 147 | 77 | 62 |
Colombian exports to Canada
| Year | Travel | Commercial | Transportation |
|---|---|---|---|
| 2010 | 27 | 19 | 15 |
| 2019 | 112 | 88 | 24 |
Data: Statistics Canada
Source: Office of the Chief Economist, Global Affairs Canada
Utilizations of CCoFTA
The preference utilization rate (PUR) shows the extent to which imports that are eligible for CCoFTA preferences actually claim these preferences when they enter the FTA partner countries. The rate is calculated as the value of imports that claimed preferential treatment divided by the value of imports that are covered by CCoFTA or eligible for CCoFTA preferences. Imports would need to pay the normal MFN duties if they do not claim or qualify for CCoFTA preferences (for example, not meeting rules of origin requirements). Through the exchange of customs data that record imports claiming CCoFTA preference, PURs can be calculated for trade between Canada and Colombia.Footnote 24
The level of utilization for CCoFTA had been growing since its implementation (Table 11). In 2019, about 68.5% of Canadian merchandise exports to Colombia that were eligible for CCoFTA preferences actually claimed CCoFTA preferences. On the other hand, the utilization rate of CCoFTA preferences of Colombian goods exports to Canada was 80.2% in 2019.
Table 11: PURs of CCoFTA, 2012-2019Footnote 25Footnote 26
Preference utilization rate (%)
| Year | Canadian exports to Colombia | Colombian exports to Canada |
|---|---|---|
| 2012 | 43.4 | 73.7 |
| 2013 | 48.8 | 71.6 |
| 2014 | 79.5 | 78.3 |
| 2015 | 75.8 | 76.9 |
| 2016 | 82.1 | 80.5 |
| 2017 | 68.2 | 81.1 |
| 2018 | 67.4 | 81.9 |
| 2019 | 68.5 | 80.2 |
Data: Statistics Canada, Government of Colombia
Source: Office of the Chief Economist, Global Affairs Canada
At the product level, most Canadian sectors that exported to Colombia utilized the benefits of CCoFTA well. Sectors such as meat, cereals, edible vegetables and animal or vegetable fats and oils, which are top Canadian exports to Colombia, had full or close to full utilization of CCoFTA in 2019. However, zero PURs were also reported in some sectors like cocoa and preparations, carpets and knitted fabrics (Table 12).
Table 12: Sectors with highest and lowest PURs in Canadian exports to Colombia, 2019, in $
Highest utilization
| Total affected exports | Exports claimed CCoFTA | Utilization rate (%) | |
|---|---|---|---|
| Pulp of wood | 54,991 | 54,991 | 100.0 |
| Meat | 1,886,580 | 1,886,580 | 100.0 |
| Cereals | 8,268,918 | 8,268,918 | 100.0 |
| Cotton | 16,711 | 16,711 | 100.0 |
| Man-made staple fibres | 3,809 | 3,809 | 100.0 |
| Edible vegetables | 76,400,029 | 76,393,656 | 100.0 |
| Products of animal origin | 681,550 | 681,382 | 100.0 |
| Live animals | 731,421 | 730,099 | 99.8 |
| Animal or vegetable fat or oil | 3,408,220 | 3,306,783 | 97.0 |
| Lacs, gum and resins | 535,031 | 517,618 | 96.7 |
Lowest utilization
| Total affected exports | Exports claimed CCoFTA | Utilization rate (%) | |
|---|---|---|---|
| Cocoa and preparations | 204,248 | 0 | 0.0 |
| Carpets | 200,265 | 0 | 0.0 |
| Knitted fabrics | 125,411 | 0 | 0.0 |
| Prepared feathers and down | 102,520 | 0 | 0.0 |
| Salt and sulphur | 90,267 | 0 | 0.0 |
| Wadding | 69,302 | 0 | 0.0 |
| Glassware | 55,716 | 0 | 0.0 |
| Ceramic products | 49,974 | 0 | 0.0 |
| Impregnated textiles | 9,530 | 0 | 0.0 |
| Coffee and tea | 7,977 | 0 | 0.0 |
Data: Government of Colombia
Source: Office of the Chief Economist, Global Affairs Canada
Similarly for Colombian exports to Canada, most sectors registered high utilization of CCoFTA. Sectors such as washing and cosmetic preparations, cocoa and preparations as well as preparations of cereal all had very high utilization rates in 2019 (Table 13). On the other hand, a few sectors, which include articles of stone and cement, had zero utilization of CCoFTA, indicating none of the Colombian exports in these sectors claimed the preferential rates even though they are covered by the agreement.
Table 13: Sectors with highest and lowest PURs in Colombian exports to Canada, 2019, in $
Highest utilization
| Total affected exports | Exports claimed CCoFTA | Utilization rate (%) | |
|---|---|---|---|
| Clocks, watches and parts | 29,687 | 29,687 | 100.0 |
| Oilseeds | 59 | 59 | 100.0 |
| Explosives | 31 | 31 | 100.0 |
| Washing preparations | 545,345 | 542,738 | 99.5 |
| Cocoa and preparations | 3,134,074 | 3,103,065 | 99.0 |
| Cosmetic preparations | 3,194,744 | 3,109,169 | 97.3 |
| Preparations of cereals | 1,535,904 | 1,415,635 | 92.2 |
| Aluminum and articles | 176,008 | 161,512 | 91.8 |
| Ships | 713,162 | 650,125 | 91.2 |
| Live trees and plants | 105,737,126 | 95,469,443 | 90.3 |
Lowest utilization
| Total affected exports | Exports claimed CCoFTA | Utilization rate (%) | |
|---|---|---|---|
| Articles of stone or cement | 4,887,577 | 0 | 0.0 |
| Waste from food industries | 87,566 | 0 | 0.0 |
| Carpets | 21,263 | 0 | 0.0 |
| Machinery | 20,237 | 0 | 0.0 |
| Musical instruments | 16,713 | 0 | 0.0 |
| Electrical machinery | 16,032 | 0 | 0.0 |
| Prepared feathers and down | 1,862 | 0 | 0.0 |
| Arms and ammunitions | 1,782 | 0 | 0.0 |
| Milling products | 1,750 | 0 | 0.0 |
| Toys | 601 | 0 | 0.0 |
Data: Statistics Canada
Source: Office of the Chief Economist, Global Affairs Canada
Effect of CCoFTA
The above analyses establish that bilateral trade between Canada and Colombia has progressed considerably since 2011, but the question of how much of this progress was the result of the agreement remains. The following analysis tries to quantify the effect of CCoFTA on trade between Canada and Colombia, that is, to compare the value of trade in the presence of the agreement with the “would have been” value of trade in the absence of it.
Economic data are often obscured by “anomalies” or “shocks” when the macroeconomic environment suddenly shifts or when a new policy regime is being introduced. There are also instances when multiple “anomalies” happen at the same time. In this case, the implementation of CCoFTA in 2011 acts like one of these anomalies and changes the “normal” situation in trade between Canada and Colombia. So in order to study the effect of this anomaly on trade, other anomalies must be isolated, and more advanced econometric techniques are needed to evaluate comprehensively the trade-enhancing effect of CCoFTA.
The ideal approach would measure the effect of the treatment through comparing the performances of two similar groups in same settings with the only difference being whether the group had been “treated” (received treatment). In a blinded experiment setting, both the performance of the “treated” and the performance of the “untreated” are observed at the same time,Footnote 27 and the effect of treatment is found empirically by directly measuring the difference in performance. However, in economic analysis there is always one big challenge: only the performance of the “treated” is observed; that of the “untreated” is not.Footnote 28 In order to mimic the performance of the “untreated”, a counterfactual must be established.Footnote 29
A program evaluation technique called the average treatment effect (AVE) approach is used. It has a few advantages empirically. First, it establishes the direction of a “causal link” between a treatment and the performance. Second, it allows the analyst using observable data to create counterfactuals in order to carry out a valid evaluation. Third, the approach can be done using a panel set-up (cross-sectional and time series data) to further control for any unobserved variations. Finally, unlike the gravity model, the typical workhorse of trade analysis, excessive zero trades are not of concern in this approach.
As mentioned earlier, CCoFTA acts as an anomaly that changes the course of “normal” trade between Canada and Colombia, and therefore a valid evaluation of the effect of CCoFTA on trade involves calculating the average expected difference in the value of trade between Canada and Colombia in the presence of CCoFTA which is observable and the “would have been” value of trade between Canada and Colombia in the absence of CCoFTA which is not observable.Footnote 30 In the AVE approach framework, the treatment is the implementation of CCoFTA. The performance to be compared is the value of trade between two countries at product level.Footnote 31 Only the trade between Canada and Colombia after 2011 is considered “treated” by CCoFTA.
For the evaluation of the effect of CCoFTA, the AVE approach will be applied on trade data and characteristics of Canada and its top trading partners from 2004 to 2019. The trade data are the values of merchandise imports at the HS 6-digit tariff line level.Footnote 32 The characteristics include a variety of country-specific and product-specific variables. The trading partners included are Australia, Belgium, Brazil, Chile, China, Colombia, France, Germany, Hong Kong, India, Indonesia, Italy, Japan, Korea, Mexico, Netherlands, Norway, Singapore, Spain, Switzerland, Taiwan, Thailand, the United Kingdom and the United States.
The AVE approach consists of two stages. The first stage is non-parametric propensity score matching where a propensity score representing the likelihood of receiving or not receiving treatment is generated based on characteristics of the subjects.Footnote 33 The purpose of the first stage is to select two similar groups of subjects with their only apparent difference being whether they are “treated” or “untreated”. Based on the propensity score, each subject in the “treated” group can be matched with a subject in the “untreated” group. The criterion of matching is based on “mean-closeness” using full near-neighbour or Mahalanobis matching.Footnote 34 Here, the subjects are product k imported by country i from country j. The “treated” group is Canada as country i and Colombia as country j after 2011.The “untreated” group is drawn from the following: Canada as country i and Colombia as country j before 2011, Colombia as country i and Canada as country j before 2011, Canada as country i and other partner countries as country j between 2004 and 2019, and other partner countries as country i and Canada as country j between 2004 and 2019. Henceforth, the sample for the analysis would include only the subjects from the “treated” group and the propensity-score-matched subjects from the “untreated” group.
The second stage is parametric regression estimation on the value of trade using the sample formed in the first stage. The regressors are the treatment variable and a selection of control variables.Footnote 35 In the AVE approach framework, only the estimated coefficient for the treatment variable CCoFTAijt which represents the implementation of CCoFTA is of interest. Also, the regression is performed only on the matched sample to ensure the estimated effect of CCoFTAijt can be better identified.
All observations in this analysis are organized from an importer perspective. That is, each observation of the dependent variable represents the value of imports of product k by country i (importer) from country j (exporter) at time t (year). The basic estimating equation can be set up as follows,

where the performance variable ln yijt is the natural logarithm of imports in product k by country i from country j at time t; CCoFTAijt is the treatment variable that equals to one when country i and country j are Canada and Colombia (or vice versa) at time t, ∀t ≥ 2011, 0 otherwise; Tikt is one plus the tariff of product k that country i imposed on country j at time t; ln GDPit is the natural logarithm of GDP of country i at time t; ln GDPjt is the natural logarithm of GDP of country j at time t and €ijkt is a random error.
This basic set-up thus far is similar to the traditional gravity equation. However, when the set-up contains four dimensions (product k, country i, country j and time t), using controls mostly at two-dimensional level (country i and time t; or country j and time t) leaves much of the between-variations uncontrolled.Footnote 36 In order to address this or at least mitigate the unobserved variations, the basic set-up is augmented with the inclusion of additional control variables including ln imrikt, the import penetration ratio of product k in country i at time t which represents import demand at the product levelFootnote 37; ln pcgjt, productivity of country j at time t, which represents country j’s production capacity at time tFootnote 38, which represents the size of import markets; and ftait which controls for possible preference erosion stemming from FTAs with third parties. In addition, the per capita GDP of country j ln pcGDPjt, is applied in some specifications as a proxy of productivity replacing ln pcgjtFootnote 39. Furthermore, even though trade data originally collected are at the HS 8-digit level, for ease of comparison, they are aggregated up to HS 6-digits for each country-pair, and a tariff rate is generated for each HS 6-digit product.Footnote 41 Footnote 42
Thus the augmented set-up is as follows,

When using the AVE approach for analysis, the variable of interest is always only the treatment variable, which in this case is CCoFTAijt. Therefore, the estimated coefficients of any remaining controls are only to be considered as additional effects complementing the effect of CCoFTAijt on the trade of the “treated”. Some of the variables are expected to behave the same with or without the added layer of interpretation in the presence of CCoFTA. The gravity-related variable, ln GDPit is expected to be positive and increase in a country’s income naturally leads to an increase in trade. Another gravity-related variable ln GDPjt has no definite sign as an increase in a partner country’s income may or may not lead to an increase in exports. The effect of ln imrikt is logically expected to be positive as the value of imports increases with the import demand. The effect of ftait is expected to be negative on value of trade because the existence of other FTAs may divert trade between Canada and Colombia to other FTA partners and erodes preference advantages over time.
Other variables may have less obvious effects in the presence of CCoFTA. The effect of increasing productivity of the exporting country j ln pcgjt or the proxy of it, the per capita GDP of the exporting country j ln pcGDPjt may or may not increase imports by a partner country (equivalently the exports by country j to a partner country). The population of the importing country, ln popit, can have ambiguous effects on trade as well. It could positively generate a stronger desire for imports or it could promote domestic production that leads to reduced demand for foreign goods. The expected signs of tariffs may also not be as straight forward. Tariffs are usually expected to be negatively affecting the value of trade because they are restrictive measures that will lower imports when imposed. This indicates in the presence of CCoFTA, the value of imports will decrease following an increase in tariffs (imposed by country i on product k from country j). So in specifications where the usual definition of tariffs is used, the expected sign of tariffs would be negative. On the other hand, the standardized tariffs for products imported from non-CCoFTA countries relative to CCoFTA tariffs are larger than one if CCoFTA countries had more extensive tariff reductions. Therefore, in the presence of CCoFTA, increases in the standardized tariffs (non-CCoFTA tariffs relative to CCoFTA tariffs) would lead to an increase in imports between the CCoFTA partner countries. So, the expected sign of tariffs may be uncertain in specifications where standardization of tariffs is applied. If the sign of a standardized tariff is positive, it means an increase in the non-CCoFTA tariff relative to the CCoFTA tariff provides an additional boost to the amount of imports in the presence of CCoFTA. On the other hand, if the sign is negative, it means an increase in the non-CCoFTA tariff relative to the CCoFTA tariff actually does not add to the amount of imports in the presence of CCoFTA. The estimation results of the different specifications carried out are shown in Table 14.Footnote 43
Table 14: Estimation results from Average Treatment Effect analysis
| Variable | Specification | |||||||
|---|---|---|---|---|---|---|---|---|
| 1 | 2 | 3 | 4 | 5 | 6 | 7 | 8 | |
| CCoFTAijt | 0.070 | 0.062 | 0.073 | 0.058 | 0.082 | 0.070 | 0.070 | 0.056 |
| (0.202) | (0.203) | (0.193) | (0.194) | (0.202) | (0.202) | (0.193) | (0.194) | |
| ln GDPit | 1.101** | 1.173** | 1.098** | 1.176** | 1.352*** | 1.355*** | 1.169** | 1.262*** |
| (0.480) | (0.486) | (0.476) | (0.483) | (0.288) | (0.287) | (0.480) | (0.489) | |
| ln GDPjt | -0.334 | -0.240 | -0.325 | -0.254 | ||||
| (0.509) | (0.515) | (0.472) | (0.477) | |||||
| ln popit | -9.268** | -10.143** | -9.344** | -10.020** | -9.948** | -10.704** | -9.285** | -10.036** |
| (4.366) | (4.470) | (4.028) | (4.096) | (4.241) | (4.305) | (4.064) | (4.145) | |
| Tikt | -0.141 | -1.642 | -0.141 | -1.633 | -0.139 | -1.759 | -0.142 | -1.665 |
| (0.251) | (1.538) | (0.250) | (1.533) | (0.251) | (1.518) | (0.250) | (1.538) | |
| ln pcgjt | 0.044 | -0.067 | -0.195 | -0.241 | ||||
| (0.977) | (0.980) | (0.907) | (0.906) | |||||
| ln pcGDPjt | -0.250 | -0.163 | ||||||
| (0.476) | (0.486) | |||||||
| ln imrikt | 0.480*** | 0.482*** | 0.480*** | 0.482*** | 0.481*** | 0.482*** | 0.481*** | 0.482*** |
| (0.023) | (0.023) | (0.023) | (0.023) | (0.023) | (0.023) | (0.023) | (0.023) | |
| ftait | -0.257*** | -0.254*** | -0.257*** | -0.253*** | -0.251*** | -0.250*** | -0.255*** | -0.251*** |
| (0.070) | (0.069) | (0.070) | (0.069) | (0.069) | (0.069) | (0.070) | (0.069) | |
| Tariff standardization | Yes | Yes | Yes | Yes | ||||
| Propensity score matching | Yes | Yes | Yes | Yes | Yes | Yes | Yes | Yes |
| Parametric weighting | Yes | Yes | Yes | Yes | Yes | Yes | Yes | Yes |
| Panel set-up | Yes | Yes | Yes | Yes | Yes | Yes | Yes | Yes |
| Year fixed effects | Yes | Yes | Yes | Yes | Yes | Yes | Yes | Yes |
Source: Author’s calculations, Office of Chief Economist, Global Affairs Canada
Note: Superscripts ***, ** and * represent significance levels of 0.01, 0.05 and 0.1 respectively. Standard errors are presented in brackets.
The estimated treatment effect of CCoFTA ranges from 0.056 to 0.073. Therefore, if the country-pair is formed by both CCoFTA partners, then the imports of product k by country i from country j will grow on average 5.8% (=[exp(0.056) – 1]*100) to 7.6% (=[exp(0.073) – 1]*100) faster than if the country-pair does not comprise of both CCoFTA partners. The results from different specifications all indicate that the treatment effect of CCoFTAijt did contribute positively to the growth of trade between Canada and Colombia but regrettably the estimated coefficients are not statistically significant. However, the lack of statistical significance is not to be interpreted as not being “significant” or not being “important”, it only means the treatment effect of CCoFTAijt cannot be precisely estimated in this sample. This is in accordance with the findings from previous sections in this report that show CCoFTA affected the trade between Canada and Colombia, but its effectiveness on trade may be masked by external factors such as the Colombian unilateral tariff reductions, or other macroeconomic influences.
In the presence of CCoFTA, the effect of an increase in GDP (or economic size) of the importing country i contributes to an additional increase in imports from partner country j. The effect of an increase in GDP of the exporting country j however poses a decreasing effect on imports by country i from country j. Increased population in country i does not appear to act as a stimulating factor to increase imports when CCoFTA is in force. The effect of the non-standardized tariffs is negative as expected though it is also statistically insignificant. This indicates that if there is any increase in tariff of product k from country j imposed by country i, the imports by country i from country j decreases. For the standardized tariffs, the negative but statistically insignificant effects are actually slightly mystifying as they indicate in this sample that an increase in import tariffs by non-CCoFTA partners leads to decrease in imports from a CCoFTA partner. However, one possible contributor to this surprising result is the lack of variations in the data. There are very few observations in this sample that have tariffs higher than those imposed by Colombia on Canada or Canada on Colombia. In fact, out of approximately 1.8 million observations in the dataset, only 20% had standardized tariffs larger than one. There are even fewer in the matched sample: only 0.6% of the entire sample had standardized tariffs larger than one. This implies the CCoFTA tariffs are not particularly favourable over other tariffs of the same products; and may not produce any effect that increases imports. In other words, the standardized tariffs are both economically and statistically insignificant in this sample.
The effects of productivity of product k in country j are negative for all except one specification and are all statistically insignificant. The estimated effects being mostly negative seems to lend support to the idea that increasing productivity does not automatically transform into an increase in exports, and that being successful at exporting might rely on other factors apart from the exporter being productive. On the other hand, a higher import penetration ratio of product k in country i appears to be associated strongly with an increase in imports by country i from country j in the presence of CCoFTA. This backs the trade diversion concept of preferential trade, where trade will be diverted toward partners within the agreement. Lastly the effect of other existing FTAs of country i negatively impacts the imports by country i from country j in the presence of CCoFTA, suggesting the preference erosion effect of multiple FTAs exists. In other words, if country i has many choices of FTAs that offer similar tariff preferences, it does not necessarily rely on imports from country j.
To summarize, the econometric results show that the effect of CCoFTA to increase trade growth between Canada and Colombia is moderate, leading to an average 5.8% to 7.6% faster growth of trade per year.
Concluding Remarks
The findings presented above confirm that CCoFTA functions to foster trade between Canada and Colombia. Total bilateral merchandise trade between Canada and Colombia had grown almost 30% in value since CCoFTA entered into force in 2011. Canadian exports to Colombia increased 39.2% to $1.2 billion in 2019 from the pre-CCoFTA level of $847.6 million in 2010. The annual rate of growth is on average 4.5% (Figure 7). Merchandise trade between Canada and Colombia mostly concentrated on a stable product mix in the years since the implementation of CCoFTA. However, in terms of exporter composition, there appears to be a surge in Canadian SMEs engaging in merchandise trade with Colombia since then (Table 11).
One thing of special importance is that after CCoFTA entered into force, Colombia had imposed a unilateral tariff reduction, which resulted in a large number of tariff lines being transformed from being MFN-dutiable to being duty-free. In a typical FTA ex-post analysis, the increase in dutiable trade is a rough indicator of how much the FTA partners gained in trade covered by the agreement. Yet, in this case, a large part of the supposedly dutiable trade turned into duty-free trade, and the increase in dutiable trade became almost insignificant compared to the increase in duty-free trade when comparing the pre-CCoFTA and post-CCoFTA trade. Furthermore, Colombia’s relatively small market and the strong effect of commodity price fluctuations on its purchasing power of foreign goods constrained the size of gains Canada can realize. Services trade on the other hand had benefited impressively from the large increase in travel services. Compare to pre-CCoFTA, exports in travel services by Canada to Colombia have grown 133.3% while exports by Colombia to Canada had grown 314.8% (Figure 10).
In regard to the utilization of CCoFTA’s preferential tariffs, the PURs for Colombian exports to Canada had been high since the implementation of CCoFTA while the PURs for Canadian exports to Colombia grew gradually. In 2019, the PUR for Canadian exports was 68.5%; sectors such as meat, cereals, edible vegetables and animal or vegetable fats and oils, which are also top Canadian exports to Colombia, were characterized by full or close to full utilizations (Table 12). The PUR for Colombian exports was 80.2% in 2019, and sectors such as washing and cosmetic preparations, cocoa and preparations as well as preparations of cereal all had very high utilizations (Table 13).
The econometric assessment of the effect of CCoFTA on Canada-Colombia trade showed that the effect of the CCoFTA increases trade growth between Canada and Colombia 5.8% to 7.6% faster on average. However, the assessment produced two findings worth noting. First, the effect of CCoFTA is not statistically significant. Nevertheless, the lack of significance cannot be interpreted as lack of an effect because CCoFTA is definitely economically significant. Rather what this shows is that the positive estimated effect of CCoFTA is not entirely non-random. Besides, the effect of CCoFTA may be masked by the Colombian unilateral tariff reductions, or other macroeconomic influences. Second, the increases in trade between Canada and Colombia relied only minimally on the tariff reductions. This finding corresponds to the fact that much of the trade between the two countries, in particular Canadian exports to Colombia, had been in products that were duty-free.
- Date Modified: