
Highlights of Canada’s merchandise trade performance - 2023 update
Office of the Chief Economist
Table of contents
- Highlights
- Appendix
Highlights
- After several years of robust growth, Canada's merchandise trade saw a more subdued performance in 2023, with imports growing by 1.4% and domestic exports declining by 2.2%. This was influenced by factors such as the lowering of commodity prices, and the easing of supply chain pressures.
- Trade by sector:
- Domestic exports: While overall exports declined, there were notable increases in exports of motor vehicles and parts, and aircraft and other transportation equipment and parts. However, domestic exports of energy products, forestry products and building and packaging materials, and metal ores and non-metallic minerals declined significantly.
- Imports: Growth in imports of motor vehicles and parts was prominent, along with industrial machinery and equipment. However, imports of basic and industrial chemical, plastic, and rubber products and energy products decreased.
- Regional trade performance:
- United States: Canada’s merchandise trade with its largest trading partner was mixed in 2023, with growth in imports from the United States and declines in domestic exports.
- Latin America & Caribbean: While domestic exports declined slightly, led by exports to Mexico, imports from the region saw significant growth, particularly from Mexico.
- Europe & Central Asia: Declines in domestic exports to the European Union were notable, but imports from the region increased, especially from Germany and Italy.
- Indo-Pacific: Declines in domestic exports were observed, particularly exports to Japan and South Korea, while imports from the region also decreased, with the notable exception of Japan. Since 2000, there has been significant growth in trade with this region, primarily driven by China, with notable increases in both exports and imports.
- Africa & the Middle East:
- Middle East & North Africa: Domestic exports were essentially flat in 2023, but there was notable growth in exports to Saudi Arabia. Imports declined significantly due mainly to lower imports from Saudi Arabia
- Sub-Saharan Africa: Domestic exports’ growth was led by exports to Mozambique and Cameroon, while imports’ growth was led mainly by imports from Nigeria.
- Price and volume dynamics: Commodity prices played a significant role in trade performance, with substantial declines in 2023, particularly in natural resource-based sectors. This caused merchandise export prices to decline 6.9% in 2023. Stripping out the effect of prices, export volumes grew 5.7%. On the imports side, prices grew 2.5% and volume decreased 1.1%.
Overview
After two years of double-digit growth, the change in the value of Canadian merchandise trade in 2023 was much more subdued, with imports growing 1.4% and exportsFootnote 1 declining by 2.2%. Commodity prices played a factor as the prices of many commodities declined from the elevated levels witnessed in 2022, causing the value of trade in many natural resource-based sectors to decline.
On the other hand, the easing of supply chain pressures supported growth in motor vehicles and parts. Similarly, trade in aircraft and other transportation equipment and parts was also supported by the aviation industry’s attempt to catch up with post-pandemic’s surging demand for travel.
On a regional basis, the decline in exports was broad-based with declines in four of five major regions. The growth in imports had more mixed support, with growth in three of the five major regions.
Figure 1: Value of Canadian merchandise exports and imports
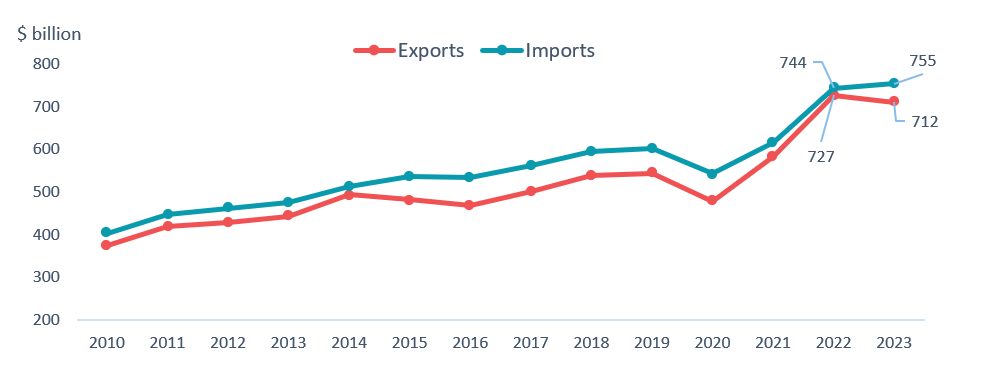
Figure 1 - Text version
| Value of Canadian merchandise exports and imports ($ billion) | Exports | Imports |
|---|---|---|
| 2010 | 374 | 404 |
| 2011 | 419 | 447 |
| 2012 | 428 | 462 |
| 2013 | 444 | 476 |
| 2014 | 493 | 512 |
| 2015 | 481 | 536 |
| 2016 | 468 | 533 |
| 2017 | 501 | 562 |
| 2018 | 538 | 596 |
| 2019 | 544 | 602 |
| 2020 | 479 | 543 |
| 2021 | 583 | 617 |
| 2022 | 727 | 744 |
| 2023 | 712 | 755 |
Data: Statistics Canada Table 12-10-0173-01, customs-based, retrieved on 25-03-2024
Source: Office of the Chief Economist, Global Affairs Canada
Trade by sector
Export declines in natural resource-based sectors were substantial, most notably in energy products (-17.9%), forestry products and building and packaging materials (-16.6%), and metal ores and non-metallic minerals (‑15.2%). Commodity prices were a major factor in the contraction in these sectors. In 2022, Russia’s invasion of Ukraine caused many commodity prices to rise, including energy (+60%), agriculture (+10.7%), fertilizers (+55%) and base metals (+4.0%). In 2023, due to lower demand as a result of weaker global economic growth, the price of many commodities has come down, including energy (‑30%), agriculture (-7.2%), fertilizers (-35%), and base metals (-11%).
Meanwhile, growth in exports of motor vehicles and parts (+31.0%) outpaced its 2022 growth, one of the two sectors to achieve this feat in 2023. The motor vehicles and parts sector benefited from a return to normal conditions from supply chain pressures. The second sector to outpace its 2022 growth was aircraft and other transportation equipment and parts (+28.2%) as the aviation industry benefited from the post‑pandemic surge in demand for travel.
Figure 2: Canadian merchandise export growth (%), by sectors
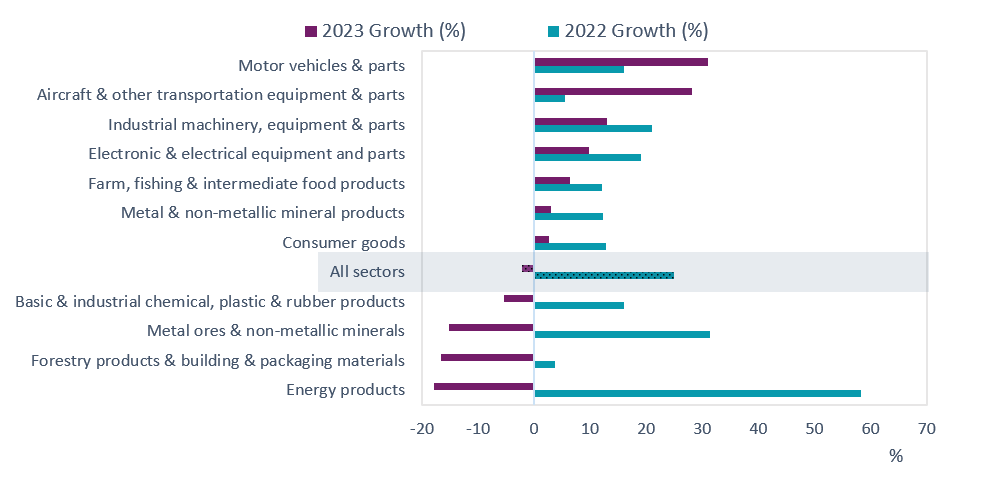
Figure 2 - Text version
| Canadian merchandise export growth (%). by sectors | 2022 Growth (%) | 2023 Growth (%) |
|---|---|---|
| Energy products | 58.3 | -17.9 |
| Forestry products & building & packaging materials | 3.8 | -16.6 |
| Metal ores & non-metallic minerals | 31.3 | -15.2 |
| Basic & industrial chemical. plastic & rubber products | 16.0 | -5.3 |
| All sectors | 24.9 | -2.2 |
| Consumer goods | 12.8 | 2.6 |
| Metal & non-metallic mineral products | 12.3 | 3.1 |
| Farm. fishing & intermediate food products | 12.1 | 6.5 |
| Electronic & electrical equipment and parts | 19.1 | 9.8 |
| Industrial machinery. equipment & parts | 21.0 | 13.0 |
| Aircraft & other transportation equipment & parts | 5.4 | 28.2 |
| Motor vehicles & parts | 16.0 | 31.0 |
Data: Statistics Canada Table 12-10-0173-01, customs-based, retrieved on 25-03-2024
Source: Office of the Chief Economist, Global Affairs Canada
Similar to exports, merchandise import growth in 2023 was led by motor vehicles and parts and many natural resource-based sector witnessed declines. Growth in imports of motor vehicles and parts (+17.1%) was supported by the normalization of supply chain conditions. The second largest contributor to growth was the industrial machinery, equipment and parts (+8.5%) sector, followed by aircraft and other transportation equipment and parts (+10.8%).
The largest detractor from merchandise import growth in 2023 was basic and industrial chemical, plastic, and rubber products (‑10.1%), followed by energy products (-11.7%) which saw prices come down from elevated levels, followed by consumer goods (-3.3%) in third place.
Figure 3: Canadian merchandise import growth (%), by sectors
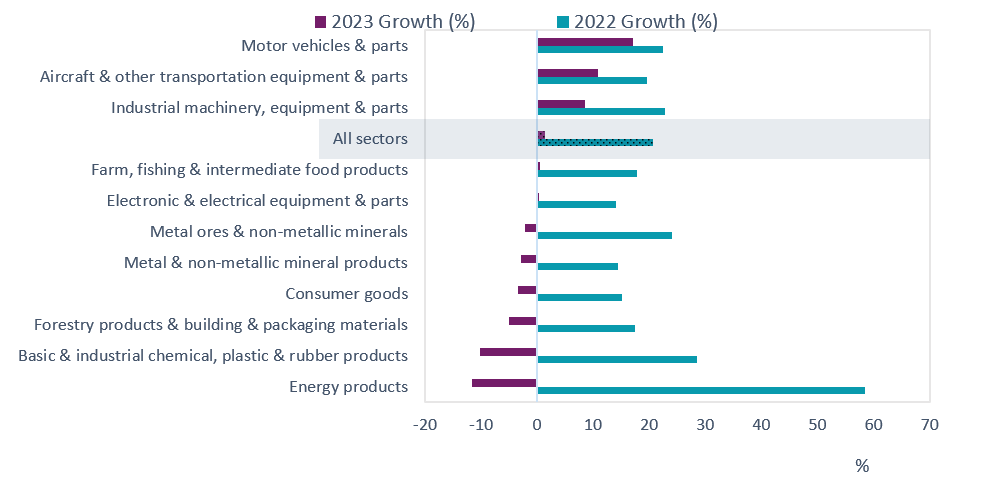
Figure 3 - Text version
| Canadian merchandise import growth (%). by sectors | 2022 Growth (%) | 2023 Growth (%) |
|---|---|---|
| Energy products | 58.4 | -11.7 |
| Basic & industrial chemical. plastic & rubber products | 28.4 | -10.1 |
| Forestry products & building & packaging materials | 17.5 | -4.9 |
| Consumer goods | 15.1 | -3.3 |
| Metal & non-metallic mineral products | 14.4 | -2.8 |
| Metal ores & non-metallic minerals | 24.1 | -2.1 |
| Electronic & electrical equipment & parts | 14.0 | 0.3 |
| Farm. fishing & intermediate food products | 17.7 | 0.6 |
| All sectors | 20.7 | 1.4 |
| Industrial machinery. equipment & parts | 22.8 | 8.5 |
| Aircraft & other transportation equipment & parts | 19.6 | 10.8 |
| Motor vehicles & parts | 22.4 | 17.1 |
Data: Statistics Canada Table 12-10-0173-01, customs-based, retrieved on 25-03-2024
Source: Office of the Chief Economist, Global Affairs Canada
After reaching record-breaking highs for merchandise exports and imports with many partners in 2022, Canadian merchandise trade was much more subdued in 2023. Of the 224 partners that Canada traded merchandise with in 2023, there was growth in both exports and imports with 63 partners while trade with 57 partners witnessed neither growth in exports nor imports. There were 57 partners where only Canadian exports grew and 47 partners where only imports grew.
Figure 4: Change in the value of Canadian merchandise trade by trading partner, 2023 vs 2022
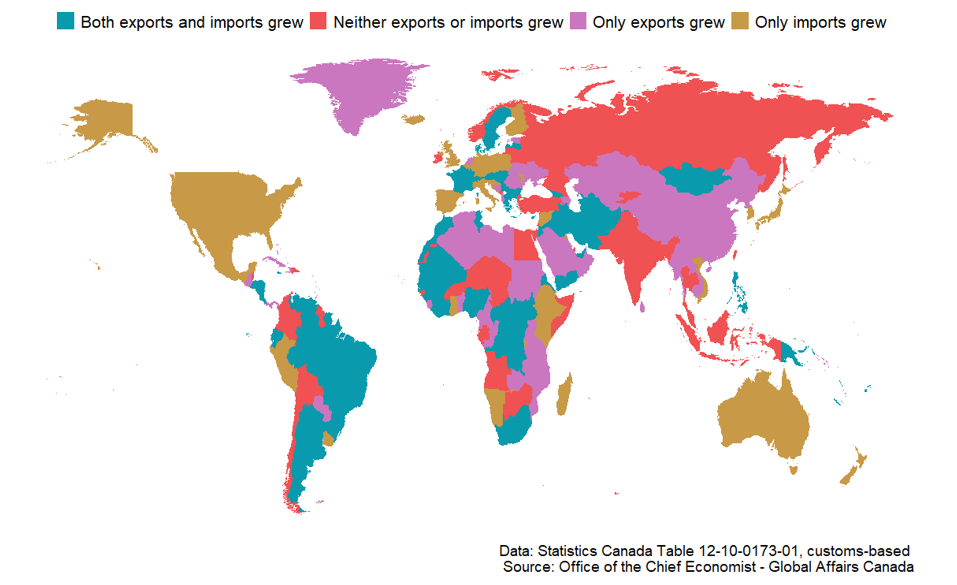
Figure 4 - Text version
| Trade Partner | Canadian trade performance in 2023 |
|---|---|
| Afghanistan | Both exports and imports grew |
| Albania | Only exports grew |
| Algeria | Only exports grew |
| American Samoa | Neither exports or imports grew |
| Andorra | Both exports and imports grew |
| Angola | Neither exports or imports grew |
| Anguilla | Neither exports or imports grew |
| Antarctica | Only exports grew |
| Antigua and Barbuda | Neither exports or imports grew |
| Argentina | Both exports and imports grew |
| Armenia | Neither exports or imports grew |
| Aruba | Both exports and imports grew |
| Australia | Only imports grew |
| Austria | Both exports and imports grew |
| Azerbaijan | Only exports grew |
| Bahamas | Only exports grew |
| Bahrain | Only exports grew |
| Bangladesh | Neither exports or imports grew |
| Barbados | Only imports grew |
| Belarus | Neither exports or imports grew |
| Belgium | Only imports grew |
| Belize | Neither exports or imports grew |
| Benin | Only exports grew |
| Bermuda | Neither exports or imports grew |
| Bhutan | Only exports grew |
| Bolivia | Neither exports or imports grew |
| Bonaire, Sint Eustatius and Saba | Only exports grew |
| Bosnia and Herzegovina | Only exports grew |
| Botswana | Neither exports or imports grew |
| Bouvet Island | Only exports grew |
| Brazil | Both exports and imports grew |
| British Indian Ocean Territory | Only imports grew |
| British Virgin Islands | Only imports grew |
| Brunei Darussalam | Only imports grew |
| Bulgaria | Both exports and imports grew |
| Burkina Faso | Neither exports or imports grew |
| Burundi | Only imports grew |
| Cabo Verde | Only exports grew |
| Cambodia | Only exports grew |
| Cameroon | Only exports grew |
| Cayman Islands | Only exports grew |
| Central African Republic | Both exports and imports grew |
| Chad | Neither exports or imports grew |
| Chile | Neither exports or imports grew |
| China | Only exports grew |
| Christmas Island | Neither exports or imports grew |
| Cocos (Keeling) Islands | Neither exports or imports grew |
| Colombia | Neither exports or imports grew |
| Comoros | Both exports and imports grew |
| Congo | Only exports grew |
| Cook Islands | Only imports grew |
| Costa Rica | Both exports and imports grew |
| Côte d'Ivoire | Both exports and imports grew |
| Croatia | Only imports grew |
| Cuba | Only exports grew |
| Curaçao | Only imports grew |
| Cyprus | Both exports and imports grew |
| Czechia | Only imports grew |
| Democratic Republic of the Congo | Both exports and imports grew |
| Denmark | Both exports and imports grew |
| Djibouti | Only imports grew |
| Dominica | Neither exports or imports grew |
| Dominican Republic | Neither exports or imports grew |
| Ecuador | Both exports and imports grew |
| Egypt | Neither exports or imports grew |
| El Salvador | Both exports and imports grew |
| Equatorial Guinea | Only exports grew |
| Eritrea | Both exports and imports grew |
| Estonia | Only exports grew |
| Eswatini | Both exports and imports grew |
| Ethiopia | Only imports grew |
| Falkland Islands (Malvinas) | Only exports grew |
| Faroe Islands | Neither exports or imports grew |
| Fiji | Both exports and imports grew |
| Finland | Only imports grew |
| France | Both exports and imports grew |
| French Polynesia | Both exports and imports grew |
| French Southern Territories | Neither exports or imports grew |
| Gabon | Neither exports or imports grew |
| Gambia | Both exports and imports grew |
| Georgia | Both exports and imports grew |
| Germany | Only imports grew |
| Ghana | Only imports grew |
| Gibraltar | Both exports and imports grew |
| Greece | Both exports and imports grew |
| Greenland | Only exports grew |
| Grenada | Both exports and imports grew |
| Guam | Neither exports or imports grew |
| Guatemala | Only exports grew |
| Guinea | Both exports and imports grew |
| Guinea-Bissau | Neither exports or imports grew |
| Guyana | Neither exports or imports grew |
| Haiti | Only exports grew |
| Heard Island and McDonald Islands | Only imports grew |
| Honduras | Both exports and imports grew |
| Hong Kong | Only exports grew |
| Hungary | Both exports and imports grew |
| Iceland | Only imports grew |
| India | Neither exports or imports grew |
| Indonesia | Neither exports or imports grew |
| Iran | Both exports and imports grew |
| Iraq | Both exports and imports grew |
| Ireland | Neither exports or imports grew |
| Israel | Neither exports or imports grew |
| Italy | Only imports grew |
| Jamaica | Both exports and imports grew |
| Japan | Only imports grew |
| Jordan | Both exports and imports grew |
| Kazakhstan | Only exports grew |
| Kenya | Only imports grew |
| Kiribati | Only exports grew |
| Kuwait | Only imports grew |
| Kyrgyzstan | Neither exports or imports grew |
| Laos | Only exports grew |
| Latvia | Both exports and imports grew |
| Lebanon | Only imports grew |
| Lesotho | Neither exports or imports grew |
| Liberia | Both exports and imports grew |
| Libya | Only exports grew |
| Lithuania | Neither exports or imports grew |
| Luxembourg | Both exports and imports grew |
| Macao | Neither exports or imports grew |
| Madagascar | Only imports grew |
| Malawi | Only exports grew |
| Malaysia | Neither exports or imports grew |
| Maldives | Only exports grew |
| Mali | Both exports and imports grew |
| Malta | Only imports grew |
| Mauritania | Both exports and imports grew |
| Mauritius | Neither exports or imports grew |
| Mexico | Only imports grew |
| Mongolia | Both exports and imports grew |
| Montenegro | Neither exports or imports grew |
| Montserrat | Neither exports or imports grew |
| Morocco | Both exports and imports grew |
| Mozambique | Only exports grew |
| Myanmar | Only exports grew |
| Namibia | Only imports grew |
| Nauru | Both exports and imports grew |
| Nepal | Neither exports or imports grew |
| Netherlands | Only exports grew |
| New Caledonia | Both exports and imports grew |
| New Zealand | Only imports grew |
| Nicaragua | Both exports and imports grew |
| Niger | Neither exports or imports grew |
| Nigeria | Both exports and imports grew |
| Niue | Only imports grew |
| Norfolk Island | Only imports grew |
| North Korea | Only exports grew |
| North Macedonia | Both exports and imports grew |
| Norway | Neither exports or imports grew |
| Oman | Only exports grew |
| Pakistan | Neither exports or imports grew |
| Panama | Only exports grew |
| Papua New Guinea | Both exports and imports grew |
| Paraguay | Only exports grew |
| Peru | Only imports grew |
| Philippines | Both exports and imports grew |
| Pitcairn | Only imports grew |
| Poland | Only imports grew |
| Portugal | Only imports grew |
| Qatar | Neither exports or imports grew |
| Republic of Moldova | Only imports grew |
| Romania | Only exports grew |
| Russian Federation | Neither exports or imports grew |
| Rwanda | Only exports grew |
| Saint Barthélemy | Only imports grew |
| Saint Helena | Neither exports or imports grew |
| Saint Kitts and Nevis | Neither exports or imports grew |
| Saint Lucia | Neither exports or imports grew |
| Saint Martin (French part) | Both exports and imports grew |
| Saint Pierre and Miquelon | Neither exports or imports grew |
| Saint Vincent and the Grenadines | Only imports grew |
| Samoa | Only exports grew |
| Sao Tome and Principe | Only exports grew |
| Saudi Arabia | Only exports grew |
| Senegal | Both exports and imports grew |
| Serbia | Both exports and imports grew |
| Seychelles | Only exports grew |
| Sierra Leone | Only exports grew |
| Singapore | Both exports and imports grew |
| Sint Maarten (Dutch part) | Only imports grew |
| Slovakia | Both exports and imports grew |
| Slovenia | Only imports grew |
| Solomon Islands | Only exports grew |
| Somalia | Neither exports or imports grew |
| South Africa | Both exports and imports grew |
| South Korea | Only imports grew |
| South Sudan | Both exports and imports grew |
| Spain | Only imports grew |
| Sri Lanka | Only exports grew |
| Sudan | Only exports grew |
| Suriname | Both exports and imports grew |
| Sweden | Both exports and imports grew |
| Switzerland | Both exports and imports grew |
| Syria | Only imports grew |
| Taiwan | Neither exports or imports grew |
| Tajikistan | Only exports grew |
| Thailand | Neither exports or imports grew |
| Timor-Leste | Neither exports or imports grew |
| Togo | Only exports grew |
| Tonga | Only exports grew |
| Trinidad and Tobago | Neither exports or imports grew |
| Tunisia | Both exports and imports grew |
| Türkiye | Neither exports or imports grew |
| Turkmenistan | Both exports and imports grew |
| Turks and Caicos Islands | Neither exports or imports grew |
| Uganda | Only exports grew |
| Ukraine | Only exports grew |
| United Arab Emirates | Both exports and imports grew |
| United Kingdom | Only imports grew |
| United Republic of Tanzania | Only exports grew |
| United States | Only imports grew |
| United States Minor Outlying Islands | Only imports grew |
| Uruguay | Only imports grew |
| Uzbekistan | Only exports grew |
| Vanuatu | Both exports and imports grew |
| Venezuela | Both exports and imports grew |
| Vietnam | Only imports grew |
| Wallis and Futuna | Only exports grew |
| Western Sahara | Neither exports or imports grew |
| Yemen | Both exports and imports grew |
| Zambia | Only exports grew |
| Zimbabwe | Neither exports or imports grew |
Prices and volumes
After extraordinary growth in the last few years, Canadian merchandise export prices declined 6.9% in 2023, mirroring the trends in global commodity prices. Stripping away price effects, export volumes grew 5.7% in 2023 to finally reach beyond the levels achieved prior to the pandemic.
Being less influenced by commodity prices, import prices grew 2.5% in 2023, a much slower pace than in 2022. Import volumes decreased 1.1% after two consecutive years of growth, but remained above pre-pandemic levels.
Figure 5: Canadian merchandise export and import price and volume index, 2017 = 100
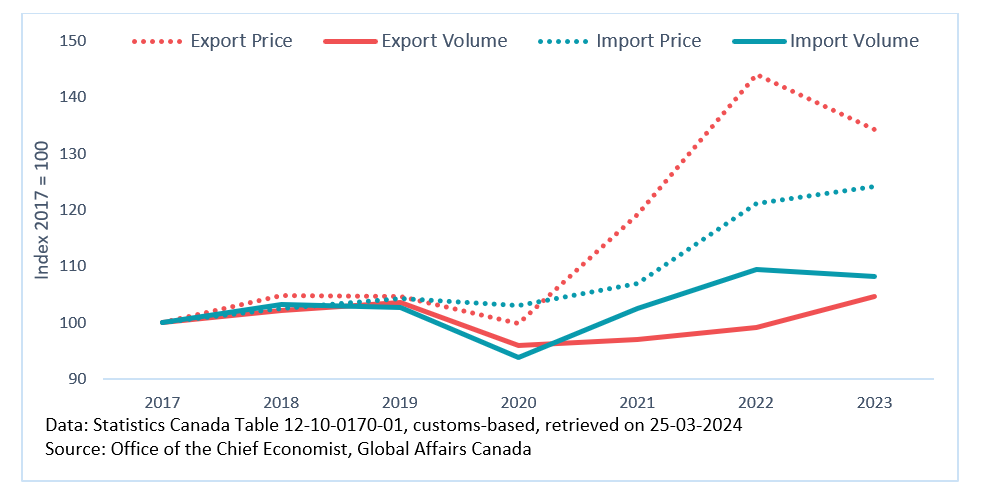
Figure 5 - Text version
| Canadian merchandise export and import price and volume index, 2017 = 100 | 2017 | 2018 | 2019 | 2020 | 2021 | 2022 | 2023 |
|---|---|---|---|---|---|---|---|
| Export Price | 100 | 105 | 105 | 100 | 119 | 144 | 134 |
| Export Volume | 100 | 102 | 104 | 96 | 97 | 99 | 105 |
| Import Price | 100 | 103 | 104 | 103 | 107 | 121 | 124 |
| Import Volume | 100 | 103 | 103 | 94 | 103 | 109 | 108 |
Sector diversity
A commonly used indicator to measure sectoral diversity is the Herfindahl-Hirschman IndexFootnote 2 (HHI). For example, the Office of the Chief Economist at Global Affairs Canada has used this index to determine trade diversity by sectors and by trade partners. The U.S. Department of Justice also uses the HHI to determine the competitive nature of a market, with an HHI score of less than 1500 as the dividing line between a market that is competitive or diverse.
Using the same criteria, Canadian merchandise exports and imports can be considered diverse by sector, as there are no sectors that account for an overwhelmingly large share of either exports or imports. The only exception is 2022, where Canadian merchandise exports became moderately concentrated, due to the large increase in the prices of crude oil which caused the value of energy products exports to account for a large share (31%) of merchandise exports. As the prices of crude oil moderated in 2023, Canadian merchandise exports have returned to an HHI level that can be considered diverse in terms of sectors.
Figure 6: Herfindahl-Hirschman Index (HHI) for Canadian merchandise trade diversity by sector
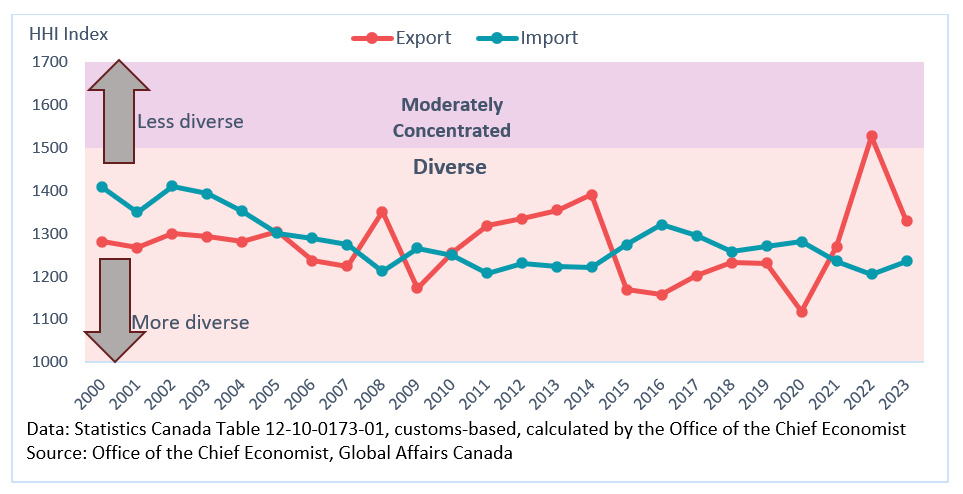
Figure 6 - Text version
| Herfindahl-Hirschman Index (HHI) for Canadian merchandise trade diversity by sector | Export | Import |
|---|---|---|
| 2000 | 1281 | 1408 |
| 2001 | 1267 | 1350 |
| 2002 | 1300 | 1411 |
| 2003 | 1293 | 1394 |
| 2004 | 1281 | 1352 |
| 2005 | 1304 | 1300 |
| 2006 | 1236 | 1289 |
| 2007 | 1224 | 1274 |
| 2008 | 1351 | 1212 |
| 2009 | 1172 | 1266 |
| 2010 | 1255 | 1249 |
| 2011 | 1319 | 1208 |
| 2012 | 1334 | 1231 |
| 2013 | 1355 | 1223 |
| 2014 | 1390 | 1222 |
| 2015 | 1169 | 1275 |
| 2016 | 1157 | 1321 |
| 2017 | 1202 | 1295 |
| 2018 | 1232 | 1258 |
| 2019 | 1231 | 1271 |
| 2020 | 1118 | 1282 |
| 2021 | 1270 | 1235 |
| 2022 | 1527 | 1206 |
| 2023 | 1329 | 1236 |
Regional Review
Regional trade performance in 2023
The 2023 decline in Canadian merchandise exports was widespread, with exports to most major regions experiencing negative growth. In percentage terms, the 2023 decline in Canadian merchandise exports was the largest in Europe & Central Asia (-9.1%), followed by the Indo-Pacific (-4.5%), the U.S. (-1.2%), and Latin America & Caribbean (-0.2%). Exports to the Middle East & Africa were a bright spot as it grew 0.9% in 2023 after experiencing negative growth in the previous year.
Canadian merchandise imports by major regions were more mixed, with growth being led in percentage terms by Latin America & Caribbean (+8.4%), Europe & Central Asia (+6.3%), and the U.S. (+2.1%). These growth were partially mitigated by declines in imports from the Middle East & Africa (-4.8%) and the Indo‑Pacific (‑5.2%).
Figure 7: Annual Canadian merchandise trade growth by region (2023, % change)
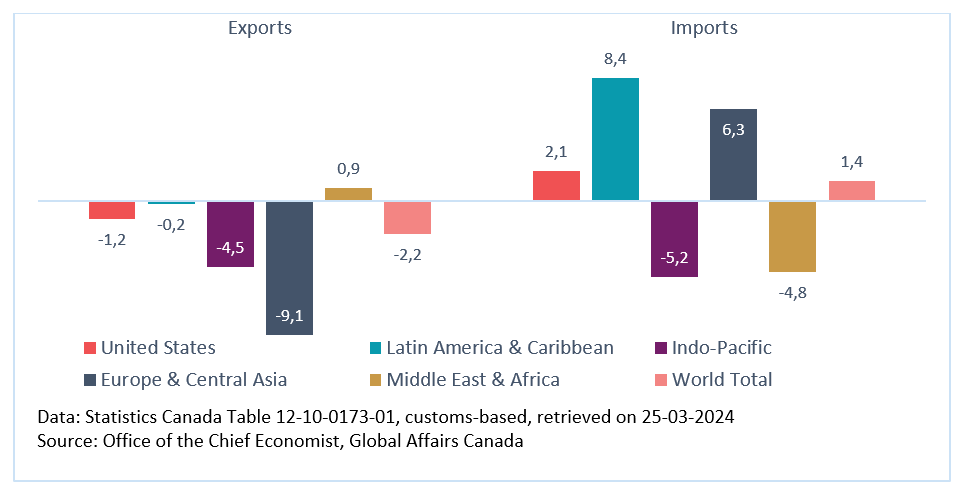
Figure 7 - Text version
| Annual Canadian merchandise trade growth by region (2023. % change) | Exports | Imports |
|---|---|---|
| United States | -1.2 | 2.1 |
| Latin America & Caribbean | -0.2 | 8.4 |
| Indo-Pacific | -4.5 | -5.2 |
| Europe & Central Asia | -9.1 | 6.3 |
| Middle East & Africa | 0.9 | -4.8 |
| World Total | -2.2 | 1.4 |
The U.S. remained Canada’s largest merchandise trade partner, accounting for 77.1% of Canada’s merchandise exports in 2023. The U.S. also dominates Canada’s merchandise imports but to a lesser extent than exports. In 2023, 49.6% of Canada’s merchandise imports came from the U.S. Figure 8 depicts the size of Canada’s merchandise exports and imports by region.
Figure 8: Share of Canada’s merchandise exports and imports by region (2023)
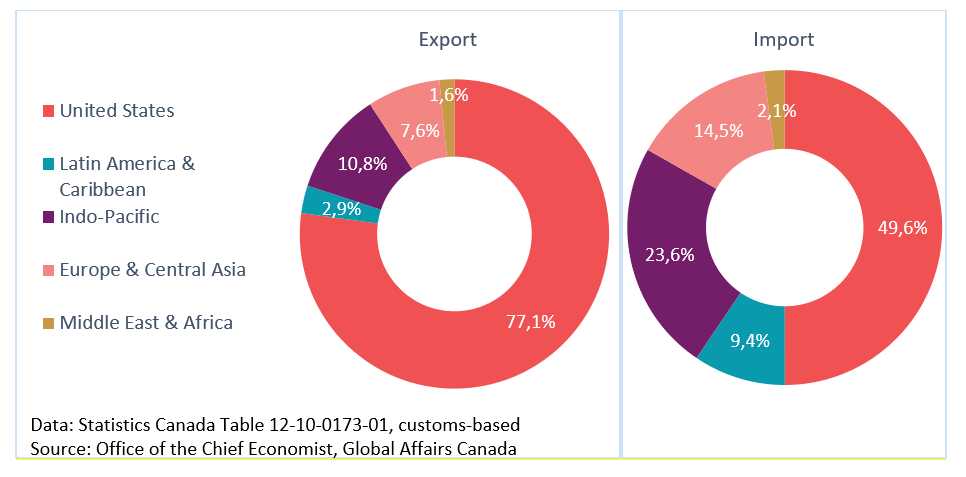
Figure 8 - Text version
| Share of Canada’s merchandise exports and imports by region (2023. %) | Export | Import |
|---|---|---|
| United States | 77.1 | 49.6 |
| Latin America & Caribbean | 2.9 | 9.4 |
| Indo-Pacific | 10.8 | 23.6 |
| Europe & Central Asia | 7.6 | 14.5 |
| Middle East & Africa | 1.6 | 2.1 |
The United States
The decline in Canadian merchandise exports to the U.S. in 2023 was mostly due to sectors that are resource‑based, led by decreases in exports of energy products (-18.7%), forestry products and building and packaging materials (-16.8%), basic and industrial chemical, plastic and rubber products (-5.5%), and metal ores and non-metallic minerals (-19.8%). The declines in these sectors can be largely attributed to commodity prices which came down from the elevated levels of 2022.
These declines were partially mitigated by growth in other sectors, with the largest positive contributor coming from motor vehicles and parts (+32.8%), followed by metal and non-metallic mineral products (+10.8%), and aircraft and other transportation equipment and parts (+43.9%). Motor vehicles and parts, and aircraft and other transportation equipment and parts were the only two sectors where growth in 2023 outpaced growth in 2022 as the former sector benefited from the normalization of supply chain pressure and the latter sector benefited from the aviation industry’s response to post-pandemic travel demand.
The growth in merchandise imports from the U.S. in 2023 was led by imports of motor vehicles and parts (+9.6%), industrial machinery, equipment and parts (+10.0%), and electronic and electrical equipment and parts (+12.6%). The easing of supply chain pressures continued to benefit the motor vehicles and parts sector. These gains were partially offset by declines in other sectors, led by basic and industrial chemical, plastic and rubber products (-8.4%), and energy products (-8.6%). Once again, lowered commodity prices had an impact on energy products.
Figure 9: Canadian merchandise trade with the United States (% change, 2023/2022)
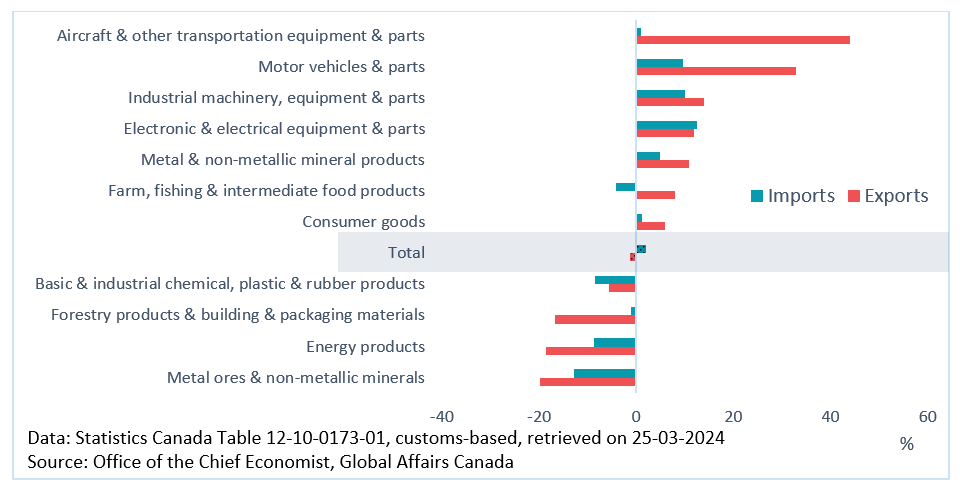
Figure 9 - Text version
| Canadian merchandise trade growth with the United States (% change. 2023) | Exports | Imports |
|---|---|---|
| Metal ores & non-metallic minerals | -19.8 | -12.8 |
| Energy products | -18.7 | -8.6 |
| Forestry products & building & packaging materials | -16.8 | -1.1 |
| Basic & industrial chemical. plastic & rubber products | -5.5 | -8.4 |
| Total | -1.2 | 2.1 |
| Consumer goods | 5.8 | 1.1 |
| Farm. fishing & intermediate food products | 7.9 | -4.2 |
| Metal & non-metallic mineral products | 10.8 | 4.9 |
| Electronic & electrical equipment & parts | 11.9 | 12.6 |
| Industrial machinery. equipment & parts | 13.9 | 10.0 |
| Motor vehicles & parts | 32.8 | 9.6 |
| Aircraft & other transportation equipment & parts | 43.9 | 1.0 |
Sector diversity: The United States
The sector mix of Canadian merchandise exports to the U.S. fluctuates between being moderately concentrated and being diverse. This is often due to the movement of energy product exports.
Canadian merchandise exports to the U.S. are generally a little more concentrated than overall Canadian merchandise exports.
On the imports side, Canadian merchandise imports from the U.S. were moderately concentrated in the early 2000s but can be considered diverse in recent years.
Figure 10: Herfindahl-Hirschman Index (HHI) for Canada-United States merchandise trade diversity by sectors
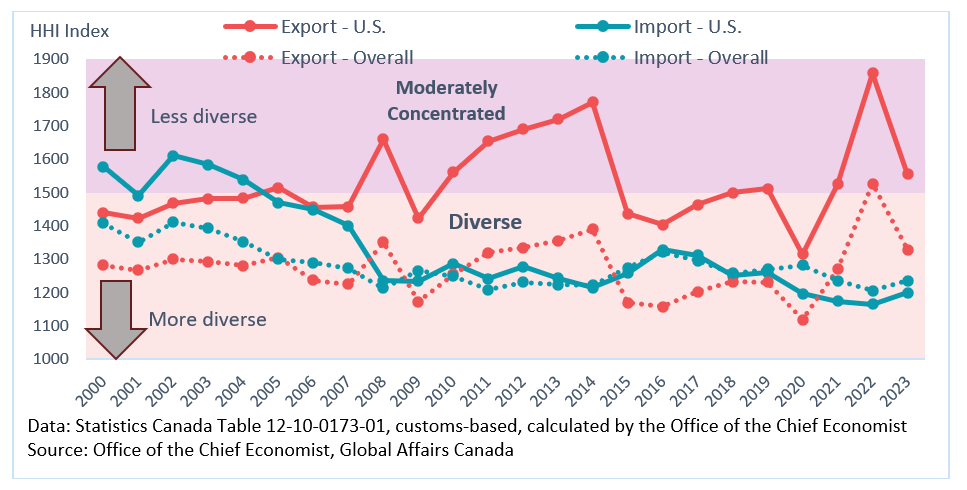
Figure 10 - Text version
| Herfindahl-Hirschman Index (HHI) for Canada-United States merchandise trade diversity by sectors | Export - U.S. | Import - U.S. | Export - Overall | Import - Overall |
|---|---|---|---|---|
| 2000 | 1440 | 1578 | 1281 | 1408 |
| 2001 | 1422 | 1491 | 1267 | 1350 |
| 2002 | 1467 | 1610 | 1300 | 1411 |
| 2003 | 1482 | 1584 | 1293 | 1394 |
| 2004 | 1483 | 1538 | 1281 | 1352 |
| 2005 | 1515 | 1469 | 1304 | 1300 |
| 2006 | 1456 | 1448 | 1236 | 1289 |
| 2007 | 1457 | 1400 | 1224 | 1274 |
| 2008 | 1660 | 1235 | 1351 | 1212 |
| 2009 | 1423 | 1234 | 1172 | 1266 |
| 2010 | 1561 | 1286 | 1255 | 1249 |
| 2011 | 1654 | 1241 | 1319 | 1208 |
| 2012 | 1690 | 1277 | 1334 | 1231 |
| 2013 | 1720 | 1243 | 1355 | 1223 |
| 2014 | 1771 | 1215 | 1390 | 1222 |
| 2015 | 1436 | 1258 | 1169 | 1275 |
| 2016 | 1403 | 1329 | 1157 | 1321 |
| 2017 | 1463 | 1312 | 1202 | 1295 |
| 2018 | 1499 | 1250 | 1232 | 1258 |
| 2019 | 1511 | 1260 | 1231 | 1271 |
| 2020 | 1315 | 1197 | 1118 | 1282 |
| 2021 | 1524 | 1174 | 1270 | 1235 |
| 2022 | 1858 | 1165 | 1527 | 1206 |
| 2023 | 1556 | 1199 | 1329 | 1236 |
Latin American and the Caribbean
Canadian merchandise exports to Latin America and the Caribbean declined 0.2% in 2023, with declines in exports to top destinations such as Mexico (-5.1%), Peru (-9.8%), Colombia (-7.1%) and Chile (-12.5%). The decline in exports to Mexico, Canada’s biggest export destination in Latin America and the Caribbean, was led by declines in farm, fishing and intermediate food products (-17.5%), energy products (-64.9%) and metal and non-metallic mineral products (-13.9%).
These declines were almost fully offset by growth to other destinations in Latin America and the Caribbean, such as Brazil (+1.2%), Ecuador (+9.2%), Panama (71.8%), BES (Bonaire, Sint Eustatius and Saba) Islands (+129.2%), Argentina (+26.1%), and Guatemala (+33.5%). The large growth to BES Islands was due to basic and industrial chemical, plastic and rubber products and energy products. The large growth to Panama was due almost entirely to energy products.
Figure 11: Canadian merchandise exports to top partners in Latin America and the Caribbean
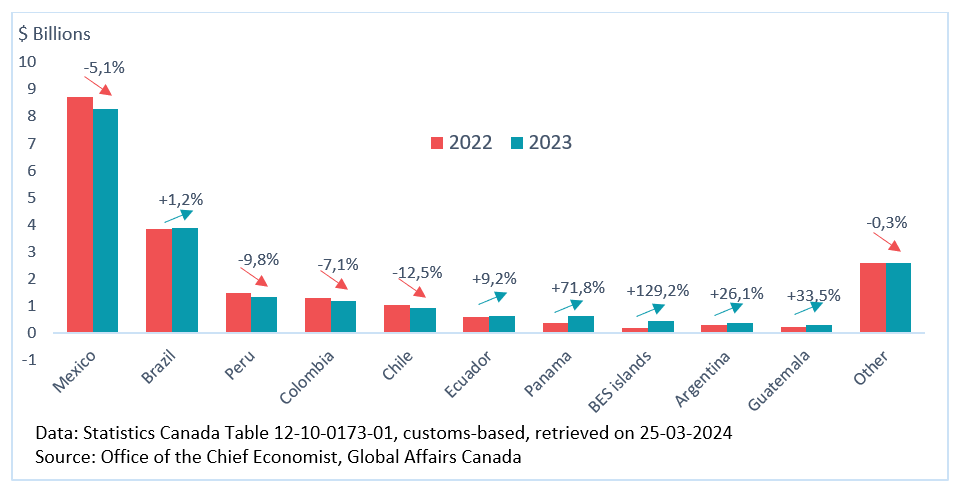
Figure 11 - Text version
| Canadian merchandise exports to top partners in Latin America and the Caribbean | 2022 export ($ thousand) | 2023 export ($ thousand) | 2023 export (% growth) |
|---|---|---|---|
| Mexico | 8 725 537 | 8 280 286 | -5.1 |
| Brazil | 3 838 637 | 3 883 868 | 1.2 |
| Peru | 1 479 776 | 1 334 143 | -9.8 |
| Colombia | 1 284 563 | 1 193 676 | -7.1 |
| Chile | 1 044 427 | 914 104 | -12.5 |
| Ecuador | 594 527 | 648 956 | 9.2 |
| Panama | 376 221 | 646 525 | 71.8 |
| BES islands | 201 181 | 461 198 | 129.2 |
| Argentina | 297 794 | 375 660 | 26.1 |
| Guatemala | 240 179 | 320 622 | 33.5 |
| Other | 2 592 137 | 2 583 512 | -0.3 |
Declining commodity prices from the elevated levels seen in 2022 played a role in the decline of Canadian merchandise exports to Latin America and the Caribbean, as the largest contributors to the decline were metal ores and non-metallic minerals (-6.4%) and energy products (-8.9%), followed by aircraft and other transportation equipment and parts (-27.8%). However, growth in some sectors almost entirely offset the declines, led by industrial machinery, equipment and parts (+29.4%), consumer goods (+10.4%), and basic and industrial chemical, plastic and rubber products (+13.6%).
Canadian merchandise imports from Latin America and the Caribbean grew 8.4% in 2023, the fastest percentage growth among the main regions. Among the top partners, support for this growth was imports from Mexico (+11.4%), Brazil (+8.0%), Peru (+12.4%), Argentina (+4.5%), Costa Rica (+12.5%), and Ecuador (+2.9%).
The growth in imports from Mexico, Canada’s largest import origin in Latin America and the Caribbean, was almost entirely due to motor vehicles and parts (+26.0%), which benefited from the easing of supply chain pressure in 2023. Among the top import origins in Latin America and the Caribbean, declines in imports in 2023 came from Chile (-2.2%), Colombia (-26.3%), Guatemala (-0.5%), and Cuba (-17.8%).
Figure 12: Canadian merchandise imports from top partners in Latin America and the Caribbean
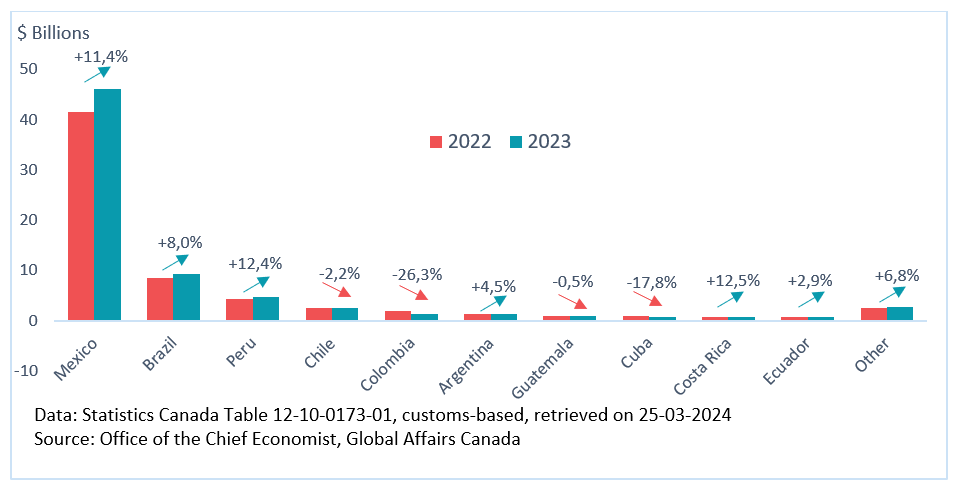
Figure 12 - Text version
| Canadian merchandise imports from top partners in Latin America and the Caribbean | 2022 import ($ thousand) | 2023 import ($ thousand) | 2023 import (% growth) |
|---|---|---|---|
| Mexico | 41 417 546 | 46 134 103 | 11.4 |
| Brazil | 8 507 279 | 9 186 003 | 8.0 |
| Peru | 4 182 705 | 4 700 467 | 12.4 |
| Chile | 2 452 891 | 2 400 104 | -2.2 |
| Colombia | 1 880 904 | 1 386 115 | -26.3 |
| Argentina | 1 299 114 | 1 357 023 | 4.5 |
| Guatemala | 806 413 | 802 412 | -0.5 |
| Cuba | 960 331 | 789 519 | -17.8 |
| Costa Rica | 640 530 | 720 566 | 12.5 |
| Ecuador | 679 377 | 699 416 | 2.9 |
| Other | 2 575 395 | 2 749 569 | 6.8 |
The increase in merchandise imports from Latin America and the Caribbean was led by growth in motor vehicles and parts (+25.7%), aircraft and other transportation equipment and parts (+75.1%), farm, fishing and intermediate food products (+11.2%), and metal ores and non-metallic minerals (+5.5%). While overall merchandise imports from Latin America and the Caribbean increased in 2023, there was declines in metal and non-metallic mineral products (-21.6%), energy products (-31.0%), and basic and industrial chemical, plastic and rubber products (-16.7%).
Figure 13: Canadian merchandise trade with Latin America and the Caribbean (% change, 2023/2022)
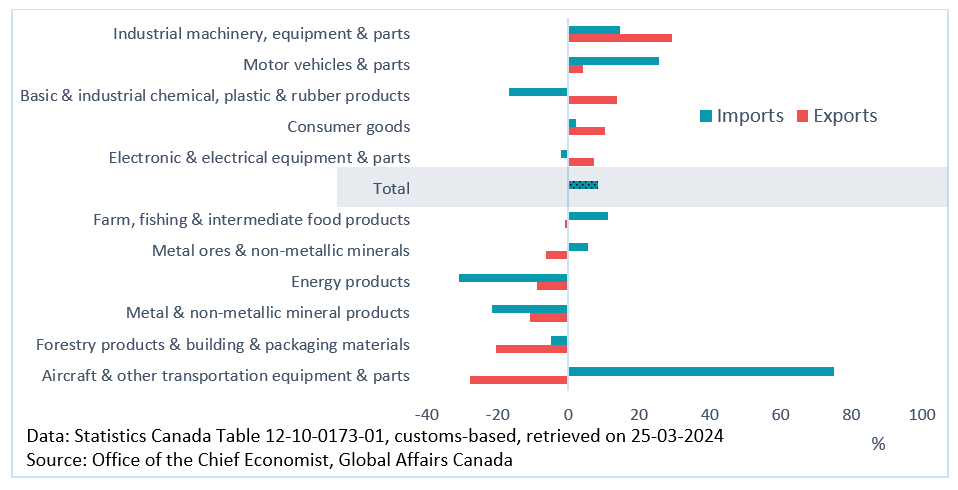
Figure 13 - Text version
| Canadian merchandise trade growth with Latin America and the Caribbean (% change. 2023) | Exports | Imports |
|---|---|---|
| Aircraft & other transportation equipment & parts | -27.8 | 75.1 |
| Forestry products & building & packaging materials | -20.5 | -5.0 |
| Metal & non-metallic mineral products | -10.9 | -21.6 |
| Energy products | -8.9 | -31.0 |
| Metal ores & non-metallic minerals | -6.4 | 5.5 |
| Farm. fishing & intermediate food products | -0.8 | 11.2 |
| Total | -0.2 | 8.4 |
| Electronic & electrical equipment & parts | 7.3 | -2.2 |
| Consumer goods | 10.4 | 2.2 |
| Basic & industrial chemical. plastic & rubber products | 13.6 | -16.7 |
| Motor vehicles & parts | 4.2 | 25.7 |
| Industrial machinery. equipment & parts | 29.4 | 14.6 |
Sector diversity: Latin America and the Carribbean
In terms of diversity by sectors, Canadian merchandise exports to Latin America and the Caribbean generally can be considered diverse.
On the imports side, Canadian merchandise imports from Latin America and the Caribbean are more concentrated than overall Canadian imports. The HHI value shows that imports from Latin America and the Caribbean were moderately concentrated in the early 2000s, followed by a period where imports were in the diverse zone, before returning to being moderately concentrated. This trend was mainly caused by imports of motor vehicles and parts, as periods of strong imports of motor vehicles and parts from Latin America and the Caribbean usually coincided with HHI value moving into the moderately concentrated zone.
Figure 14: Herfindahl-Hirschman Index (HHI) for Canada-Latin America and the Caribbean merchandise trade diversity by sectors
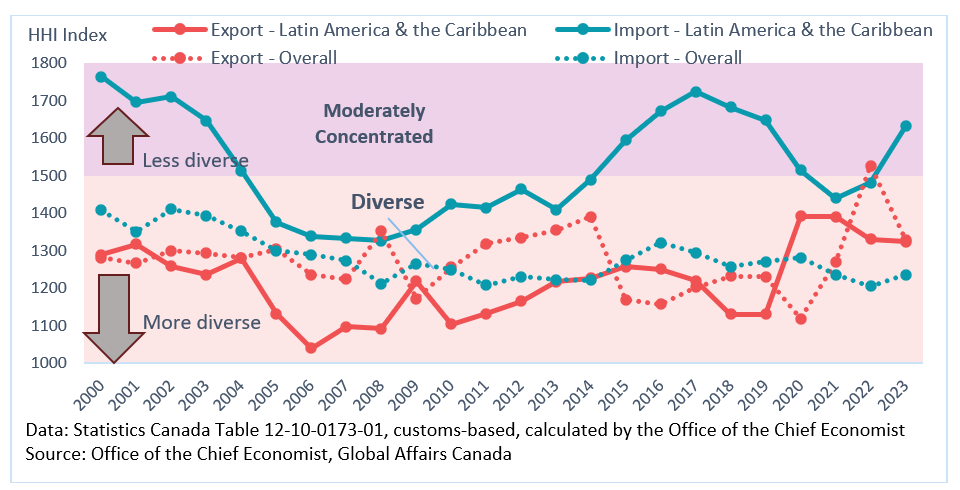
Figure 14 - Text version
| Herfindahl-Hirschman Index (HHI) for Canada-Latin America and the Caribbean merchandise trade diversity by sectors | Export - Latin America & the Caribbean | Import - Latin America & the Caribbean | Export - Overall | Import - Overall |
|---|---|---|---|---|
| 2000 | 1289 | 1764 | 1281 | 1408 |
| 2001 | 1318 | 1696 | 1267 | 1350 |
| 2002 | 1258 | 1710 | 1300 | 1411 |
| 2003 | 1235 | 1646 | 1293 | 1394 |
| 2004 | 1281 | 1514 | 1281 | 1352 |
| 2005 | 1132 | 1376 | 1304 | 1300 |
| 2006 | 1039 | 1338 | 1236 | 1289 |
| 2007 | 1097 | 1334 | 1224 | 1274 |
| 2008 | 1092 | 1326 | 1351 | 1212 |
| 2009 | 1218 | 1356 | 1172 | 1266 |
| 2010 | 1105 | 1424 | 1255 | 1249 |
| 2011 | 1132 | 1415 | 1319 | 1208 |
| 2012 | 1165 | 1464 | 1334 | 1231 |
| 2013 | 1218 | 1409 | 1355 | 1223 |
| 2014 | 1227 | 1489 | 1390 | 1222 |
| 2015 | 1258 | 1595 | 1169 | 1275 |
| 2016 | 1250 | 1672 | 1157 | 1321 |
| 2017 | 1220 | 1725 | 1202 | 1295 |
| 2018 | 1131 | 1682 | 1232 | 1258 |
| 2019 | 1130 | 1648 | 1231 | 1271 |
| 2020 | 1392 | 1515 | 1118 | 1282 |
| 2021 | 1390 | 1440 | 1270 | 1235 |
| 2022 | 1331 | 1481 | 1527 | 1206 |
| 2023 | 1324 | 1632 | 1329 | 1236 |
Europe and Central Asia
Canadian merchandise exports to Europe and Central Asia declined in 2023, with declines in exports to top destinations such as the United Kingdom (-25.0%), Germany (-9.1%), Belgium (-16.9%), Norway (-21.6%), Italy (-6.8%), Spain (-26.8%), and Türkiye (-5.2%). Among the top export destinations in the region, there was growth in exports to the Netherlands (+14.6%), Switzerland (+31.3%), and France (+3.9%). The decline in exports to the United Kingdom can be mostly attributed to metal and non-metallic mineral products (-35.9%), in particular gold. With impressive exports growth in the past few years, the Netherlands is now Canada’s top merchandise export destination in the European Union, overtaking Germany. Export growth to the Netherlands in 2023 was supported by energy products (+98.6%).
Figure 15: Canadian merchandise exports to top partners in Europe and Central Asia
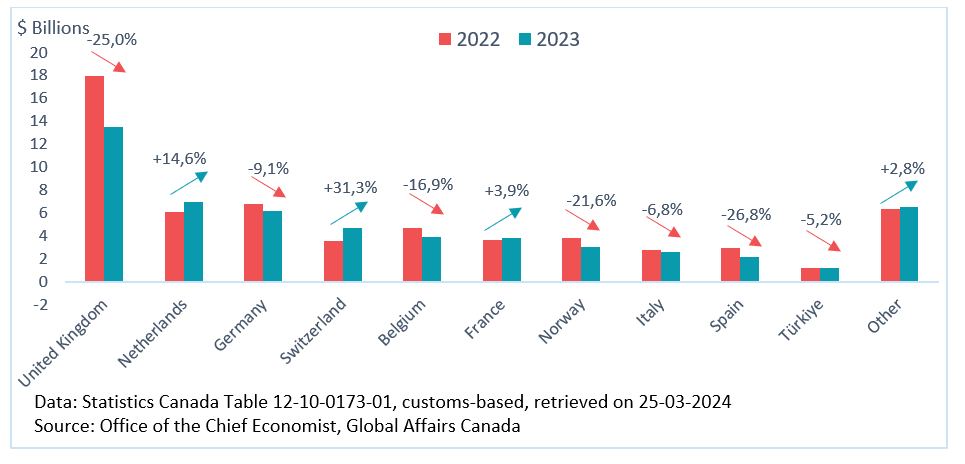
Figure 15 - Text version
| Canadian merchandise exports to top partners in Europe and Central Asia | 2022 export ($ thousand) | 2023 export ($ thousand) | 2023 export (% growth) |
|---|---|---|---|
| United Kingdom | 17 978 609 | 13 485 762 | -25.0 |
| Netherlands | 6 047 647 | 6 930 418 | 14.6 |
| Germany | 6 764 655 | 6 151 470 | -9.1 |
| Switzerland | 3 562 910 | 4 679 426 | 31.3 |
| Belgium | 4 697 587 | 3 905 647 | -16.9 |
| France | 3 633 119 | 3 775 426 | 3.9 |
| Norway | 3 817 994 | 2 991 763 | -21.6 |
| Italy | 2 768 777 | 2 579 724 | -6.8 |
| Spain | 2 978 696 | 2 180 613 | -26.8 |
| Türkiye | 1 235 783 | 1 171 141 | -5.2 |
| Other | 6 336 904 | 6 512 704 | 2.8 |
The decline in Canadian merchandise exports to the region was led by metal and non-metallic mineral products (-19.0%), consumer goods (-22.1%), and metal ores and non-metallic minerals (-9.4%). The decline in metal and non-metallic mineral products was mostly due to lower exports of gold to the United Kingdom. Within consumer goods, there was large declines in exports of cleaning products, appliances, and miscellaneous goods and supplies, and pharmaceutical and medicinal products to the European Union. Despite these declines, some sectors witnessed exports growth to Europe and Central Asia, led by aircraft and other transportation equipment and parts (+31.4%).
Canadian merchandise imports from Europe and Central Asia grew in 2023, with broad-based growth in imports from many top partners such as Germany (+11.2%), Italy (+6.3%), the United Kingdom (+8.8%), France (+10.7%), Switzerland (+14.0%), Belgium (+5.6%), Sweden (+36.4%), Spain (+5.6%), and Portugal (+52.2%). Among the top partners, only imports from the Netherlands (-19.3%) declined.
Figure 16: Canadian merchandise imports from top partners in Europe and Central Asia
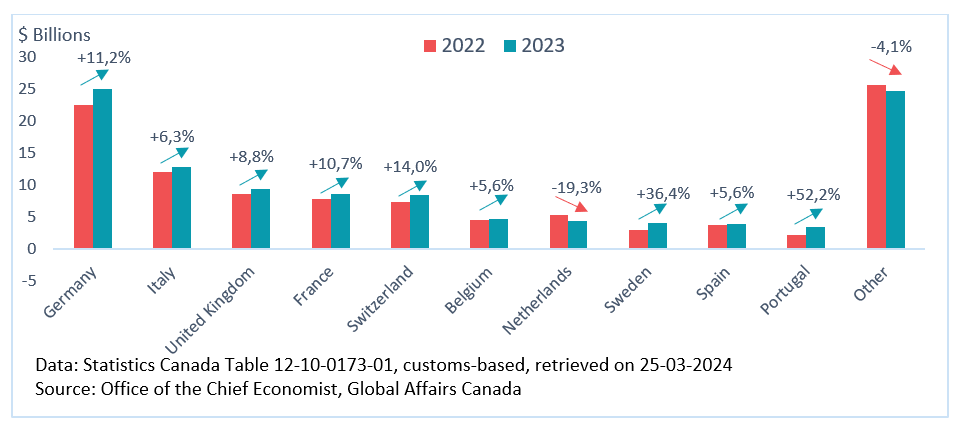
Figure 16 - Text version
| Canadian merchandise imports from top partners in Europe and Central Asia | 2022 import ($ thousand) | 2023 import ($ thousand) | 2023 import (% growth) |
|---|---|---|---|
| Germany | 22 499 113 | 25 029 224 | 11.2 |
| Italy | 12 130 498 | 12 894 331 | 6.3 |
| United Kingdom | 8 673 817 | 9 434 679 | 8.8 |
| France | 7 800 056 | 8 635 685 | 10.7 |
| Switzerland | 7 446 131 | 8 488 300 | 14.0 |
| Belgium | 4 532 674 | 4 787 209 | 5.6 |
| Netherlands | 5 407 115 | 4 362 795 | -19.3 |
| Sweden | 2 947 167 | 4 020 800 | 36.4 |
| Spain | 3 763 183 | 3 975 092 | 5.6 |
| Portugal | 2 258 686 | 3 436 883 | 52.2 |
| Other | 25 734 134 | 24 667 262 | -4.1 |
The increase in imports from Europe and Central Asia was led by industrial machinery, equipment and parts (+18.2%), motor vehicles and parts (+20.6%), consumer goods (+5.0%), aircraft and other transportation equipment and parts (+29.6%), and electronic and electrical equipment and parts (+13.0%). At the other end, there were decline in imports of some sectors, led by energy products (-31.8%), and metal and non‑metallic mineral products (-7.6%).
Figure 17: Canadian merchandise trade with Europe and Central Asia (% change, 2023/2022)
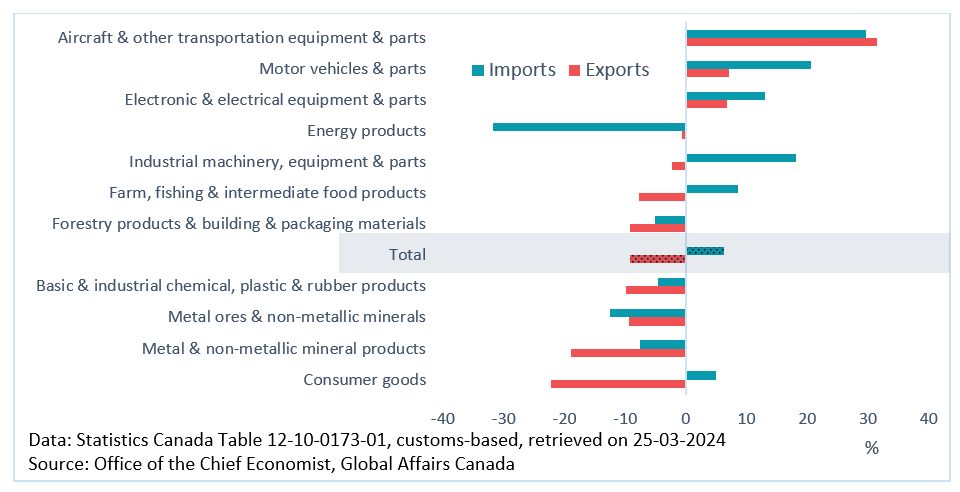
Figure 17 - Text version
| Canadian merchandise trade growth with Europe and Central Asia (% change. 2023) | Exports | Imports |
|---|---|---|
| Consumer goods | -22.1 | 5.0 |
| Metal & non-metallic mineral products | -19.0 | -7.6 |
| Metal ores & non-metallic minerals | -9.4 | -12.4 |
| Basic & industrial chemical. plastic & rubber products | -9.8 | -4.6 |
| Total | -9.1 | 6.3 |
| Forestry products & building & packaging materials | -9.2 | -5.1 |
| Farm. fishing & intermediate food products | -7.7 | 8.6 |
| Industrial machinery. equipment & parts | -2.2 | 18.2 |
| Energy products | -0.6 | -31.8 |
| Electronic & electrical equipment & parts | 6.8 | 13.0 |
| Motor vehicles & parts | 7.2 | 20.6 |
| Aircraft & other transportation equipment & parts | 31.4 | 29.6 |
Canadian merchandise trade with the European Union
Canadian merchandise exports to the European Union (EU) dropped 7.1% in 2023, led by drop in exports to top partners such as Germany (-9.1%), Belgium (-16.9%), Italy (-6.8%), Spain (-26.8%), Poland (‑9.8%), Ireland (‑21.2%) and Finland (-24.1%). Despite this, there was growth in exports to some top partners such as the Netherlands (+14.6%), France (+3.9%) and Sweden (+2.7%). The Netherlands is now Canada’s top export destination in the EU, overtaking Germany.
The drop in exports to the EU was led by consumer goods (-31.7%), and metal ores and non-metallic minerals (‑10.5%). Within consumer goods, there was large declines in exports of cleaning products, appliances, and miscellaneous goods and supplies, and pharmaceutical and medicinal products.
Canadian merchandise imports from the EU grew 8.6% in 2023, with broad-based growth in imports from most top partners such as Germany (+11.2%), Italy (+6.3%), France (+10.7%), Belgium (+5.6%), Sweden (+36.4%), Spain (+5.6%), Portugal (+52.2%), and Austria (+11.6%). Among the top partners, only imports from the Netherlands (‑19.3%) and Ireland (-16.4%) declined.
The growth in imports from the EU was led by industrial machinery, equipment and parts (+17.7%), motor vehicles and parts (+21.2%), consumer goods (+5.9%), aircraft and other transportation equipment and parts (+28.3%), and electronic and electrical equipment and parts (+13.3%). Despite these growth, imports of some resource-based sectors declined, such as energy products (-25.0%) and basic and industrial chemical, plastic and rubber products (-9.8%).
Sector diversity: Europe and Central Asia
Canadian merchandise exports to Europe and Central Asia were diverse in the early 2000s but have since become moderately concentrated due to the increasing importance of metal and non-metallic mineral products, mainly due to gold exports to the United Kingdom. Imports from the region have also become moderately concentrated due to the increasing importance of consumer goods.
The HHI value shows that Canadian merchandise exports to the European Union can be considered diverse by sectors. On the other hand, Canadian merchandise imports from the European Union can be considered moderately concentrated by sectors, with consumer goods accounting for a relatively large share of imports.
Figure 18: Herfindahl-Hirschman Index (HHI) for Canada’s merchandise trade diversity by sectors with Europe and Central Asia
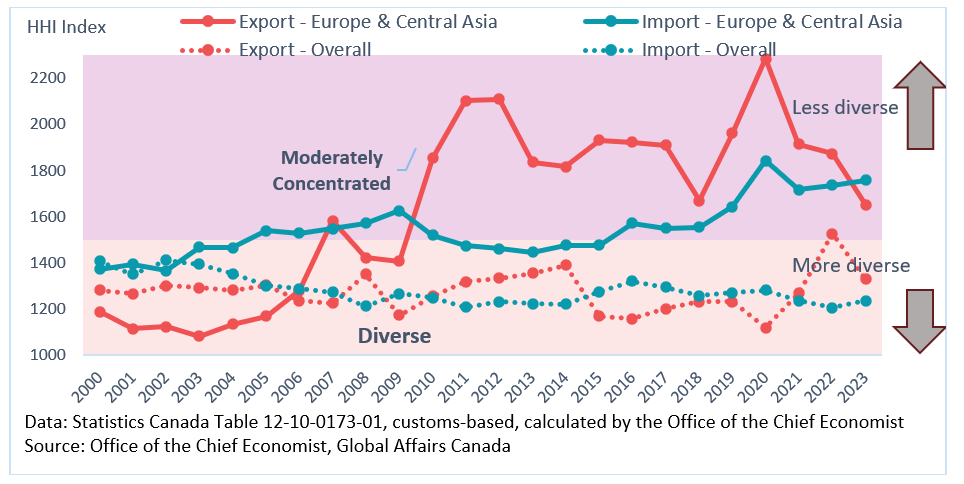
Figure 18 - Text version
| Herfindahl-Hirschman Index (HHI) for Canada’s merchandise trade diversity by sectors with Europe and Central Asia | Export - Europe & Central Asia | Import - Europe & Central Asia | Export - Overall | Import - Overall |
|---|---|---|---|---|
| 2000 | 1188 | 1373 | 1281 | 1408 |
| 2001 | 1116 | 1394 | 1267 | 1350 |
| 2002 | 1124 | 1366 | 1300 | 1411 |
| 2003 | 1082 | 1467 | 1293 | 1394 |
| 2004 | 1135 | 1465 | 1281 | 1352 |
| 2005 | 1169 | 1539 | 1304 | 1300 |
| 2006 | 1280 | 1529 | 1236 | 1289 |
| 2007 | 1584 | 1548 | 1224 | 1274 |
| 2008 | 1423 | 1571 | 1351 | 1212 |
| 2009 | 1407 | 1626 | 1172 | 1266 |
| 2010 | 1853 | 1520 | 1255 | 1249 |
| 2011 | 2103 | 1475 | 1319 | 1208 |
| 2012 | 2109 | 1462 | 1334 | 1231 |
| 2013 | 1837 | 1446 | 1355 | 1223 |
| 2014 | 1816 | 1476 | 1390 | 1222 |
| 2015 | 1931 | 1476 | 1169 | 1275 |
| 2016 | 1923 | 1573 | 1157 | 1321 |
| 2017 | 1911 | 1551 | 1202 | 1295 |
| 2018 | 1670 | 1554 | 1232 | 1258 |
| 2019 | 1963 | 1643 | 1231 | 1271 |
| 2020 | 2284 | 1842 | 1118 | 1282 |
| 2021 | 1915 | 1718 | 1270 | 1235 |
| 2022 | 1874 | 1737 | 1527 | 1206 |
| 2023 | 1653 | 1758 | 1329 | 1236 |
Indo-Pacific
Canadian merchandise exports to the Indo-Pacific declined 4.5% in 2023, with widespread declines in exports to top partners such as Japan (-12.4%), South Korea (-19.9%), India (-4.7%), Australia (-0.4%), Indonesia (‑29.6%), Taiwan (-23.6%), Bangladesh (-16.8%). Resource-based sectors played a major role in these declines, for example, the decline in exports to Japan was led by forestry products and building and packaging materials (-43.2%), energy products (-11.1%), and farm, fishing and intermediate food products (‑18.2%).
On the other hand, there was growth in exports to top partners such as China (+6.3%), Hong Kong (44.8%), and Singapore (+10.6%). The growth in exports to China was supported by farm, fishing and intermediate food products (+21.1%) and consumer goods (+33.6%).
The decline in Canadian merchandise exports to the Indo-Pacific region was led by energy products (-15.9%), metal ores and non-metallic minerals (-15.4%), and forestry products and building and packaging materials (‑16.7%). The price of many commodity-based products reached elevated levels in 2022, before declining in 2023, which pulled down export values.
Partially offsetting these declines were notable growth in exports of metal and non-metallic mineral products (+22.0%), and farm, fishing and intermediate food products (+7.3%). Growth in exports of metal and non‑metallic mineral products was mainly supported by gold to Hong Kong while exports of farm, fishing and intermediate food products was mainly supported by canola seeds to China.
Figure 19: Canadian merchandise exports to top partners in Indo-Pacific region
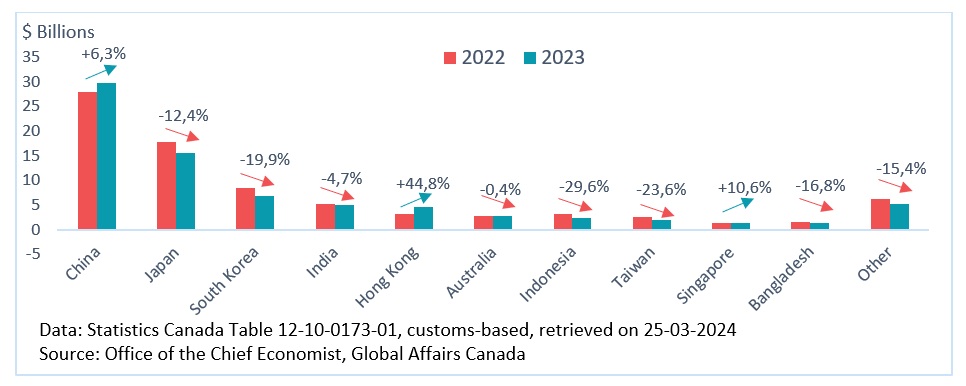
Figure 19 - Text version
| Canadian merchandise exports to top partners in Indo-Pacific region | 2022 export ($ thousand) | 2023 export ($ thousand) | 2023 export (% growth) |
|---|---|---|---|
| China | 27 994 925 | 29 756 543 | 6.3 |
| Japan | 17 750 685 | 15 548 978 | -12.4 |
| South Korea | 8 521 663 | 6 823 464 | -19.9 |
| India | 5 239 442 | 4 993 753 | -4.7 |
| Hong Kong | 3 132 777 | 4 536 719 | 44.8 |
| Australia | 2 843 533 | 2 832 654 | -0.4 |
| Indonesia | 3 217 452 | 2 265 379 | -29.6 |
| Taiwan | 2 450 509 | 1 872 843 | -23.6 |
| Singapore | 1 238 198 | 1 369 411 | 10.6 |
| Bangladesh | 1 573 304 | 1 308 343 | -16.8 |
| Other | 6 146 137 | 5 201 898 | -15.4 |
Canadian imports from the Indo-Pacific decreased 5.2% in 2023. Leading the decreases were imports from China (-10.9%), Taiwan (-14.4%), India (-9.8%), Thailand (-6.7%), Malaysia (-16.2%), and Indonesia (‑3.2%). The drop in imports from China was led by consumer goods (-14.8%), electronic and electrical equipment and parts (‑12.0%).
Elsewhere, there was growth in imports from top partners in the Indo-Pacific region such as Japan (+20.9%), South Korea (+4.1%), Vietnam (+3.1%), and Australia (+22.0%). The growth in imports from Japan was led by motor vehicles and parts (+45.9%).
Figure 20: Canadian merchandise imports from top partners in Indo-Pacific region
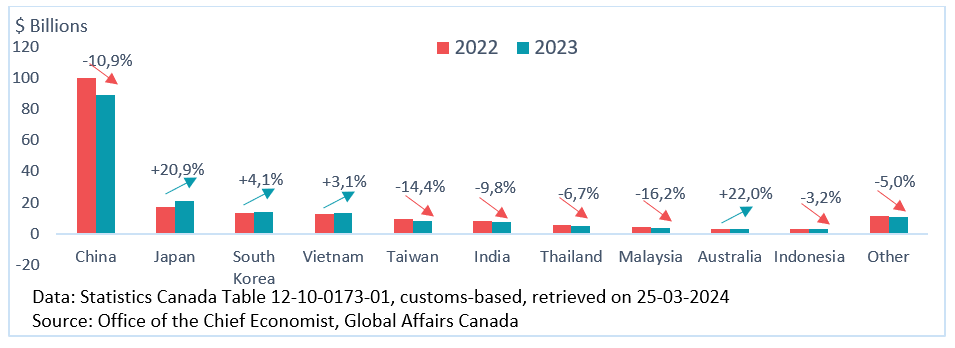
Figure 20 - Text version
| Canadian merchandise imports from top partners in Indo-Pacific region | 2022 import ($ thousand) | 2023 import ($ thousand) | 2023 import (% growth) |
|---|---|---|---|
| China | 100 210 118 | 89 247 370 | -10.9 |
| Japan | 17 102 180 | 20 669 656 | 20.9 |
| South Korea | 13 345 315 | 13 898 923 | 4.1 |
| Vietnam | 12 862 324 | 13 261 340 | 3.1 |
| Taiwan | 9 456 727 | 8 092 399 | -14.4 |
| India | 8 345 728 | 7 527 796 | -9.8 |
| Thailand | 5 206 271 | 4 859 373 | -6.7 |
| Malaysia | 4 156 661 | 3 485 072 | -16.2 |
| Australia | 2 657 712 | 3 241 590 | 22.0 |
| Indonesia | 2 892 396 | 2 800 622 | -3.2 |
| Other | 11 293 923 | 10 725 253 | -5.0 |
The decline in Canadian merchandise imports from the Indo-Pacific regions was led by consumer goods (‑13.6%), electronic and electrical equipment and parts (-6.9%), basic and industrial chemical, plastic and rubber products (-22.1%), metal and non-metallic mineral products (-11.6%), and forestry products and building and packaging materials (-16.3%). Partially offsetting these declines was a large gain in imports of motor vehicles and parts (+38.2%), mainly coming from Japan, China, and South Korea.
Figure 21: Canadian merchandise trade with the Indo-Pacific region (% change, 2023/2022)
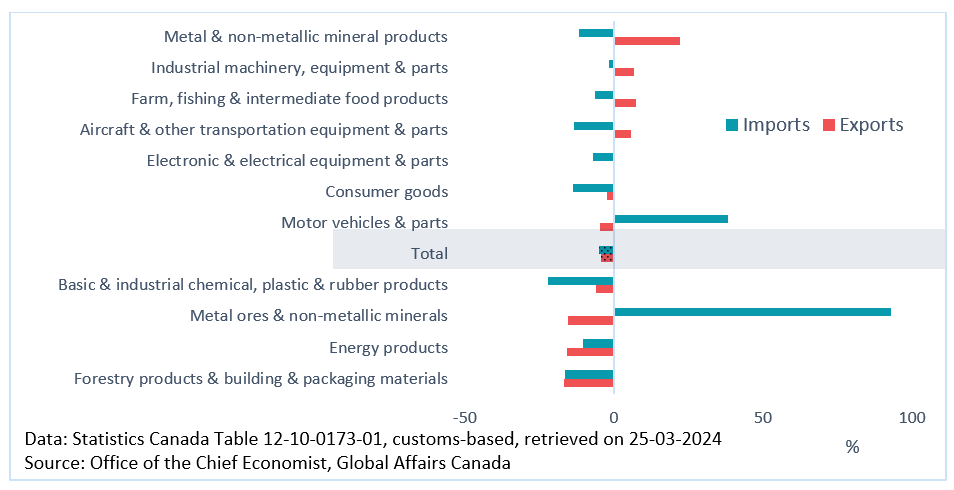
Figure 21 - Text version
| Canadian merchandise trade growth with the Indo-Pacific region (% change. 2023) | Exports | Imports |
|---|---|---|
| Forestry products & building & packaging materials | -16.7 | -16.3 |
| Energy products | -15.9 | -10.3 |
| Metal ores & non-metallic minerals | -15.4 | 92.9 |
| Basic & industrial chemical. plastic & rubber products | -5.9 | -22.1 |
| Total | -4.5 | -5.2 |
| Motor vehicles & parts | -4.5 | 38.2 |
| Consumer goods | -2.2 | -13.6 |
| Electronic & electrical equipment & parts | -0.2 | -6.9 |
| Aircraft & other transportation equipment & parts | 5.6 | -13.4 |
| Farm. fishing & intermediate food products | 7.3 | -6.5 |
| Industrial machinery. equipment & parts | 6.9 | -1.7 |
| Metal & non-metallic mineral products | 22.0 | -11.6 |
Sector diversity: Indo-Pacific
The HHI value shows that sectors for Canadian merchandise exports to the Indo-Pacific are considered diverse. Although in recent years, it has been trending towards being less diverse than overall Canadian exports.
On the other hand, Canadian merchandise imports from the Indo-Pacific can be considered moderately concentrated, with electronic and electrical equipment and parts and consumer goods sectors accounting for a relatively large share of imports.
Figure 22: Herfindahl-Hirschman Index (HHI) for Canada-Indo Pacific merchandise trade diversity by sectors
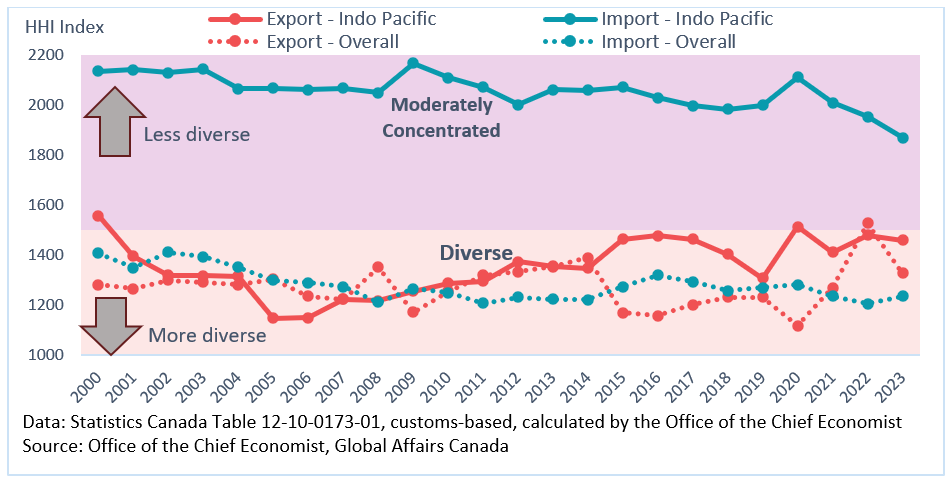
Figure 22 - Text version
| Herfindahl-Hirschman Index (HHI) for Canada-Indo Pacific merchandise trade diversity by sectors | Export - Indo Pacific | Import - Indo Pacific | Export - Overall | Import - Overall |
|---|---|---|---|---|
| 2000 | 1558 | 2136 | 1281 | 1408 |
| 2001 | 1396 | 2143 | 1267 | 1350 |
| 2002 | 1320 | 2130 | 1300 | 1411 |
| 2003 | 1318 | 2144 | 1293 | 1394 |
| 2004 | 1315 | 2066 | 1281 | 1352 |
| 2005 | 1149 | 2069 | 1304 | 1300 |
| 2006 | 1150 | 2063 | 1236 | 1289 |
| 2007 | 1224 | 2068 | 1224 | 1274 |
| 2008 | 1218 | 2049 | 1351 | 1212 |
| 2009 | 1255 | 2167 | 1172 | 1266 |
| 2010 | 1288 | 2110 | 1255 | 1249 |
| 2011 | 1296 | 2073 | 1319 | 1208 |
| 2012 | 1374 | 2002 | 1334 | 1231 |
| 2013 | 1357 | 2062 | 1355 | 1223 |
| 2014 | 1349 | 2059 | 1390 | 1222 |
| 2015 | 1464 | 2072 | 1169 | 1275 |
| 2016 | 1479 | 2030 | 1157 | 1321 |
| 2017 | 1464 | 1997 | 1202 | 1295 |
| 2018 | 1404 | 1983 | 1232 | 1258 |
| 2019 | 1308 | 2000 | 1231 | 1271 |
| 2020 | 1514 | 2112 | 1118 | 1282 |
| 2021 | 1412 | 2009 | 1270 | 1235 |
| 2022 | 1480 | 1954 | 1527 | 1206 |
| 2023 | 1460 | 1870 | 1329 | 1236 |
Special issue: Evolution of Canada’s trade relationship with the Indo‑Pacific region
Canada’s Indo-Pacific Strategy, announced in 2022, offers a comprehensive framework for Government of Canada engagement in the Indo-Pacific region over the next decade. An important strategic objective from this strategy is to expand trade, investment, and supply chain resilience. This section provides a longer-term view of Canada’s trade performance with the Indo-Pacific region.
Canadian merchandise trade with the Indo-Pacific have grown much faster than overall Canadian trade since 2000 and as a result, the Indo-Pacific’s share of Canadian’s exports and imports have increased since 2000.
The Indo-Pacific accounted for 10.8% of Canadian exports in 2023, almost doubling its share from 5.6% in 2000. Its share of Canadian imports has grown even faster (+9.1 percentage points) from 14.5% in 2000 to 23.6% in 2023. However, much of this growth was driven by trade with China. If China was excluded, the Indo‑Pacific’s share of exports and imports would have much smaller growth of 1.8 percentage points and 0.4 percentage points, respectively.
Figure 23: Indo-Pacific’s share of Canadian merchandise trade
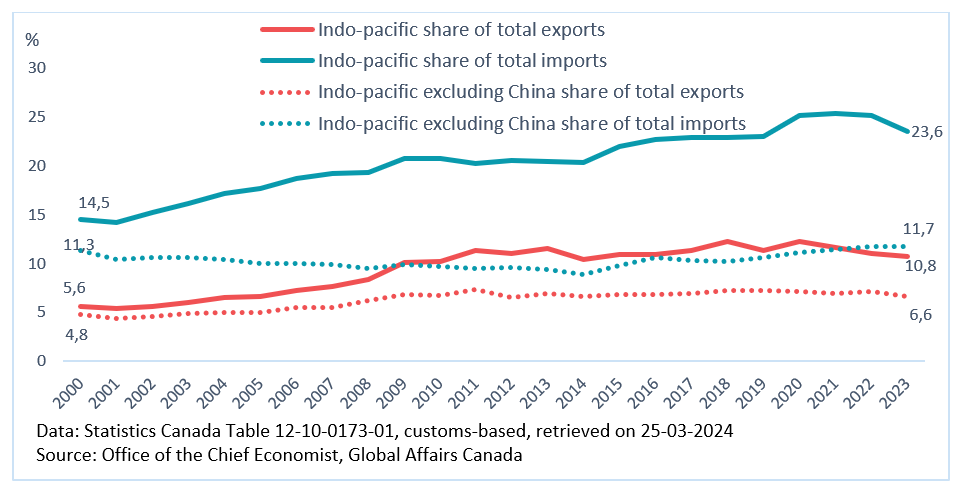
Figure 23 - Text version
| Indo-Pacific’s share of Canadian merchandise trade (%) | Indo-pacific share (%) of total exports | Indo-pacific share (%) of total imports | Indo-pacific excluding China share (%) of total exports | Indo-pacific excluding China share (%) of total imports |
|---|---|---|---|---|
| 2000 | 5.6 | 14.5 | 4.8 | 11.3 |
| 2001 | 5.4 | 14.2 | 4.4 | 10.5 |
| 2002 | 5.6 | 15.2 | 4.6 | 10.6 |
| 2003 | 6.0 | 16.1 | 4.9 | 10.6 |
| 2004 | 6.5 | 17.2 | 4.9 | 10.4 |
| 2005 | 6.6 | 17.7 | 4.9 | 10.0 |
| 2006 | 7.2 | 18.7 | 5.4 | 10.0 |
| 2007 | 7.6 | 19.3 | 5.5 | 9.9 |
| 2008 | 8.4 | 19.3 | 6.2 | 9.5 |
| 2009 | 10.1 | 20.8 | 6.8 | 9.9 |
| 2010 | 10.2 | 20.7 | 6.7 | 9.7 |
| 2011 | 11.3 | 20.2 | 7.4 | 9.4 |
| 2012 | 11.0 | 20.6 | 6.5 | 9.6 |
| 2013 | 11.5 | 20.5 | 7.0 | 9.4 |
| 2014 | 10.4 | 20.3 | 6.6 | 8.9 |
| 2015 | 10.9 | 22.0 | 6.9 | 9.7 |
| 2016 | 10.9 | 22.7 | 6.8 | 10.7 |
| 2017 | 11.3 | 22.9 | 6.9 | 10.3 |
| 2018 | 12.2 | 22.9 | 7.2 | 10.3 |
| 2019 | 11.4 | 23.1 | 7.2 | 10.6 |
| 2020 | 12.3 | 25.2 | 7.2 | 11.1 |
| 2021 | 11.7 | 25.4 | 6.9 | 11.4 |
| 2022 | 11.0 | 25.2 | 7.2 | 11.7 |
| 2023 | 10.8 | 23.6 | 6.6 | 11.7 |
Since 2000, Canadian exports to the Indo-Pacific have more than tripled to reach $76.5 billion. A large part of the growth coming from exports to China, which have grown by $26.5 billion or over 9 times its 2000 value.
There was also extraordinary growth in exports to India (+$4.4 billion or 802%) and Bangladesh (+$1.2 billion or 920%). On the other hand, exports growth to top partners such as Japan (+$6.4 billion or 70%) and Taiwan (+$0.7 billion or 64%) were slower than overall export growth, and as a result, these countries’ share of Canadian merchandise exports have declined.
Table 1: Canadian merchandise export with top partners in the Indo-Pacific
| Export partner | 2023 Export value ($ billion) | Growth from 2000 ($ billion) | Growth from 2000 (%) |
|---|---|---|---|
| Total Indo-Pacific | 76.5 | 54.9 | 254.0 |
| China | 29.8 | 26.5 | 803.5 |
| Japan | 15.5 | 6.4 | 69.6 |
| South Korea | 6.8 | 4.5 | 195.7 |
| India | 5.0 | 4.4 | 802.3 |
| Hong Kong | 4.5 | 3.2 | 244.7 |
| Australia | 2.8 | 1.7 | 147.1 |
| Indonesia | 2.3 | 1.6 | 240.9 |
| Taiwan | 1.9 | 0.7 | 64.0 |
| Singapore | 1.4 | 1.0 | 310.0 |
| Bangladesh | 1.3 | 1.2 | 920.2 |
| Other | 5.2 | 3.6 | 234.0 |
Data: Statistics Canada Table 12-10-0173-01, customs-based, retrieved on 25-03-2024
Source: Office of the Chief Economist, Global Affairs Canada
Canadian exports growth to this region has been driven by resource-based sectors as the fast industrial growth in this region have led to surging demand for natural resources over the past 2 decades. Likewise, the growth in income and population in this region have also led to demand for Canadian agricultural and food products. The growth in Canadian merchandise exports to the Indo-Pacific region since 2000 was led by farm, fishing and intermediate food products (+$14.9 billion or 417%), energy products (+11.7 billion or 1,006%), metal ores and non-metallic minerals (+$10.8 billion or 511%), and metal and non-metallic mineral products (+$6.0 billion or 455%).
The growth in Canada’s exports of farm, fishing and intermediate food products to the region have been led by exports to China, but there is also notable growth to Japan and Indonesia. The growth in exports of Canada’s energy products have been led by exports to Japan, China, South Korea and India.
On the other hand, growth in exports of some sectors to the Indo-Pacific have been subdued such as motor vehicles and parts (+$0.3 billion or 71.4%), forestry products and building and packaging materials (+$0.4 billion or 6.1%) and aircraft and other transportation equipment and parts (+$0.7 billion or 154%). The forestry products and building and packaging materials sector was Canada’s top exports to the region in the early 2000s, but subdued growth has led this sector to lose its stop spot.
Figure 24: Canada’s merchandise exports to the Indo-Pacific, selected sectors
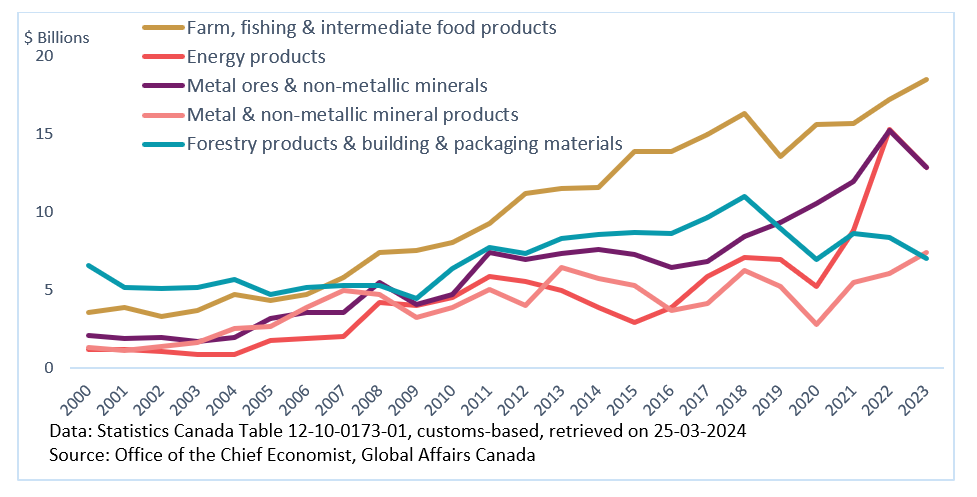
Figure 24 - Text version
| Canada’s merchandise exports to the Indo-Pacific, selected sectors ($ thousand) | Farm, fishing & intermediate food products | Energy products | Metal ores & non-metallic minerals | Metal & non-metallic mineral products | Forestry products & building & packaging materials |
|---|---|---|---|---|---|
| 2000 | 3 576 439 | 1 161 039 | 2 105 938 | 1 329 567 | 6 586 065 |
| 2001 | 3 888 716 | 1 172 208 | 1 852 436 | 1 126 461 | 5 180 835 |
| 2002 | 3 309 542 | 1 079 507 | 1 938 229 | 1 347 871 | 5 099 049 |
| 2003 | 3 650 639 | 842 848 | 1 659 712 | 1 642 947 | 5 179 048 |
| 2004 | 4 736 918 | 842 527 | 1 957 712 | 2 536 451 | 5 655 515 |
| 2005 | 4 336 058 | 1 722 383 | 3 146 404 | 2 674 847 | 4 700 339 |
| 2006 | 4 674 754 | 1 859 642 | 3 580 329 | 3 893 277 | 5 127 965 |
| 2007 | 5 801 372 | 1 997 605 | 3 555 076 | 4 984 981 | 5 278 643 |
| 2008 | 7 378 825 | 4 186 880 | 5 460 397 | 4 682 289 | 5 254 668 |
| 2009 | 7 509 145 | 4 007 576 | 4 094 353 | 3 219 887 | 4 453 350 |
| 2010 | 8 032 147 | 4 525 945 | 4 673 860 | 3 876 883 | 6 395 884 |
| 2011 | 9 286 463 | 5 863 956 | 7 390 734 | 5 025 485 | 7 690 671 |
| 2012 | 11 159 098 | 5 524 927 | 6 947 428 | 3 985 048 | 7 304 769 |
| 2013 | 11 497 986 | 4 990 873 | 7 367 787 | 6 434 784 | 8 290 749 |
| 2014 | 11 602 602 | 3 875 756 | 7 575 479 | 5 712 413 | 8 564 042 |
| 2015 | 13 899 380 | 2 934 976 | 7 280 272 | 5 255 645 | 8 695 542 |
| 2016 | 13 855 581 | 3 878 914 | 6 445 826 | 3 654 920 | 8 625 920 |
| 2017 | 14 997 671 | 5 852 085 | 6 842 938 | 4 146 205 | 9 634 986 |
| 2018 | 16 292 691 | 7 057 580 | 8 441 686 | 6 232 849 | 11 019 940 |
| 2019 | 13 560 724 | 6 921 294 | 9 342 625 | 5 219 090 | 8 922 625 |
| 2020 | 15 645 176 | 5 248 337 | 10 550 256 | 2 751 878 | 6 953 007 |
| 2021 | 15 676 397 | 8 805 494 | 11 974 228 | 5 446 206 | 8 590 129 |
| 2022 | 17 219 987 | 15 260 782 | 15 213 427 | 6 048 754 | 8 387 159 |
| 2023 | 18 472 499 | 12 836 589 | 12 876 208 | 7 379 459 | 6 990 449 |
Similar to exports, the growth in merchandise imports from the Indo-Pacific more than tripled to reach $177.8 billion in 2023. This was in large part due to growth in imports from China (+$78.0 billion or 690%) since 2000.
Among other top partners, there was also explosive growth in imports from Vietnam since 2000, as imports have increased by $13.1 billion or around 62 times its value. Elsewhere, imports growth from top partners such as Japan (+$4.1 billion or 24.4%), Taiwan (+$3.1 billion or 62.6%), Malaysia (+$1.0 billion or 39.3%) and Australia (+$1.7 billion or 109%) were slower than overall imports growth.
Table 2: Canadian merchandise imports from top partners in the Indo-Pacific
| Import Partner | 2023 Import Value ($ billion) | Growth from 2000 ($ billion) | Growth from 2000 (%) |
|---|---|---|---|
| Total Indo-Pacific | 177.8 | 126.0 | 243.5 |
| China | 89.2 | 78.0 | 690.2 |
| Japan | 20.7 | 4.1 | 24.4 |
| South Korea | 13.9 | 8.6 | 163.1 |
| Vietnam | 13.3 | 13.1 | 6181.0 |
| Taiwan | 8.1 | 3.1 | 62.6 |
| India | 7.5 | 6.3 | 511.1 |
| Thailand | 4.9 | 3.2 | 190.7 |
| Malaysia | 3.5 | 1.0 | 39.3 |
| Australia | 3.2 | 1.7 | 109.3 |
| Indonesia | 2.8 | 1.9 | 213.4 |
| Other | 10.7 | 5.2 | 93.7 |
Data: Statistics Canada Table 12-10-0173-01, customs-based, retrieved on 25-03-2024
Source: Office of the Chief Economist, Global Affairs Canada
Canadian merchandise imports growth from the Indo-Pacific region since 2000 have been led by consumer goods (+$36.4 billion or 270%), electronic and electrical equipment and parts (+$26.5 billion or 155%), motor vehicles and parts (+$18.6 billion or 269%), and industrial machinery, equipment and parts (+$17.8 billion or 304%).
Growth in imports of consumer goods and electronic and electrical equipment and parts have mainly come from China, but there was also notable growth from Vietnam. Growth in imports of motor vehicles and parts have come from mainly China, South Korea and Japan. Similarly, China have led the growth in imports of industrial machinery, equipment and parts.
On the other hand, growth in imports of some resource-based sectors have been subdued, including metal ores and non-metallic minerals (+$0.4 billion or 56%) and energy products (+$0.6 billion or 173%).
Figure 25: Canada’s merchandise imports from the Indo-Pacific, selected sectors
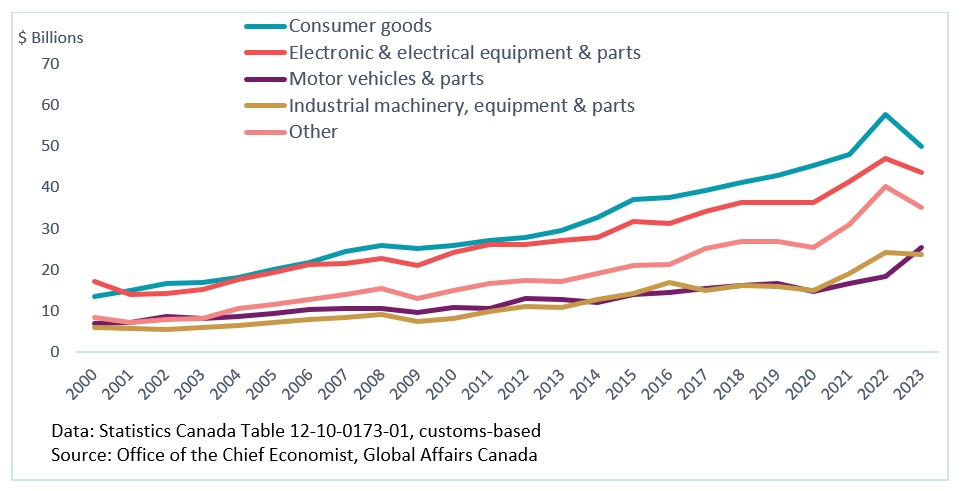
Figure 25 - Text version
| Canada’s merchandise imports from the Indo-Pacific, by selected sectors ($ thousand) | Consumer goods | Electronic & electrical equipment & parts | Motor vehicles & parts | Industrial machinery, equipment & parts | Other |
|---|---|---|---|---|---|
| 2000 | 13 487 295 | 17 160 699 | 6 910 730 | 5 859 885 | 8 343 876 |
| 2001 | 14 890 894 | 13 938 554 | 7 069 716 | 5 577 474 | 7 142 976 |
| 2002 | 16 672 879 | 14 285 147 | 8 624 840 | 5 502 320 | 7 965 515 |
| 2003 | 16 989 093 | 15 062 485 | 8 073 957 | 5 905 651 | 8 123 871 |
| 2004 | 18 189 880 | 17 545 593 | 8 495 921 | 6 398 637 | 10 590 702 |
| 2005 | 19 925 189 | 19 417 990 | 9 371 949 | 7 219 352 | 11 538 218 |
| 2006 | 21 767 312 | 21 280 141 | 10 349 651 | 7 983 620 | 12 769 315 |
| 2007 | 24 330 267 | 21 380 438 | 10 560 888 | 8 344 767 | 13 835 294 |
| 2008 | 25 963 315 | 22 767 691 | 10 519 620 | 9 075 695 | 15 466 305 |
| 2009 | 25 077 953 | 21 017 024 | 9 639 678 | 7 324 208 | 12 921 801 |
| 2010 | 25 816 853 | 24 098 356 | 10 837 539 | 8 110 304 | 14 812 331 |
| 2011 | 27 172 393 | 26 184 290 | 10 496 958 | 9 870 826 | 16 645 123 |
| 2012 | 27 821 753 | 26 119 280 | 12 897 582 | 10 969 094 | 17 272 058 |
| 2013 | 29 622 306 | 27 095 478 | 12 834 856 | 10 752 521 | 17 120 471 |
| 2014 | 32 711 777 | 27 739 474 | 12 090 814 | 12 643 571 | 18 943 105 |
| 2015 | 37 081 088 | 31 701 708 | 13 897 985 | 14 301 595 | 20 950 305 |
| 2016 | 37 507 070 | 31 316 665 | 14 488 053 | 16 752 293 | 21 132 698 |
| 2017 | 39 276 434 | 34 233 642 | 15 340 248 | 14 874 451 | 25 148 280 |
| 2018 | 41 229 022 | 36 433 967 | 16 130 069 | 16 085 575 | 26 787 775 |
| 2019 | 43 003 434 | 36 339 858 | 16 575 403 | 15 976 187 | 26 909 941 |
| 2020 | 45 423 119 | 36 256 961 | 14 762 981 | 14 996 705 | 25 462 658 |
| 2021 | 48 128 007 | 41 391 176 | 16 696 671 | 19 119 106 | 31 042 593 |
| 2022 | 57 793 501 | 46 945 164 | 18 444 373 | 24 097 383 | 40 248 936 |
| 2023 | 49 935 946 | 43 683 651 | 25 489 432 | 23 684 818 | 35 015 547 |
Africa & the Middle East
The Middle East and North Africa
The value of Canadian merchandise exports to the Middle East and North Africa was essentially unchanged in 2023. There were gains in exports to top partners in the region such as Saudi Arabia (+51.5%), United Arabs Emirates (+9.2%), Algeria (+7.5%), Morocco (+3.3%), Iran (+25.0%), Iraq (+98.3%) and Bahrain (+18.8%).
The notable growth in exports to Saudi Arabia was support mainly by aircraft and other transportation equipment and parts (+68.6%). These gains were offset by declines in exports to other locations including to top partners such as Israel (-19.7%), Egypt (-20.6%), and Qatar (-13.3%).
Figure 26: Canadian merchandise exports to top partners in the Middle East and North Africa
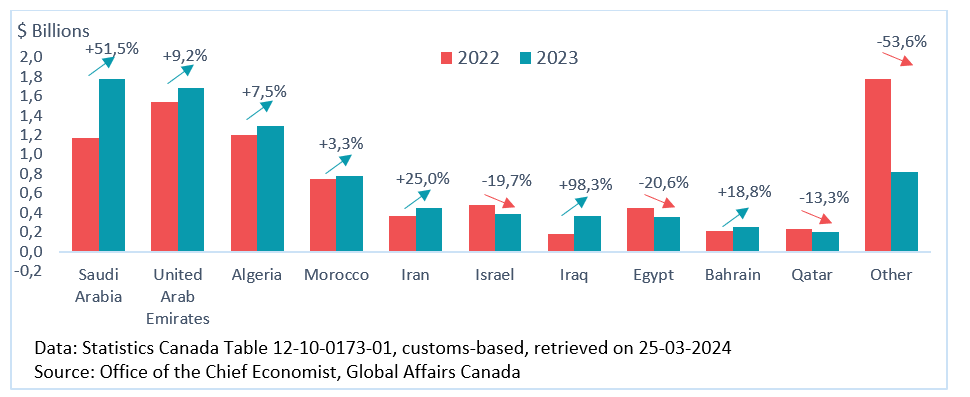
Figure 26 - Text version
| Canadian merchandise exports to top partners in the Middle East and North Africa | 2022 export ($ thousand) | 2023 export ($ thousand) | 2023 export (% growth) |
|---|---|---|---|
| Saudi Arabia | 1 171 853 | 1 774 834 | 51.5 |
| United Arab Emirates | 1 542 759 | 1 684 208 | 9.2 |
| Algeria | 1 199 566 | 1 289 991 | 7.5 |
| Morocco | 751 667 | 776 721 | 3.3 |
| Iran | 362 523 | 453 180 | 25.0 |
| Israel | 479 397 | 385 083 | -19.7 |
| Iraq | 182 895 | 362 668 | 98.3 |
| Egypt | 446 254 | 354 153 | -20.6 |
| Bahrain | 213 688 | 253 905 | 18.8 |
| Qatar | 236 507 | 204 935 | -13.3 |
| Other | 1 776 941 | 824 210 | -53.6 |
There was notable growth in farm, fishing and intermediate food products (+18.9%), electronic and electrical equipment and parts (+30.1%), industrial machinery, equipment and parts (+20.2%), and motor vehicles and parts (+31.0%) being offset by notable declines in exports of aircraft and other transportation equipment and parts (-22.3%), metal ores and non-metallic minerals (-36.5%), and consumer goods (-15.6%).
Canadian merchandise imports from the Middle East and North Africa declined 21.5% in 2023, with a large decrease in imports from Saudi Arabia (-43.2%) leading the way. The decline in imports from Saudi Arabia was almost entirely due to imports of energy products (-42.9%).
Imports from some other top partners in the region also witnessed declines in 2023, such as Israel (-6.4%), Egypt (-35.9%), Algeria (-20.8%), and Qatar (-10.9%). Despite these declines, there were growth in imports from some top partners, such as the United Arab Emirates (+8.3%), Morocco (+14.8%), Kuwait (+5.6%), Tunisia (+8.2%), and Jordan (+20.4%).
Figure 27: Canadian merchandise imports from top partners in the Middle East and North Africa
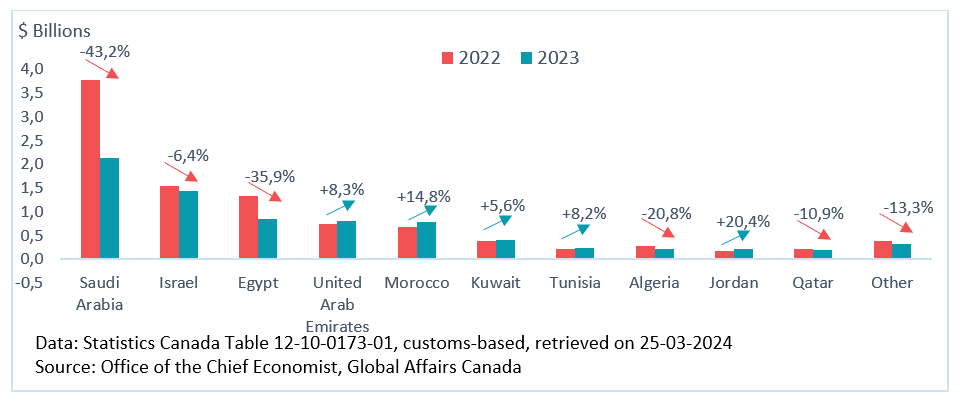
Figure 27 - Text version
| Canadian merchandise imports from top partners in the Middle East and North Africa | 2022 import ($ thousand) | 2023 import ($ thousand) | 2023 import (% growth) |
|---|---|---|---|
| Saudi Arabia | 3 769 714 | 2 141 983 | -43.2 |
| Israel | 1 544 864 | 1 445 421 | -6.4 |
| Egypt | 1 334 550 | 856 114 | -35.9 |
| United Arab Emirates | 746 804 | 808 450 | 8.3 |
| Morocco | 679 537 | 779 859 | 14.8 |
| Kuwait | 395 047 | 417 196 | 5.6 |
| Tunisia | 222 841 | 241 108 | 8.2 |
| Algeria | 286 483 | 226 784 | -20.8 |
| Jordan | 174 865 | 210 493 | 20.4 |
| Qatar | 224 098 | 199 646 | -10.9 |
| Other | 383 801 | 332 661 | -13.3 |
The decline in Canadian merchandise imports from the Middle East and North Africa was mainly driven by resource-based sectors, with notable decreases in imports of energy products (-36.7%), and metal ores and non-metallic minerals (-44.3%). These declines were largely driven by commodity prices which were lower in 2023. Growth in imports of some other sectors were too marginal to significantly offset these declines.
Figure 28: Canadian merchandise trade with the Middle East and North Africa (% change, 2023/2022)
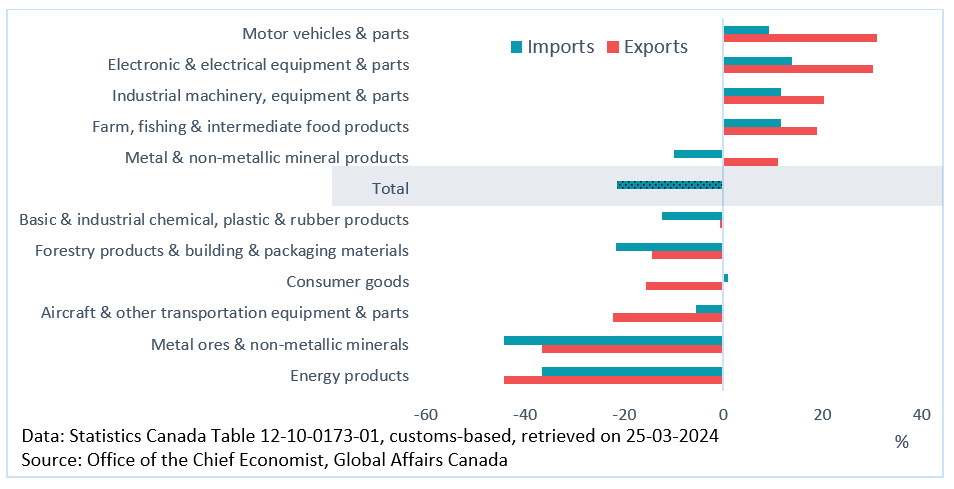
Figure 28 - Text version
| Canadian merchandise trade growth with the Middle East and North Africa (% change. 2023) | Exports | Imports |
|---|---|---|
| Energy products | -44.2 | -36.7 |
| Metal ores & non-metallic minerals | -36.5 | -44.3 |
| Aircraft & other transportation equipment & parts | -22.3 | -5.5 |
| Consumer goods | -15.6 | 0.9 |
| Forestry products & building & packaging materials | -14.5 | -21.6 |
| Basic & industrial chemical. plastic & rubber products | -0.8 | -12.4 |
| Total | 0.0 | -21.5 |
| Metal & non-metallic mineral products | 10.9 | -10.1 |
| Farm. fishing & intermediate food products | 18.9 | 11.6 |
| Industrial machinery. equipment & parts | 20.2 | 11.7 |
| Electronic & electrical equipment & parts | 30.1 | 13.8 |
| Motor vehicles & parts | 31.0 | 9.3 |
Canadian merchandise exports to the Middle East and North Africa are considered moderately concentrated with a relatively high share of farm, fishing and intermediate food products.
On the imports side, sectors were highly concentrated due to energy products’ large share of imports. In recent years, energy products’ share of imports has decreased, which has lowered sector concentrations to more moderate levels.
Figure 29: Herfindahl-Hirschman Index (HHI) for Canada-Middle East and North Africa merchandise trade diversity by sectors
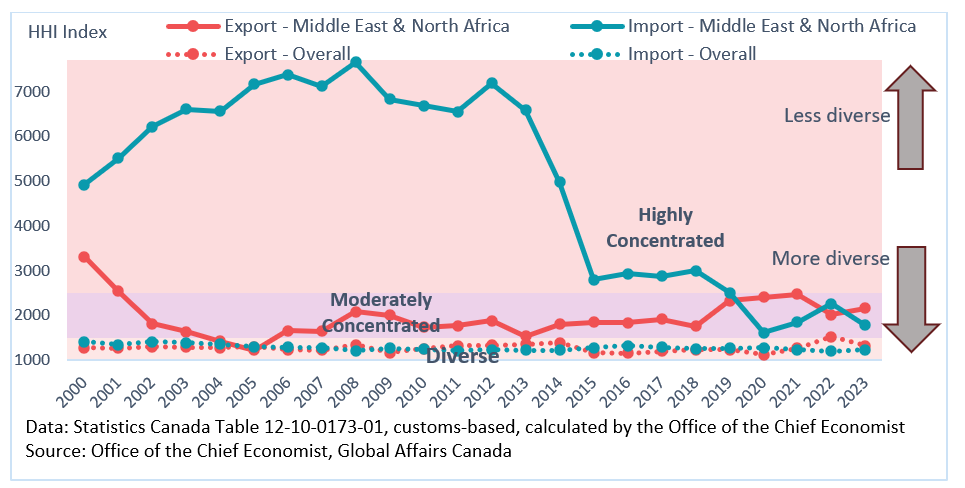
Figure 29 - Text version
| Herfindahl-Hirschman Index (HHI) for Canada-Middle East and North Africa merchandise trade diversity by sectors | Export - Middle East & North Africa | Import - Middle East & North Africa | Export - Overall | Import - Overall |
|---|---|---|---|---|
| 2000 | 3313 | 4914 | 1281 | 1408 |
| 2001 | 2544 | 5506 | 1267 | 1350 |
| 2002 | 1811 | 6217 | 1300 | 1411 |
| 2003 | 1635 | 6609 | 1293 | 1394 |
| 2004 | 1420 | 6557 | 1281 | 1352 |
| 2005 | 1220 | 7165 | 1304 | 1300 |
| 2006 | 1653 | 7372 | 1236 | 1289 |
| 2007 | 1644 | 7120 | 1224 | 1274 |
| 2008 | 2088 | 7650 | 1351 | 1212 |
| 2009 | 2010 | 6831 | 1172 | 1266 |
| 2010 | 1733 | 6685 | 1255 | 1249 |
| 2011 | 1771 | 6550 | 1319 | 1208 |
| 2012 | 1886 | 7191 | 1334 | 1231 |
| 2013 | 1540 | 6588 | 1355 | 1223 |
| 2014 | 1807 | 4980 | 1390 | 1222 |
| 2015 | 1850 | 2799 | 1169 | 1275 |
| 2016 | 1837 | 2930 | 1157 | 1321 |
| 2017 | 1917 | 2879 | 1202 | 1295 |
| 2018 | 1755 | 3000 | 1232 | 1258 |
| 2019 | 2331 | 2510 | 1231 | 1271 |
| 2020 | 2407 | 1619 | 1118 | 1282 |
| 2021 | 2471 | 1851 | 1270 | 1235 |
| 2022 | 2021 | 2264 | 1527 | 1206 |
| 2023 | 2161 | 1777 | 1329 | 1236 |
Sub-Saharan Africa
Canadian merchandise exports to Sub-Saharan Africa grew 3.7% in 2023, with growth in exports to top partners in the region such as Nigeria (+2.0%), South Africa (+0.9%), Côte d'Ivoire (+35.6%), and Mozambique (+77.3%). The growth in exports to Nigeria was led by farm, fishing and intermediate food products (+46.8%) but a large decline in exports of metal ores and non-metallic minerals (-86.6%) partially offset the growth.
Farm, fishing and intermediate food products was also the main reason for the strong growth in exports to Mozambique over the past two years, making Mozambique one of the top destinations for Canadian exports in Sub-Saharan Africa.
Partially offsetting this growth was declines in exports to top destination such as Botswana (-14.5%), Ghana (‑6.0%), and Kenya (-11.6%). The drop in exports to Botswana was mainly due to lower exports of metal ores and non-metallic minerals as the prices of many commodities fell in 2023.
Figure 30: Canadian merchandise exports to top partners in Sub-Saharan Africa
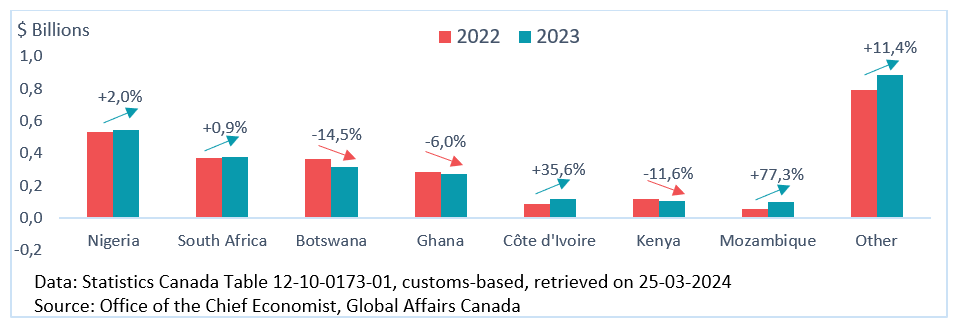
Figure 30 - Text version
| Canadian merchandise exports to top partners in Sub-Saharan Africa | 2022 export ($ thousand) | 2023 export ($ thousand) | 2023 export (% growth) |
|---|---|---|---|
| Nigeria | 534 067 | 544 766 | 2.0 |
| South Africa | 370 797 | 374 240 | 0.9 |
| Botswana | 366 171 | 313 005 | -14.5 |
| Ghana | 286 876 | 269 636 | -6.0 |
| Côte d'Ivoire | 86 324 | 117 047 | 35.6 |
| Kenya | 115 979 | 102 472 | -11.6 |
| Mozambique | 56 968 | 100 978 | 77.3 |
| Other | 793 413 | 884 175 | 11.4 |
The growth in Canadian merchandise exports to Sub-Saharan Africa in 2023 was led mainly by farm, fishing and intermediate food products (+42.4%). Partially offsetting this growth were declines in some sectors, led by metal ores and non-metallic minerals (-31.0%) and aircraft and other transportation equipment and parts (‑51.7%).
Canadian merchandise imports from Sub-Saharan Africa grew 18.3% in 2023, with growth coming from most top partners in the region such as Nigeria (+75.6%), South Africa (+21.5%), Mauritania (+3.9%), Côte d'Ivoire (+16.7%), Madagascar (+2.5%), Democratic Republic of the Congo (+73.4%), and Namibia (+11.3%). The large growth in imports from Nigeria was led by energy products (+78.2%) and the growth from South Africa was led by metal and non-metallic mineral products (+48.2%). Among the top partners in Sub-Saharan Africa, only imports from Zambia declined in 2023, due almost entirely to lowered imports of metal and non-metallic mineral products (-55.6%).
Figure 31: Canadian merchandise imports from top partners in Sub-Saharan Africa
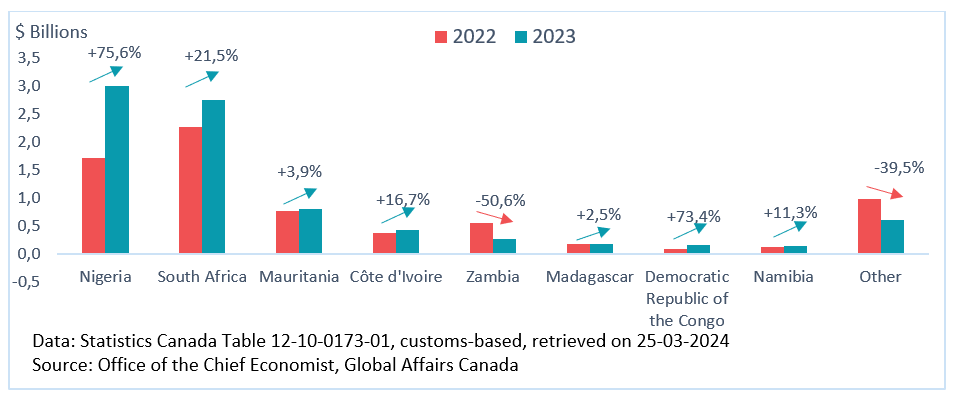
Figure 31 - Text version
| Canadian merchandise imports from top partners in Sub-Saharan Africa | 2022 import ($ thousand) | 2023 import ($ thousand) | 2023 import (% growth) |
|---|---|---|---|
| Nigeria | 1 712 125 | 3 006 222 | 75.6 |
| South Africa | 2 266 189 | 2 753 121 | 21.5 |
| Mauritania | 766 560 | 796 220 | 3.9 |
| Côte d'Ivoire | 364 831 | 425 677 | 16.7 |
| Zambia | 549 628 | 271 715 | -50.6 |
| Madagascar | 170 735 | 175 033 | 2.5 |
| Democratic Republic of the Congo | 96 389 | 167 174 | 73.4 |
| Namibia | 132 008 | 146 926 | 11.3 |
| Other | 989 667 | 598 343 | -39.5 |
Import growth was led by energy products (+61.5%) and metal and non‑metallic mineral products (+19.5%), with the growth in imports of energy products mainly coming from Nigeria.
Figure 32: Canadian merchandise trade with Sub-Saharan Africa (% change, 2023/2022)
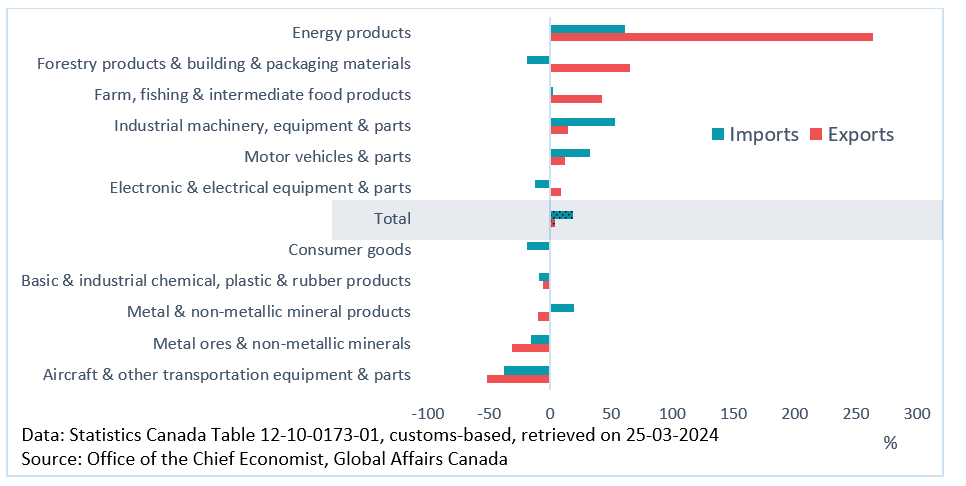
Figure 32 - Text version
| Canadian merchandise trade growth with Sub-Saharan Africa (% change. 2023) | Exports | Imports |
|---|---|---|
| Aircraft & other transportation equipment & parts | -51.7 | -37.5 |
| Metal ores & non-metallic minerals | -31.0 | -15.4 |
| Metal & non-metallic mineral products | -9.7 | 19.5 |
| Basic & industrial chemical. plastic & rubber products | -5.7 | -9.2 |
| Consumer goods | -0.8 | -18.8 |
| Total | 3.7 | 18.3 |
| Electronic & electrical equipment & parts | 8.7 | -12.0 |
| Motor vehicles & parts | 12.5 | 32.4 |
| Industrial machinery. equipment & parts | 14.5 | 53.3 |
| Farm. fishing & intermediate food products | 42.4 | 2.5 |
| Forestry products & building & packaging materials | 65.4 | -18.6 |
| Energy products | 264.0 | 61.5 |
Canadian merchandise exports to Sub-Saharan Africa are moderately concentrated, due to the relatively high share of farm, fishing, and intermediate food products.
Sectoral imports were highly concentrated between 2005 and 2016, due to the prominence of energy products. However, in recent years, imports from Sub-Saharan Africa have become moderately less concentrated as the importance of energy products have declined relative to other imports.
Figure 33: Herfindahl-Hirschman Index (HHI) for Canada-Sub-Saharan Africa merchandise trade diversity by sectors
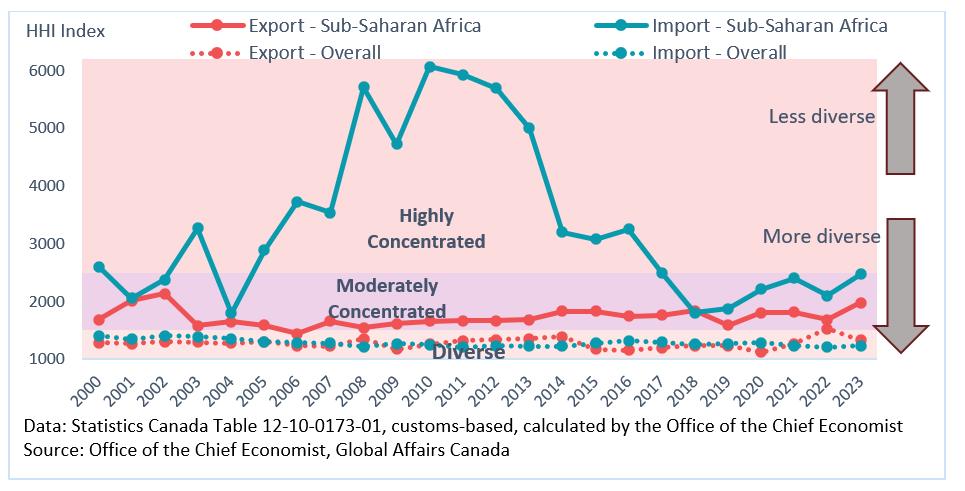
Figure 33 - Text version
| Herfindahl-Hirschman Index (HHI) for Canada-Sub-Saharan Africa merchandise trade diversity by sectors | Export - Sub-Saharan Africa | Import - Sub-Saharan Africa | Export - Overall | Import - Overall |
|---|---|---|---|---|
| 2000 | 1687 | 2607 | 1281 | 1408 |
| 2001 | 2018 | 2059 | 1267 | 1350 |
| 2002 | 2132 | 2382 | 1300 | 1411 |
| 2003 | 1580 | 3274 | 1293 | 1394 |
| 2004 | 1652 | 1800 | 1281 | 1352 |
| 2005 | 1589 | 2887 | 1304 | 1300 |
| 2006 | 1440 | 3730 | 1236 | 1289 |
| 2007 | 1655 | 3541 | 1224 | 1274 |
| 2008 | 1542 | 5714 | 1351 | 1212 |
| 2009 | 1615 | 4725 | 1172 | 1266 |
| 2010 | 1662 | 6073 | 1255 | 1249 |
| 2011 | 1664 | 5935 | 1319 | 1208 |
| 2012 | 1664 | 5695 | 1334 | 1231 |
| 2013 | 1689 | 5005 | 1355 | 1223 |
| 2014 | 1835 | 3197 | 1390 | 1222 |
| 2015 | 1833 | 3080 | 1169 | 1275 |
| 2016 | 1745 | 3254 | 1157 | 1321 |
| 2017 | 1763 | 2498 | 1202 | 1295 |
| 2018 | 1843 | 1802 | 1232 | 1258 |
| 2019 | 1585 | 1877 | 1231 | 1271 |
| 2020 | 1807 | 2209 | 1118 | 1282 |
| 2021 | 1815 | 2404 | 1270 | 1235 |
| 2022 | 1688 | 2099 | 1527 | 1206 |
| 2023 | 1979 | 2471 | 1329 | 1236 |
Appendix
Table 3: Canadian merchandise exports and imports by regions and selected top trade partners
| Export Partner | Export Value ($ billions, 2023) | Growth in export value (%) | Import Partner | Import Value ($ billions, 2023) | Growth in import value (%) |
|---|---|---|---|---|---|
| Total | 711.5 | -2.2 | Total | 754.6 | 1.4 |
| United States | 548.8 | -1.2 | United States | 374.1 | 2.1 |
| Latin America and the Caribbean | 20.6 | -0.2 | Latin America and the Caribbean | 70.9 | 8.4 |
| Mexico | 8.3 | -5.1 | Mexico | 46.1 | 11.4 |
| Brazil | 3.9 | 1.2 | Brazil | 9.2 | 8.0 |
| Europe & Central Asia | 54.4 | -9.1 | Europe & Central Asia | 109.7 | 6.3 |
| United Kingdom | 13.5 | -25.0 | Germany | 25.0 | 11.2 |
| Netherlands | 6.9 | 14.6 | Italy | 12.9 | 6.3 |
| Germany | 6.2 | -9.1 | United Kingdom | 9.4 | 8.8 |
| Switzerland | 4.7 | 31.3 | France | 8.6 | 10.7 |
| Belgium | 3.9 | -16.9 | Switzerland | 8.5 | 14.0 |
| Indo-Pacific | 76.5 | -4.5 | Indo-Pacific | 177.8 | -5.2 |
| China | 29.8 | 6.3 | China | 89.2 | -10.9 |
| Japan | 15.5 | -12.4 | Japan | 20.7 | 20.9 |
| South Korea | 6.8 | -19.9 | South Korea | 13.9 | 4.1 |
| India | 5.0 | -4.7 | Vietnam | 13.3 | 3.1 |
| Hong Kong | 4.5 | 44.8 | Taiwan | 8.1 | -14.4 |
| The Middle East and North Africa | 8.4 | 0.0 | The Middle East and North Africa | 7.7 | -21.5 |
| Saudi Arabia | 1.8 | 51.5 | Saudi Arabia | 2.1 | -43.2 |
| United Arab Emirates | 1.7 | 9.2 | Israel | 1.4 | -6.4 |
| Sub-Saharan Africa | 2.7 | 3.7 | Sub-Saharan Africa | 8.3 | 18.3 |
| Nigeria | 0.5 | 2.0 | Nigeria | 3.0 | 75.6 |
| South Africa | 0.4 | 0.9 | South Africa | 2.8 | 21.5 |
Data: Statistics Canada Table 12-10-0173-01, customs-based, retrieved on 25-03-2024
Source: Office of the Chief Economist, Global Affairs Canada
Table 4: Canadian merchandise exports and imports by sectors
| Sector | Export Value ($ billions, 2023) | Growth in export value (%) | Import Value ($ billions, 2023) | Growth in import value (%) |
|---|---|---|---|---|
| All sectors | 711.5 | -2.2 | 754.6 | 1.4 |
| Resource sectors | 449.4 | -10.3 | 243.7 | -6.2 |
| Farm, fishing and intermediate food products | 60.5 | 6.5 | 28.5 | 0.6 |
| Energy products | 188.1 | -17.9 | 43.7 | -11.7 |
| Metal ores and non-metallic minerals | 30.6 | -15.2 | 18.9 | -2.1 |
| Metal and non-metallic mineral products | 82.1 | 3.1 | 59.0 | -2.8 |
| Basic and industrial chemical, plastic and rubber products | 41.3 | -5.3 | 60.0 | -10.1 |
| Forestry products and building and packaging materials | 46.8 | -16.6 | 33.6 | -4.9 |
| Non-resource sectors | 256.0 | 15.9 | 494.3 | 5.4 |
| Industrial machinery, equipment and parts | 41.2 | 13.0 | 90.2 | 8.5 |
| Electronic and electrical equipment and parts | 24.5 | 9.8 | 86.4 | 0.3 |
| Motor vehicles and parts | 87.2 | 31.0 | 142.0 | 17.1 |
| Aircraft and other transportation equipment and parts | 24.9 | 28.2 | 26.3 | 10.8 |
| Consumer goods | 78.2 | 2.6 | 149.5 | -3.3 |
Data: Statistics Canada Table 12-10-0173-01, customs-based, retrieved on 25-03-2024
Source: Office of the Chief Economist, Global Affairs Canada
- Date modified: