
Growing Canada's exports to overseas markets by 50% – 2021 Update
Key summary
- In the Fall 2018 Economic Statement, the Government of Canada set a target of increasing by 50% Canada's overseas exports by 2025, but global economic and trade conditions have changed significantly since the target was set.
- Canadian exports experienced a significant decline in 2020 but bounced back with strong growth in 2021. Canada made up some of the losses incurred during the pandemic but stronger growth in the coming years will be needed to achieve the target by 2025.
- While there was a general recovery in overseas exports in 2021, the recovery was uneven. High commodity prices boosted Canadian exports of energy and metal ores and non-metallic minerals, but a severe drought constrained export growth in agriculture products. Canadian services exports remained depressed as border restrictions were still having a large negative impact on travel and transportation services exports.
- Canadian exports to overseas markets are forecasted to reach the 50% export growth target in 2026—one year later then the initial 2025 target. This one-year delay can be attributed to the effects of the pandemic.
- There are both downside and upside risks to this forecast:
- Downside risks:
- Russia's attack on Ukraine could have further negative impacts on the economies in the European Union and UK.
- New COVID variants or further stringent lockdowns in China could supress demand for Canadian exports.
- Upside risks:
- Rising commodity prices could further boost Canadian exports.
- Further vaccinations and therapeutics, and reductions in border restrictions provide upside potential for travel services exports.
Background
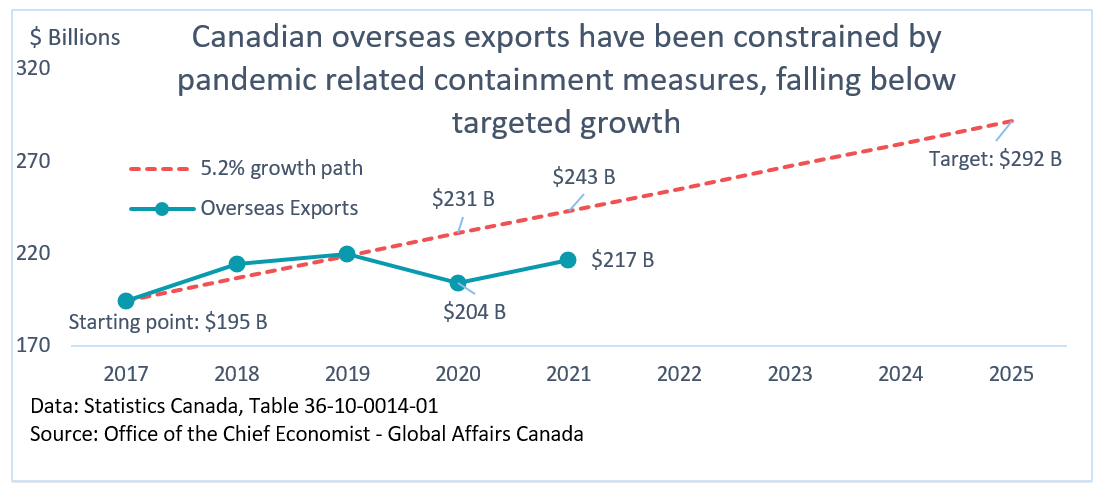
The Fall 2018 Economic StatementFootnote 1 set a target of increasing by 50% Canada's overseas exports by 2025. In 2017, the last full year of available data at the release of the Fall Economic Statement 2018, Canada exported $195 billion of goods and services to overseas markets. A 50% increase implies that Canadian exports to overseas markets must reach $292 billion by 2025, representing a 5.2% annual growth rate. This annual growth rate is an average and it is more than likely that the actual growth from year to year will fluctuate. As long as the yearly growth rates average to 5.2%, the target will be reached. Overseas export growth in 2018 and in 2019 illustrates that well. In 2018, export growth was 10.2%, higher than 5.2%, while in 2019 it was lower. On average, it resulted in Canada having exports growing at a rate of 6.3% per year over the two-year period (see Figure 1). However, 2020 was an exceptional year as border closures, travel restrictions and other containment measures enacted to combat the spread of COVID-19 constrained economic and trade activities. The value of Canadian exports to overseas markets dropped 7.2% in 2020, resulting in a growth rate of 1.6% per year between 2017 and 2020.
The value of Canadian exports to overseas markets rebounded by 6.1% in 2021, which exceeded the required annual growth rate, but was not enough to make up for the losses experienced in 2020. As a result, Canadian exports to overseas markets grew 2.7% per year between 2017 and 2021, and will need to grow 7.7% per year between 2021 and 2025 to reach the target set in the Fall 2018 Economic Statement. While trade generally recovered in 2021, COVID-19 restrictions disproportionately affected travel and air transportation services exports. Furthermore, heat waves and a drought in the Prairies affected Canadian agriculture product exports, one of the more important product groups in Canada's overseas exports. On the other hand, rising commodity prices supported strong rebounds in exports of energy products and base metals. Commercial services—many of which can be delivered digitally—continued to show strength in overseas markets.
Figure 1: Canada's overseas goods and services exports
Text version - Figure 1
$ Billions
| 2017 | 2018 | 2019 | 2020 | 2021 | 2022 | 2023 | 2024 | 2025 | |
|---|---|---|---|---|---|---|---|---|---|
| 5.2% growth path | 194,507 | 206,664 | 218,820 | 230,977 | 243,134 | 255,290 | 267,447 | 279,604 | 291,761 |
| Overseas Exports | 194,507 | 214,279 | 219,919 | 204,151 | 216,581 |
Performance by product categories
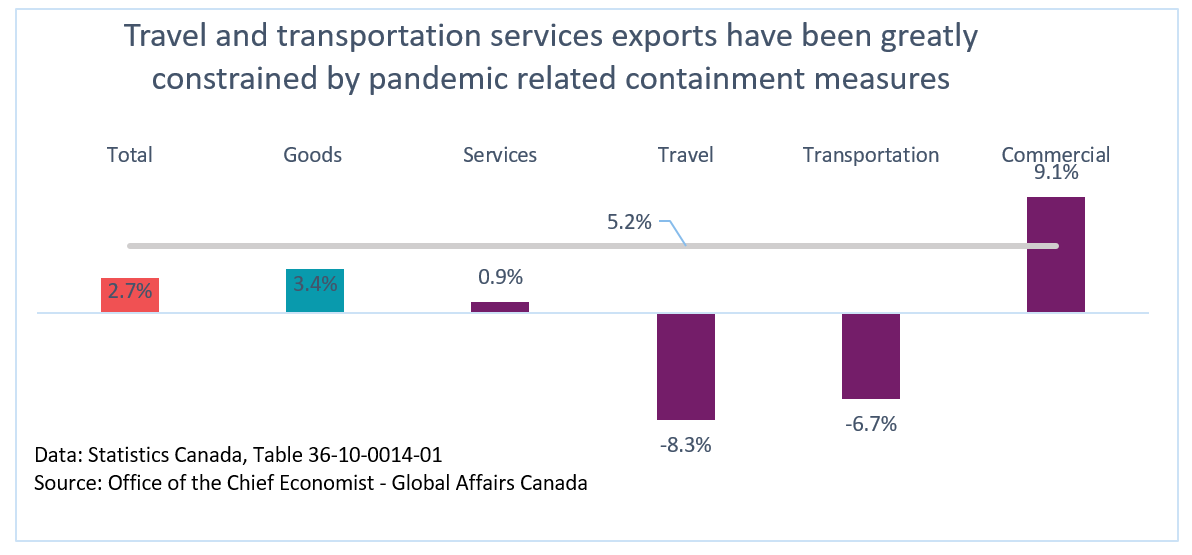
There was considerable variation among different components of Canada's exports (see Figure 2). Overseas goods exports outperformed services, but still only grew 3.4% per year between 2017 and 2021, below the required 5.2% growth rate. Services grew only 0.9% between 2017 and 2021, but there are some divergences between the different categories of services. Various pandemic-related restrictions remained at borders, and these restrictions continued to weigh on travel services exports to overseas markets, which declined a further 12% in values in 2021 after declining by 40% in 2020. Transportation services were also affected, growing only 4.5% in values after a decline of 35% in 2020. The value of commercial services exports grew 2.4% in 2021 after growth of 6.4% in 2020, resulting in a growth rate of 9.1% per year between 2017 and 2021; their impressive performance came as many services have the potential to be delivered digitally. Driving this growth were commercial services exports to the European Union, which were particularly strong, growing 13% per year in values since 2017.
Figure 2: Canadian overseas exports growth, 2017 – 2021 average annual growth rate
Text version - Figure 2
| Product group | 2017 – 2021 average annual growth rate for Canadian overseas exports |
|---|---|
| Total | 2.7% |
| Goods | 3.4% |
| Services | 0.9% |
| Travel | -8.3% |
| Transportation | -6.7% |
| Commercial | 9.1% |
| Required Growth rate | 5.2% |
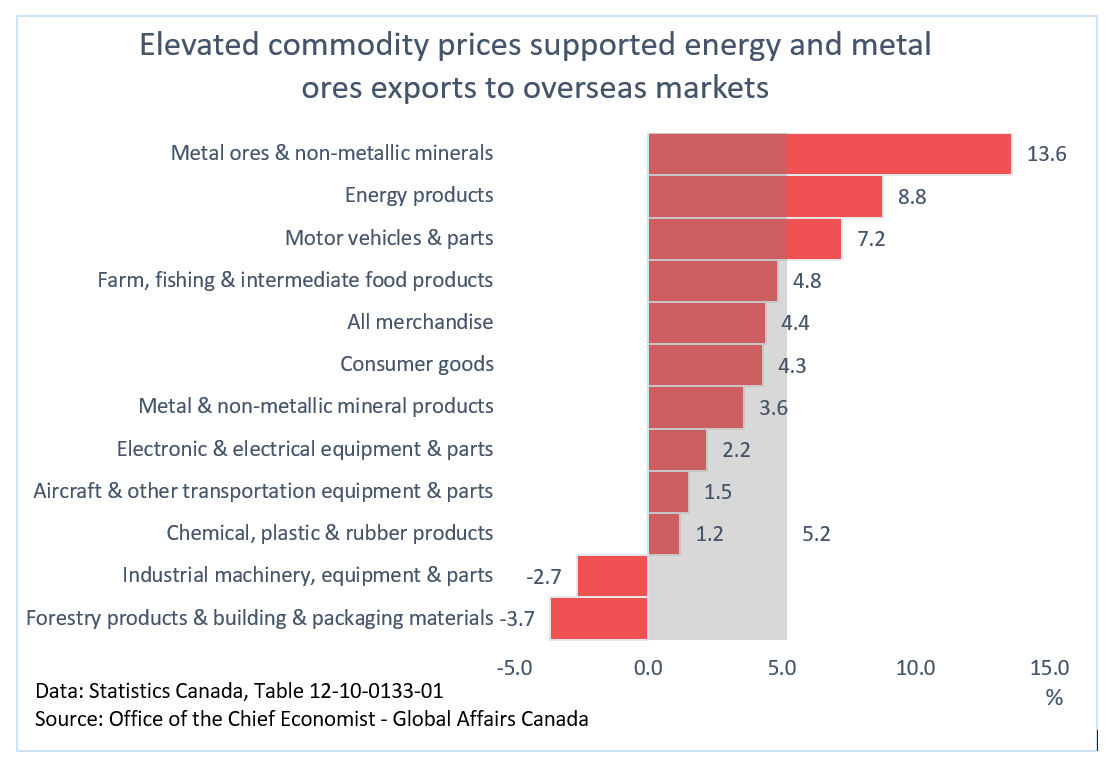
In 2021, the value of Canadian merchandise Footnote 2 exports to overseas market grew 11%, but this was not enough to make up for the stagnation in 2019 and the decline in 2020; resulting in a growth rate of 4.4% per year between 2017 and 2021, below the required growth rate of 5.2% (Figure 3). Canada's exports of farm, fishing and intermediate food products (the largest product group to overseas markets), only grew 2.3% in value in 2021, resulting in a growth rate of 4.8% per year between 2017 and 2021, below the required growth rate. Widespread drought conditions during the growing season was a drag on crop production and exports in 2021.
However, some product groups have managed to over-perform the required growth rate to the 2025 goal. Both metal ores & non-metallic minerals and energy products benefited from the global increases in commodity prices in 2021. Overseas exports of metal ores & non-metallic minerals grew 21% in values in 2021, and energy products grew 57%, with a noticeable large increase in metallurgical coal exports to China. Despite the global supply chain constraints, motor vehicles & parts exports to overseas markets grew 9.1% in values in 2021, resulting in a growth rate of 7.2% per year from 2017; however, this large per year growth rate is mostly a legacy of the large growth in values (35%) that occurred in 2018. The value of exports of motor vehicle and parts to overseas markets in 2021 were still below 2018 levels, and only accounted for 3.0% of overseas merchandise exports.
Figure 3: Canadian overseas exports growth, 2017 – 2021 average annual growth rate, by type of merchandise exports
Text version - Figure 3
| Mechandise product | 2017 – 2021 average annual growth rate for Canadian overseas exports |
|---|---|
| Forestry products & building & packaging materials | -3.7% |
| Industrial machinery, equipment & parts | -2.7% |
| Chemical, plastic & rubber products | 1.2% |
| Aircraft & other transportation equipment & parts | 1.5% |
| Electronic & electrical equipment & parts | 2.2% |
| Metal & non-metallic mineral products | 3.6% |
| Consumer goods | 4.3% |
| All merchandise | 4.4% |
| Farm, fishing & intermediate food products | 4.8% |
| Motor vehicles & parts | 7.2% |
| Energy products | 8.8% |
| Metal ores & non-metallic minerals | 13.6% |
| Required Growth rate | 5.2% |
Performance by trade partners
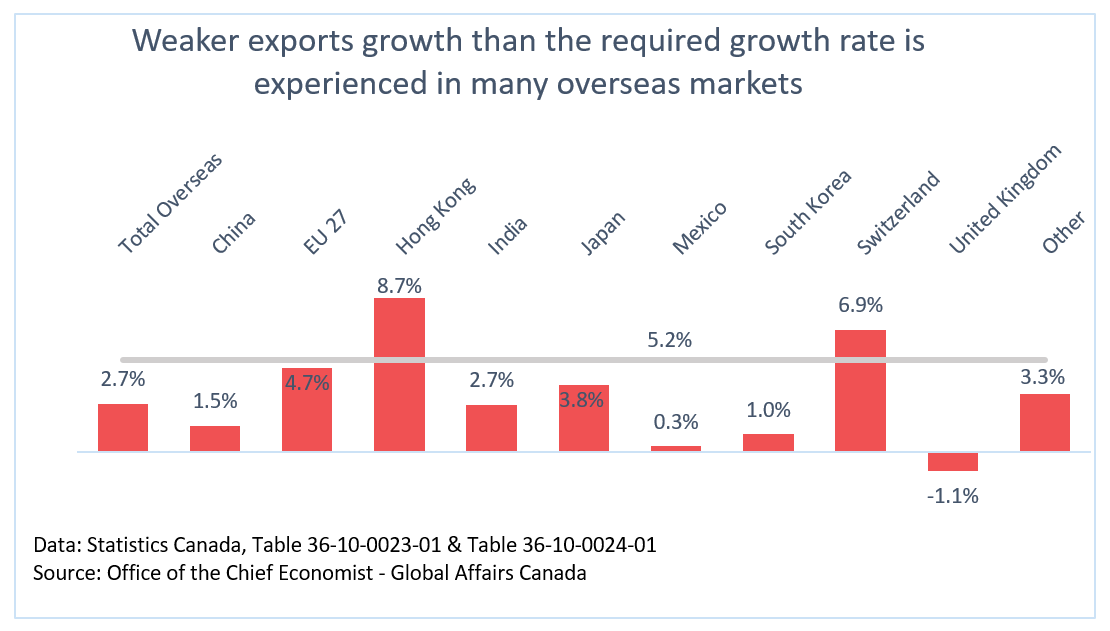
Unsurprisingly, Canadian exports to the majority of top overseas markets are not growing 5.2% per year or more since 2017 (see Figure 4). The European Union (EU) is Canada's largest overseas export destination; in 2021, exports to the EU grew 7.5%, resulting in an average annual growth rate of 4.7% since 2017. There are some divergences in performance, as goods exports to the EU have been growing 5.4% per year since 2017, beating the required growth rate, while services have only grown 3.4% per year. The slower growth in services is mostly due to travel and transportation services, which declined 20% and 6.5% per year since 2017, respectively. As previously stated, Canadian exports of commercial services to the EU have been growing 13% per year since 2017, beating the required growth rate (5.2%) by a large distance.
China is Canada's second largest overseas export market, and exports have been growing 1.5% per year to this market since 2017, with goods growing 3.4% per year and services declining 6.9% per year. The decline in services can once again be attributed to travel services exports, which on average accounted for almost 80% of Canada's services exports to China. (Note: Travel services include education exports—i.e. when foreign students study in Canada.)
Canadian exports have been declining 1.1% per year to the United Kingdom since 2017, Canada's third largest overseas exports destination. On the services side, it's the similar story of large declines in travel and transportation services exports. On the merchandise side, Canadian exports to the United Kingdom is dominated by gold exports, which saw a decline of 27% in values in 2021.
Canadian overseas exports to two top overseas partners, Switzerland and Hong Kong, managed to accomplish the rare feat of growing faster than the required growth since 2017. Canadian exports to Switzerland and Hong Kong were supported by gold, which investors have a tendency to buy during economic uncertainties.
Figure 4: Canadian overseas exports growth, 2017 – 2021 average annual growth rate, by top overseas export partners
Text version - Figure 4
| Export Destinations | 2017 – 2021 average annual growth rate |
|---|---|
| Total Overseas | 2.7% |
| China | 1.5% |
| EU 27 | 4.7% |
| Hong Kong | 8.7% |
| India | 2.7% |
| Japan | 3.8% |
| Mexico | 0.3% |
| South Korea | 1.0% |
| Switzerland | 6.9% |
| United Kingdom | -1.1% |
| Other | 3.3% |
| Required Growth rate | 5.2% |
Performance by price vs. quantity
The value of exports can also be separated into two components: the quantity of goods traded and the price paid for those goods. Price and quantity components are important to examine because they provide further insights on how Canadian overseas exports are doing relative to the targeted growth rate. Price increases are largely outside the control of Canadian exporters as most Canadian exporters are price-takers. Canadian exporters have relatively more control over the quantity of exports, which is more reflective of the real economy. When we examine only the value of exports, we do not know if Canadian exporters are exporting more to overseas markets or simply getting higher prices. By examining price vs quantity, we gain insight into this questionFootnote 3 .
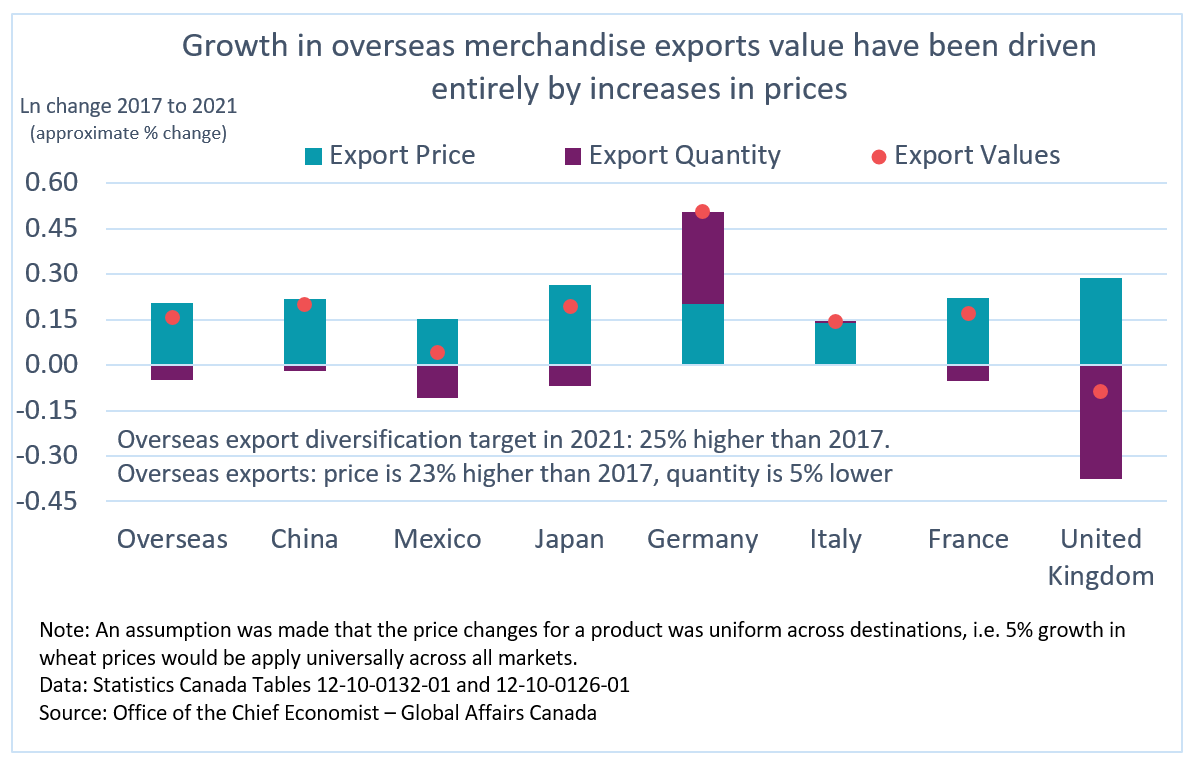
Between 2017 and 2021, the value of merchandise exports to overseas markets grew 17% Footnote 4, with growth driven entirely by prices (23% growth) as the quantities exported declined 5%. Therefore, merchandise export prices are close to the targeted growth rate (25% since 2017) but export quantities are significantly lagging behind.
A similar trend can be seen among Canada's merchandise exports to top partners, with merchandise export prices growing positively, and in some cases, merchandise export prices to certain overseas partners are even exceeding the targeted growth rate. Merchandise export quantities to top overseas markets are significantly lagging behind, with the exception being Germany, where export quantities growth since 2017 have exceeded export prices growth.
Figure 5: Price and quantity contributions to Canadian merchandise export growth, by top trade partners, custom basis, 2021 compared to 2017
Text version - Figure 5
| Ln change 2017 to 2021 (approximate % change) | Overseas | China | Mexico | Japan | Germany | Italy | France | United Kingdom |
|---|---|---|---|---|---|---|---|---|
| Export Values | 0.16 | 0.20 | 0.04 | 0.19 | 0.51 | 0.15 | 0.17 | -0.09 |
| Export Price | 0.21 | 0.22 | 0.15 | 0.26 | 0.20 | 0.14 | 0.22 | 0.29 |
| Export Quantity | -0.05 | -0.02 | -0.11 | -0.07 | 0.30 | 0.01 | -0.05 | -0.37 |
Forward looking
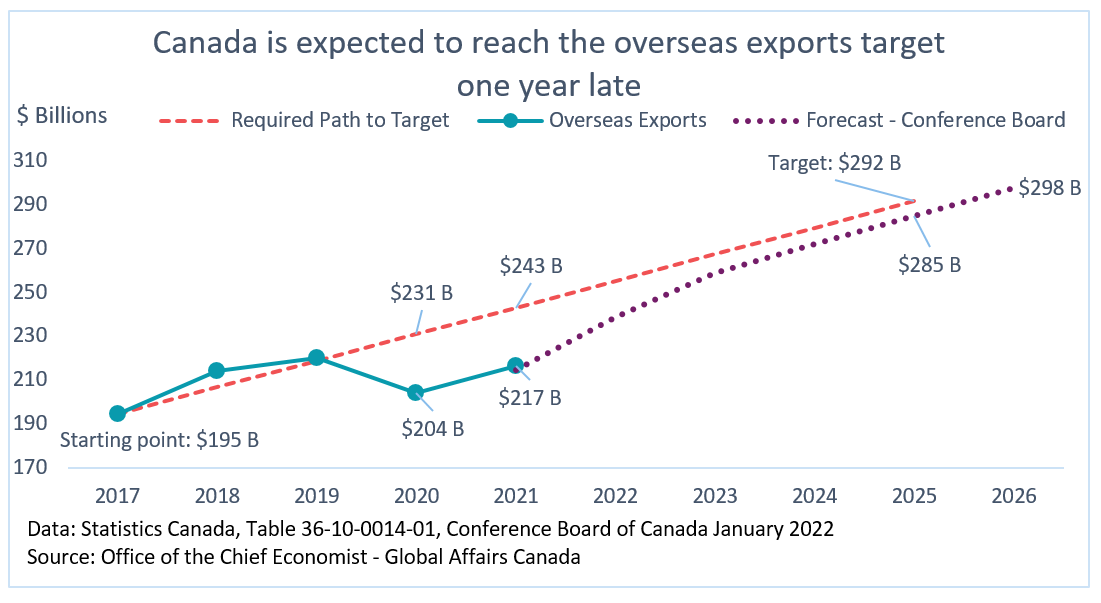
Due to the setback from the COVID-19 pandemic and the resulting shifts in demand as well as containment measures, Canadian exports to overseas markets are not expected to reach the target set in the Fall 2018 Economic Statement of increasing exports to overseas markets by 50% by 2025, according to the Conference Board of Canada (Figure 6). Overseas exports will need to grow 7.7% per year from 2021 to reach the target, and the Conference Board forecasted a growth of 7.4% between 2021 and 2025.
Using the Conference Board's forecast, goods exports to overseas markets are expected to grow 5.3% per year from 2017 to 2025, faster than the required growth rate (5.2%), but services are expected to lag behind at 4.3% per year. The forecasted growth in goods is in part supported by elevated commodity prices, which are expected to support Canadian energy products, base metal, and mineral ores exports. The forecasted weaker performance in services reflects the scarring from COVID‑19 containment measures, in which the future of travel and passenger transportation remains uncertain. A reduction in containment measures at the border, a larger than expected pent up demand for international travel, and further vaccination and therapeutics can potentially provide some upside supports to Canadian overseas services exports.
Figure 6: Canada's overseas goods and services exports forecast
Text version - Figure 6
$ Billions
| 2017 | 2018 | 2019 | 2020 | 2021 | 2022 | 2023 | 2024 | 2025 | 2026 | |
|---|---|---|---|---|---|---|---|---|---|---|
| Required Path to Target | 194,507 | 206,664 | 218,820 | 230,977 | 243,134 | 255,290 | 267,447 | 279,604 | 291,761 | |
| Overseas Exports | 194,507 | 214,279 | 219,919 | 204,151 | 216,581 | |||||
| Forecast - Conference Board | 214,527 | 238,832 | 258,822 | 272,280 | 284,922 | 297,833 |
In the short-term, inflation, rising commodity prices and supply constraints are issues of concern for the global economy, and these concerns are further exacerbated by the Russian attack on Ukraine, which is increasing the prices of many commodities. While the direct economic impacts of the conflict on Canada are expected to be modest, Canada's largest and third largest overseas exports markets, the European Union and the United Kingdom, are expected to see significant downgrades to economic growth, potentially affecting demand for Canadian products in these markets (see Figure 7). Counter-balancing this, elevated commodity prices are expected to boost the values of Canadian commodity exports to overseas markets, but it is uncertain if the quantity of exports can be enough to meet demand in the short-term. In the medium-term, economic growth is still expected to be stronger in emerging markets in the Asia-Pacific region, potentially drawing more Canadian products in that direction.
Figure 7: Economic Growth Forecast
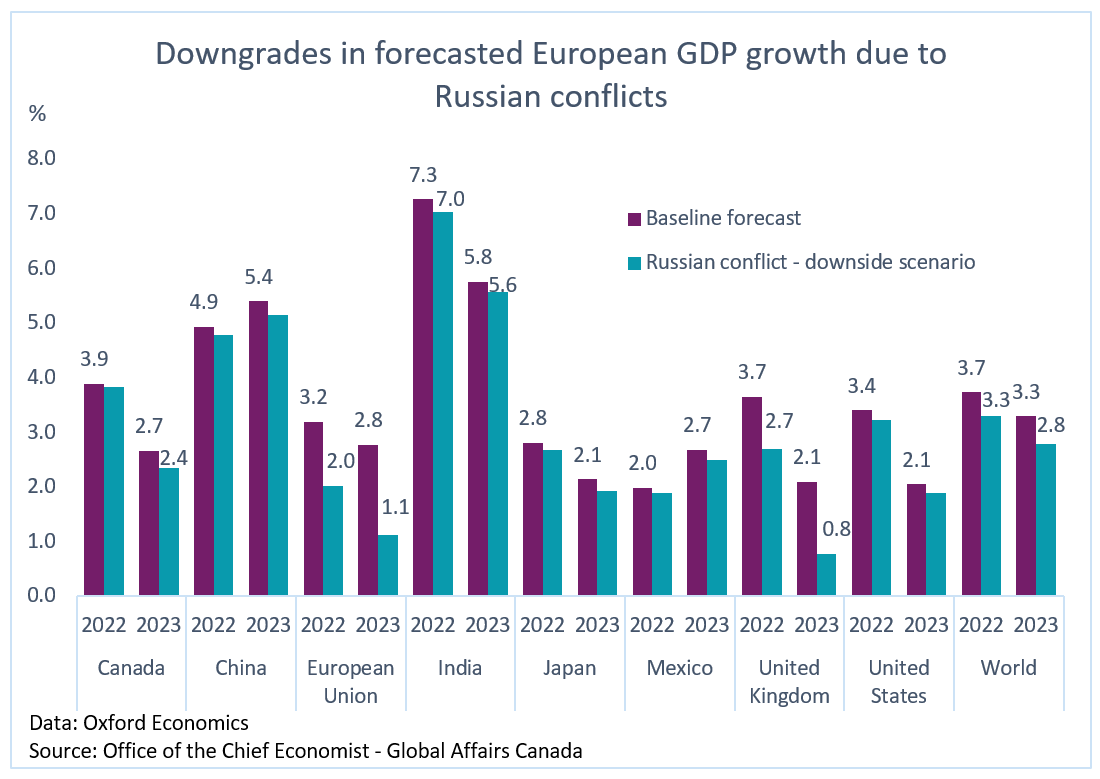
Text version - Figure 7
| Country | Year | Russian conflict - downside scenario (forecasted economic growth) | Baseline forecast (forecasted economic growth) |
|---|---|---|---|
| Canada | 2022 | 3.8% | 3.9% |
| Canada | 2023 | 2.4% | 2.7% |
| China | 2022 | 4.8% | 4.9% |
| China | 2023 | 5.2% | 5.4% |
| European Union | 2022 | 2.0% | 3.2% |
| European Union | 2023 | 1.1% | 2.8% |
| India | 2022 | 7.0% | 7.3% |
| India | 2023 | 5.6% | 5.8% |
| Japan | 2022 | 2.7% | 2.8% |
| Japan | 2023 | 1.9% | 2.1% |
| Mexico | 2022 | 1.9% | 2.0% |
| Mexico | 2023 | 2.5% | 2.7% |
| United Kingdom | 2022 | 2.7% | 3.7% |
| United Kingdom | 2023 | 0.8% | 2.1% |
| United States | 2022 | 3.2% | 3.4% |
| United States | 2023 | 1.9% | 2.1% |
| World | 2022 | 3.3% | 3.7% |
| World | 2023 | 2.8% | 3.3% |
The global economic and trade environment have changed significantly since the overseas export target was first set in the Fall 2018 Economic Statement. Even before the spread of COVID-19, rising anti-trade sentiments globally and geo-political tensions between the world's largest economies created uncertainty around the global trading environment. The pandemic, and the resulting containment measures, had a tremendous impact on Canadian exports and its expected effect of pushing out the date of Canada achieving its overseas export growth target by only one year can be considered to be a positive. Despite the setbacks, trade diversification remains an important strategy as it can lessen the impact of external shocks, especially in particular sectors or countries.
- Date modified: