Growing Canada’s exports to overseas markets by 50% – 2023 update
June 2024
Executive summary
- The Fall 2018 Economic Statement set a target of increasing Canada’s overseas exports 50% by 2025. This target implies that Canadian exports to overseas (i.e. non-U.S.) markets would reach $292 billion by 2025.
- Despite weak growth in overseas exports in 2023, Canada remains on track to reach the target, building on a strong rebound in 2022 following the shock of the pandemic.
- Going forward, Canadian exports to overseas markets will need to grow by 4.4% annually on average for the next 2 years to reach the target – significantly more than the growth that occurred in 2023.
- Services exports have been a major driver of growth in exports to overseas markets, in particular commercial and travel services. Commercial services benefited from a high capacity for digital delivery, growing 9.7% per year between 2017 and 2023. Travel services rebounded strongly after the pandemic and benefited from the rise of international students in Canada.
- While overall goods exports have been weaker, some standout performers include energy products and metal ores and non-metallic minerals, benefiting from higher prices.
- Among the top export partners, exports to the European Union and India have each grown more than 5.2% per year on average since 2017.
Introduction
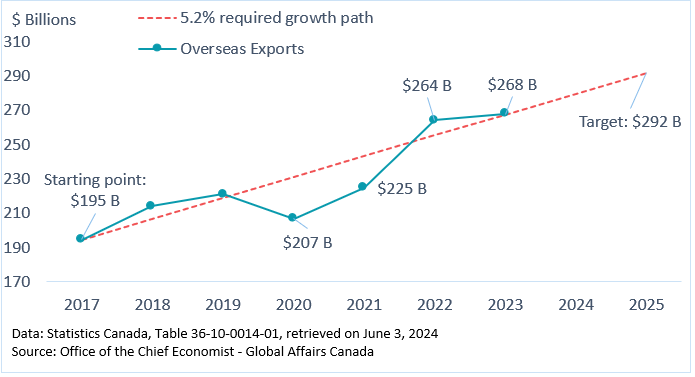
Having multiple export destinations can help Canadian companies prosper by hedging risk and taking advantage of high-growth marketsFootnote 1. The Fall 2018 Economic Statement set a target of increasing by 50% Canada’s overseas goods and services exports by 2025 (in this case, “overseas” refers to non-U.S. countries.) In 2017, the latest full year of data available when the target was set, Canada exported $195 billion of goods and services to overseas markets. A 50% increase meant that Canadian exports to overseas markets would reach $292 billion by 2025 to achieve the target, representing a 5.2% annual growth rate on average. While the pandemic brought many challenges and put Canada’s exports below target for 2020 and 2021, Canadian exports to overseas markets posted strong growth in 2022, increasing by 17.4% (see Figure 1).
In 2023, growth in exports to overseas markets was much more subdued (+1.4%) but was still enough to keep the value of Canadian exports to overseas markets ($268 billion) on the targeted path. This means that going forward, Canadian exports to overseas markets will only need to grow by 4.4% annually on average in 2024 and 2025 to reach the overseas diversification target.
Last year’s growth can be credited to the strength of services exports, which grew 15.5% in 2023—and in particular travel services which expanded 33.7%. On the other hand, goods exports to overseas markets declined 4.7% in 2023, as the prices of many commodities decreased from elevated levels of 2022.
Figure 1. Canada's overseas goods and services exports
Text version - Figure 1
| Canada's overseas goods and services exports, $ million | 2017 | 2018 | 2019 | 2020 | 2021 | 2022 | 2023 | 2024 | 2025 |
|---|---|---|---|---|---|---|---|---|---|
| 5.2% required growth path | 194,507 | 206,664 | 218,820 | 230,977 | 243,134 | 255,290 | 267,447 | 279,604 | 291,761 |
| Overseas Exports | 194,507 | 214,279 | 220,966 | 206,960 | 225,004 | 264,093 | 267,701 |
Data: Statistics Canada, Table 36-10-0014-01, retrieved on June 3, 2024
Source: Office of the Chief Economist - Global Affairs Canada
2.1 Performance by product categories
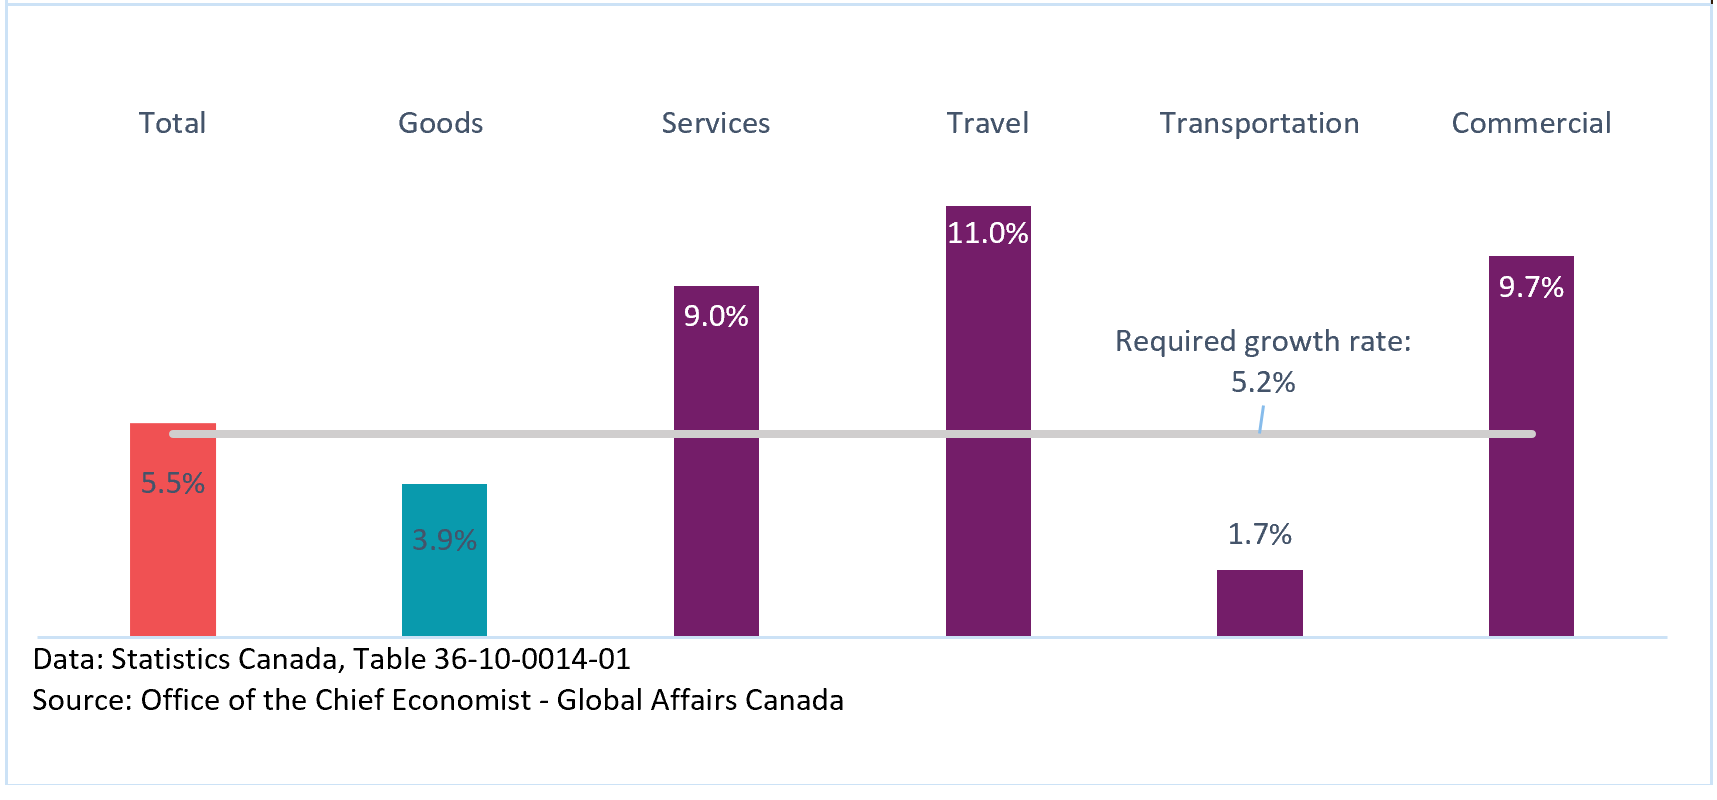
Since 2017, Canadian exports to overseas markets have grown by 5.5% per year on average, beating the required growth rate of 5.2% annually to reach the target. This has been supported mainly by services exports, which have grown 9.0% per year since 2017 on average, while the growth in goods exports have been more subdued at 3.9% per year since 2017.
Travel and commercial services in particular have been growing at a faster rate. Commercial services exports, many of which could be delivered digitally, did not suffer during the pandemic and have been growing at a rate of 9.7% per year since 2017. On the other hand, travel services exports declined substantially during the pandemic but have since rebounded strongly, resulting in an annual average growth of 11.0% from 2017. This was supported by the rise of international students in Canada, which have grown by 13.4% per year on average since 2017. The weakness in transportation services exports is partially due to air transportation services as the number of residents of countries other than the U.S. entering Canada by air was still below pre-pandemic levels in 2023.
Figure 2. Canadian overseas exports growth, 2017 – 2023 average annual growth rate
Text version - Figure 2
| 2017 – 2023 average annual growth rate (%) | |
|---|---|
| Total | 5.5 |
| Goods | 3.9 |
| Services | 9.0 |
| Travel | 11.0 |
| Transportation | 1.7 |
| Commercial | 9.7 |
| Required growth rate | 5.2 |
Data: StatisticsCanada, Table 36-10-0014-01
Source: Office of the Chief Economist -Global Affairs Canada
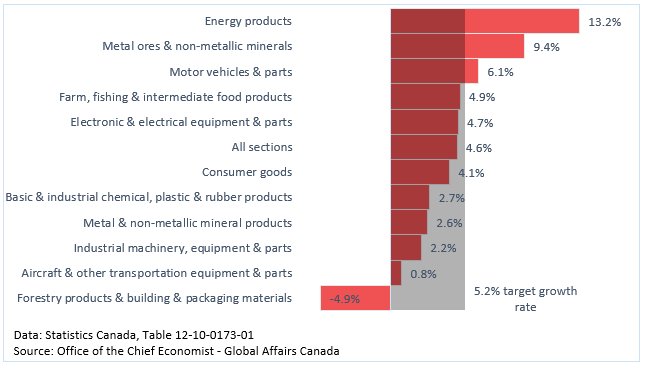
Merchandise exports to overseas markets declined 5.2% in 2023 and as a result, merchandise exportsFootnote 2 to overseas markets have grown by 4.6% per year on average since 2017, below the targeted growth rate of 5.2% for goods and services.
Despite the overall weakness in merchandise exports, there are still some sectors that have managed to surpass the target growth rate. Exports of energy products to overseas markets have grown by 13.2% per year since 2017, supported mainly by higher prices as volume have grown at a steadier pace. Energy products are now the 4th largest merchandise product group to overseas markets, up 2 places from 6th in 2017. Metal ores and non-metallic minerals, Canada’s 3rd largest exports to overseas markets, have also experienced strong growth. On the other hand, metal and non-metallic mineral products, Canada’s 2nd largest overseas exports, have experienced weaker average growth at 2.6% per year since 2017. Canada’s largest overseas exports, farm, fishing and intermediate food products, have performed better by growing at 4.9% per year since 2017 on average, slightly below the target growth rate of 5.2%.
Canadian exports of motor vehicles and parts, while smaller in value in overseas markets, have also witnessed strong growth since 2017, growing at 6.1% per year on average due mainly to growth to Mexico, and China.
Figure 3. Canadian overseas exports growth, 2017 – 2023 average annual growth rate, by type of merchandise exports
Text version - Figure 3
| 2017 – 2023 average annual growth rate (%) | |
|---|---|
| Forestry products & building & packaging materials | -4.9 |
| Aircraft & other transportation equipment & parts | 0.8 |
| Industrial machinery, equipment & parts | 2.2 |
| Metal & non-metallic mineral products | 2.6 |
| Basic & industrial chemical, plastic & rubber products | 2.7 |
| Consumer goods | 4.1 |
| All sections | 4.6 |
| Electronic & electrical equipment & parts | 4.7 |
| Farm, fishing & intermediate food products | 4.9 |
| Motor vehicles & parts | 6.1 |
| Metal ores & non-metallic minerals | 9.4 |
| Energy products | 13.2 |
| Target growth rate | 5.2 |
Data: StatisticsCanada, Table 12-10-0173-01
Source: Office of the Chief Economist -Global Affairs Canada
2.2 Performance by trade partners
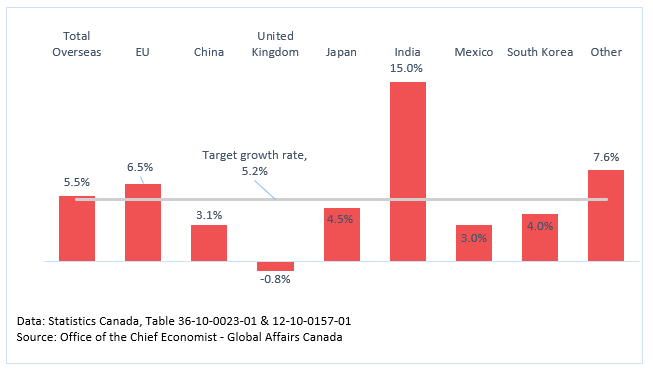
In 2023, Canadian overseas exports exceeded the 5.2% per year target growth rate in some markets, while underperforming in others. The European Union (EU) is Canada’s largest overseas export market, and exports to this market have been growing at 6.5% per year since 2017 on average supported by the introduction of the Canada-EU trade agreement in 2017. Both goods and services exports have contributed to the growth in this market, growing 5.5% and 8.3% per year, respectively. A 12.1% per year growth in commercial services exports to the EU supported services exports to this market, while travel and transport services are still struggling to attain the 5.2% targeted growth rate.
Canada’s exports to its next 3 largest overseas markets, China, the United Kingdom and Japan, have struggled to reach the target growth rate of 5.2%. The weakness for China came from both goods and services, as exports have grown by only 3.7% per year and 0.8% per year on average since 2017, respectively. Services exports to the United Kingdom have exceeded the target growth rate, growing at 5.6% per year since 2017 on the strength of commercial services exports. However, goods exports to the United Kingdom have decreased 3.5% annually on average since 2017, due to the prominence of gold exports which declined during that period. Excluding gold, merchandise exports to the United Kingdom have increased by an annual average of 3.8% since 2017.
There has been notable growth of exports to India topping 15.0% per year since 2017 on average. This has been driven by services exports which have grown 29.1% annually since 2017 while goods exports have only grown by 2.7% annually on average. Services exports to India include spending by Indian students in Canada and the number of international students from India has grown 23% per year since 2017 on average to reach over 427,000 in 2023.
Figure 4. Canadian overseas exports growth, 2017 – 2023 average annual growth rate, by top destinations
Text version - Figure 4
| 2017 – 2023 average annual growth rate (%) | |
|---|---|
| Total Overseas | 5.5 |
| EU | 6.5 |
| China | 3.1 |
| United Kingdom | -0.8 |
| Japan | 4.5 |
| India | 15.0 |
| Mexico | 3.0 |
| South Korea | 4.0 |
| Other | 7.6 |
| Target growth rate | 5.2 |
Data: StatisticsCanada, Table 36-10-0023-01 & 12-10-0157-01
Source: Office of the Chief Economist -Global Affairs Canada
Forward looking
Going forward, Canadian overseas exports will only need to grow 4.4% annually on average in 2024 and 2025 to reach the target set in the Fall 2018 Economic Statement—this is a rate of expansion much slower than Canada’s 5.5% average annual performance since 2017. However, there are several challenges that might make even this slower rate more challenging. According to the International Monetary Fund’s April 2024 forecast, global economic growth is expected to be steady at 3.2% per year from now until 2025, a rate lower than the growth experienced in the previous decade. Many emerging markets such as China, Mexico and India are expected to continue to experience decelerating growth until 2025. Growth in China is projected to slow from 5.2% in 2023 to 4.1% in 2025 as the positive effects of the post-pandemic boost to consumption and fiscal stimulus ease, in addition to persistent weakness in the property sector. Growth in India is expected to remain strong in 2024 at 6.8% and in 2025 at 6.5% but this is still a deceleration from 7.8% in 2023.
On the bright side, economic growth in several advanced economies is expected to accelerate in the short-term. In the Euro Area (which includes all 20 countries that use the euro), growth is projected to recover from its low rate of 0.4% in 2023 to 1.5% by 2025 with stronger household consumption expected to drive the recovery, as the effects of the energy price shock subside and a fall in inflation supports real income growth. Growth in the United Kingdom is projected to rise from 0.1% in 2023 to 1.5% in 2025 due to the same consumption, energy, and inflation drivers as in the Euro Area.
Figure 5. Economic growth (estimated and forecasted) for top overseas markets
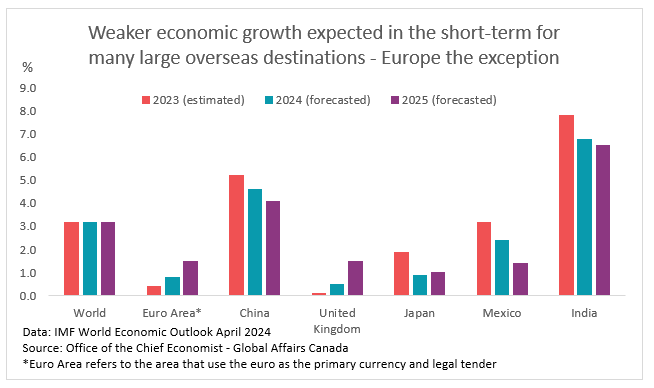
Text version - Figure 5
Weaker economic growth expected in the short-term for many large overseas destinations – Europe the exception
| Economic growth (%) for top overseas markets | World | Euro Area* | China | United Kingdom | Japan | Mexico | India |
|---|---|---|---|---|---|---|---|
| 2023 (estimated) | 3.2 | 0.4 | 5.2 | 0.1 | 1.9 | 3.2 | 7.8 |
| 2024 (forecasted) | 3.2 | 0.8 | 4.6 | 0.5 | 0.9 | 2.4 | 6.8 |
| 2025 (forecasted) | 3.2 | 1.5 | 4.1 | 1.5 | 1.0 | 1.4 | 6.5 |
Data: IMF World Economic Outlook April 2024
Source: Office of the Chief Economist -Global Affairs Canada
*Euro Area refers to the area that use the euro as the primary currency and legal tender
The global economic and trade environment have changed significantly since the overseas export target was first set in the Fall 2018 Economic Statement. Even before the COVID-19 pandemic and its tremendous impacts, rising global anti-trade sentiments and geo-political tensions had already began creating uncertainty. Despite these uncertainties and the pandemic challenges, Canadian overseas exports rebounded strongly in recent years and as of 2023, Canada is on track to reach the target stated in the Fall 2018 Economic Statement.
Services exports have been a driver as commercial services grew strongly throughout the entire period, benefiting from a high capacity for digital delivery, and travel services have rebounded post-pandemic due to spendings by international students.Footnote 3 However going forward, the support to travel services from international students is expected to weaken, due to the expected reduction in study permits in 2024 and 2025. While overall goods exports have been weaker, some standouts include energy products and metal ores and non-metallic minerals, which benefitted from higher prices. Trade diversification remains an important strategy, especially in an environment of heightened uncertainty, as it can lessen the impact of external shocks, especially in particular sectors or countries.
Appendix
Table 1. Canadian overseas export performance
| 2017 Value of exports ($ billion) | 2023 Value of exports ($ billion) | Average annual growth, 2017-2023 (%) | 2025 Target ($ billion) | |
|---|---|---|---|---|
| Total | 195 | 268 | 5.5 | 292 |
| Goods | 139 | 176 | 3.9 | 209 |
| Services | 55 | 92 | 9.0 | 83 |
Data: Statistics Canada, Table 36-10-0014-01
Source: Office of the Chief Economist – Global Affairs Canada
Bibliography
International Monetary Fund. (2024). World economic outlook: Steady but slow: Resilience amid divergence (April 2024). Washington, DC: IMF. https://www.imf.org/en/Publications/WEO/Issues/2024/04/16/world-economic-outlook-april-2024.
Global Affairs Canada. 2018. Growing Canada’s Exports to Overseas Markets by 50 Percent.
Global Affairs Canada. (2019). Canada’s State of Trade 2019. https://www.international.gc.ca/gac-amc/publications/economist-economiste/state_of_trade-commerce_international-2019.aspx?lang=eng
Government of Canada. 2018. Fall Economic Statement 2018. https://www.budget.gc.ca/fes-eea/2018/docs/statement-enonce/chap03-en.html#s3
Statistics Canada. (2024). Table 36-10-0014-01 Balance of international payments, current account and capital account, annual [Data table]. https://www150.statcan.gc.ca/t1/tbl1/en/tv.action?pid=3610001401
Statistics Canada. (2024). Table 12-10-0173-01 Canadian international merchandise trade by province and country, and by product sections, customs-based, annual [Data table]. https://www150.statcan.gc.ca/t1/tbl1/en/tv.action?pid=1210017301
Statistics Canada. (2024). Table 36-10-0023-01 Balance of international payments, current account, goods by principal trading partners, quarterly [Data table]. https://www150.statcan.gc.ca/t1/tbl1/en/tv.action?pid=3610002301
Statistics Canada. (2024). Table 12-10-0157-01 Balance of international payments, current account, trade in services by principal trading partners, quarterly [Data table]. https://www150.statcan.gc.ca/t1/tbl1/en/tv.action?pid=1210015701
- Date modified: