
Vulnerability of Canadian industries to disruptions in global supply chains
June 2020
David Boileau
Aaron Sydor
Acknowledgements
This research relies heavily on data from Statistics Canada. We would like to thank Statistics Canada’s Industry Accounts Division for providing supply and use import and export tables and trade concordance tables. We would particularly like to thank Craig Stewart for his help and guidance with using the supply and use data. We would also like to thank our colleagues Kevin Jiang and Colin Scarffe for their immense help on this project. Finally, we would like to thank Marie-France Paquet for her reviews and guidance.
Executive summary
The COVID-19 pandemic has renewed interest in international supply chains. While international supply chains proved to be very robust in the pandemic period of closed borders, restrictions on movement of people and goods, and closures of businesses, the pandemic proved the need for better tools, particularly for policy makers, to ascertain the health and resilience of international supply chains and the impact they have on their respective economies. This report attempts to provide one such tool with the creation of a set of indices to measure the vulnerability of Canadian industries to disruptions in both upstream and downstream international supply chains.
Key findings:
- Canadian manufacturing sectors are particularly vulnerable to global shocks as they rely on both foreign suppliers for inputs and foreign markets for sales.
- Retail and other service industries, on the other hand, may be less vulnerable to disruption because they rely more on domestic markets as well as domestic suppliers.
- An industry’s vulnerability to supply chain disruptions not only comes from international connectedness generally, but also from a heavy reliance on a relatively small number of markets for most exports, as well as a large number of inputs being sourced from a single, or small number of, partner(s).
- This tool can be used to identify what industries are most vulnerable to disruption in supply of a specific product (at a very detailed level) or to disruption to supply/demand with a specific partner economy.
Overview
The COVID-19 pandemic put a spotlight on the strength and resilience of international supply chains. The tightening and closing of borders, restrictions on the movement of people and goods, the closure of businesses as a component of strategies to control the spread of the virus, and the impact of the virus on workers, all had the potential to disrupt international supply chains. We undertook the work described in this study in the early weeks of pandemic with a view to identifying which industries and at what stages of the supply chain could be most vulnerable to disruption as a tool for guiding policy-makers. International supply chains, however, proved more resilient than many had feared. While there were many important challenges, from a Canadian perspective supply chains by-and-large survived the test of a global pandemic - critical foods and medicines continued to flow and supply chain issues did not prove to be a major constraint on restarting industries as lockdowns were eased.
As the focus shifts to recovery and growth, international supply chains remain an important touch-point. Policy-makers working to support growth and employment in their economies will be tempted to engage in efforts to re-shore jobs in the name of supply-chain security. International supply chains have been shown to be key drivers of increased productivity (Baldwin and Yan (2014), Crisculo and Timmis (2017), Urata and Baek (2019)) and thus contributing to faster economic growth, improved incomes for workers, and lower costs for consumers. In other words, policies towards reshoring risk making the world a poorer place. At the same time, there is little evidence that re-shoring of supply chains contributes to their resiliency (Meroudot (2020)).
There exists a myriad of potential sources of disruptions of international supply chains from natural to human-caused disasters and improving resiliency and robustness of key supply chains remains an important consideration for policy-makers. It is our hope that providing a tool that sheds a light into supply chains and their potential points of vulnerability will allow policy-makers to identify those industries and those stages in supply chains that are most vulnerable with a view to improving resilience and robustness without the need for reshoring and the resulting potential negative economic impacts. As just one example, the global pandemic has accelerated the long-overdue shift from paper to electronic documents in the maritime shipping industry. Such a measure not only facilitates trade but also improves the resilience of impacted supply chains to disruption while also enhancing the ability to monitor their performance (COVID-19 accelerates drive for digitization of shipping port technology 30/12/2020). Other measures, such as the Government of Canada’s policy of trade diversificationFootnote 1, similarly aim to aid in increasing supply chain resilience while maintaining or even growing the benefits that accrue from supply chains.
In this context, it is beneficial to take a broad perspective of international supply chains. As illustrated in figure 1, international supply chains may be categorized into three general types. The simplest, furthest right in the figure, would be a firm that imports goods or services for direct consumption in Canada. Roughly, 44% of Canadian imports are directly used for consumption. For this type of supply chain, only the upstream supply side is vulnerable to an international disruption.
Figure 1. International supply chains

Text version
Figure is a diagram indicating 3 types of international supply chains:
- Consumption in Canada: a good or service is imported into Canada for direct consumption. This accounts for 44% of Canadian Imports.
- Transhipments: A good or service is imported into Canada and then subsequently exported without significant transformation.
- Intermediate inputs: A good or service is imported into Canada to be used as an intermediate input in domestic production of a final good that is either consumed in Canada or exported. 56% of Canadian imports are used as intermediate inputs.
The second type, (seen in the middle of the figure) is similar to the first, however once the good or service is imported in to Canada, it is then re- exported without significant transformation, a practice commonly referred to as transhipment. Transhipments make up 8.1% of Canadian merchandise exports. While this transhipment chain may not seem of great importance compared to the other two types of supply chains illustrated here, it still has an impact on Canada, as this is trade that enters and exits Canadian ports, uses Canadian infrastructure and relates to Canadian jobs in ports workers, truckers, rail workers etc.
The third more complicated type of supply chain (furthest left on the chart) is where a Canadian enterprise imports intermediate goods and/or services to be used as intermediate inputs in the production of goods that are then consumed in Canada and/or exported to other markets. Approximately 56% of Canadian imports are used as intermediate inputs by enterprises in Canada. In this type of chain Canadian firms are vulnerable to disruptions on both the upstream supply side and the downstream demand side. In our analysis, we will look at both the upstream and downstream vulnerability of supply chains as many Canadian industries and firms fit into this type of supply chain. It should also be noted that firms can also be indirectly impacted by both upstream and downstream shocks through indirect imports and exports (i.e. value added from or to other industries) which will be discussed further on in our analysis. As an open economy that depends heavily on both importing an exporting, no industries were identified that only exported and did not use any imported content. These three-broad type of international supply chains provide a general framework to imagine how Canadian firms may be impacted by shocks outside of Canada.
Even the simplest supply chain, for example a firm which imports a good for direct consumption in Canada, has many potential choke points in bringing the imported good into the country, as illustrated in figure 2. Firstly, foreign producers of the good may temporarily shut down, as is the case in many countries during the COVID-19 pandemic, as factories keep workers home in an attempt to avoid further spread of the virus. Furthermore, the home country of the foreign supplier could redirect a firm’s output (as in the case of medical protective equipment) or an increase in domestic demand could limit exports. Plant closures can also have a domino effect as firms will have suppliers of their own. In this sense supply chains can be thought of as a stream, with closures or shocks to suppliers upstream having further impact to the factories and consumers using those products downstream.
Figure 2. Potential choke points in an international supply chain

Text version
Figure is a graphic illustrating various possible choke points in international supply chains and reasons why they might cause disruptions:
Foreign producer of intermediate input:
- Closes production due to sending staff home or sickness
- Home country redirects output
- Own supply chain compromised
- Increase in domestic demand
Foreign border:
- Export restrictionsRestrictions on movement of peopleSome border crossing closed
Transportation:
- Closes operations due to sending staff home or sickness
Canadian border:
- Some border crossing closedLimited capacity at ports
Borders are another potential choke point as export restrictions, barriers to movement of people, or even physical border closures can leave goods (and even services provided through cross-border movement of people) stranded outside of Canada. In the case of COVID-19, not only do we see foreign border closures and restrictions, but our own Canadian border also saw closures, compounded by a limiting of capacity in Canadian ports.
Another possible choke point is in the transportation of goods and services. Canadian firms with international supply chains have to rely on a global transportation infrastructure of trucks, planes, trains, ships, pipelines, airports, roadways, canals etc., all of which are at the mercy of the businesses which run them and the countries with in which they operate. And like the firms that supply the products, these transportation links are also dependent on a wide range of people, not just truck drivers and airplane pilots, but also road construction crews, air traffic controllers, dock workers and many more, whom in the case of a pandemic, natural disaster or war may not be able to make it in to work.
These choke points matter to all three-broad types of supply chains seen in figure 1 and can hinder, both a Canadian companies’ ability to import as well as export. Canada is a trading nation, in 2019 Canada imported $766 billion of goods and services, equivalent to 34% of Canadian GDP and exported $728 billion, or 32% of GDP. Canada is home to 50 thousand goods exporting establishments and 120 thousand establishments that import goods. Thus, many Canadian companies are vulnerable to disruptions to both their upstream supply (imports) and selling to downstream markets (exporting). This is not just large Canadian companies that are susceptible to supply chain disruptions, many Canadian small medium sized enterprises (SMEs) are part of international supply chains and thus exposed to international shocks such as COVID-19. In 2017, 11.7% of SMEs overall exported goods or services, but this rises to one-third in the manufacturing sector. In addition, 12.3% of SMEs imported goods or services that were used as intermediate inputs to production, while 13.6% import goods for re-sale. Broadly speaking, SMEs are more exposed to international disruptions through imports than exports; in 2018 there were 118 thousand SMEs that imported goods in Canada - almost three times as many as exported goods.
These potential disruptions to supply chains, and the ones currently happening due to the COVID-19 will likely impact all industries within the Canadian Economy, however, some industries will be impacted more than others. Some will be more exposed to shocks in upstream supply, while others more vulnerable to disruptions in downstream demand, and some, unfortunately, both. On the other hand, there may be some sectors of the Canadian economy which are more domestic focused and isolated to international supply chains and thus ready to kickstart the Canadian economy as both Canada and foreign countries begin to start up after the COVID-19 closure. In the remainder of this report we undertake analysis to measure each industry of the Canadian economy’s reliance on international supply chains, both upstream supply and downstream demand, to gain a better sense of which sectors are vulnerable to international supply chain disruptions and which are relatively immune. Before discussing our analysis, we give a brief review of some other economic studies into supply chain vulnerability.
Literature review
Our study on identifying which industries in an economy are more vulnerable to supply chain disruptions seems to be fairly unique to the economic literatureFootnote 2. There are, however, more economists beginning to look at supply chains, their vulnerabilities, and how supply chains or production networks can propagate shocks through the economy.
Acemoglu and Tahbaz-Salehi (2020) give a good overview of how supply chains can be both beneficial and harmful to an economy. In the authors own words “Supply chains generate productivity gains by enabling input customization, but also add to an economy’s fragility: bankruptcies destroy the relationship-specific surplus between firms and their suppliers and may spread in the economy as a firm’s failure spills over to its customers, suppliers, and beyond”. The authors construct a non-competitive model where customized supplier-customer relations increase productivity, but the model also shows that failure at one firm can spread to suppliers and customers and to firms in other parts of the production network.
Tokui, Kawasaki and Miyagawa (2017), looked at the economic impact of the 2011 Japanese earthquake on Japan and particularly the impact on the economy through supply chain disruptions. By using interregional input output tables, the authors estimated that the production losses caused by the supply chain disruptions amounted to at least 0.35% of Japan’s GDP.
Carvalho, Nirei, Saito and Alireza Tahbaz-Salehi (2020), also looked at the economic impacts of the Japanese earthquake. Using micro firm level data, the authors were able to look at the supply chain disruptions in both upstream and downstream supply chains of Japanese firms. Using this data, the authors find the earthquake resulted in a 3.6 percentage point decline in growth rate of firms with disaster-hit suppliers and a 2.9 percentage point decline in growth rate of firms with disaster-hit customers. The authors then construct a general equilibrium model to look at how linkages between firms propagated the impact from the earthquake and find a 0.47 percentage point decline in Japan’s real GDP growth in the year following the disaster.
While the above studies give a good understanding of how supply chains can propagate economic shocks, our study looks to which industries are most dependent on supply chains and thus vulnerable to these economic shocks that disrupt supply chains. While our index approach seems to be somewhat unique, there are some other studies that take different approaches to identifying industries or firms vulnerable to supply chain disruptions.
One such study is Wagner and Neshat (2009), which uses graph theory to quantify supply chain vulnerability. The authors assess supply chain vulnerability by identifying three separate drivers of vulnerability: supply side, demand side, and supply chain structure vulnerabilities. The authors use these drivers and apply graph theory to calculate a supply chain vulnerability index. Using this approach, the authors find automotive, information and communication technologies (ICT) and process manufacturing to have higher than average supply chain vulnerability, while wholesale and retail had the lowest vulnerability of those industries looked at by the authors. We will see that the findings of automotive at the high end of vulnerability and retail at the lower end matches the findings in our own study.
Neureuther and Kenyon (2009) develop a model of risk, called the risk assessment index, to evaluate the vulnerability of supply chains, however in this study the authors look at different types of supply chain structures as opposed to industries. The authors risk model derives five important results about the structure of supply chains:
- There is a significant reduction of risk associated with having more than one supplier per subproduct or subservice.
- Adding subproduct diversification does not affect risk, but improves the structural reliability of the supply chain.
- The structural reliability of the supply chain is increased with an increase in the number of suppliers providing the same subproduct or subservice.
- Coordination costs are reduced, as the number of suppliers providing subproducts or subservices are reduced.
- Coordination efficiency is improved, as the number of suppliers providing subproducts or subservices are reduced.
These results show that while diversifying suppliers reduces risks to supply chain disruptions (finding 1) it also increases costs to the firm (finding 4). Diversification is therefore (but in this case by country of supply) looked at as a factor in our supply chain vulnerability index.
While there are other studies that looks at supply chain vulnerability from the firm perspective, usually in business or logistics research there seems to be little if any (apart from the above) that look at supply chain vulnerability from the macroeconomic lens, i.e. which industries in an economy may be more or less vulnerable to disruptions in international supply chains. We now discuss the construction of our own vulnerability index to answer this question.
Construction of the international supply vulnerability and demand vulnerability indices
For this analysis, we construct two separate indices to measure supply chain vulnerability. The fist index identifies industries sensitive to upstream supply shocks, by measuring how reliant different industries of the Canadian economy are on intermediate inputs, both goods and services, and the extent to which those inputs of goods and services are sourced from abroad. The second index looks at the downstream demand for each industry’s output and gauges each industry’s dependence on international markets in the demand for their products and services.
The international supply vulnerability index is constructed with five key components, these include:
- Reliance on intermediate inputs
- Reliance on imports of intermediate inputs
- Reliance on indirect imports (dependence on value added from imports by another Canadian industry)
- Geographic concentration of imports
- Number of imported products on the “Imports of Limited Supply List”
The international demand vulnerability index has three components:
- Reliance on exports
- Geographic concentration of exports
- Reliance on indirect exports (i.e. contributing value added to the exports of another Canadian industry)
For each industry in the Canadian economy, their individual scores are tabulated and averaged to give a final total score for both the international supply and demand index (i.e. each industry is assigned two scores; one for international supply vulnerability and one for international demand vulnerability).
The next section of the report “Data and methodology” gives a more technical in depth look at how the international supply vulnerability index and the international demand vulnerability index are constructed.
Data and methodology
Both indices rely heavily on data from Statistics Canada’s supply/use tablesFootnote 3, as well as their related input output multipliersFootnote 4. In addition, special import supply and use tables which provide detailed data on each industry’s use of imported intermediate inputs were furnished by Statistics Canada’s National Account Division.
Supply and use tables measure the productive structure of the economy. According to Statistics Canada: They trace production of products by domestic industries, combined with imports, through their use as intermediate inputs or as final consumption, investment or exports. The system provides a measure of value added by industry—total output less intermediate inputsFootnote 5 Thus these tables provide us with an industry by industry account of what intermediate goods and services are used to produce each industries goods and services. The Canadian supply and use tables break down the economy into 236 industries, 278 categories of final demand, and 496 product groups. We use the 236 industries for our analysis, however, due to lack of data in some of the accompanying data sets (the input output multipliers, and value added tables) 20 industries are dropped due to lack of data leaving 216 industries in our analysis.
While the supply and use tables allow us to look at detailed data at the industry level, one drawback is that the latest Canadian supply and use tables are for 2016. In order to make our analysis as relevant as possible for policy makers, and because we are most interested in the international component of supply chains, both import data and export data were updated to use the most recent trade data available; 2019 for merchandise data and 2017 for service data (latest year available by individual countries) using the Harmonized System (HS) to supply and use concordance tables and commercial services to supply and use concordance tables, also kindly provided by Statistics Canada.
Concordance of updated trade data to the supply and use industry categories is an arduous task. Import data is concorded at the 10-digit HS level and exports at the 8-HS digit level. This means over 10 thousand HS codes were looked at on the import side and more than 5 thousand on the export side. The first step in updating the data was to concord 2019 HS data backward each year to 2016 data using records of annual HS code changes from Canada Border Services Agency (as each year HS codes are changed and updated). Once the codes were concorded to 2016 HS they were then matched to the 496 product codes used in the supply and use tables using the concordance tables furnished by Statistics Canada. A final step was then to convert these 496 codes to the 216 industry categories by taking the product industry shares from the 2016 supply and use tables and applying these shares to the new 2019/2017 product trade data. For example, if industry X has a 5% share of product Y used as an intermediate in 2016, we assume the same share in 2019, we can then multiply the 2016 industry’s share of product by the 2019 product value and aggregated by industry to get 2019 industry value.
However, there were some difficulties in this three-step concordance process. In some cases, HS codes were not able to be matched up through the concordance tables. These codes were looked at and matched to supply and use products manually where possible. In other instances, the supply and use product categories were more detailed than their HS counterparts resulting in improper concordances. An example of this was the oil and gas extraction industry, as the supply and use product categories for crude oil was more detailed then their matching HS codes, resulting in all trade values under HS2709 (Petroleum Oils And Oils From Bituminous Minerals, Crude) to be categorized under Conventional Crude Oil. Other data sets were needed to be looked at in order to concord this industries trade data properly.
By using the supply and use tables we were able to isolate 216 industries within the Canadian economy and measure both their vulnerability to international upstream supply shocks and downstream international demand disruptions. The creation of each index and the measurement of each individual index component is discussed in turn.
Methodology - International supply vulnerability index
As mentioned above the supply index includes five individual components: reliance on intermediate inputs, imports of intermediate inputs, indirect imports, geographic concentration of imports, and the number of imported products on the “Imports of Limited Supply List”. For each component, industries are given a score from 100 (most vulnerable) to 0 (not vulnerable)Footnote 6. The total index score is the average of the five components. Calculations and data for each component of the supply index is discussed below.
Reliance on intermediate inputs
The more sourcing of intermediate inputs needed for an industry to produce a good or service will make that industry more susceptible to disruption in upstream supply, be it a shutdown in a supplier plant in a country thousands of miles away or a closure of a part provider down the street. To measure reliance on intermediate inputs (both international and domestic) we take each industries use of intermediate inputs and calculate its share of the industry’s overall output, data for both intermediate input use and industry output is provided in the national supply and use tables, for which the latest year of data is 2016.
Reliance on intermediate inputs = Int i / Y i
Where: Int is value of intermediate inputs
Y is value of output
i is industry
Reliance on imports of intermediate inputs
As the purpose of this index is to measure vulnerability to international disruptions in supply outside of Canada, the second component measures the share of intermediates inputs each industry sources through importsFootnote 7. Its is calculated simply as the value of imported inputs divided by total value of inputs used. Data for total inputs used comes from the public supply and use tables while the imported intermediates was obtained from the special import supply and use tables. The import data was updated using 2019 merchandise trade data and 2017 commercial services data concorded to the supply and use industries categories.
Reliance on imports of intermediate inputs = Imp i / Int i
Where: Imp is value of imports of intermediate inputs
Int is value of intermediate inputs
i is industry
Reliance on indirect imports
While an industry or firm may not directly import intermediate goods or services from abroad this does not mean they will be entirely isolated from shocks outside of Canada as they may rely on supplier who in turn sources inputs from abroad or in some cases resell intermediate products purchased abroad. In this sense Canadian industries can be reliant on indirect imports.
To measure each industries exposure to indirect imports we utilize the input output multipliers. Taking each industries output and multiplying by the simple international imports multiplier gives that industries total imports, while multiplying by the direct multiplier gives direct imports. Indirect imports are then derived by subtracting direct imports from total imports. An example of the calculation for the crop production industry is given below:
Example crop production
Output = $37.4 billion
Simple multiplier = 0.195, therefore total imports = $37.4 billion * 0.195 = $7.3 billion
Direct multiplier = 0.12, therefore direct imports =$37.4 billion *0.12 = $4.5 billion
Indirect imports = total imports - direct imports = $7.3 billion -$4.5 billion = $2.8 billion
Reliance on indirect imports = indimp i / Y i
Where: indimp is value of indirect imports
Y is value of output
i is industry
Geographic concentration of imports
Although importing an intermediate input from outside Canada will make an industry vulnerable to potential disruptions, this will also depend on the availability of suppliers for the input in questions. If an input has many suppliers a disruption to one will not be as drastic as that of an input with one single supplier. Similarly, being concentrated on one or few suppliers will make an industry more vulnerable to disruptions within a region or countryFootnote 8. While ideally supplier concentration should be measured at the firm level (i.e. how many potential firms can provide a needed input) for the purpose of this report we simply look at the country concentration of each industries imports. I.e does the industry import from a wide variety of source countries or are imports concentrated from one or two source countries.
To calculate import concentration we use the Herfindahl-Hirschman Index (HHI) on the shares of each of Canada’s country partners in imports of intermediate inputs.
The HHI is calculated as follows:

Where Si is the share of imports of intermediate inputs at time t and i is the country. The closer the index is to one the more concentrated the industry’s imports. To illustrate the calculation, if a Canadian Industry only imported intermediate inputs from one country, the share of imports sourced from that country would be 1 and the index would equal 1.0. Alternatively, if an industry’s imports were divided evenly between 100 different source countries, the index would equal 0.01Footnote 9.
Number of imported products from the “Imports Limited Supply ListFootnote 10
The final component of the supply index provides a tally of possible imports from the limited supply list of 2,100 HS 10 codes deemed to have restrictive supply into Canada.
Jiang (2020), identified products that have limited international supply for CanadaFootnote 11. The motivation for the study was to identify products at a very detailed level within trade data for which all, or a large majority of, Canadian imports are sourced from a single trade partner. The risk would be that such products could be especially susceptible to shortages or disruptions from a shock such as the COVID-19 pandemic and may require extra attention from policy makers to ensure supply.
Jiang (2020), analyzed 10 thousand unique products at the 10-digit level under the Harmonized System (HS) classification and identified over 2000 as vulnerable to supply chain disruptions. It was found that vulnerable products are mainly concentrated in the agri-food sector but are also commonly found in chemicals & fertilizers and metals & minerals.
This list of 2000 products were used as the fifth component of the International Supply Vulnerability Index. While the supply/use tables provided by Statistics Canada allow us to identify which products are imported by each industry, the list of products from these tables does not correspond perfectly with the HS data used in the limited supply list. As the product categories in the supply/use tables are more aggregated, many HS code products can correspond to a single product category. Therefore, we cannot get an exact count of products on the supply list by industry, but a rough indicator of the potential products used by an industry. For example, there are 19 HS codes that correspond to the “wheat” category in the supply us tables. Both the crop production industry and the animal production industry use wheat imports, thus they both have the potential to import these 19 products from the limited supply list. When all the product categories from the supply and use table used by crop production are added together, we find this industry potentially imports 1,123 limited supply products and animal production 1,181.
Methodology - International demand vulnerability index
The three components of the international demand vulnerability index are reliance on exports, geographic concentration of exports, and reliance on indirect exports. As with the supply index, for each component, each of the 216 industries is given a score from 100 (most vulnerable) to 0 (not vulnerable)Footnote 12. The total index score is the average of the three components. Calculations and data for each component of the demand index is discussed below.
Reliance on exports
Unlike the import component of the supply index which looks only at intermediate inputs, on the demand side we measure how important total exports are to each industry in order to gage how important foreign markets are for each industry, regardless if the export is a intermediate or final good or service. The motivation for this is that the more an industry relies on a foreign market, the more prone it could be to international disruptions discussed at the beginning of the report. Reliance on exports is simply the total value of each industry’s total exports (of both goods and services) divided by the industries total value of output. Data on industry output is taken from the supply and use table while exports by supply and use product and industry table was obtained from Statistics Canada. As with imports, concordance tables were used to update the 2016 supply and use data to 2019 for merchandise exports and 2017 for services exports.
Reliance on exports = exp i/ Y i
Where: exp is value of total exports
Y is output
I is industry
Geographic concentration of exports
As with imports, while selling beyond Canadian borders puts Canadian firms at risks to international shocks, theses risks could be mitigated by selling to a diverse range of foreign markets, particularly if the shock is isolated to one or few countries or a specific region. The calculation of export concentration mirrors the measure used in the import concentration component of the supply index. Again we use the Herfindahl-Hirschman Index (HHI), but this time on the shares of each of Canada’s country partners in exports of goods and services of the given industry.
Where Si is the share od domestic exports at time t and i is the country.
Reliance on indirect exports
Even if a Canadian firm is not reliant on exports to foreign markets directly, it may be indirectly impacted by an international shock if it has exposure to foreign markets further down its downstream supply chain. i.e. the firm provides value-added to another firm or industry which in turn exports a good or service outside of Canada, we term this as indirect exports.
To measure each industries reliance on indirect exports we use Statistics Canada’s value added in exports tableFootnote 13. This table provides each industry’s total value -added exports as well as their direct value added exports. Indirect exports are then calculated by taking the difference between total and direct value-added exports. For each industry, its calculated indirect exports are than divided by industry output from the supply and use table.
Reliance on indirect exports = indexp I / Y i
Where: indexp is the value of indirect exports
Y is output
i is industry
There are a number of factors that are important to consider when developing an index, including which measures are used in the index and the weights given to those measures. Annex A describes a number of robustness tests that were performed to validate the construction of the index. By-and-large, the index components were found to be uncorrelated and the index is robust to different weights being used in the index construction process.
Findings of the international supply vulnerability and demand vulnerability indices
Figure 3. Industry mapping of vulnerability to international demand and supply disruptions

Text version
| Industry | Supply vulnerability score | Demand vulnerability score | Industry output, thousands $ |
|---|---|---|---|
| Crop production (except cannabis, greenhouse, nursery and floriculture production) | 55 | 29 | 37,433,400 |
| Greenhouse, nursery and floriculture production (except cannabis) | 51 | 41 | 3,841,707 |
| Animal production (except aquaculture) | 63 | 30 | 26,290,889 |
| Aquaculture | 49 | 38 | 1,402,184 |
| Forestry and logging | 53 | 37 | 10,558,914 |
| Fishing, hunting and trapping | 51 | 44 | 3,417,604 |
| Support activities for crop and animal production | 34 | 33 | 1,307,483 |
| Support activities for forestry | 50 | 28 | 2,066,200 |
| Oil and gas extraction (except oil sands) | 50 | 55 | 44,309,659 |
| Oil sands extraction | 49 | 60 | 43,940,544 |
| Coal mining | 47 | 35 | 4,166,947 |
| Iron ore mining | 51 | 37 | 3,411,462 |
| Gold and silver ore mining | 47 | 39 | 8,011,061 |
| Copper, nickel, lead and zinc ore mining | 42 | 46 | 9,241,948 |
| Other metal ore mining | 42 | 34 | 2,363,453 |
| Stone mining and quarrying | 45 | 38 | 1,734,042 |
| Sand, gravel, clay, and ceramic and refractory minerals mining and quarrying | 45 | 38 | 1,632,789 |
| Diamond mining | 49 | 44 | 1,870,923 |
| Other non-metallic mineral mining and quarrying (except diamond and potash) | 39 | 60 | 1,391,143 |
| Potash mining | 39 | 42 | 4,047,517 |
| Support activities for oil and gas extraction | 48 | 33 | 13,853,219 |
| Support activities for mining | 41 | 28 | 5,204,726 |
| Electric power generation, transmission and distribution | 41 | 44 | 48,657,364 |
| Natural gas distribution | 32 | 33 | 5,920,190 |
| Water, sewage and other systems | 47 | 24 | 668,981 |
| Other activities of the construction industry | 34 | 30 | 4,159,121 |
| Animal food manufacturing | 67 | 20 | 8,304,690 |
| Grain and oilseed milling | 65 | 41 | 11,219,471 |
| Sugar and confectionery product manufacturing | 56 | 56 | 4,336,415 |
| Fruit and vegetable preserving and specialty food manufacturing | 62 | 33 | 6,925,932 |
| Dairy product manufacturing | 61 | 17 | 14,660,757 |
| Meat product manufacturing | 63 | 18 | 27,890,148 |
| Seafood product preparation and packaging | 58 | 43 | 6,165,594 |
| Bakeries and tortilla manufacturing | 58 | 49 | 10,055,695 |
| Other food manufacturing | 58 | 38 | 10,518,617 |
| Soft drink and ice manufacturing | 56 | 33 | 4,645,360 |
| Breweries | 47 | 36 | 6,210,622 |
| Wineries and distilleries | 48 | 40 | 2,546,034 |
| Tobacco manufacturing | 37 | 33 | 2,279,959 |
| Textile and textile product mills | 51 | 34 | 3,668,507 |
| Clothing and leather and allied product manufacturing | 47 | 34 | 3,035,961 |
| Sawmills and wood preservation | 54 | 34 | 16,261,232 |
| Veneer, plywood and engineered wood product manufacturing | 55 | 43 | 6,760,993 |
| Other wood product manufacturing | 53 | 33 | 8,283,526 |
| Pulp, paper and paperboard mills | 54 | 44 | 16,841,087 |
| Converted paper product manufacturing | 62 | 47 | 10,264,272 |
| Printing and related support activities | 50 | 26 | 9,736,970 |
| Petroleum refineries | 62 | 42 | 50,773,313 |
| Petroleum and coal product manufacturing (except petroleum refineries) | 67 | 60 | 5,299,325 |
| Basic chemical manufacturing | 60 | 45 | 15,800,723 |
| Resin, synthetic rubber, and artificial and synthetic fibres and filaments manufacturing | 58 | 55 | 9,871,637 |
| Pesticide, fertilizer and other agricultural chemical manufacturing | 53 | 48 | 5,799,206 |
| Pharmaceutical and medicine manufacturing | 50 | 45 | 13,118,459 |
| Paint, coating and adhesive manufacturing | 59 | 42 | 3,035,551 |
| Soap, cleaning compound and toilet preparation manufacturing | 54 | 46 | 4,598,223 |
| Other chemical product manufacturing | 62 | 43 | 5,271,873 |
| Plastic product manufacturing | 64 | 48 | 24,741,720 |
| Rubber product manufacturing | 58 | 55 | 5,082,774 |
| Non-metallic mineral product manufacturing (except cement and concrete products) | 54 | 42 | 6,197,995 |
| Cement and concrete product manufacturing | 52 | 39 | 9,994,035 |
| Iron and steel mills and ferro-alloy manufacturing | 64 | 47 | 10,952,517 |
| Steel product manufacturing from purchased steel | 57 | 51 | 4,577,273 |
| Alumina and aluminum production and processing | 59 | 54 | 11,991,003 |
| Non-ferrous metal (except aluminum) production and processing | 62 | 45 | 35,628,154 |
| Foundries | 55 | 47 | 2,456,284 |
| Forging and stamping | 52 | 44 | 1,385,726 |
| Cutlery, hand tools and other fabricated metal product manufacturing | 51 | 40 | 5,829,573 |
| Architectural and structural metals manufacturing | 57 | 38 | 15,243,536 |
| Boiler, tank and shipping container manufacturing | 53 | 37 | 3,609,165 |
| Hardware manufacturing | 53 | 57 | 1,733,401 |
| Spring and wire product manufacturing | 52 | 48 | 1,074,288 |
| Machine shops, turned product, and screw, nut and bolt manufacturing | 49 | 40 | 5,915,857 |
| Coating, engraving, cold and heat treating and allied activities | 49 | 48 | 2,217,899 |
| Agricultural, construction and mining machinery manufacturing | 53 | 37 | 8,692,907 |
| Industrial machinery manufacturing | 49 | 50 | 4,183,966 |
| Commercial and service industry machinery manufacturing | 47 | 41 | 4,927,509 |
| Ventilation, heating, air-conditioning and commercial refrigeration equipment manufacturing | 50 | 54 | 3,697,945 |
| Metalworking machinery manufacturing | 47 | 47 | 4,275,760 |
| Engine, turbine and power transmission equipment manufacturing | 55 | 43 | 1,622,503 |
| Other general-purpose machinery manufacturing | 53 | 48 | 7,875,430 |
| Computer and peripheral equipment manufacturing | 44 | 45 | 715,149 |
| Communications equipment manufacturing | 46 | 34 | 3,488,307 |
| Other electronic product manufacturing | 46 | 40 | 6,344,603 |
| Semiconductor and other electronic component manufacturing | 48 | 40 | 3,957,123 |
| Electric lighting equipment manufacturing | 49 | 57 | 1,225,330 |
| Household appliance manufacturing | 51 | 48 | 572,411 |
| Electrical equipment manufacturing | 50 | 45 | 5,129,226 |
| Other electrical equipment and component manufacturing | 57 | 43 | 4,145,843 |
| Automobile and light-duty motor vehicle manufacturing | 65 | 61 | 65,989,013 |
| Heavy-duty truck manufacturing | 63 | 59 | 2,900,018 |
| Motor vehicle body and trailer manufacturing | 58 | 46 | 3,406,352 |
| Motor vehicle gasoline engine and engine parts manufacturing | 58 | 64 | 5,585,508 |
| Motor vehicle electrical and electronic equipment manufacturing | 49 | 43 | 1,562,311 |
| Motor vehicle steering and suspension components (except spring) manufacturing | 59 | 54 | 2,257,822 |
| Motor vehicle brake system manufacturing | 54 | 54 | 673,370 |
| Motor vehicle transmission and power train parts manufacturing | 55 | 54 | 4,438,183 |
| Motor vehicle seating and interior trim manufacturing | 63 | 47 | 6,133,063 |
| Motor vehicle metal stamping | 57 | 63 | 6,767,653 |
| Other motor vehicle parts manufacturing | 56 | 54 | 5,493,964 |
| Aerospace product and parts manufacturing | 59 | 46 | 23,558,294 |
| Railroad rolling stock manufacturing | 59 | 26 | 2,157,278 |
| Ship and boat building | 47 | 26 | 2,028,133 |
| Other transportation equipment manufacturing | 59 | 40 | 5,903,166 |
| Household and institutional furniture and kitchen cabinet manufacturing | 50 | 45 | 6,758,901 |
| Office furniture (including fixtures) manufacturing | 51 | 46 | 4,563,096 |
| Other furniture-related product manufacturing | 52 | 31 | 1,244,025 |
| Medical equipment and supplies manufacturing | 48 | 31 | 4,002,630 |
| Other miscellaneous manufacturing | 57 | 32 | 10,074,416 |
| Farm product merchant wholesalers | 34 | 25 | 3,855,278 |
| Petroleum and petroleum products merchant wholesalers | 36 | 25 | 6,734,500 |
| Food, beverage and tobacco merchant wholesalers | 40 | 20 | 21,833,062 |
| Personal and household goods merchant wholesalers | 38 | 18 | 27,199,156 |
| Motor vehicle and motor vehicle parts and accessories merchant wholesalers | 39 | 27 | 19,249,433 |
| Building material and supplies merchant wholesalers | 33 | 24 | 22,275,052 |
| Machinery, equipment and supplies merchant wholesalers | 32 | 23 | 37,436,979 |
| Miscellaneous merchant wholesalers | 42 | 27 | 19,458,808 |
| Business-to-business electronic markets, and agents and brokers | 33 | 32 | 5,004,281 |
| Motor vehicle and parts dealers | 32 | 18 | 24,901,579 |
| Furniture and home furnishings stores | 37 | 15 | 7,999,641 |
| Electronics and appliance stores | 32 | 19 | 5,305,653 |
| Building material and garden equipment and supplies dealers | 32 | 22 | 12,264,499 |
| Food and beverage stores | 33 | 17 | 30,106,054 |
| Health and personal care stores | 33 | 17 | 17,508,690 |
| Gasoline stations | 33 | 17 | 9,759,700 |
| Clothing and clothing accessories stores | 35 | 15 | 17,309,080 |
| Sporting goods, hobby, book and music stores | 33 | 18 | 5,175,414 |
| General merchandise stores | 33 | 13 | 16,379,360 |
| Miscellaneous store retailers (except cannabis) | 35 | 15 | 6,893,547 |
| Non-store retailers | 39 | 14 | 6,223,714 |
| Air transportation | 51 | 27 | 23,310,421 |
| Rail transportation | 38 | 44 | 13,504,217 |
| Water transportation | 59 | 36 | 5,031,175 |
| Truck transportation | 49 | 31 | 56,466,293 |
| Urban transit systems | 48 | 22 | 4,894,054 |
| Other transit and ground passenger transportation and scenic and sightseeing transportation | 41 | 24 | 4,070,806 |
| Taxi and limousine service | 44 | 17 | 2,540,369 |
| Crude oil and other pipeline transportation | 35 | 56 | 6,220,148 |
| Pipeline transportation of natural gas | 30 | 46 | 5,969,742 |
| Support activities for transportation | 50 | 29 | 33,841,436 |
| Postal service | 28 | 37 | 4,820,016 |
| Couriers and messengers | 45 | 23 | 9,506,929 |
| Warehousing and storage | 30 | 32 | 4,493,864 |
| Newspaper publishers | 40 | 28 | 3,594,492 |
| Periodical, book and directory publishers | 44 | 35 | 4,146,155 |
| Software publishers | 30 | 26 | 9,978,798 |
| Motion picture and video industries (except exhibition) | 54 | 43 | 8,764,041 |
| Motion picture and video exhibition | 54 | 21 | 1,637,893 |
| Sound recording industries | 58 | 28 | 934,053 |
| Radio and television broadcasting | 51 | 32 | 3,745,449 |
| Pay and specialty television | 59 | 30 | 4,234,168 |
| Telecommunications | 36 | 21 | 58,978,167 |
| Data processing, hosting, and related services | 30 | 30 | 5,367,167 |
| Other information services | 45 | 29 | 3,567,253 |
| Banking and other depository credit intermediation | 28 | 20 | 88,491,327 |
| Local credit unions | 35 | 12 | 7,978,128 |
| Non-depository credit intermediation | 42 | 16 | 12,761,506 |
| Activities related to credit intermediation | 37 | 19 | 5,917,462 |
| Financial investment services, funds and other financial vehicles | 43 | 18 | 57,726,931 |
| Insurance carriers | 35 | 12 | 44,168,999 |
| Agencies, brokerages and other insurance related activities | 31 | 12 | 15,457,201 |
| Lessors of real estate | 31 | 19 | 98,831,555 |
| Offices of real estate agents and brokers and activities related to real estate | 37 | 13 | 32,037,319 |
| Automotive equipment rental and leasing | 32 | 31 | 6,221,590 |
| Rental and leasing services (except automotive equipment) | 35 | 28 | 12,431,064 |
| Lessors of non-financial intangible assets (except copyrighted works) | 38 | 34 | 3,625,695 |
| Legal services | 29 | 27 | 20,048,935 |
| Accounting, tax preparation, bookkeeping and payroll services | 31 | 26 | 19,151,405 |
| Architectural, engineering and related services | 32 | 25 | 35,570,709 |
| Specialized design services | 33 | 24 | 2,813,154 |
| Computer systems design and related services | 32 | 29 | 49,109,065 |
| Management, scientific and technical consulting services | 31 | 29 | 20,248,795 |
| Scientific research and development services | 30 | 35 | 7,458,554 |
| Advertising, public relations, and related services | 34 | 35 | 9,937,121 |
| Other professional, scientific and technical services | 36 | 23 | 14,682,744 |
| Holding companies | 37 | 25 | 19,999,033 |
| Office administrative services | 31 | 38 | 14,290,937 |
| Facilities and other support services | 32 | 41 | 12,120,813 |
| Employment services | 32 | 26 | 12,955,974 |
| Business support services | 31 | 40 | 8,302,297 |
| Travel arrangement and reservation services | 34 | 20 | 5,143,123 |
| Investigation and security services | 29 | 23 | 7,054,111 |
| Services to buildings and dwellings | 40 | 8 | 18,303,647 |
| Waste management and remediation services | 34 | 23 | 11,568,373 |
| Educational services | 34 | 19 | 6,653,368 |
| Offices of physicians | 38 | 18 | 32,831,339 |
| Offices of dentists | 42 | 22 | 15,776,154 |
| Miscellaneous ambulatory health care services | 36 | 25 | 12,605,411 |
| Nursing and residential care facilities | 36 | 0 | 8,208,120 |
| Performing arts, spectator sports and related industries, and heritage institutions | 47 | 20 | 9,457,486 |
| Amusement and recreation industries | 46 | 24 | 9,559,759 |
| Gambling industries | 47 | 14 | 6,731,063 |
| Traveller accommodation | 44 | 25 | 17,718,615 |
| Recreational vehicle (RV) parks, recreational camps, and rooming and boarding houses | 41 | 22 | 3,069,757 |
| Food services and drinking places | 51 | 18 | 71,526,961 |
| Automotive repair and maintenance | 39 | 18 | 12,409,833 |
| Repair and maintenance (except automotive) | 38 | 24 | 10,842,174 |
| Personal care services and other personal services | 41 | 8 | 10,908,026 |
| Funeral services | 39 | 13 | 2,075,106 |
| Dry cleaning and laundry services | 49 | 22 | 2,324,676 |
| Business, professional and other membership organizations | 33 | 14 | 4,482,383 |
| Educational services | 42 | 14 | 5,474,171 |
| Ambulatory health care services | 43 | 15 | 2,250,666 |
| Arts, entertainment and recreation | 44 | 6 | 2,314,797 |
| Religious organizations | 35 | 5 | 5,923,281 |
| Grant-making, civic, and professional and similar organizations | 40 | 5 | 15,510,038 |
| Other non-profit institutions serving households | 40 | 14 | 6,202,009 |
| Elementary and secondary schools | 34 | 16 | 61,208,142 |
| Community colleges and C.E.G.E.P.s | 36 | 22 | 61,208,142 |
| Universities | 35 | 15 | 43,782,345 |
| Hospitals | 38 | 16 | 97,371,930 |
| Nursing and residential care facilities | 35 | 0 | 16,072,519 |
| Defence services | 43 | 24 | 20,421,312 |
| Other federal government services (except defence) | 43 | 18 | 55,003,599 |
| Other provincial and territorial government services | 48 | 15 | 122,107,633 |
| Other municipal government services | 42 | 15 | 85,509,678 |
| Other aboriginal government services | 32 | 5 | 7,300,242 |
Figure 3 maps the results of these two indices. The vertical axis of the chart plots each industry’s score on the international demand vulnerability index, while the international supply vulnerability index score is plotted on the horizontal axis. Thus, the higher the industry on the chart the more vulnerable to international demand disruptions, while the further right the industry, the more vulnerable it is to supply shocks. In addition, each industry is represented by a bubble, the bubble’s size represents the Industry’s output to give an indication of the overall size of the industry in the Canadian economy.
Figure 3 is divided into 4 quadrantsFootnote 14 to provide easier illustration of how different industries of the Canadian economy are vulnerable to both international demand and supply constraints. We will focus on each quadrant in turn and look at some of the important and interesting industries of the Canadian economy in each.
Canadian industries with low exposure to both international supply and demand disruptions
In the bottom left quadrant, we find Canadian industries that are relatively more domestic focused with little to no exposure to international markets for either demand or supply (i.e. they score relatively low on both the demand and supply index). Figure 4 gives a closer view of the industries found in this bottom corner quadrant.
Figure 4. Industries with low vulnerability to both international demand and supply disruptions

Text version
| Industry | Supply vulnerability score | Demand vulnerability score | Industry output, thousands $ |
|---|---|---|---|
| Banking and other depository credit intermediation | 28 | 20 | 88,491,327 |
| Legal services | 29 | 27 | 20,048,935 |
| Investigation and security services | 29 | 23 | 7,054,111 |
| Gasoline stations | 30 | 17 | 9,759,700 |
| Software publishers | 30 | 26 | 9,978,798 |
| Warehousing and storage | 30 | 32 | 4,493,864 |
| Data processing, hosting, and related services | 30 | 30 | 5,367,167 |
| Accounting, tax preparation, bookkeeping and payroll services | 31 | 26 | 19,151,405 |
| Agencies, brokerages and other insurance related activities | 31 | 12 | 15,457,201 |
| Management, scientific and technical consulting services | 31 | 29 | 20,248,795 |
| Lessors of real estate | 31 | 19 | 98,831,555 |
| Automotive equipment rental and leasing | 32 | 31 | 6,221,590 |
| Computer systems design and related services | 32 | 29 | 49,109,065 |
| Architectural, engineering and related services | 32 | 25 | 35,570,709 |
| Other aboriginal government services | 32 | 5 | 7,300,242 |
| Motor vehicle and parts dealers | 32 | 18 | 24,901,579 |
| Machinery, equipment and supplies merchant wholesalers | 32 | 23 | 37,436,979 |
| Building material and garden equipment and supplies dealers | 32 | 22 | 12,264,499 |
| Electronics and appliance stores | 32 | 19 | 5,305,653 |
| Employment services | 32 | 26 | 12,955,974 |
| Specialized design services | 33 | 24 | 2,813,154 |
| Sporting goods, hobby, book and music stores | 33 | 18 | 5,175,414 |
| General merchandise stores | 33 | 13 | 16,379,360 |
| Building material and supplies merchant wholesalers | 33 | 24 | 22,275,052 |
| Health and personal care stores | 33 | 17 | 17,508,690 |
| Business-to-business electronic markets, and agents and brokers | 33 | 32 | 5,004,281 |
| Business, professional and other membership organizations | 33 | 14 | 4,482,383 |
| Food and beverage stores | 33 | 17 | 30,106,054 |
| Travel arrangement and reservation services | 34 | 20 | 5,143,123 |
| Elementary and secondary schools | 34 | 16 | 61,208,142 |
| Waste management and remediation services | 34 | 23 | 11,568,373 |
| Farm product merchant wholesalers | 34 | 25 | 3,855,278 |
| Educational services | 34 | 19 | 6,653,368 |
| Other activities of the construction industry | 34 | 30 | 4,159,121 |
| Miscellaneous store retailers (except cannabis) | 35 | 15 | 6,893,547 |
| Local credit unions | 35 | 12 | 7,978,128 |
| Religious organizations | 35 | 5 | 5,923,281 |
| Insurance carriers | 35 | 12 | 44,168,999 |
| Nursing and residential care facilities | 35 | 0 | 16,072,519 |
| Rental and leasing services (except automotive equipment) | 35 | 28 | 12,431,064 |
| Clothing and clothing accessories stores | 35 | 15 | 17,309,080 |
| Universities | 35 | 15 | 43,782,345 |
| Nursing and residential care facilities | 36 | 0 | 8,208,120 |
| Telecommunications | 36 | 21 | 58,978,167 |
| Community colleges and C.E.G.E.P.s | 36 | 22 | 11,988,234 |
| Petroleum and petroleum products merchant wholesalers | 36 | 25 | 6,734,500 |
| Miscellaneous ambulatory health care services | 36 | 25 | 12,605,411 |
| Other professional, scientific and technical services | 36 | 23 | 14,682,744 |
| Offices of real estate agents and brokers and activities related to real estate | 37 | 13 | 32,037,319 |
| Holding companies | 37 | 25 | 19,999,033 |
| Furniture and home furnishings stores | 37 | 15 | 7,999,641 |
| Activities related to credit intermediation | 37 | 19 | 5,917,462 |
| Offices of physicians | 38 | 18 | 32,831,339 |
| Repair and maintenance (except automotive) | 38 | 24 | 10,842,174 |
| Hospitals | 38 | 16 | 97,371,930 |
| Personal and household goods merchant wholesalers | 38 | 18 | 27,199,156 |
| Non-store retailers | 39 | 14 | 6,223,714 |
| Automotive repair and maintenance | 39 | 18 | 12,409,833 |
| Funeral services | 39 | 13 | 2,075,106 |
| Motor vehicle and motor vehicle parts and accessories merchant wholesalers | 39 | 27 | 19,249,433 |
| Grant-making, civic, and professional and similar organizations | 40 | 5 | 15,510,038 |
| Food, beverage and tobacco merchant wholesalers | 40 | 20 | 21,833,062 |
| Newspaper publishers | 40 | 28 | 3,594,492 |
| Services to buildings and dwellings | 40 | 8 | 18,303,647 |
| Other non-profit institutions serving households | 40 | 14 | 6,202,009 |
| Personal care services and other personal services | 41 | 8 | 10,908,026 |
| Recreational vehicle (RV) parks, recreational camps, and rooming and boarding houses | 41 | 22 | 3,069,757 |
| Other transit and ground passenger transportation and scenic and sightseeing transportation | 41 | 24 | 4,070,806 |
| Support activities for mining | 41 | 28 | 5,204,726 |
| Miscellaneous merchant wholesalers | 42 | 27 | 19,458,808 |
| Educational services | 42 | 14 | 5,474,171 |
| Non-depository credit intermediation | 42 | 16 | 12,761,506 |
| Other municipal government services | 42 | 15 | 85,509,678 |
| Offices of dentists | 42 | 15 | 85,509,678 |
| Other federal government services (except defence) | 43 | 18 | 55,003,599 |
| Financial investment services, funds and other financial vehicles | 43 | 18 | 57,726,931 |
| Defence services | 43 | 24 | 20,421,312 |
| Ambulatory health care services | 43 | 15 | 2,250,666 |
| Taxi and limousine service | 44 | 17 | 2,540,369 |
| Arts, entertainment and recreation | 44 | 6 | 2,314,797 |
| Traveller accommodation | 44 | 25 | 17,718,615 |
| Couriers and messengers | 45 | 23 | 9,506,929 |
| Other information services | 45 | 29 | 3,567,253 |
This quadrant is dominated by professional, education, health, and other service industries, which require little international inputs and sell mainly to the domestic Canadian market. Many retailFootnote 15 and wholesale related industries are also found in this quadrant along with federal and municipal government services.
Telecommunications is one of the industries found in this quadrant and gives a good example of how the demand and supply index scores are calculated. On the demand side, telecommunications ranks near the bottom of the index, 163th out of 216 industries. Telecom exports were only 4% of industry output and these exports were relatively diverse with 48% destined to the United States (the industry average is 70%), while indirect exports also accounted for 4% of industry output. In the range of 0 to 100, zero being relatively immune to international demand and 100 being as vulnerable as possible, telecom’s final demand index score was 21. On the supply side, telecom ranked 175thon the index. While intermediate inputs accounted for a significant portion of output, 42%, only 30% of these inputs were imported and indirect imports accounted for 11% of industry output. 57% of total telecom imports were destined from the U.S., close to the industry average of 58%, and the industry imported a relatively low potential number of products on the limited supply list. The Five supply side indicators taken together give telecommunications a supply index score of 36 (from of a possible range of 0 to 100).
Although the industries found in figure 4 are isolated from supply and demand disruptions based on the components of the two indices, this does not necessarily mean that COVID-19 or other international disruptions might not impact these industries in other ways. For example, universities are found in this quadrant, and while this sector of the economy may not depend on imports or exports, changes in mobility of international students could have a significant impact on the industry. Banking is another example, while focused on Canadian consumers and not reliant on imports of intermediate inputs, this industry could be susceptible to shocks in global financial markets. Indeed, one can pick any industry in this “safe” quadrant and likely think of many ways it could be impacted by international shocks, such as COVID-19, that are outside the scope of the demand and supply indices in this analysis.
Canadian industries vulnerable to both international demand and supply disruptions
In the upper-right quadrant of figure 3 we find the Canadian industries most vulnerable to both international demand and supply disruptions. Much of the inputs into these industries are sourced from abroad, while much of the output of these industries is sold to markets outside of Canada. Figure 5 expands this upper right quadrant to give a better look at which industries fall into this quadrant.
Figure 5: Industries vulnerable to international supply and demand disruptions

Text version
| Industry | Supply vulnerability score | Demand vulnerability score | Industry output, thousands $ |
|---|---|---|---|
| Sand, gravel, clay, and ceramic and refractory minerals mining and quarrying | 45 | 38 | 1,632,789 |
| Stone mining and quarrying | 45 | 38 | 1,734,042 |
| Communications equipment manufacturing | 46 | 34 | 3,488,307 |
| Other electronic product manufacturing | 46 | 40 | 6,344,603 |
| Gold and silver ore mining | 47 | 39 | 8,011,061 |
| Coal mining | 47 | 35 | 4,166,947 |
| Breweries | 47 | 36 | 6,210,622 |
| Clothing and leather and allied product manufacturing | 47 | 34 | 3,035,961 |
| Commercial and service industry machinery manufacturing | 47 | 41 | 4,927,509 |
| Metalworking machinery manufacturing | 47 | 47 | 4,275,760 |
| Support activities for oil and gas extraction | 48 | 33 | 13,853,219 |
| Semiconductor and other electronic component manufacturing | 48 | 40 | 3,957,123 |
| Wineries and distilleries | 48 | 40 | 2,546,034 |
| Coating, engraving, cold and heat treating and allied activities | 49 | 48 | 2,217,899 |
| Machine shops, turned product, and screw, nut and bolt manufacturing | 49 | 40 | 5,915,857 |
| Electric lighting equipment manufacturing | 49 | 57 | 1,225,330 |
| Motor vehicle electrical and electronic equipment manufacturing | 49 | 43 | 1,562,311 |
| Industrial machinery manufacturing | 49 | 50 | 4,183,966 |
| Diamond mining | 49 | 44 | 1,870,923 |
| Aquaculture | 49 | 38 | 1,402,184 |
| Oil sands extraction | 49 | 60 | 43,940,544 |
| Ventilation, heating, air-conditioning and commercial refrigeration equipment manufacturing | 50 | 54 | 3,697,945 |
| Household and institutional furniture and kitchen cabinet manufacturing | 50 | 45 | 6,758,901 |
| Electrical equipment manufacturing | 50 | 45 | 5,129,226 |
| Oil and gas extraction (except oil sands) | 50 | 55 | 44,309,659 |
| Pharmaceutical and medicine manufacturing | 50 | 45 | 13,118,459 |
| Radio and television broadcasting | 51 | 32 | 3,745,449 |
| Iron ore mining | 51 | 37 | 3,411,462 |
| Textile and textile product mills | 51 | 34 | 3,668,507 |
| Household appliance manufacturing | 51 | 48 | 572,411 |
| Office furniture (including fixtures) manufacturing | 51 | 46 | 4,563,096 |
| Fishing, hunting and trapping | 51 | 44 | 3,417,604 |
| Greenhouse, nursery and floriculture production (except cannabis) | 51 | 41 | 3,841,707 |
| Cutlery, hand tools and other fabricated metal product manufacturing | 51 | 40 | 5,829,573 |
| Forging and stamping | 52 | 44 | 1,385,726 |
| Cement and concrete product manufacturing | 52 | 39 | 9,994,035 |
| Spring and wire product manufacturing | 52 | 48 | 1,074,288 |
| Forestry and logging | 53 | 37 | 10,558,914 |
| Other wood product manufacturing | 53 | 33 | 8,283,526 |
| Agricultural, construction and mining machinery manufacturing | 53 | 37 | 8,692,907 |
| Pesticide, fertilizer and other agricultural chemical manufacturing | 53 | 48 | 5,799,206 |
| Other general-purpose machinery manufacturing | 53 | 48 | 7,875,430 |
| Hardware manufacturing | 53 | 57 | 1,733,401 |
| Boiler, tank and shipping container manufacturing | 53 | 37 | 3,609,165 |
| Motion picture and video industries (except exhibition) | 54 | 43 | 8,764,041 |
| Motor vehicle brake system manufacturing | 54 | 54 | 673,370 |
| Non-metallic mineral product manufacturing (except cement and concrete products) | 54 | 42 | 6,197,995 |
| Soap, cleaning compound and toilet preparation manufacturing | 54 | 46 | 4,598,223 |
| Sawmills and wood preservation | 54 | 34 | 16,261,232 |
| Pulp, paper and paperboard mills | 54 | 44 | 16,841,087 |
| Engine, turbine and power transmission equipment manufacturing | 55 | 43 | 1,622,503 |
| Veneer, plywood and engineered wood product manufacturing | 55 | 43 | 6,760,993 |
| Motor vehicle transmission and power train parts manufacturing | 55 | 54 | 4,438,183 |
| Foundries | 55 | 47 | 2,456,284 |
| Soft drink and ice manufacturing | 56 | 33 | 4,645,360 |
| Sugar and confectionery product manufacturing | 56 | 56 | 4,336,415 |
| Other motor vehicle parts manufacturing | 56 | 54 | 5,493,964 |
| Other miscellaneous manufacturing | 57 | 32 | 10,074,416 |
| Architectural and structural metals manufacturing | 57 | 38 | 15,243,536 |
| Steel product manufacturing from purchased steel | 57 | 51 | 4,577,273 |
| Other electrical equipment and component manufacturing | 57 | 43 | 4,145,843 |
| Motor vehicle metal stamping | 57 | 63 | 6,767,653 |
| Other food manufacturing | 58 | 38 | 10,518,617 |
| Resin, synthetic rubber, and artificial and synthetic fibres and filaments manufacturing | 58 | 55 | 9,871,637 |
| Motor vehicle gasoline engine and engine parts manufacturing | 58 | 64 | 5,585,508 |
| Bakeries and tortilla manufacturing | 58 | 49 | 10,055,695 |
| Motor vehicle body and trailer manufacturing | 58 | 46 | 3,406,352 |
| Rubber product manufacturing | 58 | 55 | 5,082,774 |
| Seafood product preparation and packaging | 58 | 43 | 6,165,594 |
| Water transportation | 59 | 36 | 5,031,175 |
| Motor vehicle steering and suspension components (except spring) manufacturing | 59 | 54 | 2,257,822 |
| Paint, coating and adhesive manufacturing | 59 | 42 | 3,035,551 |
| Other transportation equipment manufacturing | 59 | 40 | 5,903,166 |
| Alumina and aluminum production and processing | 59 | 54 | 11,991,003 |
| Aerospace product and parts manufacturing | 59 | 46 | 23,558,294 |
| Basic chemical manufacturing | 60 | 45 | 15,800,723 |
| Petroleum refineries | 62 | 42 | 50,773,313 |
| Non-ferrous metal (except aluminum) production and processing | 62 | 45 | 35,628,154 |
| Fruit and vegetable preserving and specialty food manufacturing | 62 | 33 | 6,925,932 |
| Converted paper product manufacturing | 62 | 47 | 10,264,272 |
| Other chemical product manufacturing | 62 | 43 | 5,271,873 |
| Heavy-duty truck manufacturing | 63 | 59 | 2,900,018 |
| Motor vehicle seating and interior trim manufacturing | 63 | 47 | 6,133,063 |
| Iron and steel mills and ferro-alloy manufacturing | 64 | 47 | 10,952,517 |
| Plastic product manufacturing | 64 | 48 | 24,741,720 |
| Automobile and light-duty motor vehicle manufacturing | 65 | 61 | 65,989,013 |
| Grain and oilseed milling | 65 | 41 | 11,219,471 |
| Petroleum and coal product manufacturing (except petroleum refineries) | 67 | 60 | 5,299,325 |
While this quadrant contains the most industries, 87 of the 216 (or 40%), these 87 industries accounting for 25% of total output (see figure 6). Many of these industries, 69 of 87, are manufacturing or manufacturing related industries. Canadian manufacturing has undergone significant challenges and changes throughout the years. It is already a shrinking part of the Canadian economy, with its share of GDP falling from 16% in 2000 to 10% in 2019. Figure 5 illustrates that Canadian manufacturers are also some of the most vulnerable to shocks in international supply chains.
| Quadrant | Number of industries in quadrant | Share of number of industries | Share of total output |
|---|---|---|---|
| 1. Low vulnerability to demand and supply | 80 | 37% | 53% |
| 2. High vulnerability to demand and supply | 87 | 40% | 25% |
| 3. High demand and low supply vulnerability | 22 | 10% | 6% |
| 4. High supply and low demand vulnerability | 27 | 13% | 16% |
| Total | 216 | 100% | 100% |
Automobile and light-duty vehicle manufacturing, the largest industry in this quadrant, provides a great example of the extent manufacturing depends on international supply chains. Automobile manufacturing ranks fourth highest on the Supply Vulnerability Index (see figure 7). Unsurprisingly this industry has a heavy reliance on intermediate inputs, as a wide array of auto parts are needed to produce a car. Intermediate inputs were equivalent to 86% of output, 64% of which were imported. Indirect imports accounted for a further 9% of output. 75% of auto manufacturing imports of intermediates were sourced from the United States resulting in a high score of vulnerability based on supply concertation. In addition, this industry potentially imports 589 products from the limited supply list, giving it a total index score of 65 suggesting a greater probability that a disruption to one supplier or part could be problematic. On the demand side, automobile and light-duty vehicle manufacturing ranks 3rd as the most vulnerable industry to international demand disruptions with a demand index score of 61 (see figure 8). Exports are equivalent to 86% of the industry’s output, and its exports are highly geographically concentrated, with 96% of the industry’s exports destined to the United States. While the auto industry has insignificant indirect exports, less than 0.1%, its high scores in the export and export concentration push it upwards on the demand index.
Do lawyers export? - Indirect exports
While some industries in the Canadian economy may not be directly reliant on exports, they may provide value added to the exports od other industries in the Canadian economy. This value added can be in the form of goods or services used to produce exported products of another industry (example car parts used in exported automobiles) or it could be a finished product which is exported by an other industry (for example a consumer product produced by one industry and sold to a wholesaler who exports it as is). In this way these industries can be said to have indirect exports. Using data from Statistics Canada trade in value added tables, we can measure the share of these indirect exports in each industry’s output, this is used for the third component of the International Demand Vulnerability Index.
Legal services provide a good illustration, while this industry is mainly domestic focused with direct exports accounting for only 6% of output. Indirect exports account for another 9% of industry output. This industry provides services to other sectors of the Canadian economy who in turn produce goods and services for export. In this way legal services provides value-added to other industry exports, for the purpose of this analysis we consider this value-added to be indirect exports of the legal services industry.
| Vulnerability ranking | Industry | Reliance on intermediate inputs score | Reliance on imports of intermediate inputs score | Reliance on indirect imports score | Import concentration score | Limited supply list score | Total score |
|---|---|---|---|---|---|---|---|
| 1 | Animal food manufacturing | 90 | 30 | 70 | 57 | 88 | 67 |
| 2 | Petroleum and coal product manufacturing (except petroleum refineries) | 85 | 54 | 68 | 79 | 50 | 67 |
| 3 | Grain and oilseed milling | 92 | 15 | 79 | 66 | 75 | 65 |
| 4 | Automobile and light-duty motor vehicle manufacturing | 94 | 89 | 51 | 47 | 42 | 65 |
| 5 | Plastic product manufacturing | 71 | 64 | 42 | 66 | 76 | 64 |
| 6 | Iron and steel mills and ferro-alloy manufacturing | 83 | 46 | 68 | 64 | 56 | 64 |
| 7 | Meat product manufacturing | 85 | 10 | 84 | 67 | 72 | 63 |
| 8 | Animal production (except aquaculture) | 88 | 12 | 88 | 45 | 84 | 63 |
| 9 | Motor vehicle seating and interior trim manufacturing | 87 | 39 | 100 | 41 | 49 | 63 |
| 10 | Heavy-duty truck manufacturing | 85 | 92 | 47 | 50 | 41 | 63 |
| 11 | Other chemical product manufacturing | 73 | 68 | 42 | 55 | 74 | 62 |
| 12 | Converted paper product manufacturing | 74 | 55 | 46 | 73 | 62 | 62 |
| 13 | Fruit and vegetable preserving and specialty food manufacturing | 76 | 45 | 53 | 51 | 86 | 62 |
| 14 | Non-ferrous metal (except aluminum) production and processing | 100 | 59 | 74 | 20 | 55 | 62 |
| 15 | Petroleum refineries | 84 | 68 | 42 | 70 | 45 | 62 |
| Vulnerability ranking | Industry | Reliance on exports score | Export concentration score | Reliance on indirect exports score | Total score |
|---|---|---|---|---|---|
| 1 | Motor vehicle gasoline engine and engine parts manufacturing | 100 | 86 | 6 | 64 |
| 2 | Motor vehicle metal stamping | 90 | 85 | 14 | 63 |
| 3 | Automobile and light-duty motor vehicle manufacturing | 86 | 96 | 0 | 61 |
| 4 | Oil sands extraction | 75 | 97 | 9 | 60 |
| 5 | Other non-metallic mineral mining and quarrying (except diamond and potash) | 65 | 81 | 34 | 60 |
| 6 | Petroleum and coal product manufacturing (except petroleum refineries) | 84 | 88 | 6 | 60 |
| 7 | Heavy-duty truck manufacturing | 75 | 100 | 1 | 59 |
| 8 | Hardware manufacturing | 69 | 82 | 22 | 57 |
| 9 | Electric lighting equipment manufacturing | 76 | 90 | 4 | 57 |
| 10 | Sugar and confectionery product manufacturing | 72 | 92 | 4 | 56 |
| 11 | Crude oil and other pipeline transportation | 44 | 98 | 26 | 56 |
| 12 | Rubber product manufacturing | 72 | 87 | 7 | 55 |
| 13 | Resin, synthetic rubber, and artificial and synthetic fibres and filaments manufacturing | 76 | 78 | 12 | 55 |
| 14 | Oil and gas extraction (except oil sands) | 50 | 97 | 17 | 55 |
| 15 | Other motor vehicle parts manufacturing | 68 | 78 | 17 | 54 |
Two large industries found in the upper-right quadrant that are not manufacturing industries, are oil sands extraction and oil and gas extraction (excluding oil sands). Oil sands extraction is ranked as the fourth most vulnerable industry to international demand. This is not surprising but is unfortunate given the current climate of downward pricing pressure faced by this industry. This industry is indeed vulnerable to international demand, 75% of Canadian oil sands output is exported, with 94% of exports destined to the United States. On top of this, indirect exports are equivalent to another 4% of the industry’s output. While oil sands are not as vulnerable to international supply disruptions as it is with demand, it still ranks high enough on the supply index to find itself in the upper right quadrant. Intermediate inputs are equivalent to 51% of oil sands output, with 23% of these intermediates sourced from outside of Canada, although imports are fairly diverse by source country, oil sands also use a lot of imported intermediates on the limited supply list (such as chemical products, lubricants, and construction machinery) pushing its supply index score to 50, higher than the average of 45.
Canadian industries with high international demand vulnerability but low exposure to international supply disruptions
In the top left quadrant of Figure 3 we find those industries in the Canadian economy that depend on international markets for their demand but are relatively less dependent on international suppliers (figure 9). There are only 22 industries in this quadrant, but they represent a wide variety of industries in the Canadian economy, including pipeline and rail transportation, some extractive industries (such as potash) and some services (such as scientific research and development).
Electric power generation, transmission and distribution was the largest industry in this quadrant. This industry presents an interesting case as indirect exports, which were equivalent to 16% of output, play more of a role in its high demand vulnerability than direct exports, which accounted for only 6% of industry output. While it may not initially seem obvious, electricity is exported indirectly when a manufacturing plant uses electricity to produce products that are exported. If export sales dry-up, there could in-turn be less demand for electricity. It is notable, for example, that demand for electricity is a metric that is being used to assess the extent to which manufacturing in China is rebounding from the crisis. Electric power exports were concentrated on the U.S. which accounted as a destination for 95% of exports -also contributing to the higher than average demand index score.
Figure 9. Industries vulnerable to international demand but lower exposure to international supply disruptions

Text version
| Industry | Supply vulnerability score | Demand vulnerability score | Industry output, thousands $ |
|---|---|---|---|
| Postal service | 28 | 37 | 4,820,016 |
| Warehousing and storage | 30 | 32 | 4,493,864 |
| Pipeline transportation of natural gas | 30 | 46 | 5,969,742 |
| Scientific research and development services | 30 | 35 | 7,458,554 |
| Office administrative services | 31 | 38 | 14,290,937 |
| Business support services | 31 | 40 | 8,302,297 |
| Facilities and other support services | 32 | 41 | 12,120,813 |
| Natural gas distribution | 32 | 33 | 5,920,190 |
| Business-to-business electronic markets, and agents and brokers | 33 | 32 | 5,004,281 |
| Support activities for crop and animal production | 34 | 33 | 1,307,483 |
| Advertising, public relations, and related services | 34 | 35 | 9,937,121 |
| Crude oil and other pipeline transportation | 35 | 56 | 6,220,148 |
| Tobacco manufacturing | 37 | 33 | 2,279,959 |
| Lessors of non-financial intangible assets (except copyrighted works) | 38 | 34 | 3,625,695 |
| Rail transportation | 38 | 44 | 13,504,217 |
| Other non-metallic mineral mining and quarrying (except diamond and potash) | 39 | 60 | 1,391,143 |
| Potash mining | 39 | 42 | 4,047,517 |
| Electric power generation, transmission and distribution | 41 | 44 | 48,657,364 |
| Copper, nickel, lead and zinc ore mining | 42 | 46 | 9,241,948 |
| Other metal ore mining | 42 | 34 | 2,363,453 |
| Computer and peripheral equipment manufacturing | 44 | 45 | 715,149 |
| Periodical, book and directory publishers | 44 | 35 | 4,146,155 |
| Sand, gravel, clay, and ceramic and refractory minerals mining and quarrying | 45 | 38 | 1,632,789 |
| Stone mining and quarrying | 45 | 38 | 1,734,042 |
Scientific research and development (R&D) is another interesting industry, as it shows that some Canadian service industries do depend on exports. Exports were equivalent to 55% of this industry’s output, with 40% of these exports destined to the United States. Canadian scientific R&D is also used by other Canadian industries to produce exports, with indirect exports representing a further 4% of industry output.
There are several services industries in this quadrant. While these industries will clearly be vulnerable to international demand for their services, their exports may be less exposed (or not at all) to the potential choke points discussed earlier in this chapter due to digital trade. An increasing share of Canadian services are now thought to be potentially deliverable digitally (Figure 10). While traditional service exports often require the movement of people, either Canadians going abroad to deliver services or visitors to Canada purchasing services, ICT technology is enabling many services to be provided digitally; consulting over email or skype, or delivering computer code through cloud computing are just some ways services can now be delivered by digital means.
Figure 10. Exports of potential ICT-enabled services

Text version
| Canadian commercial services exports to the world | Value (millions $) |
|---|---|
| Potential ICT-enabled services | |
| Commercial | 64,486 |
| Not potential ICT-enabled services | |
| Travel | 32,446 |
| Transport | 17,368 |
| Commercial & government | 7,971 |
Canadian industries with high vulnerability to supply disruptions but low vulnerability to demand disruptions
There are also those industries where sales may be domestic focused, but firms are reliant on international suppliers for sourcing their intermediate inputs. These industries are found in the bottom right quadrant of Figure 3. There are 27 industries that fall into this quadrant, including several agricultural related industries (dairy, meat, animal and crop production), cultural industries (performing arts, amusement recreation, television, movie theaters), transportation, and two particular large industries – restaurant and bars, and provincial government services.
Figure 11. Industries vulnerable to international supply but lower exposure to international demand disruptions
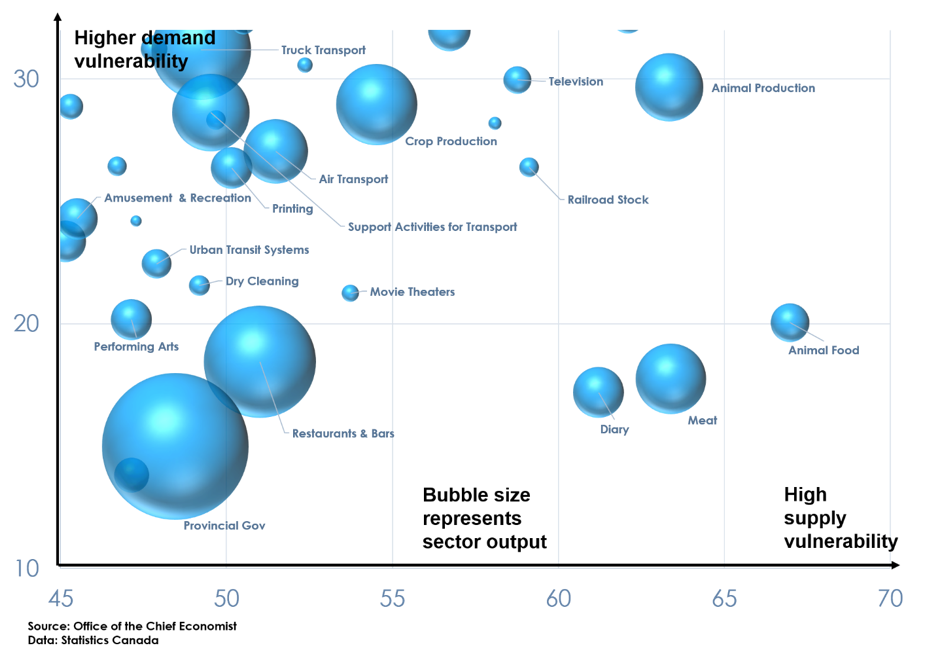
Text version
| Industry | Supply vulnerability score | Demand vulnerability score | Industry output, thousands $ |
|---|---|---|---|
| Couriers and messengers | 45 | 23 | 9,506,929 |
| Other information services | 45 | 29 | 3,567,253 |
| Amusement and recreation industries | 46 | 24 | 9,559,759 |
| Ship and boat building | 47 | 26 | 2,028,133 |
| Performing arts, spectator sports and related industries, and heritage institutions | 47 | 20 | 9,457,486 |
| Gambling industries | 47 | 14 | 6,731,063 |
| Water, sewage and other systems | 47 | 24 | 668,981 |
| Medical equipment and supplies manufacturing | 48 | 31 | 4,002,630 |
| Urban transit systems | 48 | 22 | 4,894,054 |
| Other provincial and territorial government services | 48 | 15 | 122,107,633 |
| Dry cleaning and laundry services | 49 | 22 | 2,324,676 |
| Truck transportation | 49 | 31 | 56,466,293 |
| Support activities for transportation | 50 | 29 | 33,841,436 |
| Support activities for forestry | 50 | 28 | 2,066,200 |
| Printing and related support activities | 50 | 26 | 9,736,970 |
| Radio and television broadcasting | 51 | 32 | 3,745,449 |
| Food services and drinking places | 51 | 18 | 71,526,961 |
| Air transportation | 51 | 27 | 23,310,421 |
| Other furniture-related product manufacturing | 52 | 31 | 1,244,025 |
| Motion picture and video exhibition | 54 | 21 | 1,637,893 |
| Crop production (except cannabis, greenhouse, nursery and floriculture production) | 55 | 29 | 37,433,400 |
| Other miscellaneous manufacturing | 57 | 32 | 10,074,416 |
| Sound recording industries | 58 | 28 | 934,053 |
| Pay and specialty television | 59 | 30 | 4,234,168 |
| Railroad rolling stock manufacturing | 59 | 26 | 2,157,278 |
| Dairy product manufacturing | 61 | 17 | 14,660,757 |
| Animal production (except aquaculture) | 63 | 30 | 26,290,889 |
| Meat product manufacturing | 63 | 18 | 27,890,148 |
| Animal food manufacturing | 67 | 20 | 8,304,690 |
Animal food manufacturing was the highest-ranking industry for vulnerability to supply disruptions with a total index score of 67 (see figure 7). This is a processing industry that uses a high share of intermediate inputs, these inputs were equivalent to 82% of industry output. 21% of the industry’s inputs were imported, with half sourced from the United States. This industry scores low for use of products on the limited supply list. While animal food manufacturing is heavily reliant on international supply chains, its scores low on the international demand vulnerability index, as exports only represented 17% of industry output and indirect exports only 4%.
Provincial government services scored just above the average supply index score resulting in their placement in the lower right quadrant. The other two government sectors, federal and municipal, were just below average, with supply index scores of 43 and 42 respectively. This is due to all three having high scores on the limited supply list component of the supply index. All three government sectors use a wide variety of imported imports, including from agri-food, chemicals, and metals & mineral related products, which dominate the limited supply list. Giving them high scores from the limited supply component of the index. In fact, provincial government services had the highest score of all industries, importing a potential 1,572 products of the list of 2,107.
Conclusion
The above analysis gives an indication of which industries in the Canadian economy are most vulnerable to disruptions in international supply chains and where in the supply chain those vulnerabilities may exist. This work is not intended for the firm, which must decide where to source supplies, how many suppliers to have or in which markets to sell. Rather, this work is aimed squarely at policy-makers who see the outcomes of the sourcing and selling decisions of a myriad of private actors across the economy and in the post-pandemic recovery will face important decisions of how best to support employment or growth in their national economies while also ensuring the resilience and robustness of critical supply chains.
The global pandemic has shown that policy-makers face a daunting task of understanding complex supply chains, with limited information, and across a broad economy with a great deal of industry variation. It is hoped that a tool such as we have developed in this study for Canada is a first step in helping policy-makers better understand the workings of international supply chains and their potential points of vulnerability across all sectors of the economy. This will, in-turn, provide them the information necessary for increasing the resilience and robustness of international supply chains without resorting to reshoring which could lead to reduced productivity and thus lower economic growth, reduced wages for workers, and higher prices for consumers.
Bibliography
Acemoglu, Daron., and Alireza Tahbaz-Salehi (2009) “Firms, failures, and fluctuations: the macroeconomics of supply chain disruptions” National Bureau of Economic Research Working Paper Serries, Working Paper 27565. http://www.nber.org/papers/w27565
Baldwin, John and Yan, Beiling (2014). “Global Value Chains and the Productivity of Canadian Manufacturing Firms”. Economic Analysis Research Paper Series 11F0027M, no. 90. Statistics Canada.
Carvalho, Vasco M., Makoto Nirei, Yukiko U. Saito, and Alireza Tahbaz-Salehi (2020) “Supply Chain Disruptions: Evidence from the Great East Japan Earthquake”
Crisculo, Chiara and Timmis, Jonathan (2017). “The Relationship Between Global Value Chains and productivity”. International Productivity Monitor (Issue 32). Centre for the Study of Living Standards pp. 61-83.
Jiang, Kevin (2020). “Products with Limited International Supply for Canada.” Global Affairs Canada, Office of the Chief Economist. https://www.international.gc.ca/trade-commerce/economist-economiste/analysis-analyse/products_limited_supply-Canada-produits_nombre_limite.aspx?lang=eng
Miroudot, Sébastien (2020). “Resilience versus robustness in global value chains: Some policy implications” in “COVID-19 and Trade Policy: Why Turning Inward Won’t Work” Edited by Richard E. Baldwin and Simon J. Evenett. A VoxEU.org Book, CERP Press, pp 122-130.
Neureuther, B.D and Kenyon. G. (2009). “Mitigating supply chain vulnerability”. Journal of marketing channels, 16.Pp. 245-263.
Tokuia, Joji, Kazuyasu Kawasaki, and Tsutomu Miyagaw (2017) “The economic impact of supply chain disruptions from the Great East-Japan earthquake” Japan and the World Economy
Urata, Shujiro and Baek, Youngmin (2019). “Does Participation in Global Value Chains Increase Productivity? An Analysis of Trade and Value-Added Data”. ERIA Discussion Paper Series. No. 301
Wagner, Stephan M., and Nikrouz Neshat (2010) “Assessing the vulnerability of supply chains using graph theory” Int. J. Production Economics 126 (2010) 121–129
Annex 1: Considerations of index construction
Supply vulnerability index: Correlation of index Components
| 1 Input/output | 2 Imports/inputs | 3 Indirect imports | 4 HHI | 5 Limited supply | |
|---|---|---|---|---|---|
| 1 Input/output | X | 0.58 | 0.41 | 0.07 | 0.09 |
| 2 Imports/inputs | 0.58 | X | 0.12 | -0.23 | 0.06 |
| 3 Indirect imports | 0.41 | 0.12 | X | 0.16 | 0.15 |
| 4 HHI | 0.07 | -0.23 | 0.16 | X | -0.36 |
| 5 Limited supply | 0.09 | 0.06 | 0.15 | -0.36 | X |
| High | Moderate | Low |
Demand vulnerability index: Correlation of index Components
| 1 Export/output | 2 Indirect exports | 3 HHI | |
|---|---|---|---|
| 1 Export/output | X | -0.16 | 0.24 |
| 2 Indirect exports | -0.16 | X | -0.12 |
| 3 HHI | 0.24 | -0.12 | X |
| High | Moderate | Low |
International supply vulnerability index:
Of the 5 components of the international supply vulnerability index, only one pair of components show a high correlation with each other. The first component, the share of inputs used to industry output was found to have a high correlation with the second component, the share of imported inputs in total inputs used. Those industries which used a high degree of inputs were also found to import a high degree of those inputs from abroad, while those industries which used relatively less inputs tended to source their inputs domestically. There are two likely reasons for this correlation; first, it is possible that those industries which have a high degree of inputs in output, use a wider variety of inputs, if this is the case, it could necessitate that some of those inputs need to be sourced outside of Canada. Second those industries that utilize a high degree of inputs may have a greater motivation to lower the costs of those inputs, thus seeking lower cost imported substitutes for relatively higher cost domestic sourced inputs.
Despite the high correlation of these two components, the authors believe it is still necessary to include both in the index. The first, is required to give a measure of the overall dependence an industry has on inputs in general, while the second gives a measure of the dependence of inputs from abroad. Without the first component, industries which have little reliance on inputs overall, but have a high import content in the relatively small amount of inputs would be rated as highly vulnerable to supply chain disruptions as an industry with a high reliance on inputs in which the same share is imported, even though the second industry would be much more vulnerable.
International demand vulnerability index:
None of the three components of the international demand vulnerability index are highly or moderately correlated with each other.
Robustness check of index components weights
International supply vulnerability index:
The international supply vulnerability index has 5 components, with each component given an equal weight of 0.20. To investigate if the weighting scheme has a significant effect on the index results, we calculated alternative weighting schemes to see if their index results differed. We calculated five alternative scenarios where one component was given a higher weight of 0.25 and the other four a weight of 0.1875. And five further scenarios where one component was given a smaller weight of 0.15 and the other four a weight of 0.2125.
| Weighting scheme | Reliance on inputs | Reliance on imports of inputs | Indirect imports | HHI | Limited supply list | Total |
|---|---|---|---|---|---|---|
| Equal weights | 0.2 | 0.2 | 0.2 | 0.2 | 0.2 | 1 |
| 2 | 0.25 | 0.1875 | 0.1875 | 0.1875 | 0.1875 | 1 |
| 3 | 0.1875 | 0.25 | 0.1875 | 0.1875 | 0.1875 | 1 |
| 4 | 0.1875 | 0.1875 | 0.25 | 0.1875 | 0.1875 | 1 |
| 5 | 0.1875 | 0.1875 | 0.1875 | 0.25 | 0.1875 | 1 |
| 6 | 0.1875 | 0.1875 | 0.1875 | 0.1875 | 0.25 | 1 |
| 7 | 0.15 | 0.2125 | 0.2125 | 0.2125 | 0.2125 | 1 |
| 8 | 0.2125 | 0.15 | 0.2125 | 0.2125 | 0.2125 | 1 |
| 9 | 0.2125 | 0.2125 | 0.15 | 0.2125 | 0.2125 | 1 |
| 10 | 0.2125 | 0.2125 | 0.2125 | 0.15 | 0.2125 | 1 |
| 11 | 0.2125 | 0.2125 | 0.2125 | 0.2125 | 0.15 | 1 |
After calculating the index scores under each weighting scheme, we looked at the correlation of each scheme compared to the original equal weighted results used in the paper. For each alternative weighting scheme, it was found that the results were correlate with the original by more than 99% suggesting that the weighting of components does not have a significant effect on the overall results.
Correlation with scenario of equal weights
| 2 | 3 | 4 | 5 | 6 | 7 | 8 | 9 | 10 | 11 |
|---|---|---|---|---|---|---|---|---|---|
| 0.998694 | 0.995472 | 0.998315 | 0.996806 | 0.993554 | 0.998529 | 0.995187 | 0.998192 | 0.997442 | 0.993737 |
International demand vulnerability index:
The same process was undertaken with the international demand vulnerability index to see if changes in index weighting significantly effected the results of the index. In the case of the demand index, the three components were given an equal weigh of 0.333. Alternative scenarios were one component was given a higher weight of 0.43 and weighting schemes where a component was given a lower weight of 0.23 were investigated.
| Weighting Scheme | Reliance on Exports | Export Concentration | Indirect Export Score | Total Score |
|---|---|---|---|---|
| Equal Weights | 0.33 | 0.33 | 0.33 | 1.00 |
| scenario 2 | 0.43 | 0.285 | 0.285 | 1.00 |
| scenario 3 | 0.29 | 0.43 | 0.285 | 1.00 |
| scenario 4 | 0.29 | 0.29 | 0.43 | 1.00 |
| scenario 5 | 0.23 | 0.385 | 0.385 | 1.00 |
| scenario 6 | 0.39 | 0.23 | 0.385 | 1.00 |
| scenario 7 | 0.39 | 0.385 | 0.23 | 1.00 |
In this case with fewer components and a greater change in weighting, it was found that all alternative weighting schemes were correlated to original index results by more than 98% again indicated a highly stable result that does not change significantly based on the weights used.
Correlation with scenario of equal weights
| 2 | 3 | 4 | 5 | 6 | 7 |
|---|---|---|---|---|---|
| 0.985131 | 0.986152 | 0.985647 | 0.977156 | 0.98297 | 0.989731 |
- Date modified: