
Women-owned exporting small and medium enterprises - Descriptive and comparative analysis
Audrey Ann Bélanger Baur
Economist, Trade and Economic Analysis Division
Office of the Chief Economist, Global Affairs Canada
2019-10-03
Table of contents
Acknowledgments
The author wishes to thank its colleagues from the Office of the Chief economist, Trade and Economic Analysis Division, for their insightful input and suggestions, notably Kevin Chuang, and Julia Sekkel, as well as Lyming Huang from the Small Business Branch of the Department of Innovation, Science and Economic Development Canada. Nancy Blanchet provided strongly appreciated language revisions to the English and French versions. Finally, recognition is given to Statistics Canada for vetting the statistics reported throughout this report.
Non-technical abstract
This report presents an analysis of majority women-owned, equally owned and men-owned small and medium enterprises (SMEs) that export. Prior research found that women-owned SMEs were underrepresented amongst exporters. The implications are that businesses owned by women would not benefit as much as the other businesses from the opportunities international trade offers. However, the proportion of women-owned SMEs that export dramatically increased between 2011 and 2017 nearly completely closing the export participation gap. Two factors are identified as having contributed to this important change. First, women’s enterprises tend to be smaller, but a rising number of businesses with 1 to 19 employees exported in 2017 compared to 2011. Second, women-owned SMEs are now better represented in industries prone to exporting. As such, the export gap has significantly narrowed. Nonetheless, the entrepreneurial gap persists, women-owned SMEs still represent less than 16 percent of all SMEs, and a small gap was identified in the proportion of revenues from exports between women-owned enterprises and other firms.
In brief:
- Women’s representation amongst SME entrepreneurs has stagnated since 2011;
- But women-owned SMEs’ representation amongst exporters doubled from 2011 to 2017;
- In fact, women business owners export more in part because they are more active in export-oriented industries and because smaller business tend to export more;
- However, while women-owned SMEs’ revenues from export (as a percentage of total revenues) have increased, they still slightly fall behind those of other SMEs.
Topics: Small and medium enterprises, gender analysis, export, internationalisation
JEL codes: F13, F68, J16, L11, L25, L26
Executive summary
This report analyzes selected trends and business characteristics of Canadian exporting small and medium enterprises (SMEs) by majority gender of ownership of firms. It uses data obtained from Statistics Canada’s Survey on Financing and Growth of Small and Medium Enterprises, 2011, 2014, and 2017.
The key findings of this report are that:
- Women-owned SMEs, in contrast to men-owned SMEs and equally owned SMEs, saw their export propensity (share of firms that export) more than double, growing from 5.0 percent to 11.1 percent, from 2011 to 2017; and
- As a result, the proportion of women-owned SMEs amongst exporters doubled over the same period reaching 14.8 percent of all SME exporters.
These strong results appear to be driven by:
- The increased export propensity of micro (1-4 employees) and tiny (5-19 employees) enterprises, amongst which women-owned enterprises are over-represented;
- A sectoral shift of women-owned SMEs towards industries prone to exporting, most notably manufacturing, and away from those that are less likely to export, such as accommodation and food services.
Women-owned SMEs significantly gained on the extensive margin (share and number of exporting firms), but also on the intensive margin as a greater proportion of their revenues are derived from exports. The export intensity of SMEs overall increased for all gender groupings considered in this study, but women-owned enterprises presented the most remarkable growth from 2011 to 2017. Their export intensity experienced a 2.5-fold jump (150 percent) compared to an average increase of 22.9 percent for all SMEs.
From 2011 to 2017, the share of firms that export increased for all SMEs (men-owned, women-owned, and equally owned), however only women-owned SMEs experienced a strong and steady growth before and after 2014. Women-owned SMEs appear to have significantly reduced the gap in export participation, but they still account for a relatively small share of exporters overall due to the persisting entrepreneurial gap. Women self-employment grew by 10.6 percent, but the share of women-owned SMEs has remained unchanged since 2011.
Introduction
In Canada, small and medium enterprisesFootnote 1 (SMEs) represent 99.8 percent of all businesses and hire 89.7 percent of all private sector employees (ISED, 2019). These are the main reasons for which SMEs are considered the backbone of the economy. Since Canada is a small open economy, it is therefore important to ensure that enterprises can participate in international trade and that the benefits of trade are distributed across the economy. The inclusion of as many firms as possible into the global trade has the potential to directly impact Canadians’ standards of living as businesses that export were found to be more productive and pay higher wages (Ciuriak et al., 2015).
Over the past generations, women have increasingly participated in the workforce. Over 80.0 percent of women work today compared to 23.5 percent in 1953 (Statistics Canada, 2018). In addition to entering the workforce, Canadian women have also established businesses at increasingly higher rates over the past decades. From 2011 to 2017, women self-employment grew by 10.6 percent compared to 5.4 percent for the overall self-employed population (Statistics Canada, Footnote 2 The full participation of women-owned, equally owned and men-owned SMEs in global value chains would allow business owners, employees, and all Canadians to reap the full economic benefits of global trading.
This publication provides updated statistics to data presented in the Footnote 3, men-owned, and equally owned SMEs by exploring their export propensity (Section 2) and analyzing selected business characteristics believed to have an impact on the likelihood to export of a business (Section 3).
Women-owned SMEs
This section presents previously identified obstacles to the growth and performance of Canadian women-owned SMEs, including cultural factors, funding opportunities related to innovation, and operating on the web, compared to their counterparts.
In 2016, Canadian women achieved the highest rate of early stage entrepreneurial activity compared to other innovation-based economies, such as the United States, Australia, the United Kingdom, and Europe (Hughes, 2017). However, in 2004, Orser et al. found that most women-owned exporting SMEs believed gender had a direct influence on their firms’ operations, ability to grow, and internationalization. Moreover, the study identified that:
Gender-specific barriers that may impede export activity included cultural and personal factors such as perceived lack of respect by male business owners, bravado, chauvinism, not being taken seriously, businessmen who refuse to do business with a woman, and verification of decisions through male employees.
- Orser et al., Exporting as a Means of
Growth for Women-owned Canadian SMEs, 2004
Over a decade later, in 2018, a survey of SME clients of Footnote 4 The reported challenges include:
- The lack of female mentors, potential investors and inclusiveness in mainstream networks, incubators and accelerators; and
- The experience of sexism and business discrimination, notably comments concerning their expertise and knowledge and the expectation for business pitches to be delivered the same way a man would to appear credible.
According to a recent study (Beckton et al., 2018), 90.0 percent of Canadian women-owned businesses operate in the service sector compared to 70.0 percent of men-owned businesses. Moreover, innovation program funds target product and technology innovations of goods, rather than those of services, and are criticized for overlooking other types of innovation (process innovation, marketing innovation, and organizational innovation). Thus, the types of innovation recognized are more likely to be brought forward by businesses owned by men. These gender-specific challenges to establish and grow a business could be impediments to women-owned SMEs’ internationalization, notably their ability to export. Moreover, recent data suggests that women and men-owned businesses may innovate in products at similar rates. Based on the 2017 data from the Survey on Financing and Growth of SMEs, 19.7 percent of businesses owned by women report developing product innovations compared to 18.9 percent of SMEs owned by men, but there appears to be an additional industry bias in favour of high technology firms typically owned by men (Beckton et al., 2018).
Additional analysis to estimate the likelihood of gender-specific obstacles to business growth and export can be conducted by reviewing the performance of e-commerce business by majority gender of ownership. Operating online offers a certain amount of anonymity which may reduce potential gender discrimination. According to an issue paper from the International Centre for Trade and Sustainable Development (Suominen, 2018), women-led firms operating online achieve similar performances to men-led firms. The paper further suggests that women may perform better online than offline as business owners, perhaps because the web is more gender-blind, and that digital regulation may have a disproportionate impact on women as they have a stronger online presence (Suominen, 2018). According to the Survey on Financing and Growth of SMEs, 2017, Canadian women-owned SMEs are slightly more likely to have a website, 55.5 percent, than their counterparts, 53.2 percent, but have online payment options at much higher rates, 11.7 percent, than men-owned SMEs, 8.0 percent, and equally owned SMEs, 7.6 percent. As the number of online businesses keeps increasing, supporting women business owners online is an avenue that could help growth and bridge performance gaps between women-owned businesses and other businesses.
Box 1 – Definitions of SMEs’ Gender of Ownership Categories
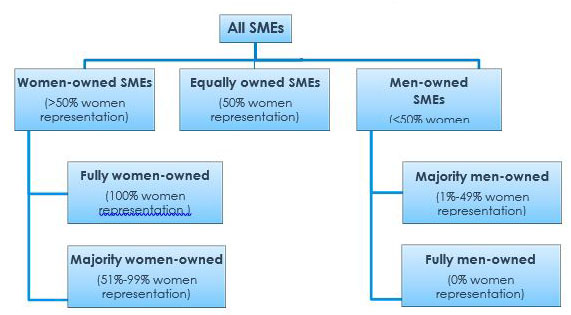
Text version
The box presents a tree branch figure which defines all small and medium enterprises (SMEs) according to the different types of gender of ownership compositions described in the study. All SMEs are separated into three categories: women-owned SMEs (which have at least 50% women representation) , equally owned SMEs (which have 50% women representation), and men-owned SMEs (which have less than 50% women representation). Additionally, the women-owned category is disaggregated into two sub-categories: fully women-owned SMEs (which have 100% women representation), and majority women-owned SMEs (which have 51% to 99% women representation). Similarly, the men-owned category is disaggregated into two sub-categories: majority men-owned SMEs (which have 1% to 49% women representation), and fully me-owned SMEs (which have 0% women representation).Exporting SMEs
This section presents the evolution of the representation of women-owned SMEs in the population of SMEs and the population of exporters in comparison to men-owned and equally owned counterparts. The ability to export is one characteristic often considered to classify businesses as they are exposed to an entire new set of challenges in logistics, competition, financing, and knowledge of foreign markets. Exporting enterprises have empirically been found to be more productive (Baldwin & Yan, 2015). They are also important to Canada as exports represent nearly a third of the country’s gross domestic product (Statistics Canada, Table 36-10-0222).
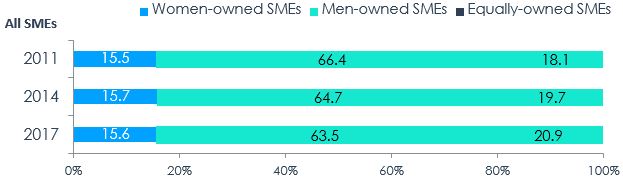
Figure 1 presents the distribution of SMEs by majority gender of ownership from 21011 to 2017. A visual analysis of these trends helps identify patterns in the evolution of SMEs by majority gender of ownership.
Figure 1 – Distribution of SMEs by Majority Gender of Ownership, 2011, 2014, 2017
Text version
ALL SMEs | Women-owned SMEs | Men-owned SMEs | Equally owned SMEs |
|---|---|---|---|
2011 | 15.5% | 66.4% | 18.1% |
2014 | 15.7% | 64.7% | 19.7% |
2017 | 15.6% | 63.5% | 20.9% |
Text version
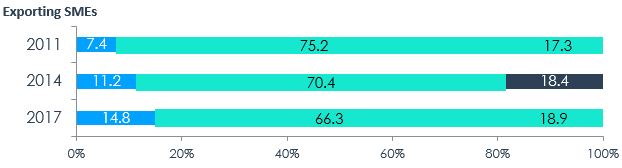
EXPORTING SMEs | Wome-owned SMEs | Men-owned SMEs | Equally owned SMEs |
|---|---|---|---|
2011 | 7.4% | 75.2% | 17.3% |
2014 | 11.2% | 70.4% | 18.4% |
2017 | 14.8% | 66.3% | 18.9% |
Source: Office of the Chief Economist, Global Affairs Canada using data obtained from Statistics
Canada, Survey on Financing and Growth of Small and Medium Enterprise, 2011, 2014,
2017.
Overall, since 2011, the proportion of equally owned SMEs has increased and the proportion of women-owned SMEs remained relatively stable although they grew in number. However, the second part of Figure 1 highlights that the proportions of exporting women-owned SMEs and equally owned SMEs have both increased. As such, women-owned SMEs displayed a higher export propensity in 2017 compared to previous years, although they did not gain representation amongst all SMEs. As for men-owned SMEs, while their proportion of all exporters has decreased, their numbers grew along with the SME population over that period.Footnote 5 Moreover, men-owned SMEs remain in the lead in terms of their likelihood to export to foreign markets as demonstrated in Figure 2.
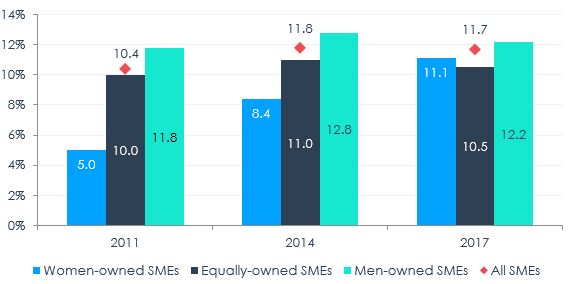
The proportion of exporting women-owned SMEs has doubled from 2011 to 2017 according to the Survey on Financing and Growth of SMEs of Statistics Canada despite not gaining traction in the overall population of SMEs. As a result, they are no longer significantly underrepresented among exporters compared to all SMEs, representing in both distributions (presented in Figure 1) approximately 15 percent of SMEs. Figure 2 further supports this finding by highlighting the export propensity of firms by majority gender of ownership from 2011 to 2017:
Figure 2 – Export Propensity of SMEs by Majority Gender of Ownership, 2011, 2014, 2017
Text version
| 2011 | 2014 | 2017 |
|---|---|---|---|
Women-owned SMEs | 5.0% | 8.4% | 11.1% |
Equally owned SMEs | 10.0% | 11.0% | 10.5% |
Men-owned SMEs | 11.8% | 12.8% | 12.2% |
All SMEs | 10.4% | 11.8% | 11.7% |
Note: The export propensity is the percentage of businesses that export.
Source: Office of the Chief Economist, Global Affairs Canada using data obtained from Statistics
Canada, Survey on Financing and Growth of Small and Medium Enterprise, 2011, 2014,
2017.
The export propensity of Canadian SMEs remained basically unchanged from 2014 to 2017 after increasing by approximately 13.5 percent from 2011 to 2014. The export propensity of equally owned SMEs and men-owned SMEs exporting followed a similar trend to the average Canadian SME over that period, while women-owned SMEs experienced a significant and strong growth in their proportion of exporters from 2011 throughout 2017, thus outperforming their counterparts. While women-owned SMEs lagged behind the average by 5.4 percentage points in 2011, the gap was consistently reduced over the years and now stands at 0.6 percentage points. Canadian women-owned SMEs are being established at an unprecedented rate compared to historical figures even outpacing that of men (Hughes, 2017, p.6). In fact, based on trends from the past 20 years, Canadian women are more likely to open a business than women anywhere else in the world (Young, 2017).
Despite the aforementioned reported hurdles, over recent years, the growth in the proportion of women-owned exporting SMEs has outperformed that of their counterparts. A number of reasons could explain the recent increase in the number of women-owned SMEs that export, including a shift in the main industries of operation, business growth, the success of government programs and services catered to women-owned SMEs, and a shift in the majority gender of ownership of larger SMEs. Alternatively, it may also simply indicate that women-owned SMEs successfully increased their efforts to export. Internationalization may be one of their strategies for growth. It may also be increasingly prevalent for businesses that are smaller in size and operate mainly in service industries to export, such as businesses in e-commerce.
Selected business characteristics
This section analyses selected business characteristics of women-owned SMEs compared to the counterparts in an effort to explain and understand the factors leading to women-owned SMEs’ increasing export propensity. Previous research had identified that women business owners, although typically more educated and with more managerial experience, export at a lower rate than equally owned and men-owned SMEs because they tend to be smaller in number of employees and to operate in industries less likely to export (GAC, 2016; ISED, 2015; Grekou et al., 2018).
i. Enterprise size
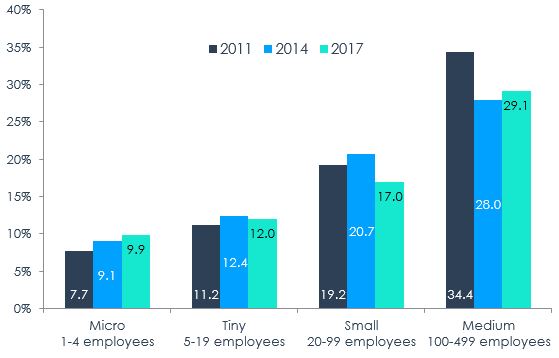
Both the number of employees and annual gross revenues can be used to categorize businesses by size. Enterprise size defined by the number of employees is the most common measure used in Canada, and little information is expected to be lost since the two characteristics are highly correlated. Figure 3 shows that in 2017, the export propensity by enterprise size followed an increasing trend similarly to previous years.
Figure 3 – Export Propensity by Enterprise Size, 2011, 2014, 2017
Text version
| 2011 | 2014 | 2017 |
|---|---|---|---|
Micro (1-4 employees) | 7.7% | 9.1% | 9.9% |
Tiny (5-19 employees) | 11.2% | 12.4% | 12.0% |
Small (20-99 employees) | 19.2% | 20.7% | 17.0% |
Medium (100-499 employees) | 34.4% | 25.0% | 29.1% |
Source: Office of the Chief Economist, Global Affairs Canada using data obtained from Statistics
Canada, Survey on Financing and Growth of Small and Medium Enterprise, 2011, 2014,
2017.
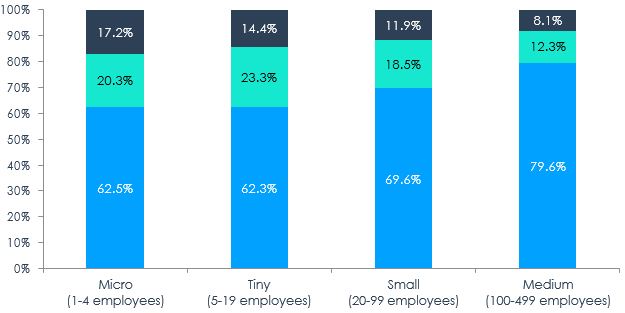
However, the distribution of SMEs by gender of ownership across business size is unequal with men-owned SMEs gaining representation with increasing enterprise size (number of employees) as shown in Figure 4:
Figure 4 – Distribution of Gender of Ownership of SMEs by Enterprise Size, 2017
Text version
| Women-owned SMEs | Equally owned SMEs | Men-owned SMEs |
|---|---|---|---|
Micro (1-4 employees) | 17.2% | 20.3% | 62.5% |
Tiny (5-19 employees) | 14.4% | 23.3% | 62.3% |
Small (20-99 employees) | 11.9% | 18.5% | 69.6% |
Medium (100-499 employees) | 8.1% | 12.3% | 79.6% |
Source: Office of the Chief Economist, Global Affairs Canada using data obtained from
Statistics Canada, Survey on Financing and Growth of Small and Medium Enterprise,
2017.
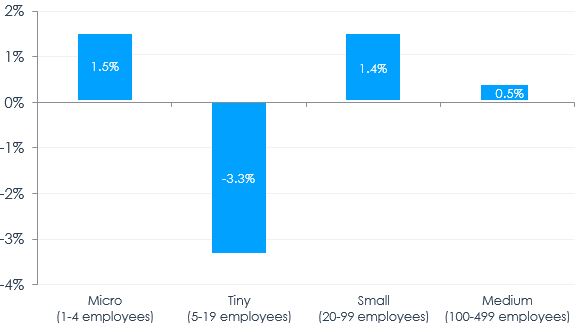
Larger businesses can more easily respond to higher demand and have additional resources to reach foreign customers. As such, it is not surprising to witness a majority of men-owned SMEs amongst exporters since they encompass the majority of larger SMEs. The overall trends by gender of ownership displayed in Figure 4 resemble those present in 2011 and 2014, except for a marginal shift of women-owned SMEs towards larger business sizes. Women-owned SMEs, by enterprise size, slightly shifted in composition from 2011 to 2017 as an additional 1.9 percent of women-owned SMEs are larger (small and medium size) rather than of micro or tiny size. Figure 5 depicts this change between 2011 and 2017:
Figure 5 – Change in the distribution of women-owned SMEs by enterprise size, 2011-2017
Text version
| Change from 2011 to 2017 |
|---|---|
Micro (1-4 employees) | +1.5% |
Tiny (5-19 employees) | -3.3% |
Small (20-99 employees) | +1.4% |
Medium (100-499 employees) | +0.5% |
Source: Office of the Chief Economist, Global Affairs Canada using data obtained from
Statistics Canada, Survey on Financing and Growth of Small and Medium Enterprise, 2011 and
2017.
However, this shift is not sufficiently large to explain the identified important changes in export propensity presented in Figure 2. Indeed, when estimating the contribution of the increasing export propensities of micro and tiny enterprises (see Figure 3) on women’s overall export propensity, no significant effect is found. The export propensity remains unchanged, around 11.1 percent, over the years when assigning the export propensities by enterprise size of 2017
(Figure 3) to the gender of ownership distributions of each year (2017 presented in Figure 4).Footnote 6 The partial counterfactual results presented here are driven by two factors: the increasing export propensity for micro and tiny firms from 2011 to 2017, and the marginal shift of women-owned SMEs towards larger business sizes, with the dominant factor being the former. The rise of e-commerce and the digital transformation of the economy offer smaller businesses benefit today greater opportunities to internationalize. Although, men-owned SME may operate larger enterprises which are more prone to exporting, the increase in export propensity of women-owned and equally owned SMEs (see Figure 2) suggests they likely have benefited from new export channels brought forward by digital trade that are more accessible to smaller businesses.
Women-owned SMEs are overrepresented amongst micro-enterprises, with over 60 percent of women-owned SMEs in that category. Equally owned and women-owned SMEs are underrepresented amongst small and medium enterprises when compared to men-owned SMEs. The proportion of equally owned SMEs amongst tiny enterprises has increased since 2014 (X% in 2017), at which point it was less than a full percentage point (20.2%) above the SME average (19.7%) in 2017. This strong increase could signal a shifting trend towards equal ownership between genders. However, the survey does not allow for the analysis of entry, exit and changes over time in firms and in gender of ownership. As such, while women-owned SMEs tend to be slightly larger than they were in 2011 and 2014, their increased export propensity appears to be driven by a greater number of smaller firms exporting, rather than an increased presence of women-owned SMEs in larger SMEs.
ii. Industry of operation
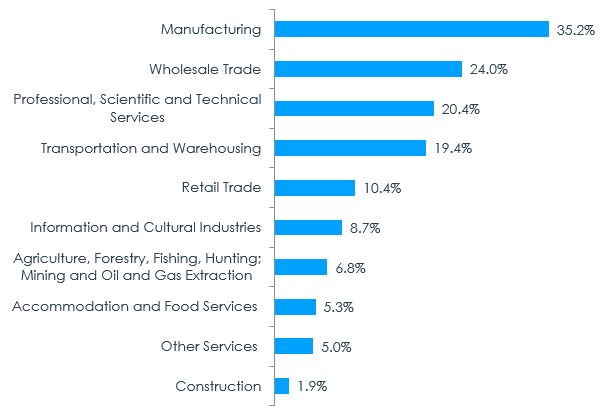
In addition to enterprise size, the industry of operation of a business is an important determinant of whether or not an enterprise will export. Certain industries are more locally concentrated, such as construction and restauration, while others are more prone to exporting, for example, manufacturing and wholesale trade. Figure 6 presents the percentage of SMEs that export based on their industry of operation:
Figure 6 – Export Propensity by Industry, 2017
Text version
| Export Propensity |
|---|---|
Manufacturing | 35.2% |
Wholesale Trade | 24.0% |
Professional, Scientific and Technical Services | 20.4% |
Transportation and Warehousing | 19.4% |
Retail Trade | 10.4% |
Information and Cultural Industries | 8.7% |
Agriculture, Forestry, Fishing, Hunting; Mining and Oil and Gas Extraction | 6.8% |
Accommodation and Food Services | 5.3% |
Other Services | 5.0% |
Construction | 1.9% |
Note: The industry Information and Cultural Industries (NAICS 51) also includes in the following
industries: Real Estate and Rental and Leasing (NAICS 53), Administrative and Support,
Waste Management and Remediation Services (NAICS 56), Health Care and Social
Assistance (NAICS 62), Arts, Entertainment and Recreation (NAICS 71).
Source: Office of the Chief Economist, Global Affairs Canada using data obtained from Statistics
Canada, Survey on Financing and Growth of Small and Medium Enterprise, 2017.
Figure 7 provides the sectoral shift of women-owned SMEs from 2011 to 2017. While women-owned SMEs may not export as much as equally owned or men-owned SMEs, they are more likely to export if they are situated in an export-oriented industry (refer to Figure 6).
Figure 7 – Share of Women-owned SMEs by Industry, 2011, 2014, 2017
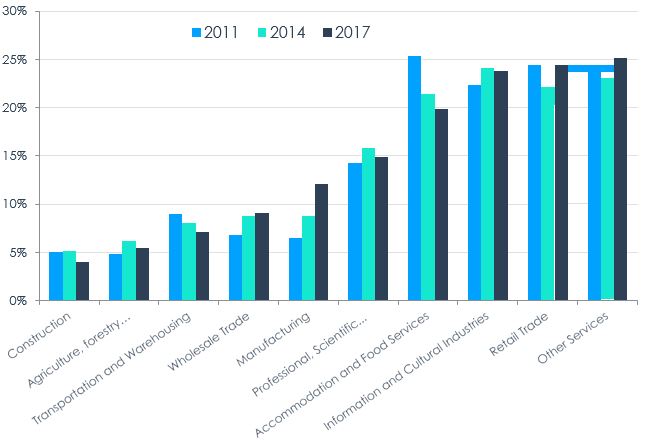
Text version
| 2011 | 2014 | 2017 |
|---|---|---|---|
Manufacturing | 6.5% | 8.8% | 12.1% |
Wholesale Trade | 6.8% | 8.7% | 9.1% |
Professional, Scientific and Technical Services | 14.2% | 15.8% | 14.8% |
Transportation and Warehousing | 8.9% | 8.1% | 7.1% |
Retail Trade | 24.4% | 22.0% | 24.3% |
Information and Cultural Industries | 22.4% | 24.1% | 23.7% |
Agriculture, Forestry, Fishing, Hunting; Mining and Oil and Gas Extraction | 4.8% | 6.2% | 5.5% |
Accommodation and Food Services | 25.4% | 21.4% | 19.9% |
Other Services | 23.7% | 23.0% | 25.1% |
Construction | 5.1% | 5.1% | 4.0% |
Source: Office of the Chief Economist, Global Affairs Canada using data obtained from Statistics
Canada, Survey on Financing and Growth of Small and Medium Enterprise, 2011, 2014,
2017.
Sectoral shifts explain in part the increasing export propensity of women-owned SMEs. The most important trends are:
- A steady increase of the share of women-owned SMEs in manufacturing since 2011; and
- A steady decrease in the share of women-owned SMEs in accommodation and food services.
Other notably sectoral shifts are:
- An increase of the share of women-owned SMEs in wholesale trade since 2011; and
- A steady decrease in the share of women-owned SMEs in transportation and warehousing since 2011.
The share of women-owned SMEs by industry is driven by two factors: the growth of the sector compared to the rest of the economy, and the relatively high or low entry of women-owned businesses in that specific sector compared to their counterparts. For example, the representation of women-owned SMEs in transport and warehousing industry has steadily declined from 2011 to 2017, but the proportion of women-owned SMEs in that industry compared to other sectors has remained stable, around 3.0 percent, over the same period. This suggests that men-owned and equally owned SMEs have entered that industry at a higher rate than women-owned enterprises.
The opposite is true for wholesale trade, as women-owned SMEs maintained a small proportion of their businesses in that industry, but their representation grew over time. Moreover, the increased representation of women in manufacturing is led by an increase of women-owned SMEs in the sector at the expense of others, such as accommodation and food services. Additionally, while the share of women-owned SMEs in information and cultural industries, and professional, scientific and technical services did grow, the concentration of women-owned SMEs in those sector did significantly increase in 2017 (44.0 percent) since 2011 (37.4 percent), and both these sectors exhibit relatively high export propensities. The distribution of women-owned SMEs across industries is presented in Figure 8:
Figure 8 – Distribution of Women-owned SMEs amongst Industries, 2011, 2014, 2017
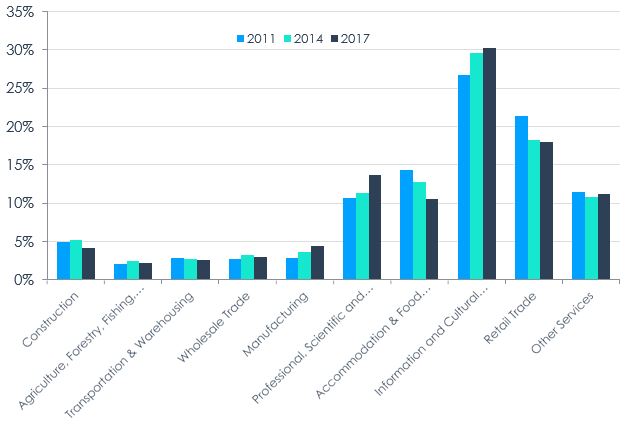
Text version
| 2011 | 2014 | 2017 |
|---|---|---|---|
Manufacturing | 11.4% | 10.8% | 11.1% |
Wholesale Trade | 21.4% | 18.2% | 17.9% |
Professional, Scientific and Technical Services | 26.7% | 29.6% | 30.3% |
Transportation and Warehousing | 14.4% | 12.8% | 10.6% |
Retail Trade | 10.7% | 11.4% | 13.7% |
Information and Cultural Industries | 2.8% | 3.6% | 4.4% |
Agriculture, Forestry, Fishing, Hunting; Mining and Oil and Gas Extraction | 2.7% | 3.2% | 3.0% |
Accommodation and Food Services | 2.9% | 2.7% | 2.6% |
Other Services | 2.1% | 2.5% | 2.2% |
Construction | 5.0% | 5.3% | 4.2% |
Source: Office of the Chief Economist, Global Affairs Canada using data obtained from Statistics
Canada, Survey on Financing and Growth of Small and Medium Enterprise, 2011, 2014,
2017.
Attributing each year’s (2011, 2014 and 2017) export propensity by industry to the distribution of women-owned SMEs across industries in 2017 permits for the estimation of the impact of these shifts on the evolution of women-owned SMEs’ export propensity. For example, the share of women-owned SMEs in manufacturing increased from 6.5 percent in 2011 to 12.2 percent in 2017 (Figure 7). In other words, women-owned SMEs in the manufacturing sector grew by 57.1 percent (Figure 8). As noted, in 2017, the manufacturing sector boasted of the highest export propensity of all industries at 35.2 percent. Simultaneously, the share of women-owned enterprises in accommodations and food services fell from 25.4 percent in 2011 to 19.9 percent in 2017 (Figure 7), a decrease of 26.4 percent of women-owned businesses in the sector to the benefit of others (Figure 8). This is an industry with a relatively low propensity to export of 5.3 percent. Considering these numbers are averages, holding export propensities constant at the 2017 levels, and without taking into account other factors, it can be demonstrated that these sectoral shifts had a significant impact on the changing export propensity of women-owned businesses. Indeed, the partial counterfactual analysis shows that women-owned SMEs would have had estimated export propensities of 8.4 percent in 2011 and 10.0 percent in 2014 instead of 5.0 percent and 8.4 percent, respectively.Footnote 7 As such, in addition to smaller SMEs exporting more than they used to, the shifts in industries in which women-owned enterprises operate appears to be a significant factor leading to their increased export propensity over time.
The increased entry of women-owned enterprises in traditionally men-dominated exporting sectors, which typically pay higher wages, leads to a more inclusive economy. Moreover, as those sectors grow in value and number of firms, the benefits are shared among a larger group of individuals.
iii. Export intensity
The average export intensityFootnote 8 of SMEs places export propensity results into context by contrasting the share of firms that export with the average percentage of their revenues derived from sales abroad. High growth firms have higher export intensities (approaching 10 percent) compared to firms with no growth, around 3 percent (Statistics Canada, Survey on Financing and Growth of SMEs (SFGSMEs), 2017). This trend is likely correlated with the growth intentions of businesses. A business more domestically focused will not strive to increase the proportion of its revenues derived from exports. However, the data clearly shows that between 2011 and 2017, women-owned SMEs have considerably increased their export intensity. Figure 9 presents the average percentage of exporting SMEs’ sales abroad by majority gender of ownership.
Figure 9 – Average Percentage of Sales Sold Outside of Canada by Majority Gender of Ownership, 2011 and 2017
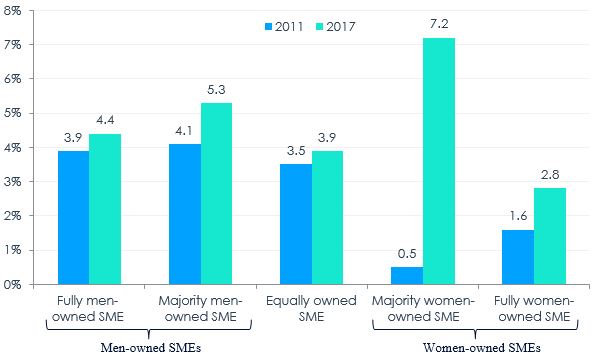
Text version
| 2011 | 2017 |
|---|---|---|
Women-owned SMEs - Fully women-owned SMEs | 1.6% | 2.8% |
Women-owned SMEs - Majority women-owned SMEs | 0.5% | 7.2% |
Equally owned SMEs | 3.5% | 3.9% |
Men-owned SMEs - Majority men-owned SMEs | 4.1% | 5.3% |
Men-owned SMEs - Fully men-owned SMEs | 3.9% | 4.4% |
Source: Office of the Chief Economist, Global Affairs Canada. Calculations made by the author
using data obtained from Statistics Canada, Survey on Financing and Growth of Small and
Medium Enterprises, 2011, 2017.
All groups of SMEs have increased their export intensity from 2011 to 2017 and most notably women-owned SMEs. As such, over the period of 2011 to 2017, a greater share of women-owned SMEs export and furthermore they export a higher percentage of their sales, which is evidence of their increasing integration into the global economy.
However, Figure 9 identifies one particular outlier: majority women-owned SMEs, i.e. enterprises with 51 to 99 percent women ownership. This group experienced the most important change in export intensity from 2011 to 2017, from being the least export intensive to the most export intensive group. However, most women-owned SMEs are fully women-owned SMEs, i.e. with 100% women ownership. Over 80 percent of women-owned SMEs are fully women-owned, such that on average, women-owned SMEs have an average export propensity of 3.5 percent in 2017 compared to 1.4 percent in 2011. Similarly, fully men-owned SMEs form the majority of men-owned (majority and fully owned) SMEs. The average percentage of sales abroad of men-owned SMEs stood at 3.9 percent in 2011 and rose to 4.5 percent in 2017.
iv. Import Trade
As women-owned SMEs have increased their activities on the export side of the global economy, recent data further shows that they are also active on the import side, in line with other Canadian SMEs (see Table 1).
Table 1 - Import Propensity of SMEs by Majority Gender of Ownership, 2017
Import goods or services as intermediary inputs | Import goods for re-sale as is | Import services | |
Fully men-owned | 12.3% | 12.6% | 4.7% |
Majority men-owned | 16.5% | 17.9% | 5.7% |
Equally owned | 12.4% | 12.7% | 3.2% |
Majority women-owned | 11.7% | 19.7% | 4.7% |
Fully women-owned | 9.0% | 14.1% | 2.6% |
Average SME | 12.3% | 13.6% | 4.2% |
Source: Office of the Chief Economist, Global Affairs Canada using data obtained from the Statistics
Canada, Survey on Financing and Growth of Small and Medium Enterprises, 2017.
Women-owned SMEs appear to be fairly well represented in importing activities. The import activity of SMEs by majority gender of ownership provides insights into the type of business that they run. For example, nearly 1 in 5 majority women-owned SME reported importing goods from outside of Canada for re-sale as is, which is an import activity associated with e-commerce. This above average rate suggests that many majority women-owned SMEs operate in e-commerce. Women-owned and men-owned SMEs alike engaging in e-commerce are more likely to export and import than their counterparts with no online presence (Suominen, 2018). E-commerce is an industry previously identified for offering export opportunities to micro and tiny enterprises. Further analysis on the impact of digital trade, and more specifically e-commerce, in the context of trade diversification will be included in a forthcoming publication on women-owned exporting SMEs.
Conclusion
The analysis of systematic differences based on the majority gender of ownership of Canadian SMEs is useful to identify areas where differential treatment due to gender may occur in business. Although no causal links are identified based on the data used, the respective experiences of women and men in business differ even though business laws, regulations, and practices are thought to be gender-neutral.
The proportion of women-owned exporting SMEs has doubled from 2011 to 2017. Moreover, women-owned SMEs, unlike men-owned SMEs and equally owned SMEs, saw their export propensity (share of exporters) increase in 2017 relative to 2014. In fact, women-owned SMEs export propensity has continuously improved since 2011 and it is in part due to smaller businesses, in which women-owned enterprises have a proportionally higher share, entering international markets at a greater rate and in part due to a sectoral shift in which women-owned SMEs tend to operate.
The export intensity of SMEs overall increased for all gender groupings considered in this study, but women-owned enterprises presented the most remarkable growth from 2011 to 2017 with their export intensity experiencing a 2.5-fold jump (150 percent) compared to an average increase of 22.9 percent for all SMEs. The evidence suggests that this high export intensity may be related to women-owned enterprises’ activities in e-commerce, notably majority (51% to 99%) women-owned SMEs, which have increased both their importing activities for re-sale and their exporting activities.
The findings presented in this paper are a step forward to inform trade negotiations and policy-making to address the national socio-economic contexts of Canadian women and men leading businesses to reach and expand their operations in international markets.
Women-owned SMEs appear to have significantly reduced the gap in export participation, but they still account for a relatively small share of exporters overall due to the persisting entrepreneurial gap: women self-employment grew by 10.6 percent, but the share of women-owned SMEs has remained unchanged since 2011.
References
Baldwin, R. and Yan, B., Statistics Canada, Economic Analysis (EA) Research Paper Series, Empirical Evidence from Canadian Firm-level Data on the Relationship Between Trade and Productivity Performance, June 2015.
Beckton et al., The Beacon Agency, Carleton University, BMO Financial Group and the Government of Canada, Everywhere, Every Day Innovation. Women Entrepreneurs and Innovation, February 2018.
Catherine Décarie, Export Development Canada, Blog, Why Women are Important to International Trade, March 2018.
Ciuriak et al., Global Policy, Firms in International Trade: Trade Policy Implications of the New New Trade Theory, Volume 6, Issue 2, May 2015.
Grekou, D. et al., Statistics Canada, Economic Insight, Women-owned Enterprises in Canada, Catalogue no. 11-626-X. No. 083, September 2018.
Hughes, K., Global Entrepreneurship Monitor, GEM Canada Report on 2015/16 Women’s Entrepreneurship, November 2017.
Innovation, Science and Economic Development Canada (ISED), Small Business Branch, Key Small Business Statistics – January 2019, 2019.
Office of the Chief Economist, Global Affairs Canada (GAC), Majority-Female Owned Exporting SMEs in Canada, 2016.
Organisation for Economic Cooperation and Development (OECD), OECD Studies on SMEs and Entrepreneurship, SME and Entrepreneurship Policy in Canada, 2017.
Orser, B., Riding, A. and Townsend, J., Exporting as a Means of Growth for Women-owned SMEs, Journal of Small Business and Entrepreneurship 17, no. 3 (Summer 2014), pp. 153-176.
Small Business Branch, Industry Canada, Majority Female-Owned Small and Medium-Sized Enterprises, Special Edition – Key Small Business Statistics, May 2015.
Statistics Canada, The Daily, Canadian MegaTrends, The surge of women in the workforce, 17 May 2018.
Statistics Canada, Survey on Financing and Growth of Small and Medium Enterprises, 2011, SFGSMEs, published by Innovation, Science and Economic Development Canada.
Statistics Canada, Survey on Financing and Growth of Small and Medium Enterprises, 2014, SFGSMEs, published by Innovation, Science and Economic Development Canada.
Statistics Canada, Survey on Financing and Growth of Small and Medium Enterprises, 2017, SFGSMEs, published by Innovation, Science and Economic Development Canada.
Suominen, K., International Centre for Trade and Sustainable Development, Issue Paper, Women-Led Firms on the Web: Challenges and Solutions, October 2018.
University of Ottawa, Telfer School of Management, Taskforce for Women’s Business Growth, Taskforce roundtable recommendations, November 2011.
Young, Lesley, Canadians are most active women entrepreneurs in the world, University of Alberta, December 2017.
- Date modified: