Economic Impact of the Canada–Peru Free Trade Agreement, 15th Anniversary
November 2024
Table of contents
- Key messages
- Executive summary
- Bilateral merchandise trade under the CPFTA
- Investment
- Services trade
- Utilization of CPFTA preferences
- Assessing the effects of the CPFTA on trade
- Conclusions
- Bibliography
- Appendix
1. Key messages
- 2024 marks the 15th anniversary of the Canada-Peru Free Trade Agreement (CPFTA). Peru has advanced from being Canada's third-largest trade partner in the South America in 2007 to the second most important partner in the area today.
- Bilateral merchandise trade between Canada and Peru has more than doubled since the inception of the CPFTA. In 2023, Canadian merchandise exports to Peru exceeded $1.6 billion, up from $356 million in 2007. During the same period, Canada's merchandise imports from Peru more than doubled to $4.7 billion from $2.1 billion.
- The Office of the Chief Economist at Global Affairs Canada estimates that the CPFTA has accelerated the growth of merchandise trade between Canada and Peru by 6% annually compared to a scenario without the agreement. This substantial increase means the estimated cumulative effect of the CPFTA on trade since the inception has reached $5.5 billion.
- A significant amount of the increase in trade stems from products that were either not traded or traded in small amounts prior to the agreement. These products accounted for 10% of Canada's exports to Peru in 2007 but grew to represent 37% of Canadian exports in 2023. Similarly, such products made up 10% of Canada's imports from Peru in 2007 and increased to 20% in 2023.
- Small and medium-sized enterprises (SMEs) played a crucial role in the trading relationship; from 2005 to 2022, SMEs represented 88% of Canadian companies exporting to Peru and contributed to nearly half of total exports during this period.
- The utilization of CPFTA preferences in bilateral trade has increased significantly over the years. In 2023, 73% of all eligible Canadian merchandise exports to Peru claimed CPFTA preferences, up from 20% in 2010. On the import side, the utilization of CPFTA preferences of the Canadian imports from Peru increased from 43% in 2010, to 78% in 2023.
- The CPFTA has also supported greater trade in environmental goods. From 2007 to 2023, Canada's exports of environmental goods to Peru grew at an annualized rate of 4.2%, resulting in a net increase of over $43 million. At the same time, Canada's imports of environmental goods from Peru grew at an annualized rate of 8.5%, a net increase of $6.2 million.
- The stock of Canadian direct investment in Peru grew more than sevenfold from $2.2 billion in 2007 to $15.6 billion in 2023. By 2023, Peru had become the third largest destination for Canadian outward investment in South America.
2. Executive summary
The year 2024 marks the 15th anniversary of the implementation of the Canada-Peru Free Trade Agreement (CPFTA), which officially came into force on August 1, 2009. The agreement was a significant milestone for both Canada and Peru. For Canada, it reinforced its commitment to expanding trade within South America, building on the strategy to enhance Canada's competitiveness through trade liberalization initiatives and bilateral agreements. For Peru, the CPFTA was a crucial step toward deeper integration into the global economy and marked the beginning of a series of subsequent free trade agreements with other developed economies.
The CPFTA has had a profound impact on trade between the two countries. Bilateral merchandise trade has more than doubled since the CPFTA came into effect. In 2023, Canadian merchandise exports to Peru reached over $1.6 billion, up from $356 million in 2007. Canada's merchandise imports from Peru more than doubled to $4.7 billion in 2023, relative to their value of $2.1 billion in 2007. Analysis in this report estimates that trade between Canada and Peru grew 8.6% faster annually due to the CPFTA compared to if an FTA had never been signed. This represents a significant increase in trade: from 2009 to 2023, the estimated total cumulative effect of the CPFTA on trade between Canada and Peru reached $5.5 billion.
The impressive growth in bilateral trade was fueled by tariff reductions under the CPFTA that encouraged trade in new products. Products that were previously not traded or were traded in small amounts before the CPFTA accounted for a substantial part of the export gains. For instance, 37% of Canada's exports to Peru in 2023 were made up of these infrequently traded products, while they made up only 10% of Canada's exports in 2007. Canada's imports from Peru saw similar growth, where these infrequently traded products comprised 20% of imports in 2023 compared to 10% in 2007. The data indicate that removing tariff barriers through the CPFTA was an important contributor to the significant increase in bilateral trade between the two countries.
High utilization of the agreement led to significant tariff savings of $22 million for Canadian and Peruvian traders in 2023. In that year, 73% of preference-eligible Canadian exports to Peru claimed CPFTA preferences, marking a substantial rise from just 20% in 2010. Similarly, the utilization of CPFTA preferences for Canadian imports from Peru grew from 43% in 2010 to 78% in 2023. The tariff reductions provided by the CPFTA allowed Canadian importers from Peru to save approximately $15 million in duties in 2023, while the tariff savings for Peruvian importers from Canada reached $7 million. These figures demonstrate that importers from both countries have benefited and continue to benefit from tariff liberalization under the agreement.
However, the CPFTA did more than just reduce tariffs between the two countries. The agreement also established a framework to promote bilateral cooperation on investment and environmental protection. Canadian direct investment (CDI) in Peru has seen remarkable growth since the agreement came into force. In 2023, the stock of CDI reached $15.6 billion, more than seven times its value of $2.2 billion in 2007. In terms of environmental protection, trade in environmental goods has experienced robust growth since the implementation of the agreement. Canada's exports of environmental goods to Peru grew at a compound annual rate of 4.5% from 2007 to 2023, while Canada's imports of environmental goods grew at a compound annual rate of 8.5% over the same period. With total trade of environmental goods between Canada and Peru reaching $98.3 million in 2023, the CPFTA has been effective in fostering trade in these goods.
3. Bilateral merchandise trade under the CPFTA
Two-way merchandise trade between Canada and Peru has increased considerably since the CPFTA was implemented, reaching a record high of $6.3 billion in 2023, after growing by $3.8 billion since 2007 representing an annual average growth rate of 6% (Figure 1).Footnote 1
Figure 1. Canada-Peru bilateral merchandise trade, $ billions
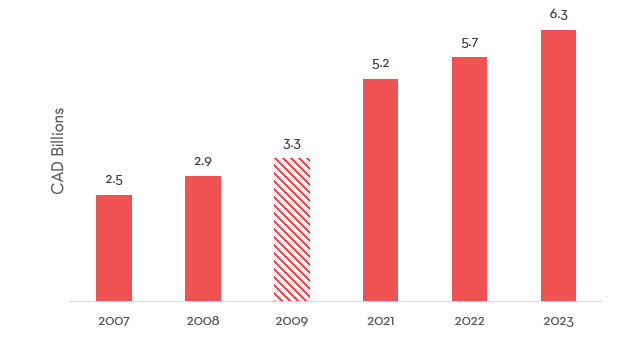
Text version - Figure 1
| Year | Canada-Peru bilateral merchandise trade, $ billions |
|---|---|
| 2007 | 2.5 |
| 2008 | 2.9 |
| 2009 | 3.3 |
| 2021 | 5.2 |
| 2022 | 5.7 |
| 2023 | 6.3 |
Note: the CPFTA entered into force on August 1st, 2009.
Data: Government of Peru and Statistics Canada
Building on this significant growth, as of 2023 Peru was Canada's second-largest trade partner in South America. To put this increase in total trade into regional perspective, Figure 2 depicts the trade growth between Canada and the South American countries between 2007 and 2023. Brazil remains the largest Canadian trade partner, with a total trade value of approximately $14 billion in 2023, reflecting an impressive increase of $8.6 billion since 2007 and an annualized growth rate of about 6.3%. Colombia and Ecuador also show notable increases, with Colombia reaching a trade value of $2.8 billion and a growth rate of 5.7% annually, and Ecuador achieving one of the highest growth rates at 8.5%, with a trade value of $1.6 billion in 2023. Conversely, Venezuela has experienced a significant decline, with its trade value reducing by approximately $1.9 billion, leading to a negative annual growth rate of -12.8%.
Figure 2. Canadian two-way merchandise trade with South America, 2007-2023, $ millions
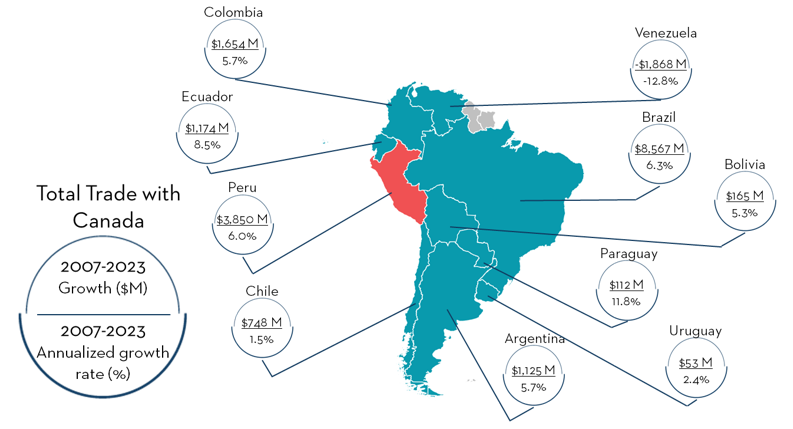
Text version - Figure 2
| Country | Canadian two-way merchandise trade growth, $ millions | Annualized growth rate (%) |
|---|---|---|
| Brazil | 8,567 | 6.3% |
| Peru | 3,850 | 6.0% |
| Colombia | 1,654 | 5.7% |
| Ecuador | 1,174 | 8.5% |
| Argentina | 1,125 | 5.7% |
| Chile | 748 | 1.5% |
| Bolivia | 165 | 5.3% |
| Paraguay | 112 | 11.8% |
| Uruguay | 53 | 2.4% |
| Venezuela | -1,868 | -12.8% |
Data: Government of Peru, Statistics Canada and Global Trade Atlas
Figure 3 depicts the evolution of Canada-Peru bilateral trade from 2000 to 2023. Following the implementation of the CPFTA in 2009, Canadian exports to Peru showed a marked increase. In 2007, two years before the agreement was put into force, exports were valued at approximately $356 million. By 2023, they had reached a record high of approximately $1.6 billion. This represents an increase of almost $1.3 billion in export value from 2007 to 2023, averaging an annual growth rate of 10%.
Canadian imports from Peru, also illustrated in Figure 3, showed a significant increase. Prior to the implementation of the agreement in 2007, imports were approximately $2.1 billion. In the years that followed, this figure grew to reach a record high of $4.7 billion by 2023, more than doubling its initial value. This increase translates into a compound annual growth rate of about 5.1% from 2007 to 2023, indicating a strengthened demand for Peruvian products in the Canadian market.
Figure 3. Canada-Peru merchandise trade, 2000-2023, $ billions
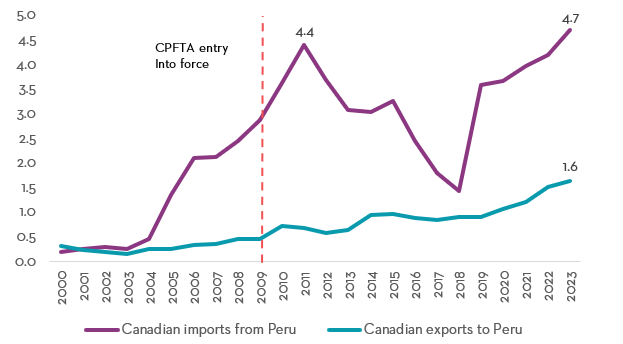
Text version - Figure 3
| Year | Canadian exports to Peru ($ billions) | Canadian imports from Peru ($ billions) |
|---|---|---|
| 2000 | 0.3 | 0.2 |
| 2001 | 0.2 | 0.3 |
| 2002 | 0.2 | 0.3 |
| 2003 | 0.2 | 0.3 |
| 2004 | 0.3 | 0.5 |
| 2005 | 0.3 | 1.4 |
| 2006 | 0.3 | 2.1 |
| 2007 | 0.4 | 2.1 |
| 2008 | 0.5 | 2.5 |
| 2009 (CPFTA entry into force) | 0.5 | 2.9 |
| 2010 | 0.7 | 3.6 |
| 2011 | 0.7 | 4.4 |
| 2012 | 0.6 | 3.7 |
| 2013 | 0.6 | 3.1 |
| 2014 | 0.9 | 3.0 |
| 2015 | 1.0 | 3.3 |
| 2016 | 0.9 | 2.5 |
| 2017 | 0.8 | 1.8 |
| 2018 | 0.9 | 1.4 |
| 2019 | 0.9 | 3.6 |
| 2020 | 1.1 | 3.7 |
| 2021 | 1.2 | 4.0 |
| 2022 | 1.5 | 4.2 |
| 2023 | 1.6 | 4.7 |
Data: Government of Peru and Statistics Canada
However, the trajectory of Canadian imports from Peru has not followed a consistently upward trend and has shown considerable variability. After experiencing significant growth from 2000 to 2011, where imports rose from approximately $189 million to over $4.4 billion, a marked downturn occurred. From 2011 to 2018, imports fell from their peak to a low of $1.4 billion. Starting in 2019, a recovery began, with import values increasing steadily to $4.7 billion by 2023.
3.1. Sectoral performance
To better understand the substantial shifts in trade between Canada and Peru from 2011 to 2023, this section examines trade performance at the sector level.
In the early 2000s, Peru rapidly expanded its global trade, primarily driven by exports of precious metals (mostly gold), raw ores, and refined copper. As a significant producer of high-purity gold, Peru’s gold exports accounted for up to a quarter of its total exports during this period. Although both the value and quantity of gold exported by Peru have increased over time, gold’s share of total exports has diminished as Peru diversified its export portfolio to include products such as edible fruits and nuts, fish and crustaceans, and coffee. By 2023, gold constituted less than 15% of Peru’s exports, despite its value being significantly higher than in the early 2000s.
Initially, Canada’s imports from Peru consisted of products other than gold. However, starting in 2004, Canada began importing gold from Peru, and by 2005, gold imports accounted for two-thirds of Canada’s total imports from Peru. By 2011, gold represented over 70% of Canada’s imports from Peru.
The growth in Peru’s gold exports was partly due to increased world prices during the 2008-09 financial crisis. As stock markets fell, investors turned to gold as a stable asset, leading to record high prices. Gold prices remained elevated until 2011, after which they declined significantly. This decline in world gold prices led to a decrease in Peru’s gold export quantities over the next several years, before beginning to rise again around 2016.
Conversely, Canada maintained and even increased its gold imports in the years following 2011. While imports of gold from Peru declined during this period, Canada sourced gold from other South American countries such as Argentina and Chile. However, between 2017 and 2018, Canada’s gold imports from Chile and Argentina experienced significant declines. These two years marked a low point in Canada’s overall gold imports, which began to recover in 2019, largely due to increased imports from Peru.
Beyond nonmonetary gold, which accounted for nearly 84% of Canada’s total import growth from Peru between 2007 and 2023, significant growth was also observed in the sectors of edible fruits and nuts, which rose from $18 million to $443 million, and the coffee and tea sector, which increased from $25 million to $110 million.
Figure 4. Sectors with the most growth of total imports by Canada from Peru, 2007-2023, $ millions
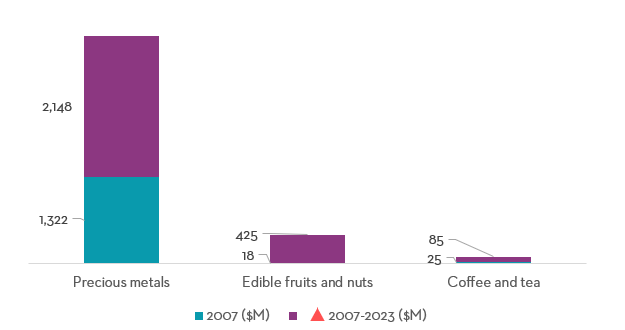
Text version - Figure 4
| Harmonized System Chapter | 2007 ($ million) | 2023 ($ million) | Change 2007-2023 ($ million) |
|---|---|---|---|
| Precious metals | 1,322.3 | 3,470.3 | 2,147.9 |
| Edible fruits and nuts | 17.7 | 442.6 | 424.9 |
| Coffee and tea | 25.3 | 110.2 | 84.9 |
Data: Statistics Canada.
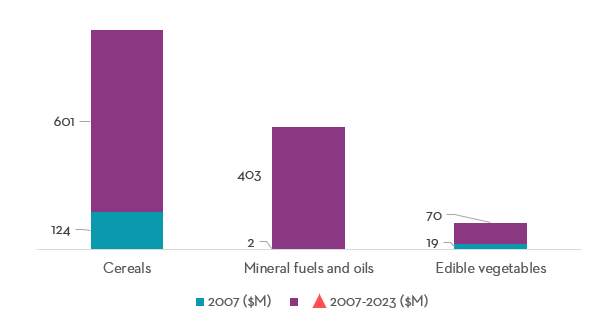
Regarding Canadian exports to Peru, three Harmonized System (HS) chapters accounted for 84% of the total increase in export value between 2007 and 2023 (Figure 5). The largest growth was observed in the cereals sector (HS 10), which saw an increase from $124 million in 2007 to $725 million in 2023, a surge of $601 million. Similarly, the mineral fuels and oils sector (HS 27) experienced dramatic growth, rising from just $1.9 million to $405 million, an increase of $403 million. The edible vegetables sector (HS 7) also saw considerable growth, with exports rising from $19 million to $89 million, an increase of $70 million. These three sectors combined played a pivotal role in the substantial rise in total export value to Peru, which increased by $1.3 billion over the same period.
Figure 5. Sectors with the most growth of total exports by Canada to Peru, 2007-2023, $ millions
Text version - Figure 5
| Harmonized System Chapter | 2007 ($ million) | 2023 ($ million) | Change 2007-2023 ($ million) |
|---|---|---|---|
| Cereals | 124.2 | 725.0 | 600.8 |
| Mineral fuels and oils | 1.9 | 404.6 | 402.7 |
| Edible vegetables | 19.0 | 89.2 | 70.2 |
Data: Government of Peru
3.2. Trade growth by CPFTA tariff preferences
Further analysis can be conducted to examine the trade creation effects of tariff reductions under the CPFTA. It is generally expected that products receiving the highest tariff reductions would also exhibit the highest trade growth compared to products that received lower reductions or for products where their most-favoured nation (MFN) tariffs were already duty-free before the agreement. There can be some exceptions to this, however, as industries that are protected by high tariffs might also protected by other non-tariff barriers.
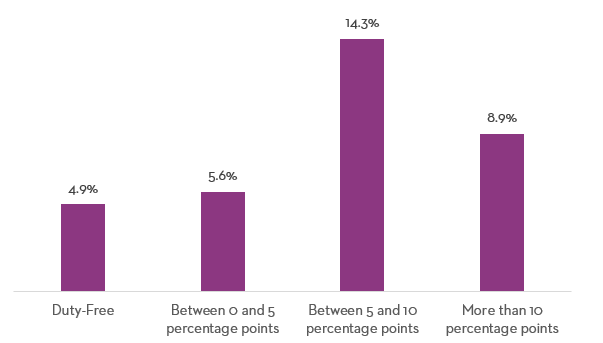
Figure 6 illustrates the compound annual growth rate of Canada's imports from Peru, categorized by the extent of the tariff reduction under the CPFTA. As shown, products with substantial tariff reductions, specifically those over 10 percentage points, saw an average annual growth rate of 8.9% from 2007 to 2023. Products with tariff reductions between 5 and 10 percentage points grew at an annualized rate of 14.3% during the same period. Meanwhile, products that benefited from smaller reductions, between 0 and 5 percentage points, also saw growth, albeit at a lower rate of 5.6%. Duty-free products, both before and after the CPFTA, experienced growth rates of 4.9%.
Figure 6. Growth in Canadian imports from Peru by preference margin, 2007-2023, annualized growth rate
Text version - Figure 6
| Preference margin | Annualized growth rate (%) |
|---|---|
| Duty-Free | 4.9 |
| Between 0 and 5% | 5.6 |
| Between 5 and 10% | 14.3 |
| More than 10% | 8.9 |
Data: Statistics Canada and Canada Border Services Agency
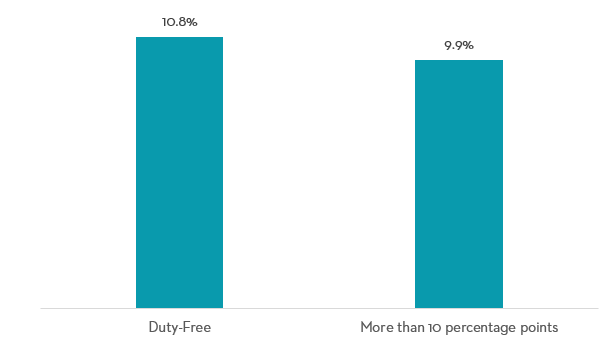
Given the structure of the Peruvian tariff schedule in 2007, which consisted only of MFN duty-free items or tariffs greater than 10%, Figure 7 depicts the compound annual growth rates of Canadian exports only across these two categories. Products that retained their duty-free status post-agreement recorded a robust annual growth rate of 10.8%. In contrast, products that benefited from significant tariff reductions, those reduced by more than 10 percentage points, also showed substantial growth, with exports in this category expanding at an annual rate of 9.9%. Although this rate is slightly lower than that for duty-free products, it remains impressively high, effectively highlighting the positive impact of major tariff reductions on export growth.
Figure 7. Growth in Canadian exports to Peru by preference margin, 2007-2023, annualized growth rate
Text version - Figure 7
| Preference margin | Annualized growth rate (%) |
|---|---|
| Duty-Free | 10.8 |
| More than 10% | 9.9 |
Data: Government of Peru
Overall, products that received larger tariff reductions under the CPFTA tended to see strong growth. For Canadian imports, these products significantly outperformed the trade growth of products with modest or no tariff cuts. For Canadian exports, the growth rates of products that benefited from substantial tariff reductions were comparable to, and nearly as significant as, those for duty-free products. This underscores the CPFTA's effectiveness in stimulating trade and demonstrates the mutual benefits of significant tariff reductions.
3.3. Trade by size of Canadian exporters
The analysis now examines the contributions to value and the distribution of exporters among Canadian companies based on their employment size. Using Statistics Canada definitions, small and medium enterprises (SMEs) are categorized as those with fewer than 500 employees, whereas large enterprises encompass those with 500 or more employees. On average, from 2005 to 2022, SMEs accounted for nearly half of the export value to Peru and represented about 88% of the exporters.
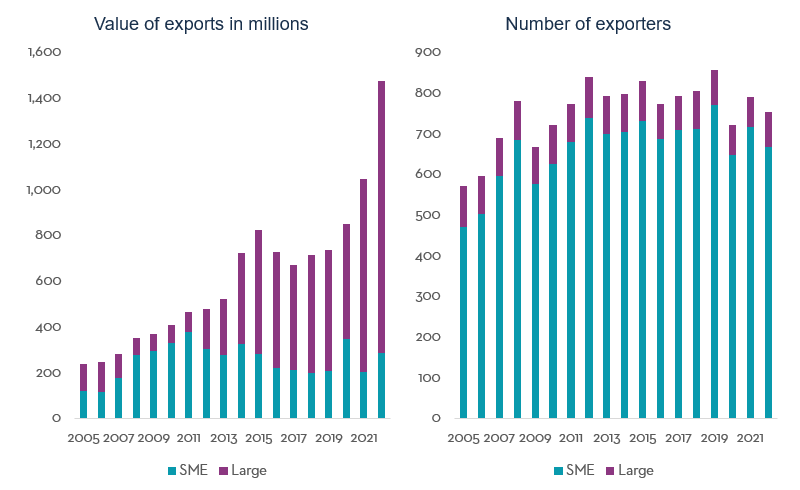
The right panel of Figure 8 illustrates the evolution of the number of Canadian companies exporting to Peru, classified by company size. The number of firms exporting to Peru has increased between 2005 and 2022, with the entirety of the growth being attributed to SMEs. Although there have been some fluctuations in the number of SME exporters over the years, particularly during 2020 likely due to the impacts of the COVID-19 pandemic, the number of SME exports to Peru increased from 471 in 2005 to 668 in 2022. Despite some fluctuations, SME’s proportion of the total number of exporting companies remained relatively stable, consistently around 88%. In contrast, the number of large companies exporting to Peru has slightly decreased, dropping from 101 companies in 2005 to its lowest at 75 in 2020, before slightly recovering to 84 companies in 2022.
In the early years prior to and immediately after the signing of the CPFTA, SMEs accounted for the majority of the value of Canadian exports to Peru (left panel of Figure 8). By 2011, exports of Canadian SMEs peaked, exporting $376 million worth of merchandise to Peru, which constituted approximately 81% of the total export value for that year. In the years that followed, large Canadian firms began to substantially increase their exports, which by 2022 reached more than $1 billion and contributed 81% of the total export value in that year. The value of SME exports, on the other hand, has declined moderately since the 2011 peak but has otherwise remained mostly stable. The increasing prominence of large firms in the value of trade matches the understanding of key sectors that have benefitted from the CPFTA. For example, while cereal producing farms have benefitted from an increase in exports under the agreement, the distribution and export of agricultural products are generally handled by large firms. Thus, while increases in cereal exports are attributed to large firms in this analysis, it is important to keep in mind that some of the benefits are also accruing to farm owners, which are often owned by small businesses.
Figure 8. Canadian exports by company size to Peru, 2005-2022
Text version - Figure 8
| Year | Value of SME exports, $ millions | Value of large firm exports, $ millions | Number of SME exporters | Number of large firm exporters |
|---|---|---|---|---|
| 2005 | 117.1 | 118.5 | 471 | 101 |
| 2006 | 115.6 | 129.8 | 503 | 93 |
| 2007 | 173.7 | 105.8 | 596 | 93 |
| 2008 | 274.5 | 74.5 | 684 | 95 |
| 2009 | 295.1 | 73.6 | 577 | 89 |
| 2010 | 326.9 | 81.9 | 625 | 97 |
| 2011 | 376.4 | 89.3 | 679 | 94 |
| 2012 | 300.7 | 175.3 | 739 | 99 |
| 2013 | 274.4 | 247.7 | 700 | 92 |
| 2014 | 324.1 | 398.5 | 704 | 92 |
| 2015 | 281.7 | 539.6 | 732 | 98 |
| 2016 | 219.0 | 508.0 | 686 | 86 |
| 2017 | 209.7 | 459.5 | 709 | 84 |
| 2018 | 195.7 | 517.7 | 712 | 93 |
| 2019 | 206.1 | 527.0 | 770 | 85 |
| 2020 | 346.5 | 501.4 | 647 | 75 |
| 2021 | 203.3 | 842.3 | 715 | 76 |
| 2022 | 283.3 | 1,191.7 | 668 | 84 |
Value of exports in millions
Number of exporters
Data: Statistics Canada, table 12-10-0095-01
The observed patterns indicate that although the overwhelming majority of Canadian exporters to Peru are SMEs, large companies have significantly increased their contribution to the total value of exports in recent years. This trend, however, is not specific to Peru and can in fact be observed in other South American countries. For instance, in 2022, large Canadian companies exporting to Ecuador and Venezuela accounted for 83% and 74% of the Canadian exports to these two countries, respectively, despite representing less than 11% of the total number of exporters to those countries.
3.4. Trade and gender
The availability of detailed company-level data enables the analysis of contributions to total exports to Peru and the number of exporting companies, categorized by the gender of their ownership.
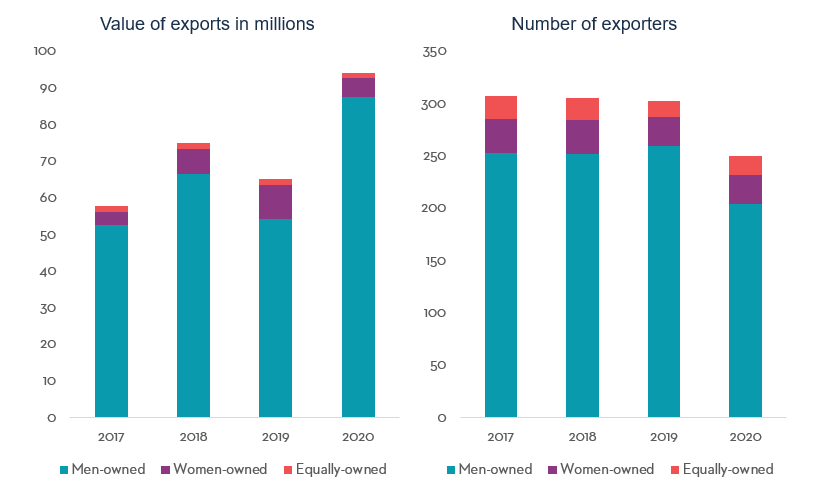
Between 2017 and 2020, on average, women-owned companies constituted roughly 10% of the total number of Canadian exporting firms to Peru (Figure 9). In 2017, 32 women-owned companies were exporting to Peru, a figure that remained stable in 2018 and slightly declined to 28 by 2019 and 2020. Male-owned companies comprised the majority, with the number of such firms going from 253 in 2017 to 204 in 2020, reflecting a decrease over the four years. Companies equally owned by men and women also showed a presence, though smaller in number, with their contribution ranging from 22 firms in 2017 to 18 in 2020.
Figure 9. Canadian exports by ownership gender to Peru, 2017-2020
Text version - Figure 9
| Year | Value of exports, men-owned, $ millions | Value of exports, women-owned, $ millions | Value of exports, equally-owned, $ millions | Number of exporters, men-owned | Number of exporters, women-owned | Number of exporters, equally-owned |
|---|---|---|---|---|---|---|
| 2017 | 52.6 | 3.4 | 1.8 | 253 | 32 | 22 |
| 2018 | 66.4 | 7.0 | 1.6 | 252 | 32 | 21 |
| 2019 | 54.2 | 9.3 | 1.6 | 259 | 28 | 15 |
| 2020 | 87.4 | 5.3 | 1.5 | 204 | 28 | 18 |
Value of exports in millions
Number of exporters
Note: Only companies reporting the gender of their owners are included.
Data: Special tabulations provided by Statistics Canada
Between 2017 and 2020, women-owned businesses contributed, on average, 8.9% to the total exports from Canada to Peru, where the total export value is calculated only over the companies in which the gender of ownership is reported (Figure 9). Exports of women-owned companies from Peru went from $3.4 million in 2017 to a record-high of $9.3 million in 2019, accounting for 14.3% of the export value in that year. Following the COVID-19 pandemic in 2020, exports of these companies decreased to $5.3 million. Over these four years, exports from male-owned businesses dominated, with figures consistently increasing in each respective year. Specifically, in 2017, male-owned companies exported approximately $53 million worth of goods to Peru, which increased significantly in subsequent years, peaking at $87 million in 2020. Additionally, companies equally owned by men and women contributed modestly, with exports ranging between $1.5 million to $1.8 million annually during the same period.
3.5. Trade in environmental goods
Following the implementation of the CPFTA, a parallel Canada-Peru Agreement on the Environment was also signed. This agreement set up a structure dedicated to the conservation, protection, and improvement of the environment through cooperation and strict enforcement of environmental regulations. It also included provisions for collaborative environmental programs, a clause to prevent lowering environmental standards for economic gains, and a mechanism for resolving disputes (Canada-Peru Agreement on the Environment, 2009).
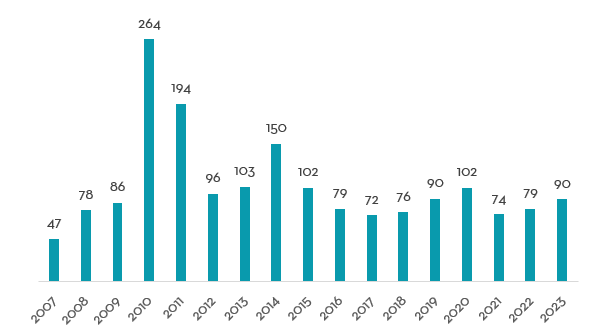
Data on the bilateral trade of environmental goods between Canada and Peru indicate that the environmental agreement has been effective in fostering trade in these goods.Footnote 2 Between 2007 and 2023, the total trade of environmental goods between the two nations grew by $49 million, achieving an annualized growth rate of 4.4%. Canadian exports of these goods to Peru increased from $47 million in 2007 to $90 million in 2023, marking an increase of $43 million at an annual growth rate of 4.2% (Figure 10). However, Canadian exports of environmental goods fluctuated over the years, including a large spike in 2010 and 2011 concentrated in energy-efficient machinery.
Figure 10. Canadian exports of environmental goods to Peru, 2007-2023, $ millions
Text version - Figure 10
| Year | Exports, $ millions |
|---|---|
| 2007 | 46.7 |
| 2008 | 78.1 |
| 2009 | 85.9 |
| 2010 | 263.9 |
| 2011 | 193.6 |
| 2012 | 96.0 |
| 2013 | 103.3 |
| 2014 | 150.0 |
| 2015 | 102.4 |
| 2016 | 79.4 |
| 2017 | 72.5 |
| 2018 | 75.7 |
| 2019 | 90.2 |
| 2020 | 102.4 |
| 2021 | 73.5 |
| 2022 | 79.3 |
| 2023 | 89.8 |
Data: Government of Peru
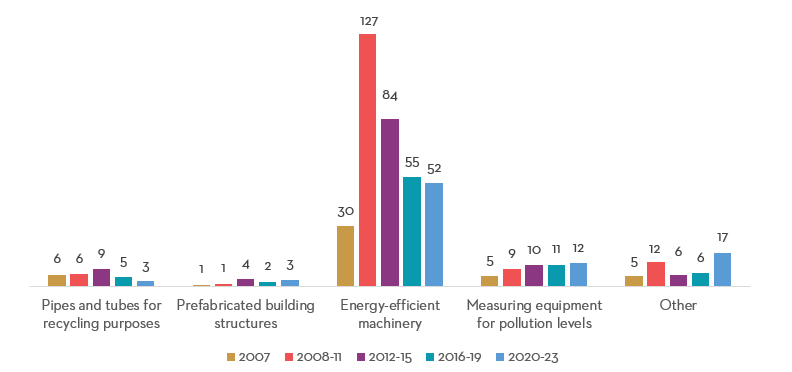
In terms of exports of environmental goods by category, Canadian exports of energy-efficient machinery to Peru reached $57 million in 2023, up from $30 million in 2007 (Figure 11) but below peak levels between 2008 and 2015. This represents an increase of $27 million, or an annualized growth rate of 4.1%. Exports of measurement equipment for pollution levels rose from $5.1 million in 2007 to almost $15 million in 2023, an increase of $9.7 million at an annual rate of 6.9%. Additionally, from 2007 to 2023, Canadian exports of prefabricated building structures to Peru increased by $1.6 million, achieving an annual growth rate of 7.2%. Conversely, exports of pipes and tubes for recycling purposes decreased by $3 million.
Figure 11. Value of Canadian exports of environmental goods to Peru by category, 2007-2023, $ millions
Text version - Figure 11
| Category | 2007 | 2008-11 | 2012-15 | 2016-19 | 2020-23 |
|---|---|---|---|---|---|
| Pipes and tubes for recycling purposes | 5.7 | 6.0 | 8.8 | 4.7 | 2.6 |
| Prefabricated building structures | 0.8 | 1.1 | 3.8 | 2.3 | 3.2 |
| Energy-efficient machinery | 30.2 | 127.2 | 84.1 | 55.1 | 51.9 |
| Measuring equipment for pollution levels | 5.1 | 8.7 | 10.5 | 10.8 | 11.6 |
| Other | 5.0 | 12.4 | 5.8 | 6.5 | 17.0 |
Data: Government of Peru
Note: After the base year 2007, the year ranges represent average yearly values.
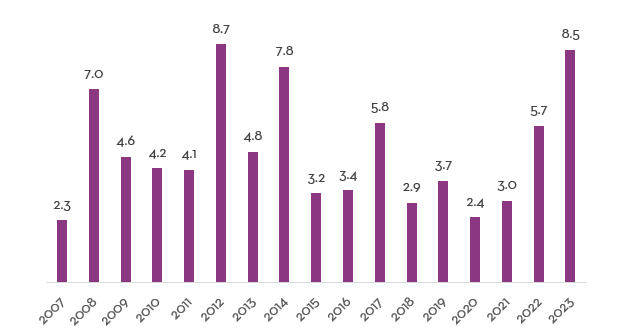
Meanwhile, Canadian imports of environmental goods from Peru rose from $2.3 million in 2007 to nearly $8.5 million in 2023, with a total increase of $6.2 million, representing a robust annual growth rate of 8.5% (Figure 12).
Figure 12. Canadian imports of environmental goods from Peru, 2007-2023, $ millions
Text version - Figure 12
| Year | Imports, $ millions |
|---|---|
| 2007 | 2.3 |
| 2008 | 7.0 |
| 2009 | 4.6 |
| 2010 | 4.2 |
| 2011 | 4.1 |
| 2012 | 8.7 |
| 2013 | 4.8 |
| 2014 | 7.8 |
| 2015 | 3.2 |
| 2016 | 3.4 |
| 2017 | 5.8 |
| 2018 | 2.9 |
| 2019 | 3.7 |
| 2020 | 2.4 |
| 2021 | 3.0 |
| 2022 | 5.7 |
| 2023 | 8.5 |
Data: Statistics Canada
Much like the case for exports, the growth in Canadian environmental goods imports from Peru is concentrated entirely in energy-efficient machinery, which increased from $558 thousand in 2007 to a record high of $7.8 million in 2023 (Figure 13). This growth represents an increase of $7.3 million, which corresponds to a compound annual growth rate of 18%. Canadian imports of other types of environmental goods from Peru did not experience significant changes or experienced moderate declines.
Figure 13. Value of Canadian imports of environmental goods from Peru by category, 2007-2023, $ millions
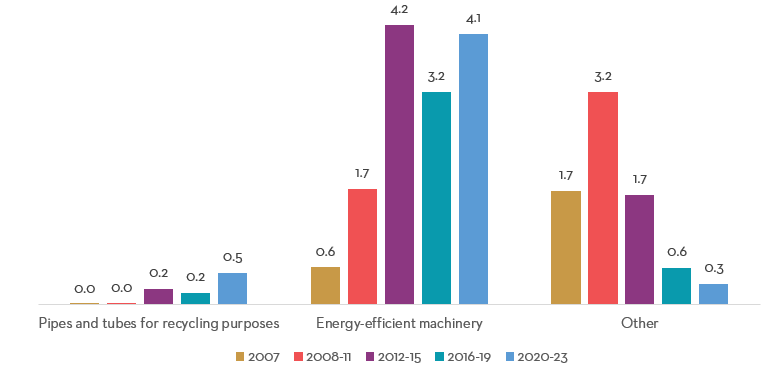
Text version - Figure 13
| Category | 2007 | 2008-11 | 2012-15 | 2016-19 | 2020-23 |
|---|---|---|---|---|---|
| Pipes and tubes for recycling purposes | 0.0 | 0.0 | 0.2 | 0.2 | 0.5 |
| Energy-efficient machinery | 0.6 | 1.7 | 4.2 | 3.2 | 4.1 |
| Other | 1.7 | 3.2 | 1.7 | 0.6 | 0.3 |
Data: Statistics Canada
Note: After the base year 2007, the year ranges represent average yearly values.
4. Investment
On November 14th, 2006, Canada and Peru signed a Foreign Investment Protection Agreement (FIPA), which came into force on June 20th, 2007. This bilateral agreement was designed to create a predictable environment for Canadian investors and to enhance Canada's competitiveness in the South American region (Foreign Affairs and International Trade Canada, 2006). Building on this foundation, the CPFTA, put into force in 2009, also included several complementary investment provisions. These provisions not only deepened the bilateral relationship between the two nations but also significantly enhanced Peru's investment regime.Footnote 3
Data on Canadian foreign direct investmentFootnote 4 (FDI) in Peru clearly illustrates a strong and steady upward trend beginning when the FIPA was implemented in 2007 (Figure 14). The stock of FDI in Peru grew substantially, increasing from $2.2 billion in 2007 to a peak of $17 billion in 2021. Despite a slight decline in the following years, by 2023, the FDI stock stood at nearly $16 billion. This represents a more than sevenfold increase from its 2007 level, corresponding to an annualized growth rate of 13% over this period. By 2023, Peru had become the 19th largest destination for Canadian outward investment globally and the third most significant in South America.
Figure 14. Canadian FDI in Peru, stock, 2000-2023, $ billions
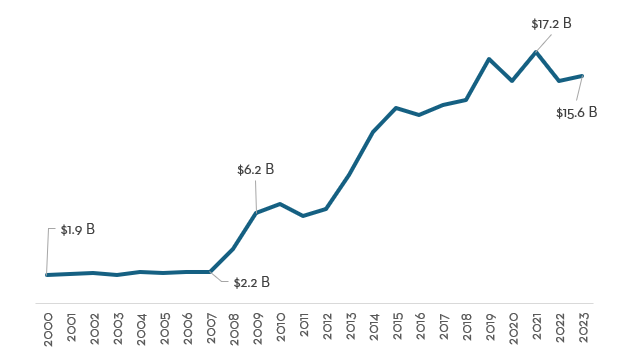
Text version - Figure 14
| Year | Canadian FDI in Peru, $ millions |
|---|---|
| 2000 | 1,925 |
| 2001 | 1,980 |
| 2002 | 2,081 |
| 2003 | 1,942 |
| 2004 | 2,151 |
| 2005 | 2,057 |
| 2006 | 2,154 |
| 2007 | 2,155 |
| 2008 | 3,704 |
| 2009 | 6,169 |
| 2010 | 6,786 |
| 2011 | 5,994 |
| 2012 | 6,468 |
| 2013 | 8,813 |
| 2014 | 11,777 |
| 2015 | 13,378 |
| 2016 | 12,911 |
| 2017 | 13,601 |
| 2018 | 13,968 |
| 2019 | 16,759 |
| 2020 | 15,240 |
| 2021 | 17,233 |
| 2022 | 15,252 |
| 2023 | 15,621 |
Data: Statistics Canada, table 36-10-0008-01
5. Services trade
Both Canada and Peru have experienced growth in services trade since the CPFTA came into force (Figure 15). Canadian imports of commercial services from Peru increased from $9 million in 2010Footnote 5 to $28 million in 2022, reflecting an average annual growth rate of 10% over this period. Meanwhile, Canadian exports of commercial services to Peru increased to $144 million in 2022, up from $40 million in 2010, though there were peaks in 2012 and 2015. The total increase in services exports of $104 million from 2010 to 2022 represents an annualized growth rate of 11%.
Figure 15. Commercial services trade between Canada and Peru, 2010-2022, $ millions
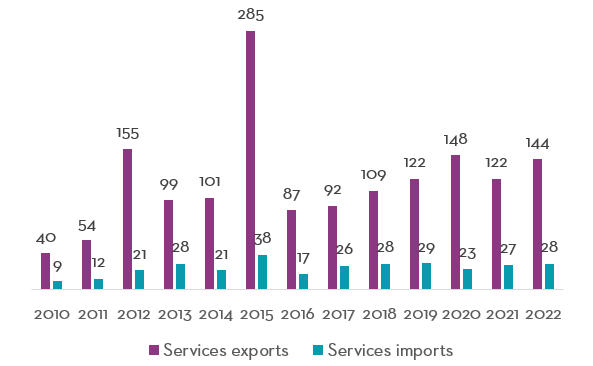
Text version - Figure 15
| Year | Services exports ($ millions) | Services imports ($ millions) |
|---|---|---|
| 2010 | 40 | 9 |
| 2011 | 54 | 12 |
| 2012 | 155 | 21 |
| 2013 | 99 | 28 |
| 2014 | 101 | 21 |
| 2015 | 285 | 38 |
| 2016 | 87 | 17 |
| 2017 | 92 | 26 |
| 2018 | 109 | 28 |
| 2019 | 122 | 29 |
| 2020 | 148 | 23 |
| 2021 | 122 | 27 |
| 2022 | 144 | 28 |
Data: Statistics Canada, table 12-10-0145-01
The categories contributing most to the growth of Canada’s commercial services imports from Peru from 2010 to 2022 were management services, which increased by $11 million; architectural, engineering, and scientific services, which rose by $6 million; and other services, which contributed an additional $1 million (Figure 16).
Figure 16. Categories with the most growth of commercial services imports by Canada from Peru, 2010-2022, $millions
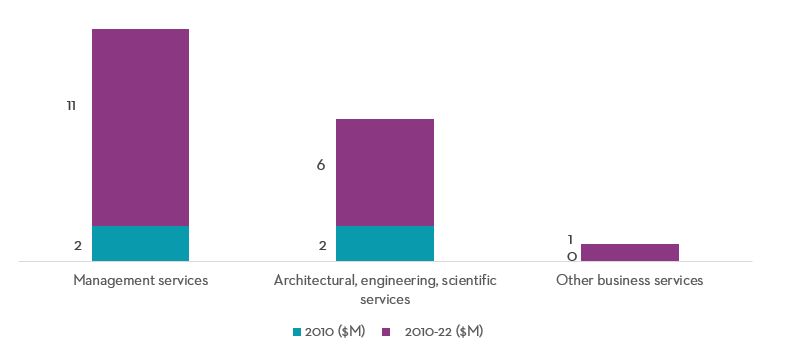
Text version - Figure 16
| Category | 2010 | 2010-22 |
|---|---|---|
| Management services | 2 | 11 |
| Architectural, engineering, scientific services | 2 | 6 |
| Other business services | 0 | 1 |
Data: Statistics Canada, table 12-10-0145-01
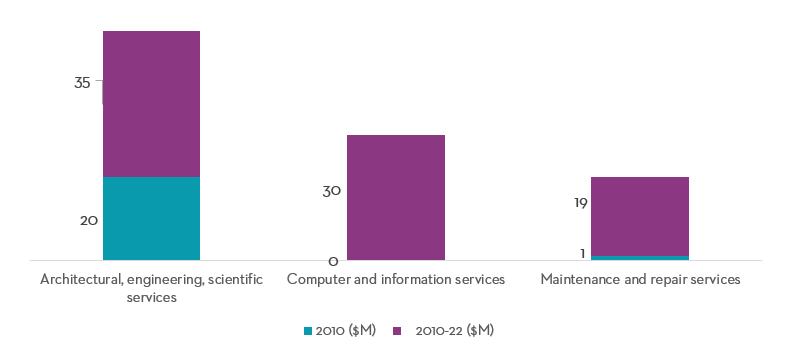
From 2010 to 2022, Canadian exports of commercial services to Peru saw significant increases in specific categories (Figure 17). Architectural, engineering, and scientific services led with a rise of $35 million, followed by computer and information services, which increased by $30 million. Additionally, maintenance and repair services contributed with an increase of $19 million.
Figure 17. Categories with the most growth of commercial services exports by Canada to Peru, 2010-2022, $ millions
Text version - Figure 17
| Category | 2010 | 2010-22 |
|---|---|---|
| Architectural, engineering, scientific services | 20 | 35 |
| Computer and information services | 0 | 30 |
| Maintenance and repair services | 1 | 19 |
Data: Statistics Canada, table 12-10-0145-01
6. Utilization of CPFTA preferences
A key indicator in assessing the effectiveness of Free Trade Agreements (FTAs) is the preference utilization rate. This metric evaluates the extent to which businesses from the partner countries claim the preferences offered by the agreement, provided they meet the requirements for preferential tariffs. The preference utilization rate serves as a crucial gauge for monitoring how actively trade agreements are being used.
The preference utilization rate of the CPFTA is calculated as the value of the affected imports that claimed preferential treatment divided by the value of affected imports eligible to receive CPFTA preferences. Imports that do not claim or fail to qualify for CPFTA preferences, for instance, if they do not meet the rules of origin requirements, they must pay the MFN duties at the border. The utilization rates from 2010 to 2023 were calculated using annual data while that for 2009 was done using monthly data from August to December to account for the months where the agreement was in force.
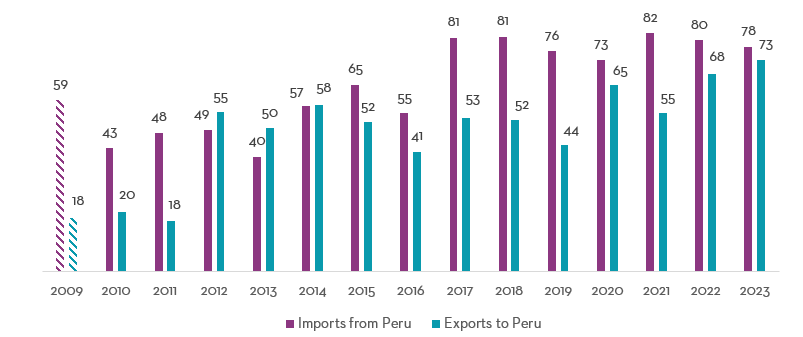
For both imports and exports, the preference utilization rates have shown variability over the years (Figure 18). Beginning in 2010, the first full year after the agreement's implementation, the preference utilization rate for Canadian imports from Peru was 43%, indicating that less than half of the eligible imports claimed CPFTA preferences. This rate experienced fluctuations over the following years, reaching a peak of 82% in 2021 before settling at 78% in 2023. For Canadian exports to Peru, the utilization rate in 2010 was 20%. The utilization remained around this level until 2012, where the utilization picked up to 55%. It remained around this level for several years until recently, where Canadian export utilization reached a record-high at 73% in 2023.
Figure 18. Preference utilization rates of the CPFTA, % Note: Utilization rates of 2009 were computed using monthly data from August to December.
Text version - Figure 18
| Year | Imports from Peru | Exports to Peru |
|---|---|---|
| 2009 | 59.4 | 18.4 |
| 2010 | 42.7 | 20.5 |
| 2011 | 48.0 | 17.6 |
| 2012 | 48.9 | 55.0 |
| 2013 | 39.7 | 49.5 |
| 2014 | 57.0 | 57.6 |
| 2015 | 64.6 | 51.5 |
| 2016 | 54.7 | 41.3 |
| 2017 | 80.8 | 53.2 |
| 2018 | 81.2 | 52.2 |
| 2019 | 76.1 | 43.6 |
| 2020 | 73.3 | 64.6 |
| 2021 | 82.4 | 54.6 |
| 2022 | 79.9 | 68.3 |
| 2023 | 77.6 | 73.2 |
Data: Government of Peru and Statistics Canada
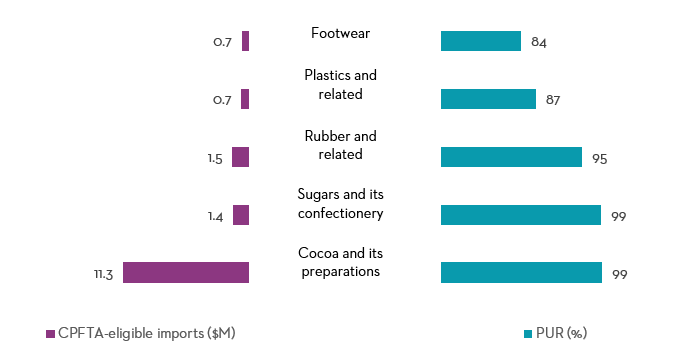
At the sector level, the utilization rate of CPFTA preferences for Canadian imports from Peru varied significantly; in 2023, several HS chapters recorded exceptionally high utilization rates. As illustrated in Figure 19, cocoa and cocoa preparations (HS 18) and sugars and sugar confectionery (HS 17) topped the list with preference utilization rates of approximately 99% each one. This was closely followed by rubber and articles thereof (HS 40), which reported a utilization rate of 95%. The list of top sectors is completed by plastics and articles thereof (HS 39) and footwear, gaiters and the like; parts of such articles (HS 64), with preference utilization rates of 87% and 84%, respectively.
Figure 19. Canadian products with highest utilization of the CPFTA in imports from Peru, 2023
Text version - Figure 19
| Category | Imports ($ millions) | Utilization rate |
|---|---|---|
| Footwear | 0.7 | 84.4 |
| Plastics and related | 0.7 | 87.0 |
| Rubber and related | 1.5 | 95.3 |
| Sugars and its confectionary | 1.4 | 98.7 |
| Cocoa and its preparations | 11.3 | 98.9 |
Data: Statistics Canada
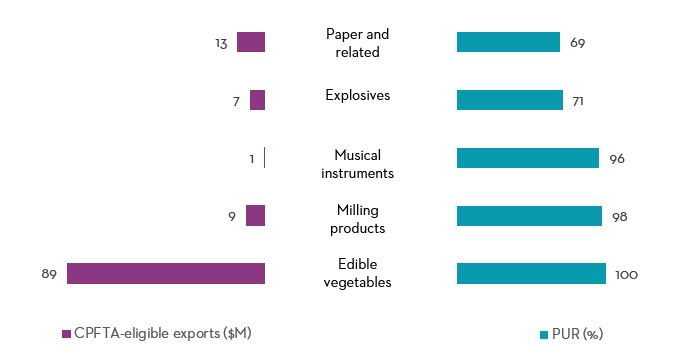
Similarly, the utilization rates at the sector level for Canadian exports to Peru in 2023 also showcased strong engagement with the CPFTA (Figure 20). Leading the Peruvian product sectors were edible vegetables and certain roots and tubers (HS 7), and products of the milling industry; malt; starches; inulin; wheat gluten (HS 11), with utilization rates of 100% and 98%, respectively. Close behind was musical instruments; parts and accessories of such articles (HS 92) with a preference utilization rate of 96%. Explosives; pyrotechnic products; matches; pyrophoric alloys; certain combustible preparations (HS 36), and paper and paperboard; articles of paper pulp, of paper or of paperboard (HS 48) followed with utilization rates of 71% and 69%, respectively.
Figure 20. Peruvian product sectors with highest utilization of the CPFTA in exports to Peru, 2023
Text version - Figure 20
| Category | Exports ($ millions) | Utilization rate |
|---|---|---|
| Paper and related | 12.7 | 69.2 |
| Explosives | 7.1 | 70.9 |
| Musical instruments | 0.6 | 95.8 |
| Milling products | 8.9 | 97.6 |
| Edible vegetables | 89.1 | 100.0 |
Data: Government of Peru
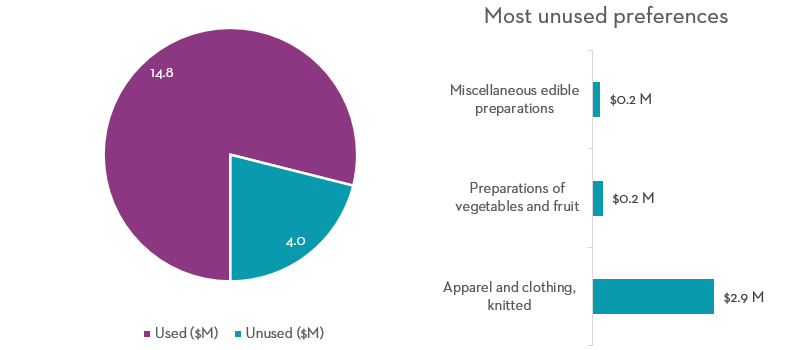
Tariff reductions under the CPFTA can lead to cost savings that may be passed on to Canadian consumers, resulting in lower prices for imported products from Peru. In 2023, the total value of Canadian imports from Peru eligible to receive CPFTA preferences reached $128 million. This resulted in Canadian importers saving approximately $15 million in duties. However, there was potential to avoid an additional $4 million in duties if CPFTA tariff preferences were fully utilized (Figure 21). Among the sectors with the highest amounts of unused tariff savings were articles of apparel and clothing accessories, knitted or crocheted (HS 61), which accounted for $2.9 million in unused savings; preparations of vegetables, fruit, nuts, or other parts of plants (HS 20) with $235 thousand; and miscellaneous edible preparations (HS 21) with $175 thousand worth of unused tariff savings.
Figure 21. Tariff savings for Canadian imports from Peru, 2023
Text version - Figure 21
| Category | Imports ($ millions) |
|---|---|
| Used tariff savings | 14.8 |
| Unused tariff savings | 4.0 |
| Category | Unused tariff savings ($ millions) |
|---|---|
| Miscellaneous edible preparations | 0.2 |
| Preparations of vegetables and fruit | 0.2 |
| Apparel and clothing, knitted | 2.9 |
Data: Statistics Canada and Canada Border Services Agency
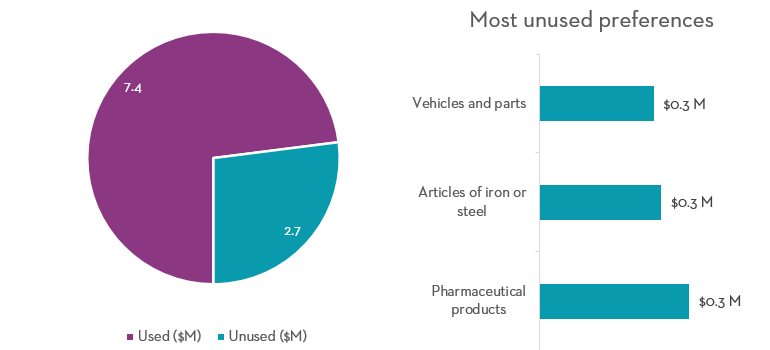
In a similar vein, Canadian exporters also experience significant benefits from the tariff reductions provided by the CPFTA, which enhance the affordability and competitiveness of Canadian products in the Peruvian market. In 2023, nearly $168 million worth of Canadian exports to Peru were eligible for CPFTA preferences. While Canadian exporters saved $7.4 million in duties, as much as $2.7 million in duties might have been avoided if CPFTA preferences were fully utilized (Figure 22). The three sectors with the highest amount of unused tariffs savings were pharmaceutical products (HS 30) with $343 thousand; articles of iron or steel (HS 73) with $279 thousand; and vehicles, other than railway or tramway rolling-stock, and parts and accessories thereof (HS 87) with $262 thousand.
Figure 22. Tariff savings for Canadian exports to Peru, 2023
Text version - Figure 22
| Category | Exports ($ millions) |
|---|---|
| Used tariff savings | 7.4 |
| Unused tariff savings | 2.7 |
| Category | Unused tariff savings ($ millions) |
|---|---|
| Vehicles and parts | 0.3 |
| Articles of iron or steel | 0.3 |
| Pharmaceutical products | 0.3 |
Data: Government of Peru
7. Assessing the effects of the CPFTA on trade
7.1. Treatment effect estimation
From the previous results, it is evident that bilateral trade between Canada and Peru has increased significantly since the CPFTA entered into force in 2009. However, not all the expansion in trade can be solely attributed to the CPFTA, as international trade is influenced by a variety of other factors, including changes in the exchange rate, commodity prices, and the economic conditions in partner countries. Furthermore, similar to trends observed in stock markets, prices, and GDP, international trade generally tends to grow over time, complicating the task of isolating the impact of any specific policy. Consequently, a more thorough analysis is required to accurately estimate the effect of the CPFTA on bilateral trade between Canada and Peru.
For this analysis, the treatment effect methodology is used. This approach is designed to measure the extent to which the CPFTA increased the trade flows between trading partners. It does so by comparing the growth in trade of products affected by the CPFTA (the treated products) to a group of similar products not influenced by the agreement (the untreated products). This comparison helps to estimate the effect of the agreement, providing insights into how trade might have evolved without the CPFTA intervention.
The main difficulty in this analysis lies in selecting the set of untreated products. In an ideal world, the best comparison would be the level of bilateral trade between Canada and Peru if the CPFTA had never been signed—a counterfactual scenario. Since this cannot happen simultaneously to having the CPFTA in place, the second-best option is to identify for each traded product between Canada and Peru a similar product where the main difference is that one was affected by the CPFTA, and the matched product was not. These matched products then form part of the counterfactual scenario; because they are so similar to the products treated by the CPFTA, observing their growth over time allows for a realistic approximation of what trade might have looked like without the agreement. The difference in growth rates between the products affected by the CPFTA and the matched untreated products provides an estimation of the treatment effect, shedding light on the actual impact of the CPFTA on bilateral trade growth between Canada and Peru.
The treatment effect technique offers some advantages relative to alternative methods. It establishes a casual link between the treatment—in this case, the CPFTA—and the trade performance. It also allows the creation of a valid counterfactual scenario that would otherwise be unobservable. Finally, the approach allows for extension and for the incorporation of regression methods that control for other covariates and improve the precision of the estimates. A more detailed explanation of the dataset creation, the models used for the analysis and more technical discussion is available in the appendix.
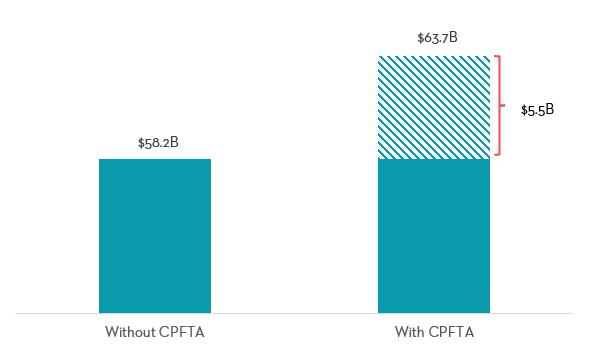
Overall, the treatment effect analysis finds that the CPFTA increased trade between Canada and Peru by 8.6% per year on average. This indicates that the CPFTA enabled bilateral trade to grow by 8.6% more every year on average compared to trade not affected by the CPFTA. This is a substantial increase in trade, as it implies that over the course of the agreement, the cumulative effect of the CPFTA on trade reached almost $5.5 billion of additional trade (Figure 23).
Figure 23. Cumulative total trade between Canada and Peru, 2009-2023, $ billions $5.5B
Text version - Figure 23
| Cumulative total trade ($ billions) | |
|---|---|
| Without CPFTA | 58.2 |
| With CPFTA | 63.7 (+5.5) |
Note: Based on the estimated treatment effect of the CCFTA
Data: MAcMap-HS6 dataset
7.2. Trade in the extensive margin
The data presented above support the view that the CPFTA had a significant trade-enhancing effect on bilateral trade between Canada and Peru. The analysis now turns to identifying whether the gains from trade were concentrated in products that Canada and Peru traded prior to the agreement (known as the intensive margin) or products that started to be traded after the CPFTA was implemented (the extensive margin). This is an important consideration because while free trade agreements can enhance trade where trade already exists, it is generally believed that FTAs can reduce barriers to trade that prevented or limited trade from taking place. This section examines whether the CPFTA was successful in creating trade in the extensive margin.
For this purpose, the analysis follows methodology found in economic literature (Kehoe & Ruhl, 2013). This methodology provides a measure of the extensive margin by focusing on the set of products that had zero trade before the CPFTA entered into force, as well as products with small but positive trade values. This set of products is denoted as the least-traded products. To construct the set of least-traded products, all the HS 8-digit product codes are ordered by their average value of trade in the pre-CCFTA period ranging from 2007 to 2008. Taking the average value over two years reduces the dependence of the results on the choice of the base year. The ordered product codes are combined to form 10 sets, where each set represents one-tenth of the total import or export value in the base year (in this case, 2007).
The first set, which is the set of least-traded products, is constructed starting with the codes with zero average trade value and following with codes with the smallest amount of trade. Product codes are added until the sum of their trade reaches one-tenth of the total import or export value in 2007. The next set is formed by summing the smallest remaining codes until the value of the set reaches the next one-tenth of the import or export value in 2007, and so on. It is worth mentioning that to create sets that account for exactly one-tenth of total trade, some product codes must be split across different sets.
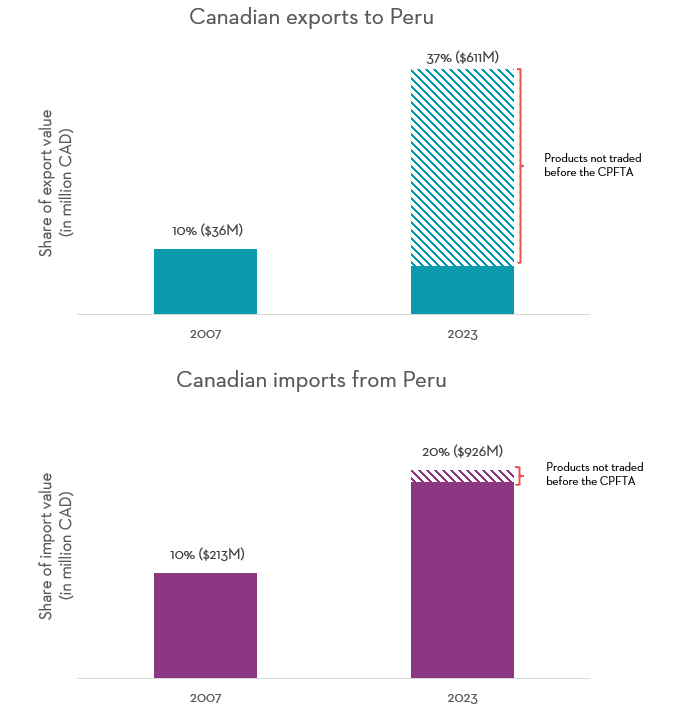
Figure 24 indicates that the group of products with zero or very small positive trade grew from representing 10% of Canadian exports to Peru, or $36 million in 2007, to 37%, or $611 million in 2023. Interestingly, of this 80%—or $489 million—originated from products that had not been traded before the CPFTA, and thus constitute pure extensive margin increases. Similarly, on the import side, products in the first group went from accounting for 10% of the total import value, or $213 million, in 2007 to 20%, or $926 million in 2023. In contrast to exports, the extensive margin of imports for least-traded products was mainly created by products with very small positive trade prior to the CPFTA.
Figure 24. Share of least traded products in total trade between Canada and Peru, 2007 and 2023
Text version - Figure 24
| Year | Share of export value | Exports ($ millions) |
|---|---|---|
| 2007 | 10% | 35.6 |
| 2023 | 37% (30% products not traded before the CPFTA) | 611.1 |
| Year | Share of import value | Imports ($ millions) |
|---|---|---|
| 2007 | 10% | 213.3 |
| 2023 | 20% (1% products not traded before the CPFTA) | 926.3 |
Products not traded before the CPFTA
Data: Statistics Canada and Government of Peru
In 2023, the least-traded products accounted for 37% of the total export value. Of this, 78% came from products that were already duty-free in 2007, while the remaining 22% were from dutiable products. Table 1 highlights the ten least-traded products with the highest export value in 2023, categorized into duty-free and dutiable products.
Among the duty-free products, Diesel and other gasoils (diesel oil) was the largest contributor, rising from 0% in 2007 to 24% (or $393.8 million) in 2023.
For the dutiable products listed in Table 1, other waste and scrap of iron and steel saw a significant increase, accounting for 2.2% or $37 million of the total Canadian exports to Peru in 2023, up from 0% in 2007. Another notable product was Other oats, except for sowing, which contributed 1.2% to the export value in the same year.
Table 1. Top least traded products ranked by share of Canadian exports to Peru in 2023, duty-free and dutiable
Duty-free
| HS code | Description | 2007 | 2023 | MFN tariff in 2007 | ||
|---|---|---|---|---|---|---|
| Value ($) | Share (%) | Value ($) | Share (%) | |||
| 27101921 | Diesel and other gasoils (diesel oil) | 0 | 0.0% | 393,768,096 | 24% | 0% |
| 27090000 | Crude oils from petroleum or bituminous mineral | 0 | 0.0% | 9,713,453 | 0.6% | 0% |
| 39021000 | Polypropylene | 0 | 0.0% | 7,137,749 | 0.4% | 0% |
| 87052000 | Automobile trucks for drilling or boring | 0 | 0.0% | 3,688,050 | 0.2% | 0% |
| 38241000 | Binding preparations for foundry molds or cores | 9,817 | 0.0% | 3,064,727 | 0.2% | 0% |
| 84289090 | Other lifting, loading, unloading, or handling machines and devices | 0 | 0.0% | 3,037,892 | 0.2% | 0% |
| 85043420 | Other transformers with a power rating greater than 1,000 kVA but less than or equal to 10,000 kVA | 0 | 0.0% | 2,543,237 | 0.2% | 0% |
| 84303100 | Self-propelled cutters, extractors, and tunnel or gallery boring machines | 0 | 0.0% | 2,334,857 | 0.1% | 0% |
| 39019010 | Copolymers of ethylene with other olefins | 0 | 0.0% | 2,303,704 | 0.1% | 0% |
| 05119990 | Natural sponges of animal origin | 0 | 0.0% | 2,128,720 | 0.1% | 0% |
Dutiable
| HS code | Description | 2007 | 2023 | MFN tariff in 2007 | ||
|---|---|---|---|---|---|---|
| Value ($) | Share (%) | Value ($) | Share (%) | |||
| 72044900 | Other waste and scrap of iron and steel | 0 | 0.0% | 36,779,544 | 2.2% | 12% |
| 10040090 | Other oats, except for sowing | 0 | 0.0% | 20,051,266 | 1.2% | 25% |
| 36030050 | Igniters | 0 | 0.0% | 4,423,095 | 0.3% | 12% |
| 48052400 | Testliner" (made from recycled fibers), with a weight of less than or equal to 150 g/m² | 0 | 0.0% | 3,397,249 | 0.2% | 12% |
| 2062200 | Frozen bovine livers | 0 | 0.0% | 3,008,866 | 0.2% | 12% |
| 36030060 | Electric detonators | 0 | 0.0% | 2,660,147 | 0.2% | 12% |
| 2032900 | Other frozen pork meat | 0 | 0.0% | 2,496,256 | 0.2% | 25% |
| 44031000 | Treated rough wood, including debarked, stripped, or squared | 43,915 | 0.0% | 2,255,391 | 0.1% | 12% |
| 19019090 | Other food preparations of flour, starch, or malt extract, with less than 40% cocoa, not elsewhere specified | 0 | 0.0% | 2,065,209 | 0.1% | 17% |
| 33049900 | Other beauty, makeup, and skin care preparations, excluding medicines, including sunscreen and tanning preparations | 173,033 | 0.0% | 1,943,787 | 0.1% | 12% |
Data: Statistics Canada and Government of Peru
In 2023, the least-traded products accounted for 20% of Canadian imports from Peru. Of this, 80% were duty-free, while the remaining 20% were subject to duties. Table 2 highlights the top ten least traded products, both duty-free and dutiable, ranked by their share of Canadian imports from Peru in 2023.
In the duty-free category, fresh grapes increased from 0.1% of imports in 2007 to 4.1% (or $192 million) in 2023. Cranberries, bilberries, and other fruits of the genus Vaccinium grew from 0% in 2007 to 2.6% (or $122 million) in 2023. Coffee, not roasted and not decaffeinated, rose from 1.1% (or $23 million) in 2007 to nearly $92 million, representing 1.9% of imports in 2023.
In the dutiable category, T-shirts, singlets, and other vests, knitted or crocheted, of cotton, increased from 0.4% of imports in 2007 to 0.9% in 2023, with the value rising from $7.5 million to $43 million. Similarly, strawberries for processing saw a significant increase in value from $131,569 in 2007 to $18 million in 2023. Men’s or boys’ shirts, knitted or crocheted, of cotton, grew in value from $3.9 million in 2007 to $13 million in 2023.
Table 2. Top least traded products ranked by share of Canadian imports from Peru in 2023, duty-free and dutiable
Duty-free
| HS code | Description | 2007 | 2023 | MFN tariff in 2007 | ||
|---|---|---|---|---|---|---|
| Value ($) | Share (%) | Value ($) | Share (%) | |||
| 08061091 | Grapes, fresh, in their natural state | 2,219,979 | 0.1% | 191,599,790 | 4.1% | 0% |
| 08104000 | Cranberries, bilberries and other fruits of the genus Vaccinium | 165 | 0.0% | 122,374,264 | 2.6% | 0% |
| 09011100 | Coffee, not roasted, not decaffeinated | 23,017,238 | 1.1% | 91,504,794 | 1.9% | 0% |
| 08119090 | Frozen fruit and nuts, cooked or uncooked, with or without added sweeteners, other | 760,395 | 0.0% | 33,989,713 | 0.7% | 0% |
| 12099110 | Vegetable seeds, -In bulk or in packages | 183,225 | 0.0% | 27,631,793 | 0.6% | 0% |
| 08045000 | Guavas, mangoes and mangosteens | 5,113,329 | 0.2% | 26,580,294 | 0.6% | 0% |
| 80011000 | Tin, not alloyed | 12,617,534 | 0.6% | 24,872,477 | 0.5% | 0% |
| 72142000 | Other bars and rods of iron or non-alloy steel, with deformations from rolling or twisted after rolling | 0 | 0.0% | 19,930,075 | 0.4% | 0% |
| 8052100 | Mandarins (including tangerines and satsumas) | 5,319,648 | 0.2% | 18,286,573 | 0.4% | 0% |
| 9101100 | Ginger, neither crushed nor ground | 21,740 | 0.0% | 15,827,942 | 0.3% | 0% |
Dutiable
| HS code | Description | 2007 | 2023 | MFN tariff in 2007 | ||
|---|---|---|---|---|---|---|
| Value ($) | Share (%) | Value ($) | Share (%) | |||
| 61091000 | T-shirts, singlets and other vests, knitted or crocheted, of cotton | 7,544,027 | 0.4% | 43,393,619 | 0.9% | 18% |
| 8111010 | Strawberries for processing | 131,569 | 0.0% | 17,612,048 | 0.4% | 5.62¢/kg but not less than 8.5% |
| 61051000 | Men's or boys' shirts, knitted or crocheted, of cotton | 3,939,283 | 0.2% | 12,912,855 | 0.3% | 18% |
| 74071090 | Copper bars, rods and profiles, other | 618,175 | 0.0% | 12,335,409 | 0.3% | 2.5% |
| 61102000 | Jerseys, pullovers, cardigans, waistcoats and similar, of cotton | 5,965,575 | 0.3% | 12,088,987 | 0.3% | 18% |
| 18069090 | Other preparations in blocks, slabs or bars, other | 14,598 | 0.0% | 11,177,448 | 0.2% | 6% |
| 27111100 | Natural gas | 0 | 0.0% | 10,479,631 | 0.2% | 12.5% |
| 20059990 | Other vegetables prepared or preserved, other | 526,064 | 0.0% | 5,075,446 | 0.1% | 8% |
| 61099000 | T-shirts, singlets and other vests, knitted or crocheted, of cotton of other textile materials | 452,574 | 0.0% | 4,407,954 | 0.1% | 18.0% |
| 71131990 | Articles of jewellery and parts thereof, other | 551,676 | 0.0% | 3,545,199 | 0.1% | 6.5% |
Data: Statistics Canada and Government of Peru
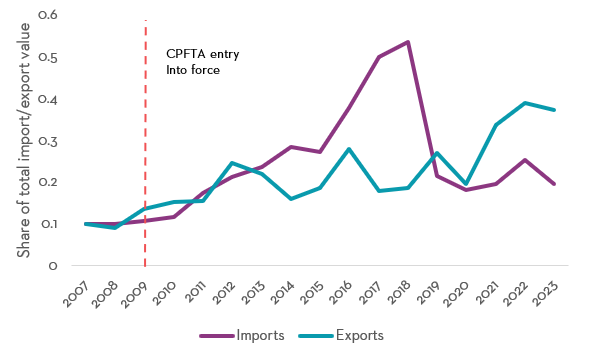
Figure 25 provides a comprehensive overview of the evolution of trade shares for the least traded products since the CPFTA was signed. Initially, in 2007, these products accounted for 10% of both Canadian exports to and imports from Peru. The contribution of these products to Canadian exports to Peru showed a modest increase, rising from 10% in 2007 to 14% by 2009. Over the years, this contribution accelerated significantly, reaching 25% in 2012 and peaking at 39% in 2022, before slightly moderating to 37% in 2023. This marked increase in the share of exports indicates a significant uptake of Canadian products newly entering the Peruvian market, highlighting the CPFTA’s role in facilitating new trade opportunities.
Similarly, the import side mirrored this expansion. Starting from the same baseline of 10% in 2007, the share of least traded products in Canadian imports from Peru climbed modestly to 11% by 2009. However, a significant surge was observed around 2015, with the share rising dramatically to 50% by 2017. This sharp increase coincided with a substantial decline in imports of precious metals, primarily gold, as documented in Figure 3. The decrease in precious metal imports, which had previously dominated imports from Peru, enabled an expansion in the trade of new products. By 2023, the share of these products in imports had normalized to 20%, reflecting a stabilization after the initial surge.
These trends in both exports and imports underscore the significant role the extensive margin has played in the evolution of bilateral trade between Canada and Peru under the CPFTA. The marked and sustained increases following the agreement’s implementation illustrate that the CPFTA effectively reduced barriers that previously restricted the trade of these new products.
Figure 25. Share of least traded products in total imports and exports between Canada and Peru, 2007-2023
Text version - Figure 25
| Year | Share of export value | Share of import value |
|---|---|---|
| 2007 | 10% | 10% |
| 2008 | 9% | 10% |
| 2009 (CPFTA entry into force) | 14% | 11% |
| 2010 | 15% | 12% |
| 2011 | 16% | 18% |
| 2012 | 25% | 21% |
| 2013 | 22% | 24% |
| 2014 | 16% | 28% |
| 2015 | 19% | 27% |
| 2016 | 28% | 38% |
| 2017 | 18% | 50% |
| 2018 | 19% | 54% |
| 2019 | 27% | 21% |
| 2020 | 20% | 18% |
| 2021 | 34% | 20% |
| 2022 | 39% | 25% |
| 2023 | 37% | 20% |
Data: Statistics Canada and Government of Peru
8. Conclusions
Trade between Canada and Peru has experienced significant growth since the CPFTA came into effect in 2009. Canadian imports of merchandise from Peru increased from $2.1 billion in 2007 to $4.7 billion in 2023. During the same period, Canadian merchandise exports to Peru rose from $356 million to $1.6 billion.
Estimates indicate that trade between Canada and Peru grew on average 8.6% faster per year due to the CPFTA, representing a substantial boost. Since 2009, the agreement has contributed to a cumulative increase in bilateral trade, adding up to $5.5 billion by 2023. This growth represents additional trade that likely would not have occurred without the CPFTA.
Moreover, Canadian imports from Peru of products that saw the largest tariff reductions between 2007 and 2023 experienced the highest growth rates. Imports of products with a tariff reduction between 5 and 10 percentage points grew at an impressive annual rate of 14.3% during this period. Products with tariff reductions of more than 10 percentage points recorded an annual growth rate of 8.9%. Meanwhile, Canada’s imports of duty-free products grew by 4.9%, and those with smaller tariff reductions, between zero and 5 percentage points, grew by 5.6%.
The analysis also found that a significant portion of the trade gains came from products that were either not previously traded or traded in small quantities before the CPFTA, suggesting that the extensive margin played a significant role in the observed expansion in bilateral trade flows. The least-traded products, which accounted for 10% of Canadian exports to Peru in 2007, represented 37% in 2023. Similarly, the least-traded products that made up 10% of Canadian imports from Peru in 2007 accounted for 20% in 2023.
Small and medium-sized enterprises (SMEs) represented 88% of the total number of Canadian companies exporting to Peru and accounted for nearly half of the total export value between 2005 and 2022. Exports from women-owned companies in Peru increased from $3.4 million in 2017 to a record-high of $9.3 million in 2019, accounting for 14.3% of the export value of companies reporting gender ownership in that year.
Furthermore, the CPFTA generated benefits beyond tariff elimination. Initiatives to liberalize investment and services, along with the parallel agreement on environmental cooperation, have led to notable increases in investment value, trade in services, and trade in environmental goods between Canada and Peru, demonstrating the agreement’s broad impact across various sectors.
9. Bibliography
Anderson, J. E. & Van Wincoop, E., 2003. Gravity with gravitas: A solution to the border puzzle. American Economic Review, 93(1), pp. 170-192.
Baier, S. L. & Bergstrand, J. H., 2004. Economic determinants of Free Trade Agreements. Journal of international Economics, 64(1), pp. 29-63.
Baier, S. L. & Bergstrand, J. H., 2007. Do free trade agreements actually increase members' international trade?. Journal of International Economics, 71(1), pp. 72-95.
Baier, S. L. & Bergstrand, J. H., 2009. Estimating the effects of free trade agreements on international trade flows using matching econometrics. Journal of international Economics, 77(1), pp. 63-76.
Baier, S. L., Bergstrand, J. H. & Vidal, E., 2007. Free trade agreements in the Americas: Are the trade effects larger than anticipated?. World Economy, 30(9), pp. 1347-1377.
Besedes, T., Kohl, T. & Lake, J., 2020. Phase out tariffs, phase in trade?. Journal of International Economics, Volume 127, p. 103385.
Broda, C. & Weinstein, D. E., 2006. Globalization and the gains from variety. Quarterly Journal of Economics, 121(2), pp. 541-85.
Canada-Peru Agreement on the Environment, 2009. Agreement on the Environment between Canada and The Republic of Peru. Available at: https://www.canada.ca/content/dam/eccc/migration/main/caraib-carib/8f165b2f-6fe7-4c69-a160-e17cba021540/2-3-b_peru_agreement_e.pdf: s.n.
Conte, M., Cotterlaz, P. & Mayer, T., 2022. The CEPII gravity database. CEPII Working Paper N°2022-05.
Feenstra, R. C., 1994. New product varieties and the measurement of international prices. The American Economic Review, pp. 157-177.
Fontagné, L., Guimbard, H. & Orefice, G., 2022. Tariff-based product-level trade elasticities. Journal of International Economics, Volume 137, p. 103593.
Foreign Affairs and International Trade Canada, 2006. Minister Emerson signs FIPA with Peru [News Release], [Accesed on May 2024]: Available at: https://www.canada.ca/en/news/archive/2006/11/minister-emerson-signs-fipa-peru.html.
Gaulier, G. & Zignago, S., 2010. BACI: International Trade Database at the Product-Level. The 1994-2007 Version. CEPII Working Paper, N°2010-23.
Guimbard, H., Jean, S., Mimouni, M. & Pichot, X., 2012. MAcMap-HS6 2007, an exhaustive and consistent measure of applied protection in 2007. International Economics, 130(2), pp. 99-121.
Heckman, J. J., Ichimura, H. & Todd, P., 1998. Matching as an econometric evaluation estimator. The Review of Economic Studies, 65(2), pp. 261-294.
Hirano, K., Imbens, G. W. & Ridder, G., 2003. Efficient estimation of average treatment effects using the estimated propensity score. Econometrica, 71(4), pp. 1161-1189.
Houle, S., 2018. Do investment agreements necessarily cause offshoring? McMaster University-Department of Economics Working Paper.
Imbens, G. W., 2015. Matching methods in practice: Three examples. Journal of Human Resources, 50(2), pp. 373-419.
Kehoe, T. J. & Ruhl, K. J., 2013. How important is the new goods margin in international trade? Journal of Political Economy, 121(2), pp. 358-392.
Ptashkina, M., 2022. Revisiting the effects of Preferential Trade Agreements. Mimeo.
Rosenbaum, P. R. & Rubin, D. B., 1983. The central role of the propensity score in observational studies for causal effects. Biometrika, 70(1), pp. 41-55.
Rubin, D. B., 1990. Formal mode of statistical inference for causal effects. Journal of Statistical Planning and Inference, 25(3), pp. 279-292.
Scarffe, C., 2022. Price or quantity effect? The impacts of the pandemic on Canadian trade. Office of the Chief Economist, Global Affairs Canada.
Trefler, D., 2004. The long and short of Canada-US Free Trade Agreement. The American Economic Review, 94(4), pp. 870-895.
Van Biesebroeck, J., Yu, E. & Chen, S., 2015. The impact of trade promotion services on Canadian exporter performance. Canadian Journal of Economics/Revue canadienne d'économique, 48(4), pp. 1481-1512.
Wooldridge, J. M., 2010. Econometric analysis of cross section and panel data. s.l.:MIT press.
Yotov, Y. V., Piermartini, R. & Larch, M., 2016. An advanced guide to trade policy analysis: The structural gravity model. s.l.:WTO iLibrary.
10. Appendix
10.1. Technical discussion on the treatment effect estimation
As previously discussed, the entirety of growth in bilateral trade between Canada and Peru over the last 15 years cannot be solely attributed to the CPFTA. This section explains the treatment effect analysis used to estimate the impact of the CPFTA on Canada-Peru bilateral trade.
The analysis is conducted by compiling a dataset that combines various data sources containing information on bilateral trade flows, tariffs, and the characteristics of Canada, Peru, and their trading partners. The primary dataset, assembled by (Fontagné, et al., 2022), contains disaggregated data on bilateral trade and applied tariff duties for 152 importing countries and 189 exporting countries for the years 2001, 2004, 2007, 2010, 2013, and 2016 at the 6-digit product level of the 2007 version of the Harmonized System (HS) nomenclature.Footnote 6 This dataset is augmented to include the years 2019 and 2022 by incorporating bilateral trade data for the same subset of countries from the BACI dataset published by the Centre d'Études Prospectives et d'Informations Internationales (CEPII), as well as the ad valorem applied tariffs published by CEPII and the Market Access Map (MacMap). Additionally, the dataset is enhanced with a variety of country-level and gravity variables obtained from CEPII’s gravity database. The dataset is finally restricted to observations where either Canada or Peru is listed as the importing or exporting country.
The estimation of the treatment effect of the CPFTA proceeds in two stages. In the first stage, the likelihood of having received preferential treatment (called the propensity score) is estimated over the full sample using the following probit model:

Text version
The probability that CPFTAijt equals 1 is equal to the cumulative distribution function ∮ of the sum of:
- δ_0
- δ_1 times the logarithm of the GDP of country ( i ) at time ( t )
- δ_2 times the logarithm of the GDP of country ( j ) at time ( t )
- δ_3 times the logarithm of the variable ( V ) for country ( i ) in sector ( k ) at time ( t )
- δ_4 times the logarithm of the variable ( V ) for country ( j ) in sector ( k ) at time ( t )
- δ_5 times the logarithm of the GDP per capita of country ( j ) in sector ( k ) at time ( t )
- δ_6 times the logarithm of ( 1 + τ_ikt ) for country ( i ) in sector ( k ) at time ( t )
- ζ_ijkt, which is an error term
Where the treatment variable, CPFTAijt takes a value of one whenever the importing country i is Canada and the exporting country j is Peru (or vice versa) and the year t is 2009 or later. The set of explanatory variables for the likelihood of receiving treatment includes the logarithm of the gross domestic product (GDP) in year t for both the importing and exporting countries, log gdpit and log gdpjt respectively; the logarithm of the total imports of HS6 product k by importing country i in year t, log Vjkt; the logarithm of the total exports of HS6 product k by the exporting country j in year t, log Vjkt; the logarithm of the GDP per capita of the exporting country, log gdpcapjt; and the average tariff charged by importing country i for product k in year t to all the other countries.Footnote 7
Once the parameters of the probit model are obtained, the estimated probability of receiving treatment (or propensity score) is computed for each observation in the sample. The next step is to match each observation in the "treated" group with an equivalent observation in the "control" group that has the closest value of the propensity score. The purpose of this propensity score-based matching is to select two balanced groups of observations that are similar in many aspects, with the only apparent difference being that some received treatment (preferential tariffs under the CPFTA). In this context, an observation corresponds to a product k imported by country i from country j in year t. The treated group contains products traded between Canada and Peru after 2009, while the control group includes all other products traded between pairs of countries not part of the CPFTA, or products traded between Canada and Peru before 2009. Henceforth, the sample for subsequent analysis will include only observations from the treated group and the propensity-score-matched observations from the control group.
With the matched dataset constructed, the second stage involves estimating the treatment effect of the CPFTA using regression adjustment and the inverse-probability-weighted estimator. The estimating equation is:

Text version
The natural logarithm of yijkt is equal to the intercept ß0 plus ß1 times the variable CPFTAijt plus ß2 times the natural logarithm of (1 + tijkt ) plus ß3 times the natural logarithm of gdpit plus ß4 times the natural logarithm of gdpjt plus ß5 times the natural logarithm of Vikt plus ß6 times the natural logarithm of Vjkt plus ß7 times the natural logarithm of gdpcapjt plus ß8 times the variable ftaijt plus the time-specific effect Yt plus the error term Eijkt.
where log yijkt denotes the logarithm of the value of imports of product k of country i from country j in year t. The coefficient of interest, β1, measures the treatment effect of the CPFTA, or the additional trade between Canada and Peru as a consequence of the agreement, relative to the counterfactual trade that would have occurred had the CPFTA not been signed. Importantly, the outcome variable encompasses four dimensions: product k, country i, country j and time t; to match this level of variation, the set of controls includes variables across these dimensions. As before, this includes the logarithm of the importer's and exporter's GDPs, log gdpit and log gdpjt, respectively, to control for the size of the economies, and the logarithm of the GDP per capita, log gdpcapjt, to proxy for the exporter's overall productivity in year t. To control for the unaccounted variation at the country-product-year level, the specification also includes variables to proxy for country i’s total import demand for product k, log Vikt, as well as country j’s total export supply for the same product. Lastly, the equation includes the logarithm of one plus the effective tariff applied by the importing country i to the exporting country j for product k in year t, a dummy variable to account for the presence of any FTA other than the CPFTA, ftaijt, and fixed effects at the year level to absorb any aggregate shocks.
The estimation results are detailed in Table A1, with the first column featuring the results of the weighted regression conducted on the matched sample, the propensity score matching (PSM) method. The observation weights, , used in this analysis are constructed as follows:

Text version
- For treated observations (when CPFTAijt = 1): wt is equal to the reciprocal of the estimated propensity score, (pscoreijkt).
- For untreated observations (when CPFTAijt = 0): wtis equal to the reciprocal of one minus the estimated propensity score, 1-(pscoreijkt ).
where (pscoreijkt ) is the propensity score estimated in the first stage. As indicated in column 1, the coefficient on CPFTAijt is 0.249 and is statistically significant. Since the model's specification is logarithmic, and the data are observed every three years, the annualized trade growth induced by the agreement—the annual treatment effect of the CPFTA—is calculated to be 8.6%. This percentage is derived from the formula: 100×[exp (0.249⁄3)-1 ], and is depicted at the bottom of the table. Column 2 presents the estimation results obtained from the PSM method, but without parametric weighting. Here, the coefficient of interest remains statistically significant but slightly lower at 0.215, which implies an annualized effect of the agreement on trade of 7.4%.
Table A1: Treatment effect estimations of the CPFTA
| (1) log yijkt β/s.e. | (2) log yijkt β/s.e. | (3) log yijkt β/s.e. | ||
|---|---|---|---|---|
| CPFTAijt | 0.249*** | 0.215*** | 0.366*** | |
| (0.07) | (0.04) | (0.07) | ||
| log (1+ τijkt) | -0.880*** | -0.940*** | -0.930*** | |
| (0.32) | (0.32) | (0.26) | ||
| log gdpit | 0.282*** | 0.334*** | 0.260*** | |
| (0.09) | (0.01) | (0.07) | ||
| log gdpjt | 0.064 | 0.300*** | 0.243*** | |
| (0.10) | (0.02) | (0.06) | ||
| log Vjkt | 0.764*** | 0.531*** | 0.642*** | |
| (0.08) | (0.01) | (0.05) | ||
| log Vikt | 0.381*** | 0.138*** | 0.311*** | |
| (0.12) | (0.01) | (0.10) | ||
| log gdpcapjt | -0.261 | -0.282*** | -0.413*** | |
| (0.16) | (0.02) | (0.04) | ||
| ftaijt | 0.615*** | 0.891*** | 0.661*** | |
| (0.11) | (0.05) | (0.08) | ||
| Observations | 23,291 | 23,291 | 2,527,667 | |
| Method | PSM | PSM | IPWRA | |
| Weighting | Yes | No | Yes | |
| CPFTA Annualized Effect (%) | 8.6 | 7.4 | 13.0 | |
| Robust standard errors included in parenthesis. * p < 0.10, ** p < 0.05, *** p < 0.01 | ||||
Additionally, the third column presents the results of an alternative method for estimating the treatment effect, known as Inverse Probability Weighted Regression Adjustment (IPWRA). This method aims to create a pseudo-population in which individual heterogeneity across the treatment and control groups is averaged out. IPWRA involves estimating the propensity score for each observation and then conducting an inverse probability weighted regression over the entire sample, not just the matched subset.Footnote 8 Under this method, the coefficient on CPFTAijt is 0.366 and statistically different from zero. That coefficient implies and annualized effect of 13% on the bilateral trade between Canada and Peru.
Overall, the results depicted across the three columns indicate that the treatment effect of the CPFTA contributed to an increase in trade between Canada and Peru. Moreover, the coefficients of interest are precisely estimated and are statistically significant in all cases. Finally, although the estimated treatment effects of the CPFTA vary slightly across different specifications, the preferred specification suggests an annual effect of 8.6%.
The coefficient on log (1+τijkt) is negative and similar in magnitude across the three columns, aligning with the expectation that higher tariffs deter trade. The rest of the control variables behave as anticipated. The gravity-related variables, log gdpit and log gdpjt, are strongly positive and statistically significant, suggesting that larger economies in the importing and exporting countries increase bilateral imports. Similarly, variables capturing the size of the product-level total import demand and export supply, log Vikt and log Vjkt, are also positive and statistically significant. This suggests that higher demand in the importing country and greater supply in the exporting country can lead to an increase in bilateral trade of product k. In contrast, the variable representing the production capacity of the exporting country, measured by log gdpcapjt, is negative. This suggests that an increase in the overall production capabilities of the exporting country might lead to less bilateral trade. Lastly, the coefficient on ftaijt is positive and statistically significant, indicating that the presence of free trade agreements, other than the CPFTA, may stimulate bilateral imports in the selected data.
As a robustness exercise, the same set of models was estimated, but only including countries that do not have an FTA signed with either Canada or Peru in the control group. This restriction has implications primarily on the matching procedure, as the pool of observations from the control group that can be matched with equivalent observations in the treated group is considerably restricted. Although this might be a stringent assumption, it ensures that the units in the control group have not received any treatment (neither the CPFTA nor any other FTA). Table A2 describes the results. It is reassuring to see that the estimated coefficients obtained from this restricted sample remain positive and statistically significant. However, the estimates obtained in the three methods are lower relative to the results with the unrestricted sample, with the IPWRA estimates experiencing the largest change. Turning to the preferred estimation method, the annualized effect of the CPFTA, obtained via propensity score matching and parametric weighting, is 6.8%, compared to 8.6% obtained using the unrestricted sample.
Table A2: Treatment effect estimations of the CPFTA, restricted sample
| (1) log yijkt β/s.e. | (2) log yijkt β/s.e. | (3) log yijkt β/s.e. | ||
|---|---|---|---|---|
| CPFTAijt | 0.198*** | 0.139*** | 0.083*** | |
| (0.04) | (0.04) | (0.02) | ||
| log (1+ τijkt) | -0.846* | -2.365*** | -1.458*** | |
| (0.51) | (0.32) | (0.13) | ||
| log gdpit | 0.172*** | 0.216*** | 0.294*** | |
| (0.03) | (0.03) | (0.00) | ||
| log gdpjt | 0.008 | 0.075*** | 0.154*** | |
| (0.02) | (0.02) | (0.01) | ||
| log Vjkt | 0.635*** | 0.529*** | 0.536*** | |
| (0.01) | (0.01) | (0.00) | ||
| log Vikt | 0.086*** | 0.127*** | 0.133*** | |
| (0.01) | (0.01) | (0.01) | ||
| log gdpcapjt | -0.301*** | -0.102** | -0.223*** | |
| (0.05) | (0.05) | (0.00) | ||
| Observations | 22,580 | 22,580 | 1,002,013 | |
| Method | PSM | PSM | IPWRA | |
| Weighting | Yes | No | Yes | |
| CPFTA Annualized Effect (%) | 6.8 | 4.8 | 2.8 | |
| Robust standard errors included in parenthesis. * p < 0.10, ** p < 0.05, *** p < 0.01 | ||||
In summary, the econometric analysis suggests that the CPFTA delivered on its promises by significantly expanding bilateral trade between Canada and Peru. The preferred point estimates indicate that the CPFTA increased bilateral trade growth between Canada and Peru by 8.6% annually, faster than what would have occurred in the absence of the agreement.
- Date modified: