Quarterly economic and trade report – Q1 2024
Highlights
The global economy continued to expand in Q1 2024, advancing 2.6% following a similar increase in Q4 2023 (revised 2.5%). There was notable growth in China, the U.K., and emerging economies. World merchandise trade volumes rose for a second consecutive quarter, although more modestly than in Q4 2023.
Canada’s real GDP growth accelerated to 1.7% in Q1, mainly supported by household spending on services, while net trade remained stable and business inventory investment moderated. Economic growth was widespread in Canada, with 15 out of 20 industries growing, particularly in services-producing industries.
On the trade front, Canada’s exports of goods and services fell 0.8% after two consecutive quarterly increases, mainly due to a 1.3% contraction in goods exports, while services exports posted modest growth of 1.0%.
On June 5, the Bank of Canada lowered its policy interest rate from 5.0% to 4.75%. The outlook for global and Canadian growth have been revised up for 2024 compared with the last forecast and inflation continues to move lower in most advanced economies, including Canada. Despite these bright spots, economic growth is expected to be slower than historical averages.
Table 1: Highlights – First Quarter 2024
| % change, Q1 2024 vs Q4 2023 | % change, YTD 2024 | |
|---|---|---|
| Global real GDP* | 2.6% | 2.6% |
| Global merchandise trade volume | 0.3% | 0.2% |
| Canadian real GDP* | 1.7% | 0.5% |
| Canadian exports (goods & services) | -0.8% | 0.0% |
| Canadian imports (goods & services) | 0.3% | 1.5% |
Notes: *Throughout the report, GDP is quarterly changes at annualized rates. Source: Oxford Economics, Netherland Bureau for Economic Analysis, Statistics Canada; IMF January World Economic Outlook.
In Q1 2024, advanced economies experience a slowdown
The global economy grew at an annual rate of 2.6% in Q1 2024, close to the growth recorded in the last quarter of 2023 (revised 2.5%).
U.S. GDP moderated, growing only 1.6% in Q1 2024 (from a revised 3.4% in Q4 2023). This reflects a deceleration in consumer spending, exports, and state and local government spending, as well as a slowdown in federal government spending. Imports continue to outpace exports at the beginning of 2024 and as such, net trade was a drag on Q1 2024 growth.
China led growth in emerging markets, rising by nearly 7.8% on an annualized basis in Q1 2024. GDP growth was largely driven by manufacturing activity, supported by fiscal stimulus. Growth is expected to slow in subsequent quarters, as the inventories built up in Q1 are absorbed. Household consumption is expected to be weaker in 2024 overall.
Following two quarterly contractions, the U.K. expanded 2.5% in Q1 2024, its strongest performance in over 2 years. The eurozone experienced broad-based growth of 0.3% across the largest economies, supported by a robust net trade contribution. Private consumption grew only marginally, and investment was negative, despite a positive construction investment in Italy and Germany.
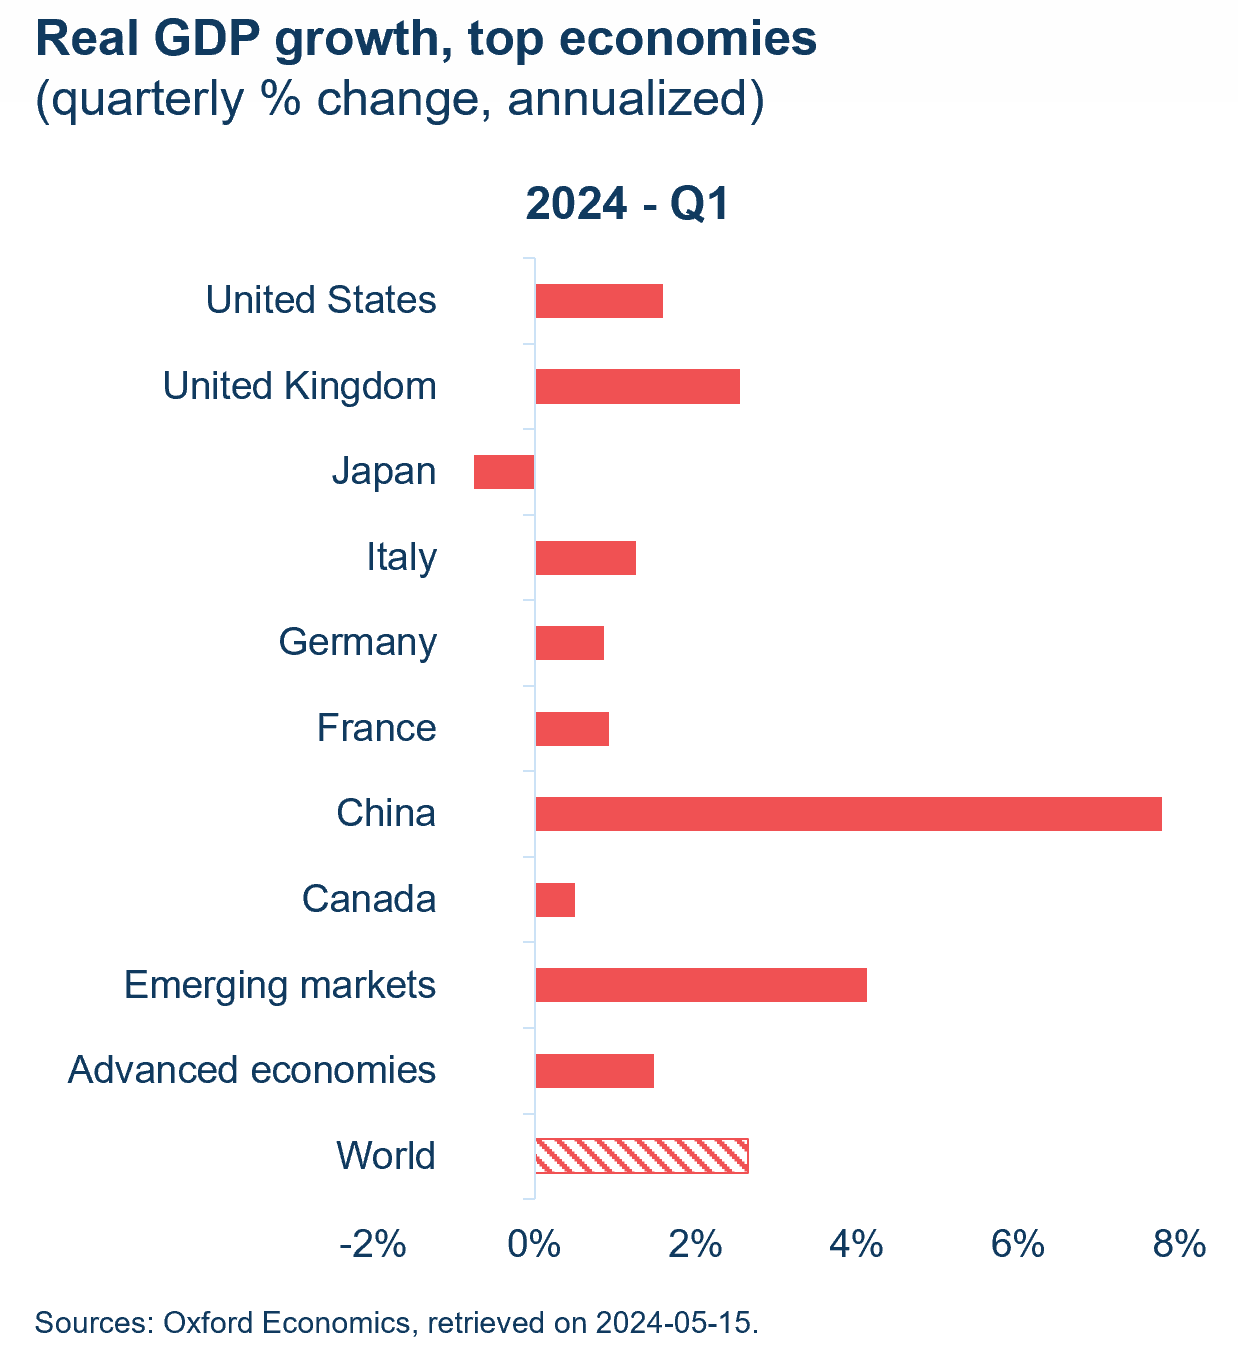
Text version - Figure 1
Real GDP growth, top economies (quarterly % change, annualized)
| Partner | 2024 - Q1 |
|---|---|
| Advanced economies | 1.5 |
| Canada | 0.5 |
| China | 7.8 |
| Emerging markets | 4.1 |
| France | 0.9 |
| Germany | 0.9 |
| Italy | 1.2 |
| Japan | -0.8 |
| United Kingdom | 2.5 |
| United States | 1.6 |
| World | 2.6 |
Sources: Oxford Economics, Haver Analytics, retrieved on May 15, 2024.
World trade volumes progress modestly for a 2nd consecutive quarter
World merchandise trade volumes rose 0.3% in Q1 2024, slightly less than the increase in Q4 2023. During Q1, exports expanded by 1.1%, while imports were down by 0.5%.
In Q1, emerging economies drove the rise in export volumes, with an increase of 2.9%, while advanced economies posted a modest 0.1% gain. Among emerging economies, export volumes from China (+5.9%) led the group, boosted by fiscal stimulus measures implemented in the country. Exports from the Eastern Europe / CIS region (+9.9%) returned to growth after two quarters of decline. In the wake of moderate economic growth, U.S. exports continued to decelerate (+0.9%) in Q1.
China’s weak consumption was reflected in imports volumes which fell 4.3%, leading to an overall 1.2% drop in imports by emerging economies. The 1.6% increase in U.S. imports was not enough to generate a gain among advanced economies, which fell 0.1% in Q1 2024, with imports falling in the eurozone (-0.7%), the UK (-2.9%) and Japan (-4.5%).
World industrial production edged up 0.2% in Q1, driven by higher production volumes in emerging economies (+1.1%). Industrial production in China grew for a third consecutive quarter, by 1.6%. Meanwhile, production volumes in the U.S. contracted 0.3%, leading to an overall production volume decline of 0.9% in the advanced economies.
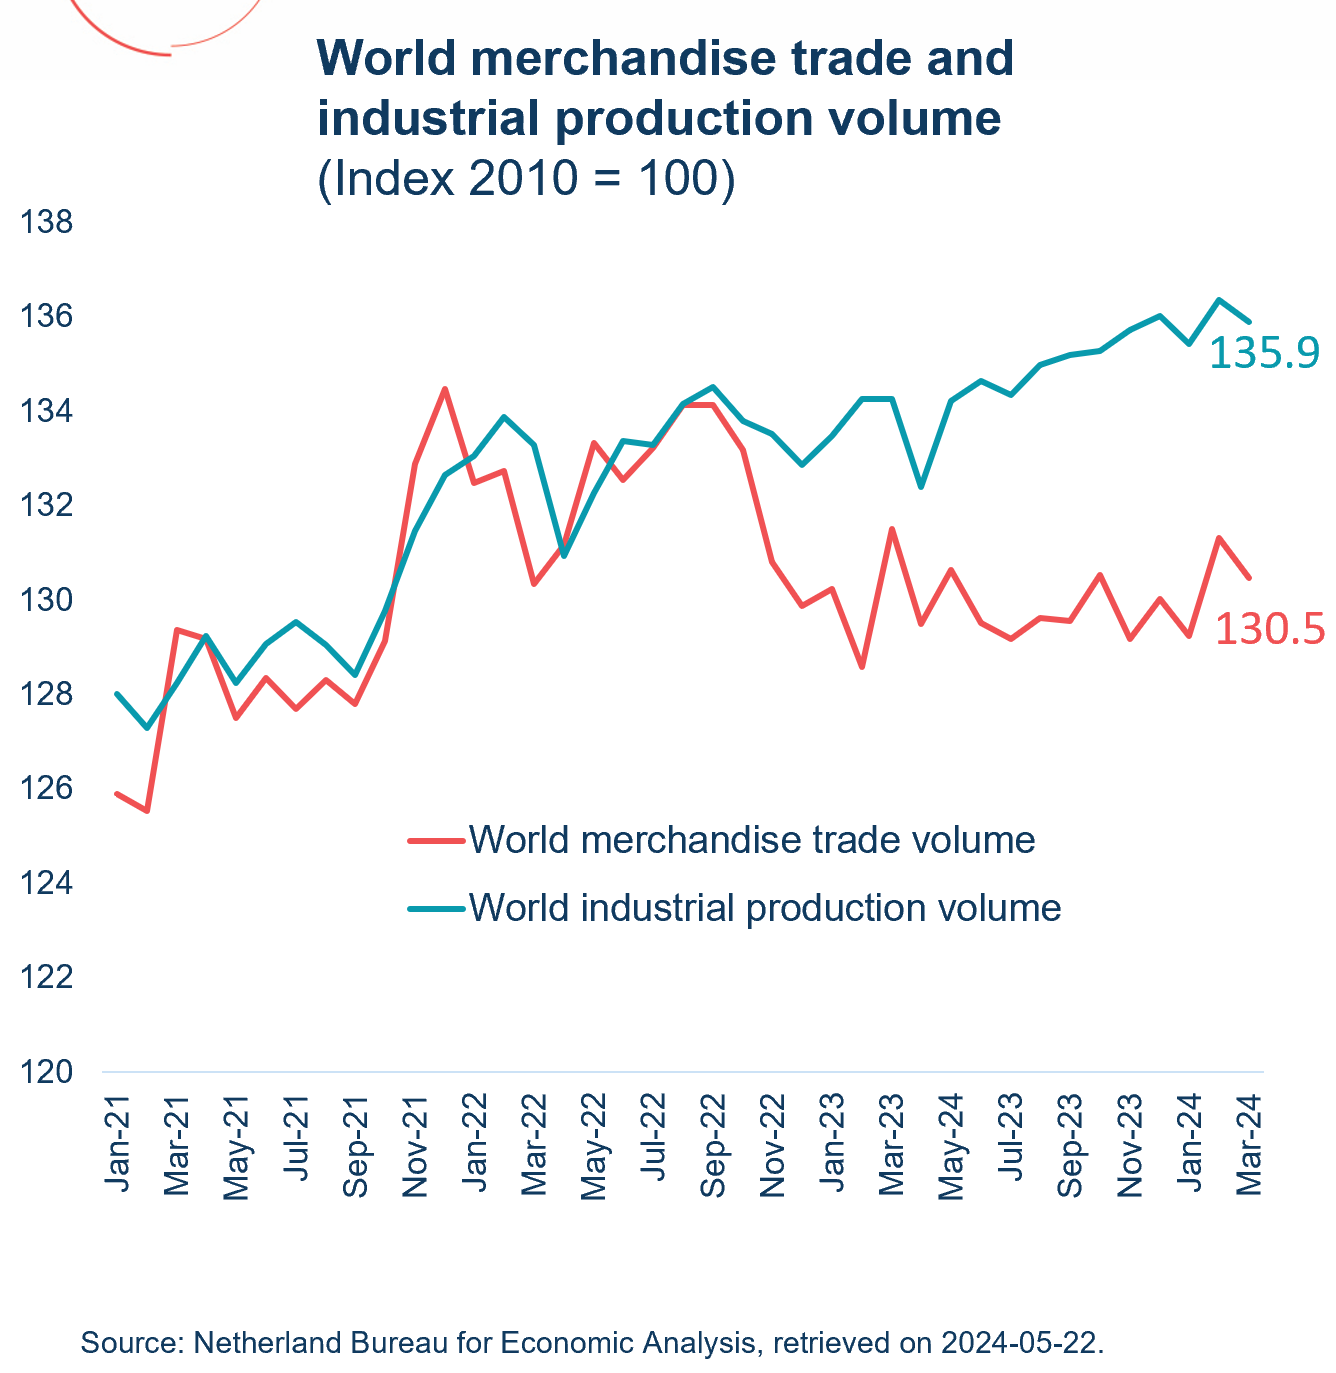
Text version - Figure 2
| World merchandise trade and industrial production volume (Index 2010 = 100) | World merchandise trade volume | World industrial production volume |
|---|---|---|
| Jan-21 | 125.9 | 128.0 |
| Feb-21 | 125.5 | 127.3 |
| Mar-21 | 129.4 | 128.2 |
| Apr-21 | 129.2 | 129.2 |
| May-21 | 127.5 | 128.2 |
| Jun-21 | 128.3 | 129.1 |
| Jul-21 | 127.7 | 129.5 |
| Aug-21 | 128.3 | 129.0 |
| Sep-21 | 127.8 | 128.4 |
| Oct-21 | 129.1 | 129.8 |
| Nov-21 | 132.9 | 131.5 |
| Dec-21 | 134.5 | 132.7 |
| Jan-22 | 132.5 | 133.1 |
| Feb-22 | 132.7 | 133.9 |
| Mar-22 | 130.3 | 133.3 |
| Apr-22 | 131.2 | 130.9 |
| May-22 | 133.3 | 132.3 |
| Jun-22 | 132.6 | 133.4 |
| Jul-22 | 133.2 | 133.3 |
| Aug-22 | 134.1 | 134.1 |
| Sep-22 | 134.1 | 134.5 |
| Oct-22 | 133.2 | 133.8 |
| Nov-22 | 130.8 | 133.5 |
| Dec-22 | 129.9 | 132.9 |
| Jan-23 | 130.2 | 133.5 |
| Feb-23 | 128.6 | 134.3 |
| Mar-23 | 131.5 | 134.3 |
| Apr-23 | 129.5 | 132.4 |
| May-23 | 130.6 | 134.2 |
| Jun-23 | 129.5 | 134.6 |
| Jul-23 | 129.2 | 134.4 |
| Aug-23 | 129.6 | 135.0 |
| Sep-23 | 129.6 | 135.2 |
| Oct-23 | 130.5 | 135.3 |
| Nov-23 | 129.2 | 135.7 |
| Dec-23 | 130.0 | 136.0 |
| Jan-24 | 129.2 | 135.4 |
| Feb-24 | 131.3 | 136.4 |
| Mar-24 | 130.5 | 135.9 |
Source: Netherlands Bureau for Economic Policy Analysis, retrieved on May 22, 2024.
Relatively stable growth is expected in the near-term
The IMF estimates that global growth reached 3.2% in 2023 and is set to increase at the same rate in 2024 and 2025. This is lower than both 2022 (3.5%), and the historical average for the 2000-2019 period (3.8%).
Growth in advanced economies is forecast at 1.7% in 2024 and 1.8% in 2025. In the U.S., inflation continues to ease, and consumption is expected to remain robust as employment and wages rise, stimulating business investment. Since its January update, the IMF raised its forecast for U.S. GDP by 0.6 percentage points to 2.7% in 2024, before returning to 1.9% in 2025.
Emerging markets should achieve 4.2% growth in 2024 and 2025, with significant regional variations. In China, growth reached 5.2% in 2023. Fiscal and monetary policies should stimulate growth, countering persistent weakness in the real estate sector, with GDP forecast to expand 4.6% in 2024 and 4.1% in 2025. Growth in India is projected to remain strong in 2024 and 2025, at 6.8% and 6.5% respectively, reflecting the continuing strength in domestic demand and a rising working-age population.
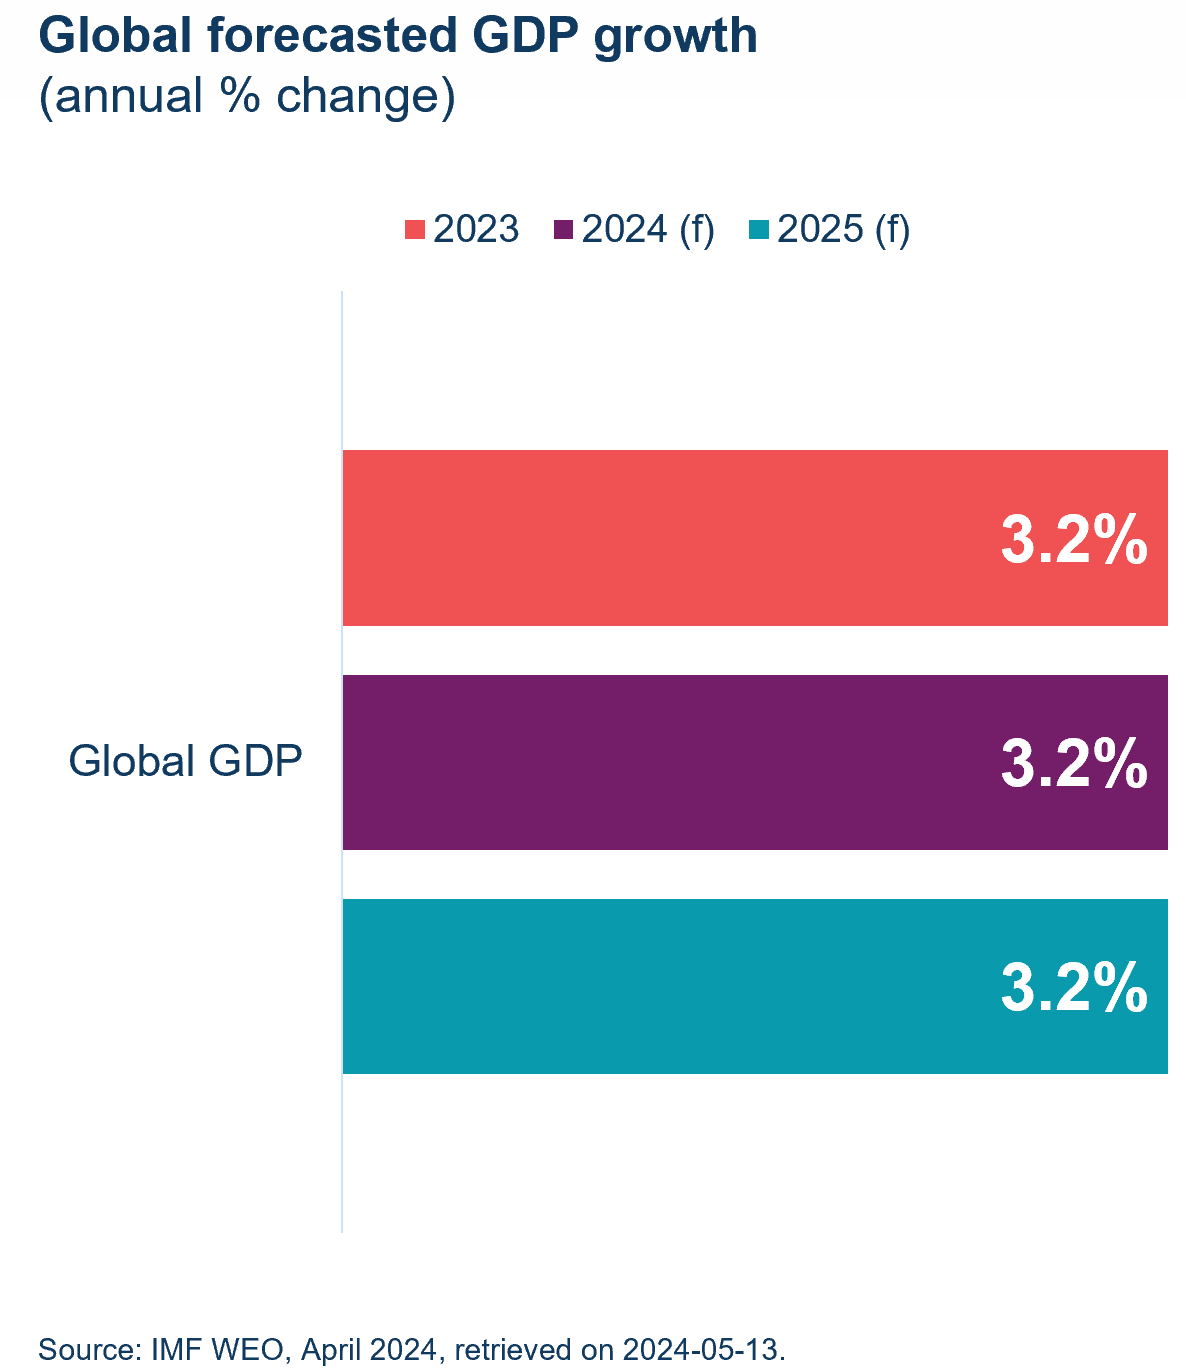
Text version - Figure 3
Global forecasted GDP growth (annual % change)
| 2023 | 2024f | 2025f | |
|---|---|---|---|
| Global | 3.2 | 3.2 | 3.2 |
f = forecast
Source: IMF WEO, April 2024, retrieved on May 13, 2024
Economic activity picked up in Q1 in Canada
Canada’s real GDP rose 1.7% (annualized) in Q1 2024, after showing near zero growth in the previous quarter. Higher household spending on services was the main driver of GDP growth, while slower inventory accumulation moderated overall growth.
Household consumption climbed 3.0%, making it the largest contributor to GDP growth. This increase was fuelled by higher real spending on telecommunications services, rent, and air transport. To a lesser extent, household spending on goods made a marginal contribution, supported by spending on new trucks, vans and SUVs.
Net trade showed little change in Q1 2024, with growth in exports of goods and services (1.9%), only slightly outpacing the rise in imports (1.5%). Exports of unwrought gold, silver and platinum to the U.K. and Switzerland were behind the gain, while imports of clothing, footwear and textile products led the growth in imports.
On the other hand, inventory accumulation slowed in Q1 2024, putting downward pressure on economic growth. The largest decline was observed in the motor vehicles sector, where inventory accumulation progressed at half the pace of the previous quarter.
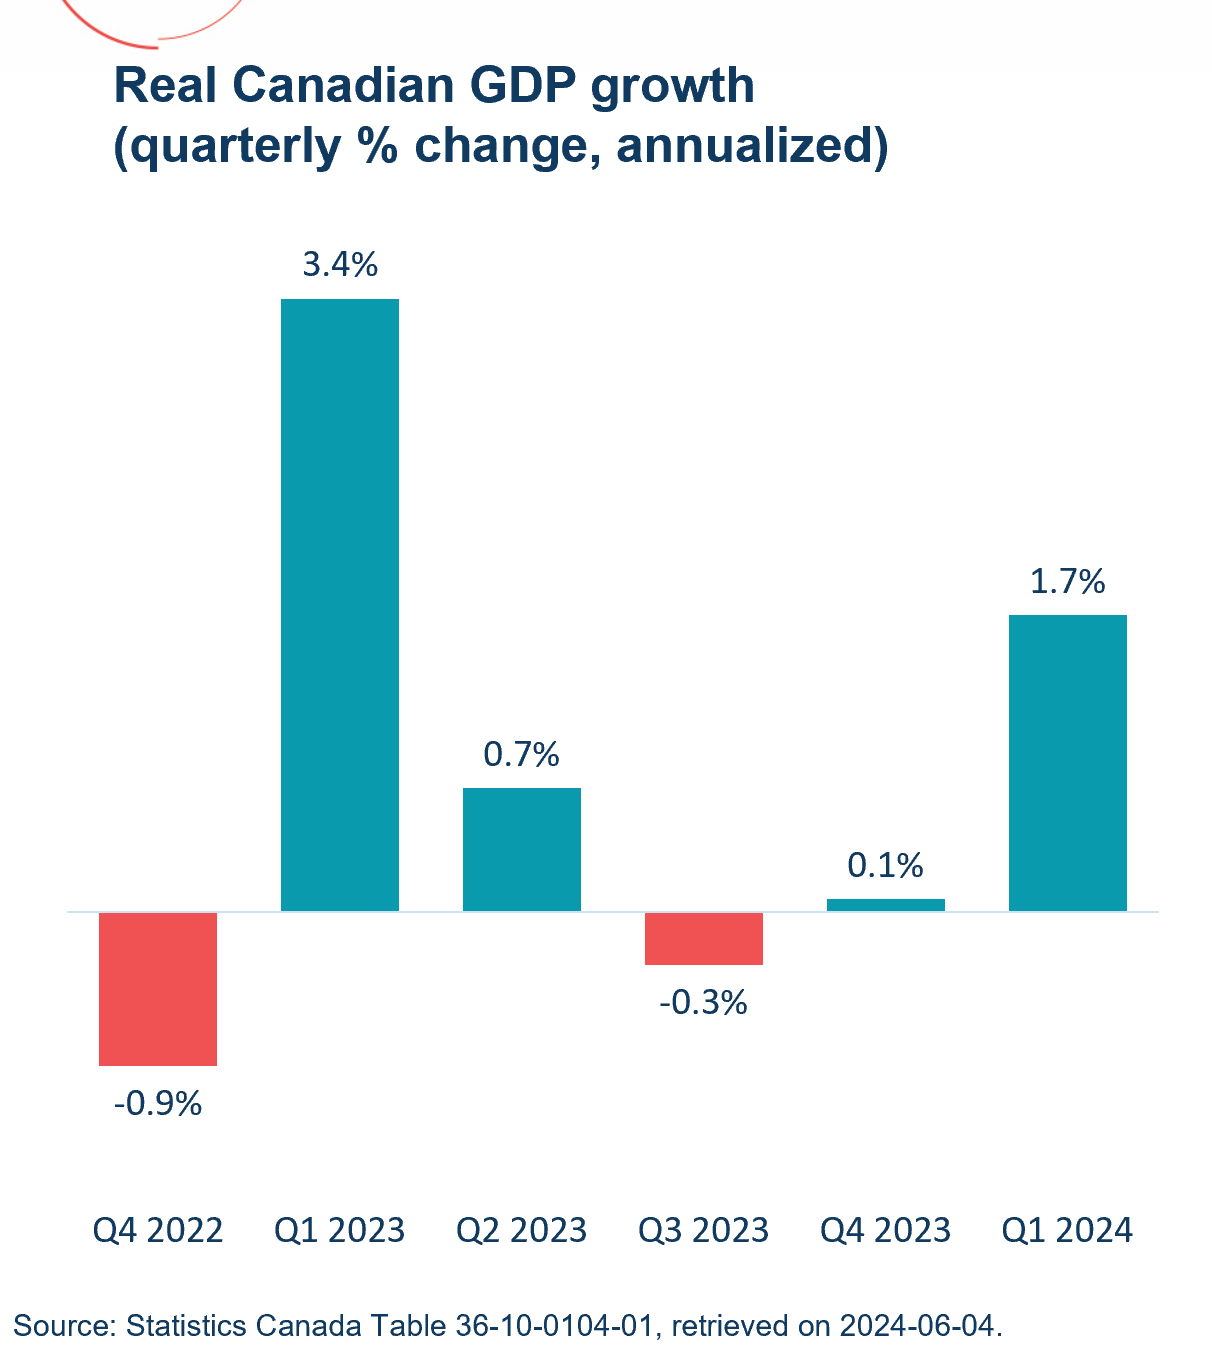
Text version - Figure 4
Real Canadian GDP growth (quarterly % change, annualized)
| Q4 2022 | Q1 2023 | Q2 2023 | Q3 2023 | Q4 2023 | Q1 2024 | |
|---|---|---|---|---|---|---|
| Real Canadian GDP growth (quarterly % change, annualized) | -0.9% | 3.4% | 0.7% | -0.3% | 0.1% | 1.7% |
Source: Statistics Canada Table 36-10-0104-01, retrieved on June 4, 2024
Services-producing industries supported growth in Q1
Economic growth in Q1 2024 was primarily supported by services-producing industries (+0.9%), up for the 11th consecutive quarter, while goods-producing industries edged down 0.1%.
Public sectors (educational services, health care and social assistance and public administration) were behind the largest contributors to overall growth, as the strike in Quebec’s elementary and secondary schools ended in Q1 2024. Other major contributors from services-producing industries occurred in real estate, transportation and warehousing (air and truck transportation), and finance and insurance.
The manufacturing industry contributed to a significant slowdown in growth, falling 0.6% in Q1 2024. Transportation equipment manufacturing, led by motor vehicles and parts (-5.6%), was the sector that contributed the most to this decline. In the manufacturing sector, beverage and tobacco product also weighed on growth, with a 7.1% decline.
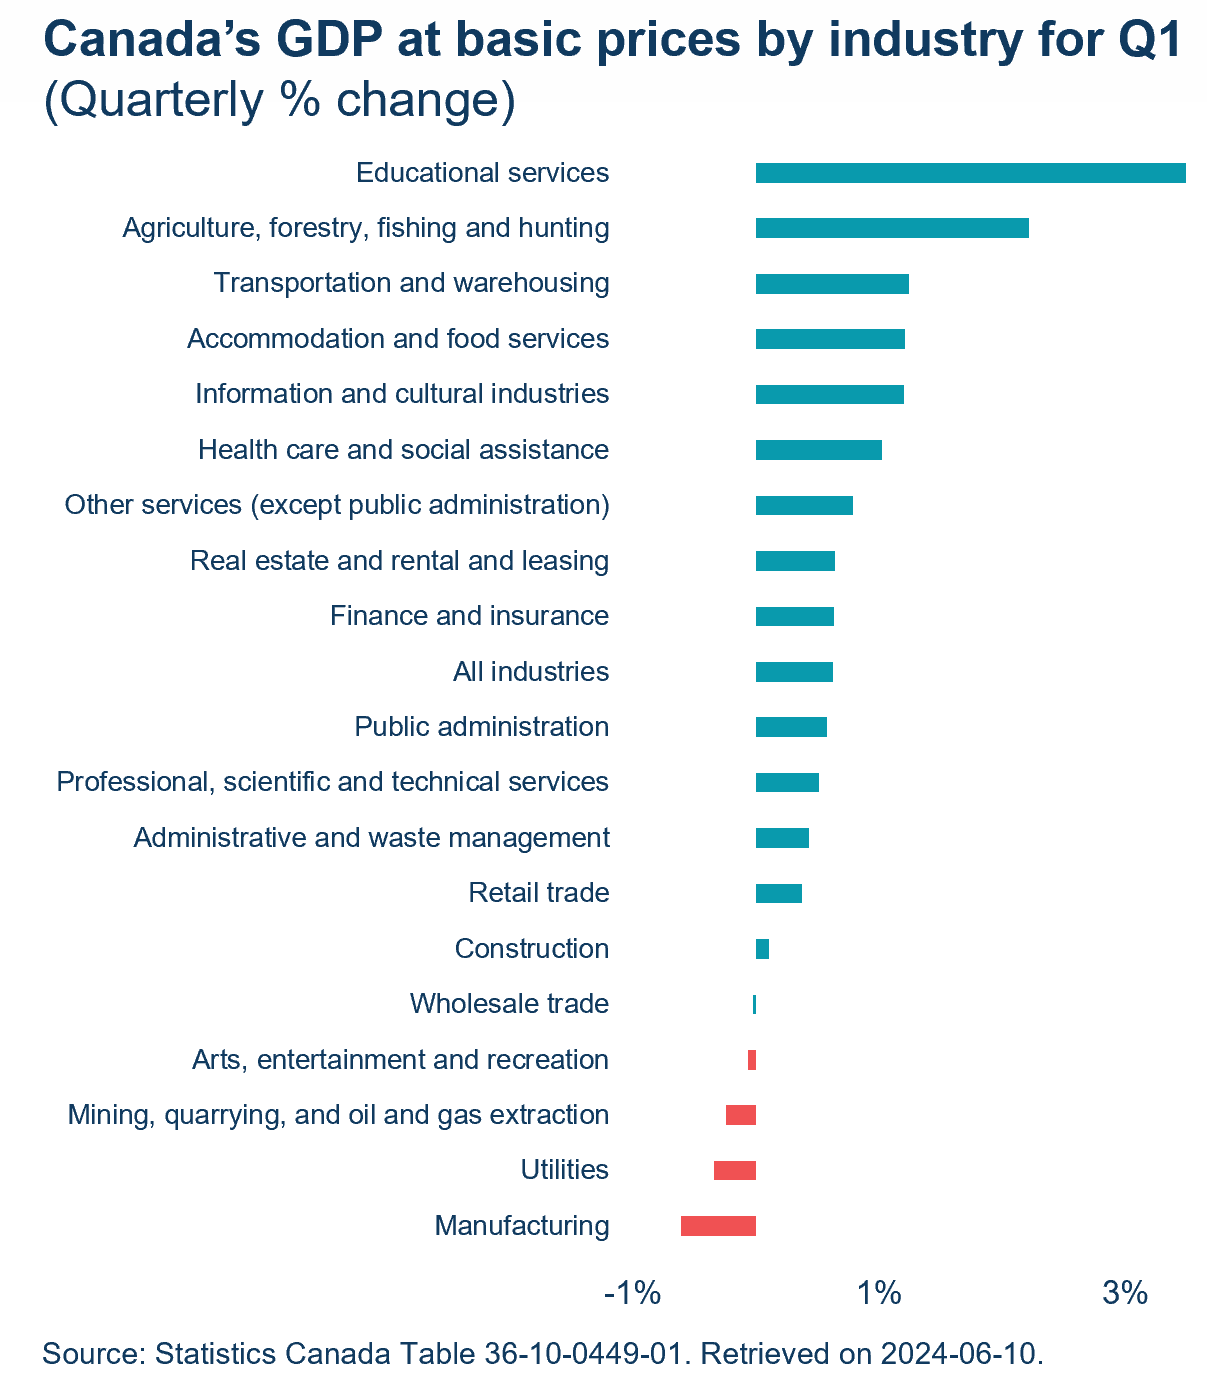
Text version - Figure 5
Canada’s GDP at basic prices by industry for Q1 (quarterly % GDP growth in Q1)
| industrie | % |
|---|---|
| Educational services | 3.5 |
| Agriculture, forestry, fishing and hunting | 2.2 |
| Transportation and warehousing | 1.2 |
| Accommodation and food services | 1.2 |
| Information and cultural industries | 1.2 |
| Health care and social assistance | 1.0 |
| Other services (except public administration) | 0.8 |
| Real estate and rental and leasing | 0.6 |
| Finance and insurance | 0.6 |
| All industries | 0.6 |
| Public administration | 0.6 |
| Professional, scientific and technical services | 0.5 |
| Administrative and waste management | 0.4 |
| Retail trade | 0.4 |
| Construction | 0.1 |
| Wholesale trade | 0.0 |
| Arts, entertainment and recreation | -0.1 |
| Mining, quarrying, and oil and gas extraction | -0.2 |
| Utilities | -0.3 |
| Manufacturing | -0.6 |
Source: Statistics Canada Table 36-10-0449-01. Retrieved on June 10, 2024.
Goods exports fell in Q1 while services posted modest growth
The value of goods and services exports edged down 0.8% in Q1 2024, after two consecutive quarterly increases, and 7 of 11 goods export categories dropped. While there was strong growth in exports of metal & non-metallic mineral products (+9.6%), and more modest growth in exports of consumer goods (+2.7%), and transportation (+1.4%). This growth was offset by sharp contractions in aircraft and parts (-12.5%) and metal ores & non-metallic mineral (-9.1%) exports. On the services front, 3 out of the 4 services categories exports advanced in Q1, with travel services being the only category that recorded a decline.
The value of imports inched up 0.3% in Q1 2024, but growth was uneven, with 6 of the 11 goods categories increasing. Expansions in energy products (+4.5%), forestry and building and packaging materials (+3.9%), electronic and electrical equipment and parts (+3.4%) and transportation (+3.1%) were almost entirely offset by contractions in motor vehicles and parts (-3.3%), chemicals, plastic and rubber products (-2.9%) and metal ores and non-metallic minerals (-2.5%). Services imports were down in 3 of 4 categories.
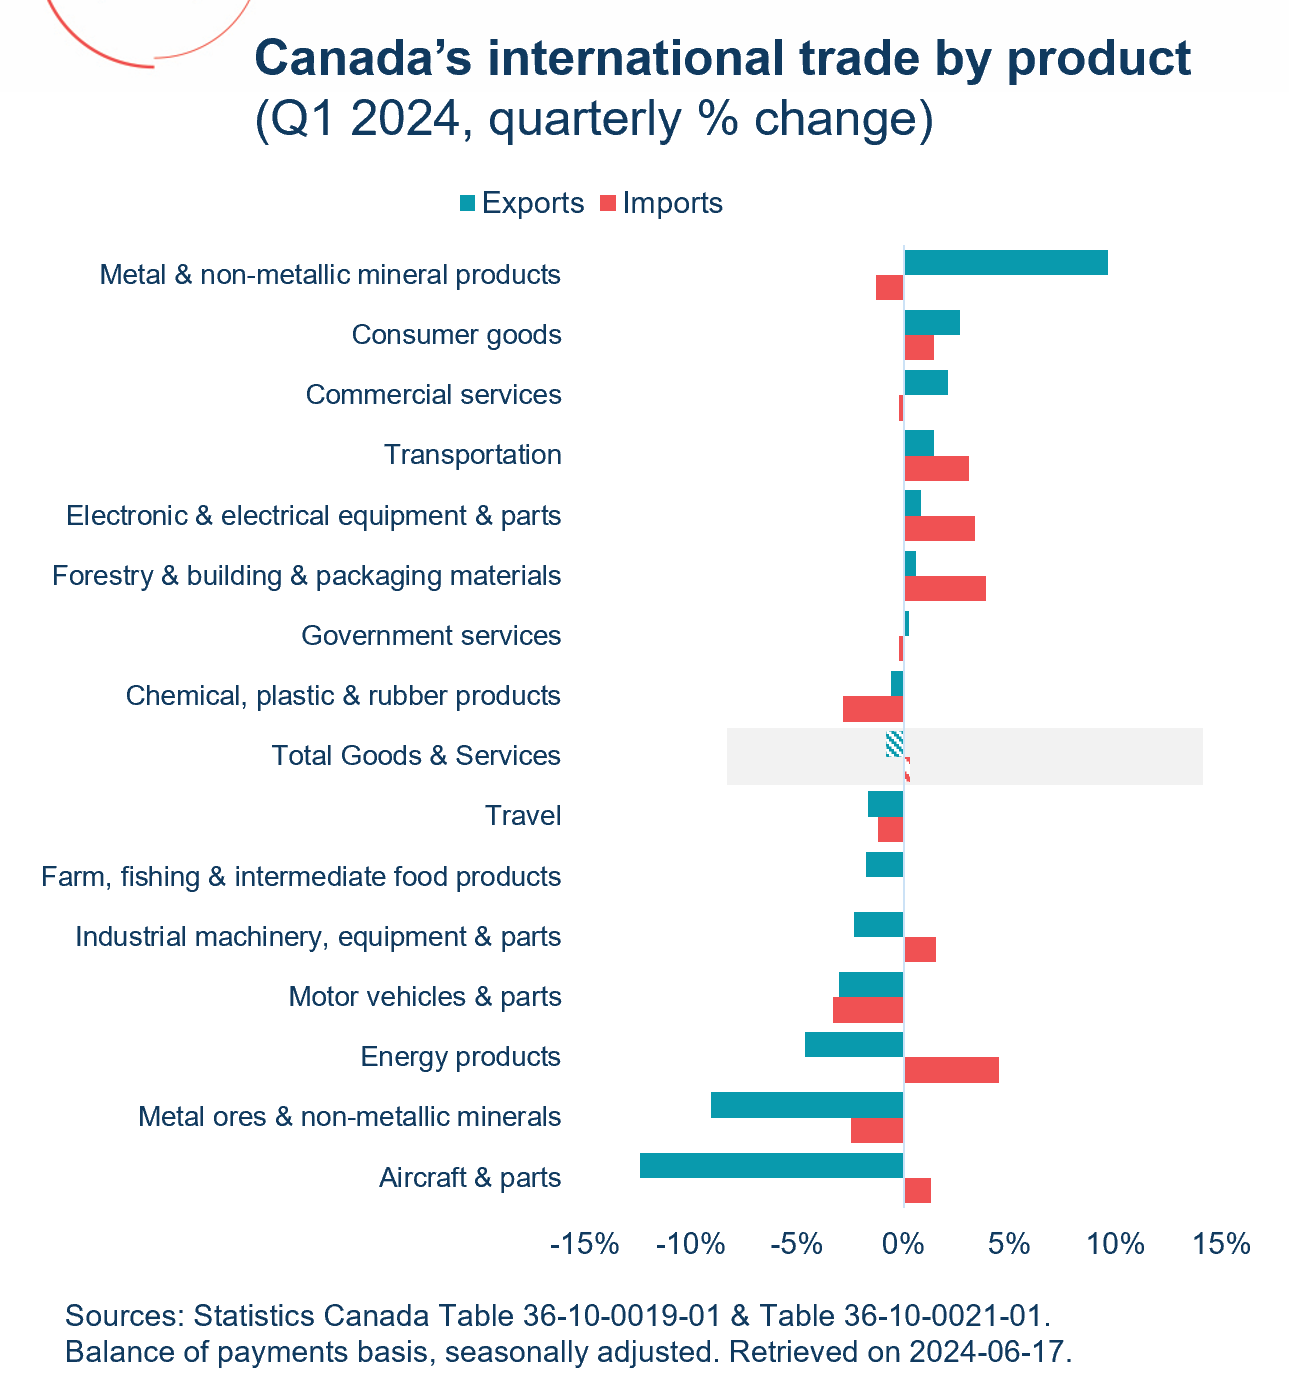
Text version - Figure 6
Canada’s international trade by product (quarterly % growth in Q1)
| Product | Exports | Imports |
|---|---|---|
| Metal and non-metallic mineral products | 9.6 | -1.3 |
| Consumer goods | 2.7 | 1.4 |
| Commercial services | 2.1 | -0.2 |
| Transportation | 1.4 | 3.1 |
| Electronic and electrical equipment and parts | 0.8 | 3.4 |
| Forestry products and building and packaging materials | 0.6 | 3.9 |
| Government services | 0.2 | -0.2 |
| Chemical, plastic and rubber products | -0.6 | -2.9 |
| Total Goods & Services | -0.8 | 0.3 |
| Travel | -1.7 | -1.2 |
| Farm, fishing and intermediate food products | -1.8 | 0.0 |
| Industrial machinery, equipment and parts | -2.4 | 1.5 |
| Motor vehicles and parts | -3.0 | -3.3 |
| Energy products | -4.7 | 4.5 |
| Metal ores and non-metallic minerals | -9.1 | -2.5 |
| Aircraft and parts | -12.5 | 1.3 |
Sources: Statistics Canada Table 36-10-0019-01 & Table 36-10-0021-01.
Balance of payments basis, seasonally adjusted. Retrieved onJune 17th 2024.
Lower goods exports to the U.S., China and the EU in Q1
In Q1 2024, Canadian goods exports were down 1.3%, while imports edged up 0.4%.
Goods exports to the U.S. contracted 3.2%, in part due to lower delivery of aircraft. Additionally, there were fewer exports of crude oil towards the end of the period, coinciding with unplanned shutdowns at refineries in the U.S. Midwest, an important destination for Canadian crude oil. Imports from the U.S. increased, driven by consumer goods (mainly electronics) and energy.
Exports to the European Union declined (-5.9%), with significant contractions to Italy, due to a drop in exports of aircraft products at the beginning of the period, and to Spain. These contractions were only partially offset by gains in exports to France and Belgium. Imports to the European Union also contracted.
Due primarily to lower coal exports in January, goods exports to China declined substantially in Q1 2024, while imports increased slightly.
Goods exports to the rest of the world were a bright spot, climbing 11.7%. Exports to the United Kingdom and Switzerland were particularly strong on higher exports of unwrought gold. Meanwhile, imports were down, with the biggest drops from Mexico (passenger cars and light and medium trucks), and Japan (passenger cars) observed towards the end of the period.
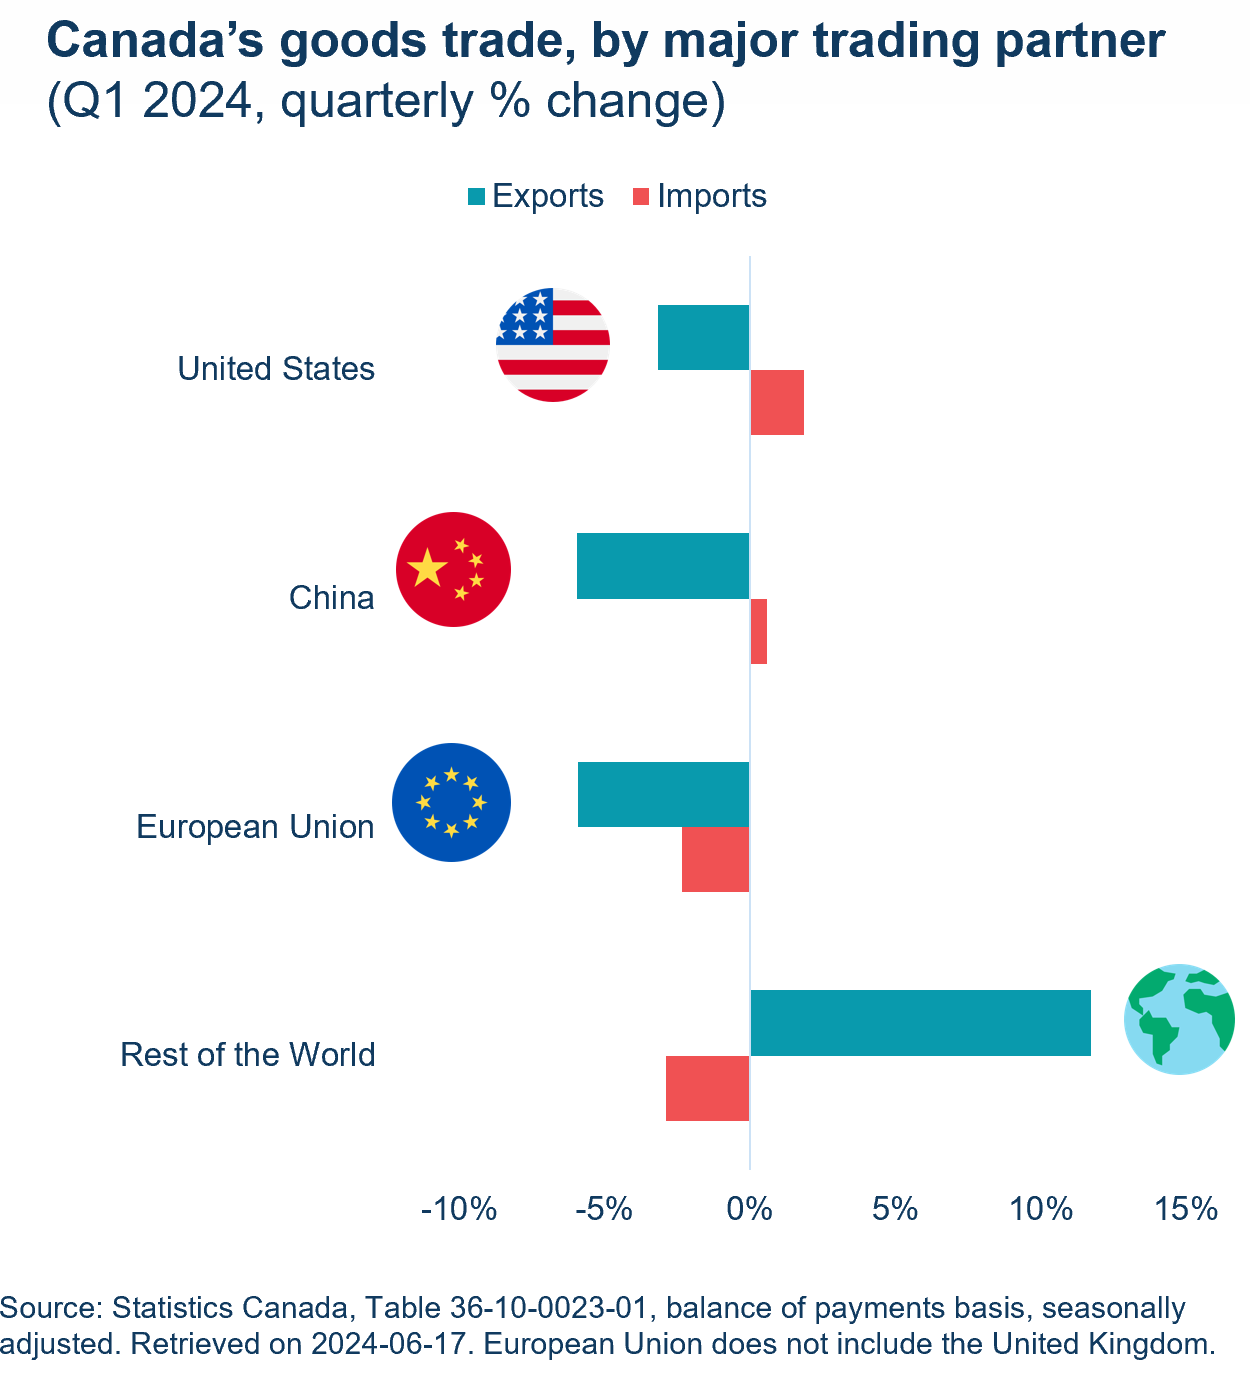
Text version - Figure 7
Canada’s goods trade, by major trading partner (quarterly % growth in Q1)
| Partner | Exports | Imports |
|---|---|---|
| United States | -3.2 | 1.9 |
| China | -6.0 | 0.6 |
| European Union | -5.9 | -2.4 |
| Rest of the World | 11.7 | -2.9 |
Source: Statistics Canada Table 36-10-0023-01, balance of payments basis, seasonally adjusted. European Union does not include the United Kingdom.
Services exports to the U.S. still on the rise
In Q1 2024, Canadian services exports edged up 1.0%, while imports were flat.
Services exports to the U.S. continued to expand for the eighth consecutive quarter, up 1.4% in Q1 2024. Meanwhile, services imports from the U.S. decreased 1.1%.
Growth in services exports was also driven by China. However, these gains were partially offset by lower exports to the European Union and Mexico. On the import side, services increase from China, Hong Kong and India were offset by drop in imports from the U.S. and the EU.
Exports of commercial services were the main contributor to quarterly growth, particularly in charges for the use of intellectual property. On the other hand, the number of Canadians traveling abroad increased by 3.3% in Q1, while the number of non-residents traveling to Canada shrank 0.9%. Since recovering from the COVID-19 pandemic, this is the first time that two-way trade in travel services has fallen, down 1.4% in Q1.
Spending by international visitors in Canada edged up 1.8% in Q1 2024, following a 4.0% increase in Q4 2023. Spending on accommodation (+2.0%) and transportation (+1.9%) services were the main contributors to the quarter’s increase.
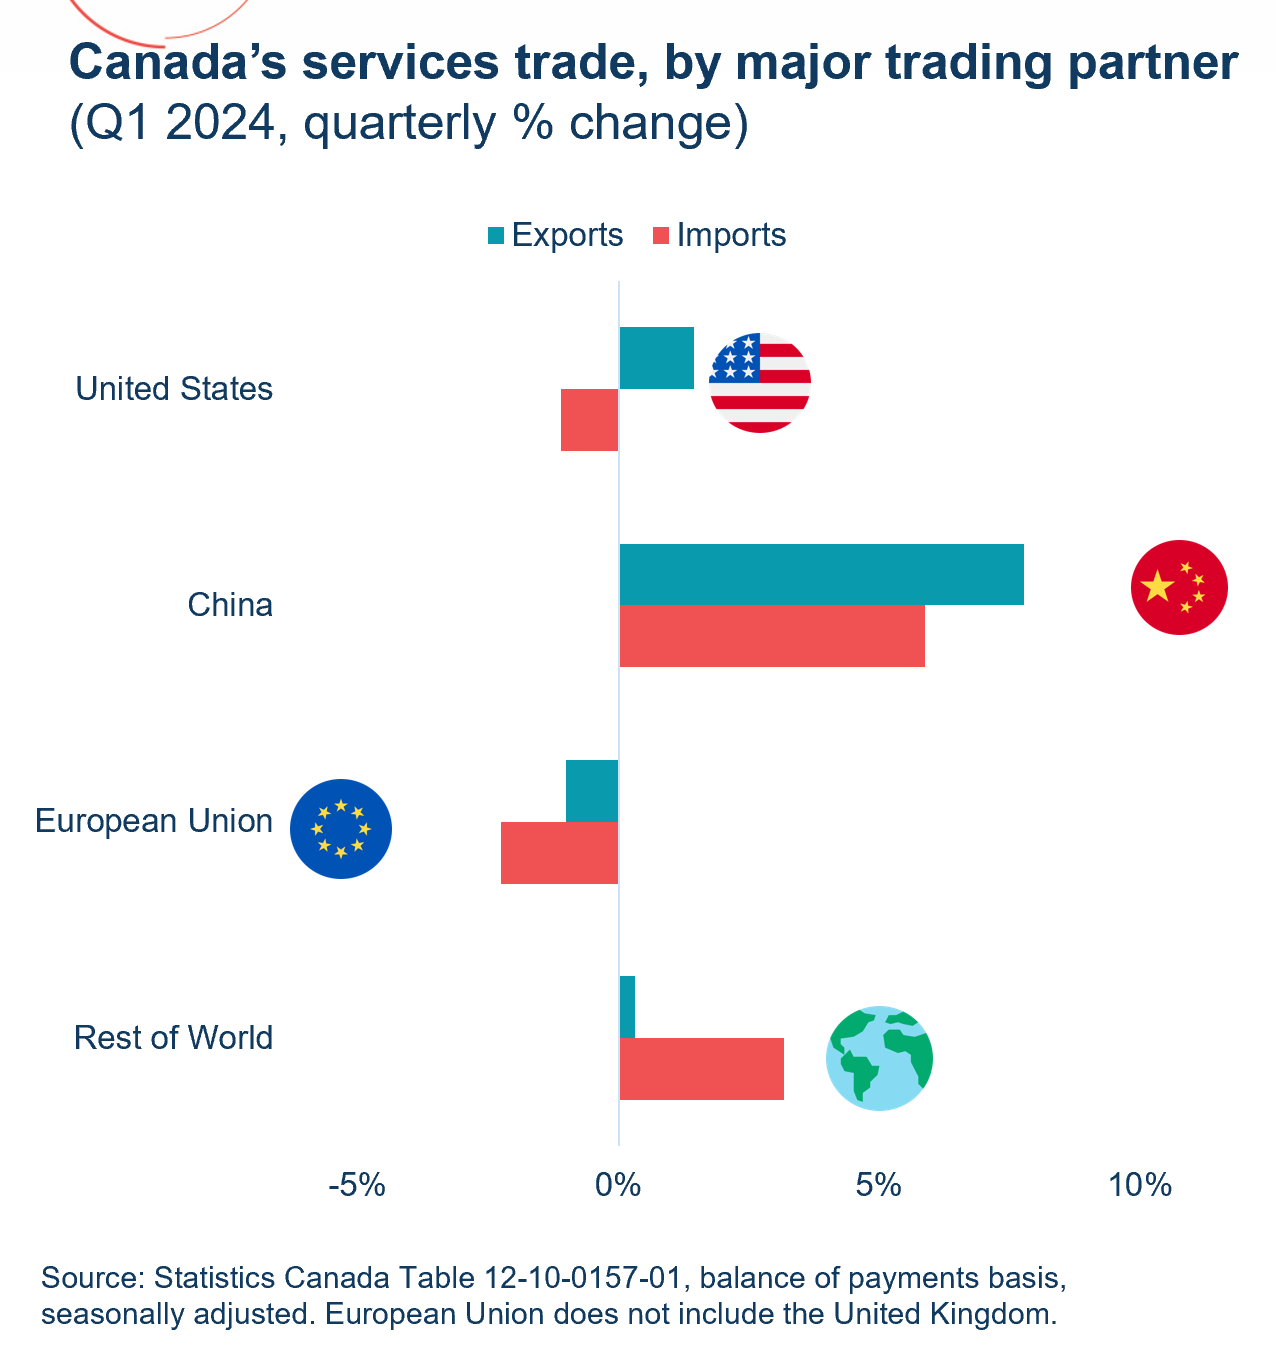
Text version - Figure 8
Canada’s services trade, by major trading partner (quarterly % growth in Q1)
| Partner | Exports | Imports |
|---|---|---|
| United States | 1.4 | -1.1 |
| China | 7.8 | 5.9 |
| European Union | -1.0 | -2.3 |
| Rest of the World | 0.3 | 3.2 |
Source: Statistics Canada Table 12-10-0157-01, balance of payments basis, seasonally adjusted. European Union does not include the United Kingdom
Canada’s economic growth expected to pick up in 2024
According to the Bank of Canada's April 2024 Monetary Policy Report, GDP is expected to rebound in 2024 to 1.5% and continue to improve into 2025, when growth is forecast to reach 2.2%.
Although inflation picked up slightly in May, it has been showing signs of easing in early 2024. May's growth was in large part due to seasonal effects, such as travel tours and air transportation. Moderate excess supply should remain in the Canadian economy throughout 2024, helping inflation to return to target (2%) in 2025.
The Bank of Canada estimates that GDP per capita growth will remain negative in the first half of 2024, due to population expansion outpacing GDP gains, but should improve towards the end of the year and into early 2025, as financial conditions ease, the effects of high interest rates fade, and business and consumer confidence improve.
In 2025, the Bank expects overall consumption in Canada to continue to improve and, supported by population growth, housing activity will accelerate, leading to strong growth in residential investment.
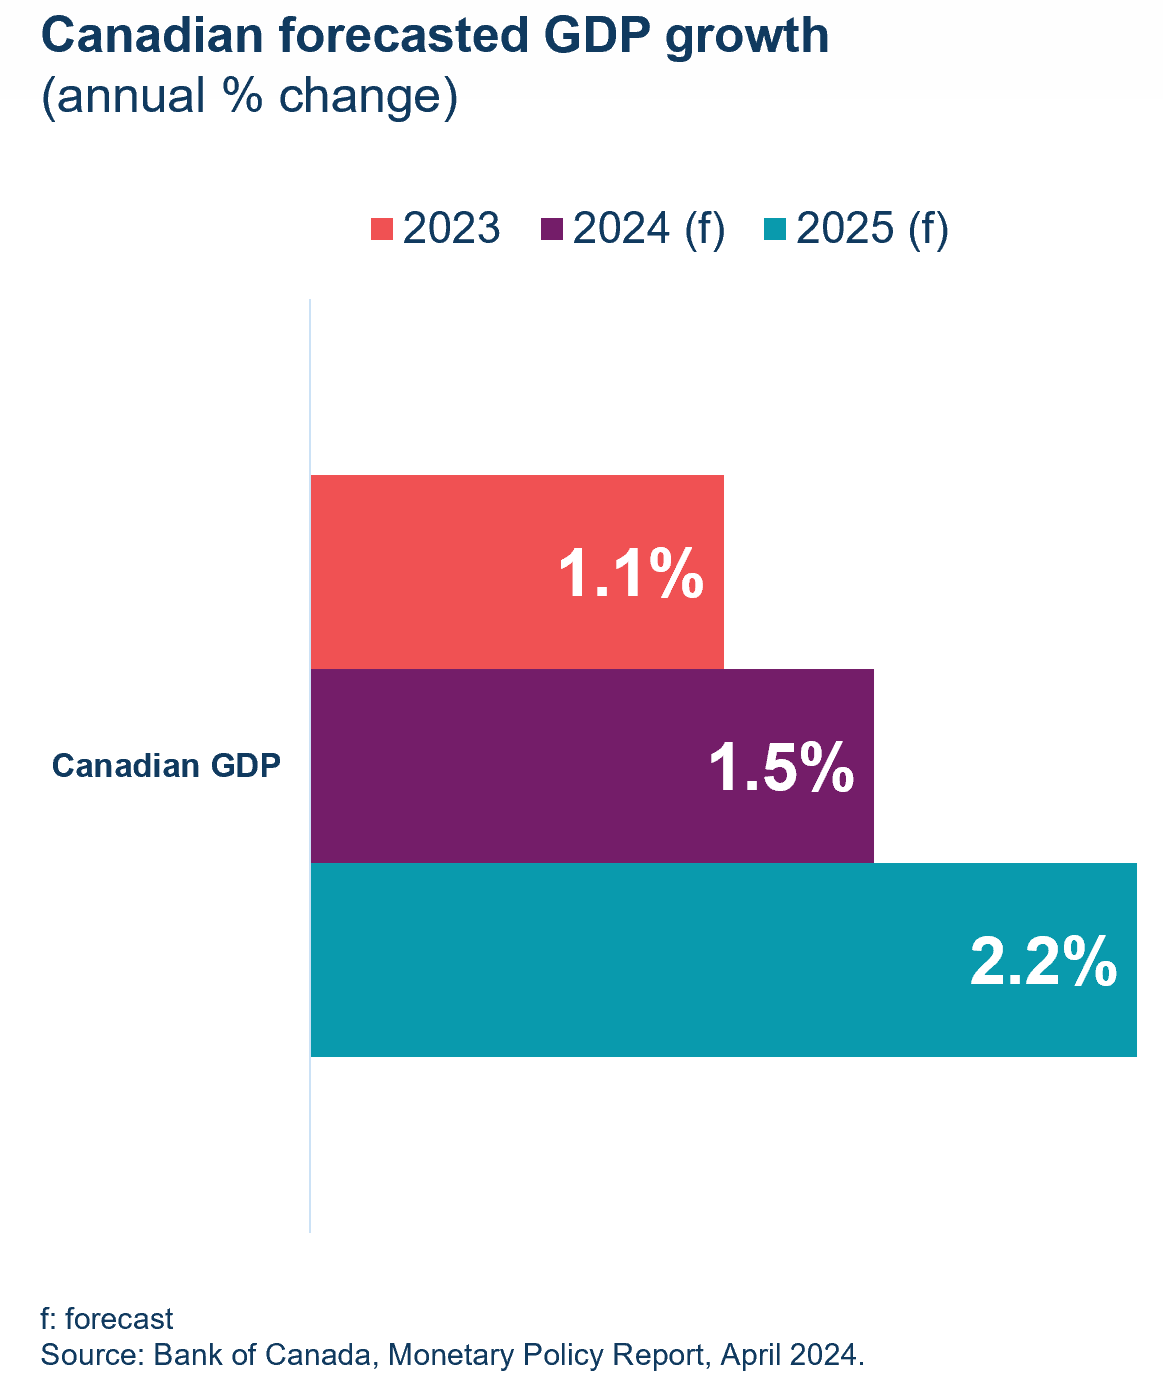
Text version - Figure 9
Canadian forecasted GDP growth (annual % change)
| Real GDP Growth (%) | 2023 | 2024f | 2025f |
|---|---|---|---|
| Canadian GDP growth | 1.1% | 1.5% | 2.2% |
f = forecast
Source: Statistics Canada Table 36-10-0104-01, Bank of Canada, Monetary Policy Report, April 2024.
Annex: Tables
Table 1: Canadian trade by industry sector ($ millions)
| Exports | Imports | |||||
|---|---|---|---|---|---|---|
| Q1 – 2024 | Q/Q % | Y/Y % | Q1 – 2024 | Q/Q % | Y/Y % | |
| Goods | 191,703 | -1.3 | -1.5 | 192,806 | 0.4 | -0.2 |
| Resource products | 112,142 | -0.8 | -2.2 | 61,456 | 0.1 | -2.7 |
| Energy products | 44,344 | -4.7 | 2.0 | 10,976 | 4.5 | -8.9 |
| Non-resource products | 74,397 | -1.9 | -0.4 | 124,122 | 0.4 | 0.9 |
| Industrial machinery & equipment | 12,555 | -2.4 | -2.7 | 22,705 | 1.5 | -3.1 |
| Electronic machinery & equipment | 8,322 | 0.8 | -0.5 | 21,594 | 3.4 | -2.9 |
| Motor vehicles and parts | 24,728 | -3.0 | 1.0 | 34,861 | -3.3 | 6.5 |
| Aircraft & other transportation equipment | 7,032 | -12.5 | 0.3 | 6,476 | 1.3 | 7.1 |
| Consumer goods | 21,760 | 2.7 | -0.6 | 38,486 | 1.4 | -0.1 |
| Services | 50,637 | 1.0 | 6.4 | 54,279 | 0.0 | 7.9 |
| Travel | 12,760 | -1.7 | 2.9 | 13,998 | -1.2 | 13.9 |
| Transportation | 5,033 | 1.4 | 2.0 | 9,045 | 3.1 | 3.6 |
| Commercial | 32,426 | 2.1 | 8.9 | 30,762 | -0.2 | 6.8 |
| Government | 419 | 0.2 | -7.7 | 475 | -0.2 | 4.9 |
| Total Goods and Services | 242,340 | -0.8 | 0.0 | 247,085 | 0.3 | 1.5 |
Note: “Q/Q %” is the change from the previous quarter; “Y/Y %” is the change from the same quarter the previous year.
Sources: Statistics Canada Table 36-10-0019-01 & 36-10-0021-01. Balance of payments basis, seasonally adjusted.
Table 2: Canadian goods trade by trading partner ($ millions)
| Exports | Imports | |||||
|---|---|---|---|---|---|---|
| Q1 – 2024 ($ million) | Q/Q % | Y/Y % | Q1 – 2024 ($ million) | Q/Q % | Y/Y % | |
| United States | 145,639 | -3.2 | -0.7 | 121,709 | 1.9 | -0.1 |
| Mexico | 2,314 | 5.1 | -4.5 | 6,930 | -5.4 | -0.6 |
| European Union | 8,064 | -5.9 | -7.7 | 18,220 | -2.4 | -4.5 |
| France | 1,125 | 26.7 | -4.8 | 1,581 | 4.8 | -2.0 |
| Germany | 1,599 | -6.7 | -15.4 | 4,945 | -2.2 | -7.1 |
| United Kingdom | 6,343 | 56.0 | 39.1 | 2,508 | -0.8 | -5.5 |
| Indo-Pacific Region | 18,636 | 0.4 | -5.0 | 27,511 | 0.4 | 3.6 |
| China | 7,246 | -6.0 | -18.8 | 15,193 | 0.6 | -3.5 |
| Japan | 3,805 | -0.8 | -15.0 | 4,170 | -2.5 | 31.0 |
| South Korea | 2,095 | 12.0 | 23.3 | 3,425 | 0.4 | 28.9 |
| India | 1,547 | 2.3 | 38.6 | 1,449 | 11.7 | 2.3 |
| Rest of the world | 10,707 | 2.9 | -15.4 | 15,928 | -4.3 | -0.8 |
| Total Goods Trade | 191,703 | -1.3 | -1.5 | 192,806 | 0.4 | -0.2 |
Notes: The Indo-Pacific region total includes only the 9 markets for which data are available. “Q/Q %” is the change from the previous quarter; “Y/Y %” is the change from the same quarter the previous year.
Source: Statistics Canada, Table 36-10-0023-01. Balance of payments basis, seasonally unadjusted.
Table 3: Canadian services trade by trading partner ($ millions)
| Exports | Imports | |||||
|---|---|---|---|---|---|---|
| Q1 – 2024 ($ million) | Q/Q % | Y/Y % | Q1 – 2024 ($ million) | Q/Q % | Y/Y % | |
| United States | 27,041 | 1.4 | 7.3 | 31,106 | -1.1 | 2.7 |
| Mexico | 787 | -2.4 | 9.6 | 1,307 | -9.1 | 19.3 |
| European Union | 5,712 | -1.0 | 13.2 | 6,819 | -2.3 | 3.1 |
| France | 1,545 | 1.7 | 22.3 | 1,044 | -7.2 | 9.2 |
| Germany | 1,052 | -3.1 | 11.3 | 1,101 | 2.6 | 7.6 |
| United Kingdom | 2,317 | -0.1 | 5.2 | 2,534 | -3.1 | 11.8 |
| Indo-Pacific Region | 7,272 | 2.2 | 1.7 | 5,976 | 3.9 | 17.3 |
| China | 1,874 | 7.8 | 0.4 | 1,192 | 5.9 | 25.7 |
| India | 2,522 | 0.8 | -0.1 | 956 | 3.9 | 25.0 |
| Japan | 571 | 2.5 | 2.0 | 789 | -2.5 | 28.7 |
| South Korea | 446 | 7.2 | 5.7 | 164 | 2.5 | 10.8 |
| Rest of the world | 7,508 | 0.6 | 3.3 | 6,537 | 8.6 | 32.6 |
| Total Services Trade | 50,637 | 1.0 | 6.4 | 54,279 | 0.0 | 7.9 |
Notes: The Indo-Pacific region total includes only the 9 markets for which data are available. “Q/Q %” is the change from the previous quarter; “Y/Y %” is the change from the same quarter the previous year.
Source: Statistics Canada, Table 12-10-0157-01. Balance of payments basis, seasonally unadjusted.
- Date modified: