
Quarterly economic and trade report – Q2 2023
Highlights
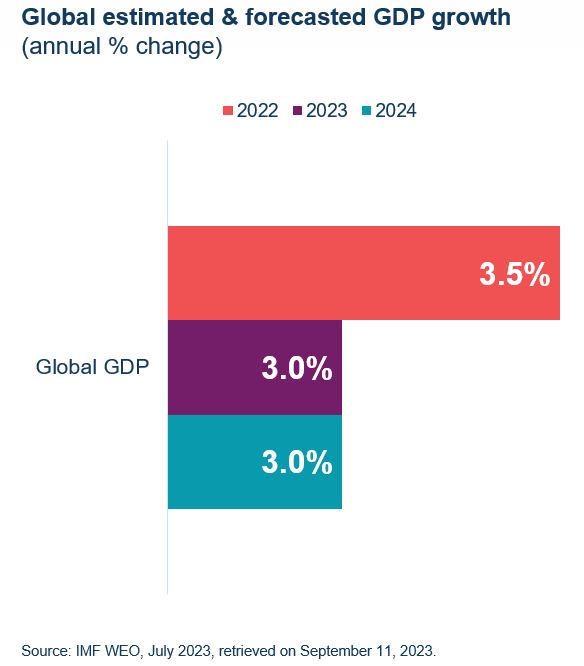
The International Monetary Fund forecasts global economic growth to fall from an estimated 3.5% in 2022 to 3.0% in both 2023 and 2024. Meanwhile, the overarching global economic narrative during the second quarter of 2023 remained the fight against inflation. The IMF expects global inflation to fall from 8.7% in 2022 to 6.8% in 2023 and 5.2% in 2024.
World merchandise trade volumes contracted for a third consecutive quarter in Q2 2023, edging down by 0.3% following a modest decline in the first quarter of 2023. The contraction was mainly due to lower exports (-0.6%), while merchandise import volumes increased by 0.1%.
Canada’s Q2 real GDP was nearly unchanged, at -0.05%, following a 0.6% rise in the first quarter. The slowdown was attributable to continued declines in housing investment, and in smaller inventory accumulation.
Canada’s goods and services exports declined for the fourth consecutive quarter, down by 2.7% in Q2 of 2023. Only 3 of 11 goods export categories expanded. Meanwhile, goods and services imports also declined by 0.3% in Q2, with 7 of 11 goods categories experiencing contractions.
Table 1: Highlights – Second Quarter 2023
| % change, Q2 2023 vs Q1 2023 | % change, YTD 2023 | |
|---|---|---|
| Global real GDP* | 0.2% | 3.7% |
| Global merchandise trade volume | -0.3% | -1.4% |
| Canadian real GDP* | -0.05% | 1.6% |
| Canadian exports (goods & services) | -2.7% | 0.8% |
| Canadian imports (goods & services) | -0.3% | 5.6% |
Notes: *Throughout the report, GDP is quarterly changes at annualized rates. “YTD %” is the year-to-date change compared to the same period in the previous year, at annualized rates.
Source: Oxford Economics, Netherland Bureau for Economic Analysis, Statistics Canada.
Global Economic Growth proves resilient in Q2
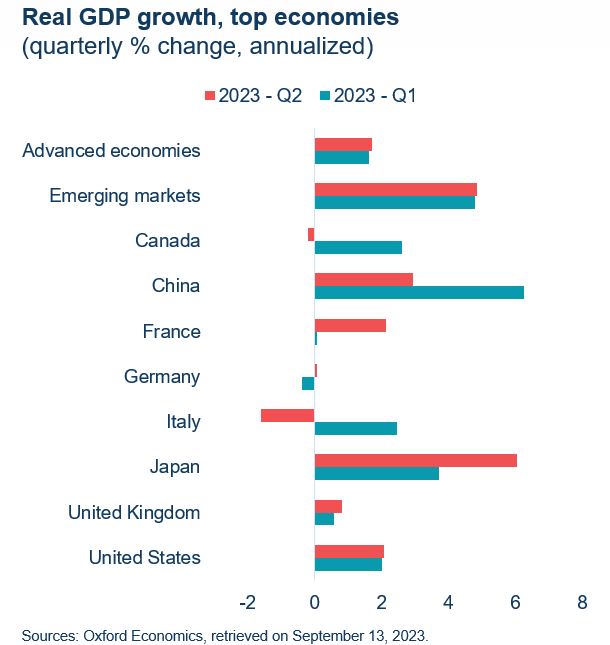
Global economic growth was stronger than expected in Q2. This was especially the case in the U.S., Canada’s largest trading partner. Consumer spending in the U.S. has been surprisingly strong and a tight labour market has supported incomes. U.S. business investment was also unexpectedly robust. In contrast, economic growth in the euro area was weak, largely as expected.
Over the next year, global economic growth is projected to slow as monetary policy further restricts demand. In the U.S., fiscal policy restraint and reduced spending from pandemic-related savings also weigh on demand growth.
Emerging markets Q2 data showed greater-than-expected resilience of activity. However, incoming data show slower activity during the rest of the year, underpinned by expectations of weaker domestic and external demand.
The pace of economic activity in China is also expected to slow as the boost from the lifting of pandemic restrictions wanes and growth of external demand moderates.
Global growth is projected to pick up modestly in the second half of 2024 before strengthening in 2025, as the effects of higher interest rates on economic growth dissipate.
Text version
| Real GDP growth, top economies (quarterly % change, annualized) | 2023 - Q1 | 2023 - Q2 |
|---|---|---|
| Advanced economies | 1.62 | 1.7 |
| Emerging markets | 4.8 | 4.85 |
| Canada | 2.62 | -0.2 |
| China | 6.27 | 2.95 |
| France | 0.08 | 2.12 |
| Germany | -0.37 | 0.07 |
| Italy | 2.46 | -1.6 |
| Japan | 3.72 | 6.04 |
| United Kingdom | 0.58 | 0.82 |
| United States | 2 | 2.06 |
Q2 saw Decrease in world trade and industrial production
World merchandise trade volumes contracted for a third consecutive quarter in Q2 2023, edging down by 0.3% following a modest decline in the first quarter of 2023. The contraction was mainly due to lower exports (-0.6%), while merchandise import volumes increased by 0.1%.
These could be attributed to an overall improvement in supply-chain functioning, however, risks are firmly to the downside with the increased uncertainty from financial sector turmoil.
Export volumes by advanced economies decreased by 0.9% in Q2. Other than the Japan (+2.3%), export volumes decreased in all other advanced economies, led by a significant decline from the United States (-4.0%). The U.S.’ Q2 decline follows a relatively strong 2.9% increase in Q1.
Emerging markets’ export volumes remained unchanged in Q2. Export volumes increased in China (0.8%) and Eastern Europe (0.8%), but these gains were offset by declines in Emerging Asia (-3.2%), Latin America (-0.2%), and Africa & the Middle East (-0.9%).
World industrial production volumes declined by 0.5% during Q2 for the second consecutive quarter. The decline was mainly due to a decrease in emerging markets (-0.8%), especially in China (-2.4%), while industrial production volumes for advanced economies declined by 0.2%, given the slowdown in the Chinese economy.

Text version
| World merchandise trade and industrial production volume (Index 2010 = 100) | World merchandise trade volume | World industrial production volume |
|---|---|---|
| Jan-20 | 120.6 | 120.1 |
| Feb-20 | 120.6 | 120.3 |
| Mar-20 | 117.9 | 120.2 |
| Apr-20 | 104.4 | 109.9 |
| May-20 | 104.4 | 111.0 |
| Jun-20 | 111.9 | 116.0 |
| Jul-20 | 117.3 | 119.8 |
| Aug-20 | 119.5 | 121.4 |
| Sep-20 | 122.8 | 123.3 |
| Oct-20 | 123.5 | 124.6 |
| Nov-20 | 125.7 | 125.9 |
| Dec-20 | 126.3 | 127.3 |
| Jan-21 | 126.9 | 128.2 |
| Feb-21 | 126.7 | 127.6 |
| Mar-21 | 130.9 | 128.5 |
| Apr-21 | 130.4 | 129.6 |
| May-21 | 128.9 | 128.5 |
| Jun-21 | 129.7 | 129.3 |
| Jul-21 | 128.8 | 129.6 |
| Aug-21 | 129.8 | 129.2 |
| Sep-21 | 129.2 | 128.5 |
| Oct-21 | 130.8 | 129.7 |
| Nov-21 | 134.3 | 131.4 |
| Dec-21 | 135.8 | 132.9 |
| Jan-22 | 133.8 | 133.5 |
| Feb-22 | 134.4 | 134.3 |
| Mar-22 | 132.6 | 133.6 |
| Apr-22 | 132.9 | 131.5 |
| May-22 | 135.3 | 132.3 |
| Jun-22 | 134.9 | 133.5 |
| Jul-22 | 135.1 | 133.3 |
global economic growth faces Persistent challenges
The overarching global economic narrative during the second quarter of 2023 remains the fight against inflation.
Risks to global growth include inflation remaining high, and perhaps even rising, if further shocks occur. These could be in the form of intensification of the war in Ukraine and extreme weather-related events, triggering more restrictive monetary policy. On the upside, however, inflation could fall faster than expected, reducing the need for tight monetary policy, and domestic demand could prove more resilient.
Global economic activity continues to be driven by the services sector. However, the post-pandemic rotation of consumption back toward services is approaching completion and as mobility returns to pre-pandemic levels, the scope for further acceleration appears limited.
At the same time, nonservices sectors, including manufacturing, have shown weakness. Amid softening consumption of goods, heightened uncertainties remain with respect to weak productivity growth, slower gross fixed capital formation, and industrial production.
Text version
| Column1 | 2022 | 2023 | 2024 | Date |
|---|---|---|---|---|
| 3.4 | 2.9 | 3.1 | Jan-23 | |
| Global GDP | 3.5 | 3.0 | 3.0 | Apr-23 |
Canadian Economic Activity dipped during the Second quarter
Canada’s real GDP dropped by a small margin of 0.2% (annualized) during the second quarter of 2023, after rising by 2.6% in the previous quarter. The major contributor to the Q2 decline was the 0.8% drop in inventory investment, led mainly by the drop in residential structures. Also contributing to the decline were lower levels of international exports, and a slowdown in households consumption compared to the pervious quarter.
Regarding overall trade, the export of goods and services grew by 0.1% (with goods exports declining and services exports increasing) while the import of goods and services increased by 0.6%.
Housing investment in residential structures dropped by 0.7% in the second quarter, the fifth consecutive quarterly decline. The decline was led by a sharp drop in new construction activity. Lower inventory accumulations in the second quarter compared with the previous quarter also applied downward pressure on GDP growth. Real household spending slowed to 0.1% in the second quarter from 2.6% in the first quarter.
In contrast, after dropping consequently by four quarters, business gross fixed capital formation increased by 0.3%.

Text version
| Q1 2022 | Q2 2022 | Q3 2022 | Q4 2022 | Q1 2023 | Q 2023 | |
|---|---|---|---|---|---|---|
| GDP growth (%) | 2.6 | 3.6 | 2.2 | -0.1 | 2.6 | -0.2 |
Q2 economic activity flat after seven quarters of growth
Real GDP by industry was essentially unchanged in the second quarter of 2023, as growth in services-producing industries (+0.2%) was largely offset by a contraction in goods-producing industries (-0.3%).
Arts, entertainment and recreation industries grew by 1.9% in the second quarter, rising for the fifth consecutive quarter, although down from the whopping 18.1% increase witnessed in second quarter of 2022.
However, in value terms, real estate, and rental and leasing (+1.1%) were the largest contributor to growth in the second quarter, rising for the third consecutive quarter and at an accelerating pace for the last two quarters. Activity at the offices of real estate agents and brokers, and activities related to real estate (+17.7%) were up for the first time in six quarters and drove the increase in the sector.
Drought and wildfires in many regions of the country contributed to declines in the agriculture, forestry, fishing and hunting sector which fell 3.5% in the second quarter. Forest fires also affected mining, quarrying, and oil and gas extraction, which contracted (-0.3%).

Text version
| Quarterly % GDP growth in Q2 | |
|---|---|
| Management of companies | -7.7% |
| Agriculture, forestry, fishing & hunting | -3.5% |
| Wholesale trade | -2.2% |
| Accommodation & food services | -1.6% |
| Retail trade | -1.3% |
| Construction | -1.0% |
| Mining, quarrying, & oil & gas extraction | -0.3% |
| Utilities | -0.3% |
| Administrative & waste management | -0.2% |
| Finance & insurance | -0.1% |
| All industries | 0.0% |
| Public administration | 0.1% |
| Health care & social assistance | 0.4% |
| Professional, scientific & technical services | 0.6% |
| Educational services | 0.7% |
| Transportation & warehousing | 0.7% |
| Other services (except public administration) | 0.9% |
| Information & cultural industries | 0.9% |
| Manufacturing | 0.9% |
| Real estate & rental & leasing | 1.1% |
| Arts, entertainment & recreation | 1.9% |
Both goods and services trade declined in Q2
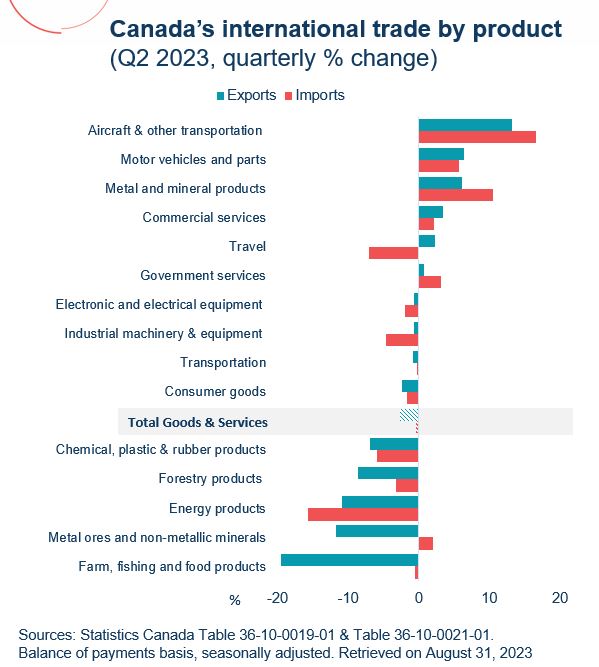
Goods and services exports declined for the fourth consecutive quarter, down by 2.7% in Q2 of 2023. Only 3 of 11 goods export categories expanded. Strong growth was recorded in exports of aircraft and other transportation equipment, motor vehicles and parts, and metal and non-metallic mineral products. However, this was offset by large contractions in energy products, metal ores and minerals, and farm, fishing and food products. On the services front, 3 out of the 4 services categories improved in Q2, with transportation services being the only category that recorded a decline.
Goods and services imports also declined by 0.3% in Q2. Seven of 11 goods categories experienced contractions, including energy products, basic and industrial chemical, plastic and rubber products and industrial machinery, equipment and parts. These were offset by gains in aircraft and other transportation equipment, metal and mineral products, and motor vehicles and parts. Services imports increased in two categories and decreased in the other two. The most noticeable decline (7.1%) was in travel service imports.
Text version
| Quarterly % growth in Q2 | Exports | Imports |
|---|---|---|
| Aircraft & other transportation | 13.24805176 | 16.633858 |
| Motor vehicles and parts | 6.433375975 | 5.6350402 |
| Metal and mineral products | 6.154406409 | 10.47212 |
| Commercial services | 3.436752498 | 2.1022524 |
| Travel | 2.336592898 | -7.093343 |
| Government services | 0.765306122 | 3.0769231 |
| Electronic and electrical equipment | -0.708396237 | -1.984199 |
| Industrial machinery & equipment | -0.736908122 | -4.639414 |
| Transportation | -0.753564155 | -0.191939 |
| Consumer goods | -2.333114467 | -1.739674 |
| Total Goods & Services | -2.717758271 | -0.339289 |
| Chemical, plastic & rubber products | -6.920762287 | -5.885383 |
| Forestry products | -8.601731264 | -3.168729 |
| Energy products | -10.81797944 | -15.68481 |
| Metal ores and non-metallic minerals | -11.7571226 | 1.9433198 |
| Farm, fishing and food products | -19.49466852 | -0.608519 |
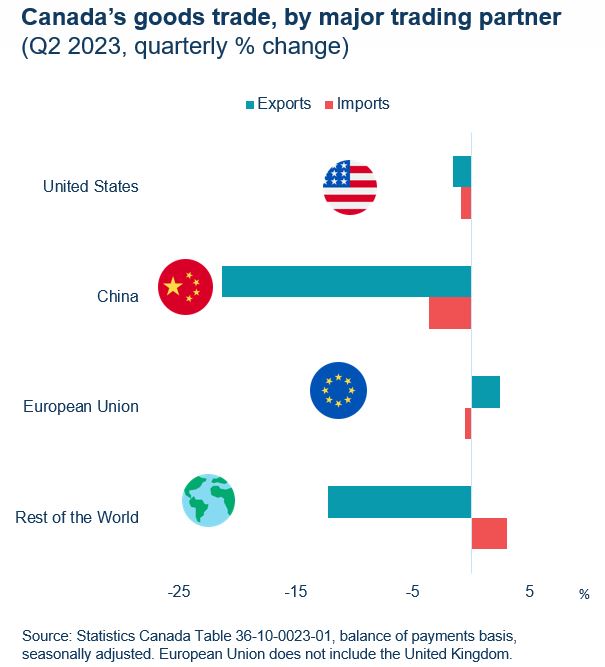
Lower goods trade in Q2 led by U.S. and china
In Q2, Canada’s goods exports and imports to the U.S. declined by 1.5% and 0.9%, respectively. The decline in exports was led by energy products which fell as prices continued their downward trend. Motor vehicles and parts moderated the overall decrease in exports. As was the case for exports, energy products contributed the most to the overall decline in imports, moderated by an increase in imports of motor vehicles and parts
Goods exports to China declined by 21.4% while imports from China decreased by 3.7%. Exports of farm, fishing, and food products fell mainly because of lower exports of wheat and canola, as improving global supplies impacted prices and demand for Canadian exports.
Goods exports increased to the European Union by 2.5%, despite dropping to France and Germany. Imports from the EU declined by 0.5%, led mainly by large declines from Italy and Spain.
Exports to Russia were negligible. Meanwhile, exports to India increased by a massive 36.9%, while exports to the Netherlands and Hong Kong increased by 31.6% and 25.5%, respectively.
Text version
| Quarterly % growth in Q4 | Exports | Imports |
|---|---|---|
| United States | -1.5 | -0.9 |
| China | -21.4 | -3.7 |
| European Union | 2.5 | -0.5 |
| Rest of World | -12.2 | 3.0 |
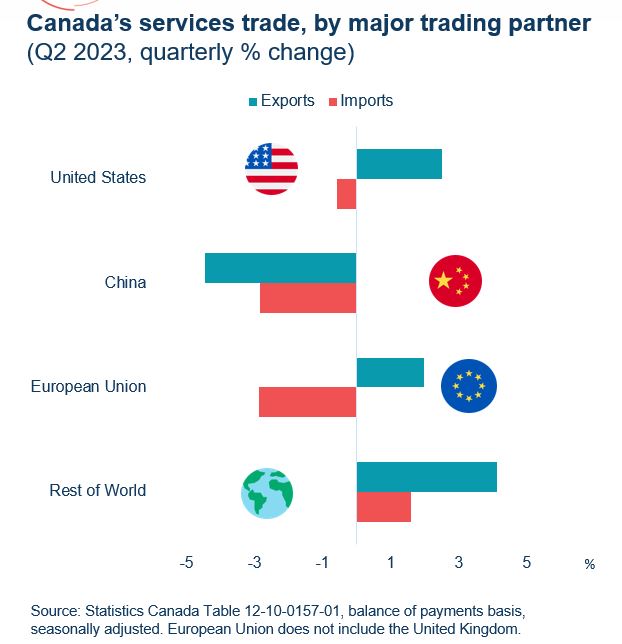
Services Exports continue to Grow while Imports dip
In Q2 2023, services exports increased by 2.7%, while services imports declined marginally by 0.3%.
Growth in services export was mainly driven by increased exports to the United States. Imports of travel services declined as expenditures by Canadians travelling overnight to the United States fell, which more than offset a slight increase in the expenditures of Canadians travelling to foreign destinations other than the United States in the second quarter.
Q2 saw lower services exports and imports to China, similar to that seen in goods trade.
Services exports and imports diverged for the EU, with quarterly exports rising by 2.0% and imports dropping by 2.9%. Exports to Germany increased by 9.1%, while the largest import drop of 9.9% was with Italy.
With the Rest of the World both exports and imports increased by 4.1% and 1.6%, respectively. Commercial services exports increased, led by higher receipts of management services. Commercial services imports were also up as higher payments of royalties, management services, and computer services were partially offset by lower payments of repair services.
Text version
| Quarterly % growth in Q4 | Exports | Imports |
|---|---|---|
| United States | 2.5 | -0.6 |
| China | -4.5 | -2.9 |
| European Union | 2.0 | -2.9 |
| Rest of World | 4.13 | 1.59 |
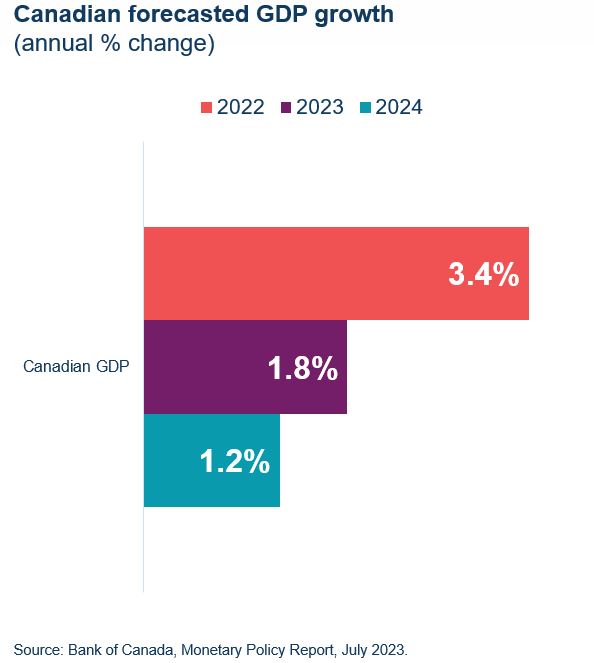
Canada’s economic growth is expected to slow down going forward
According to the Bank of Canada's July 2023 Monetary Policy Report, economic growth is projected to moderate to an average of about 1% through the second half of 2023 and the first half of 2024.
This slowdown results from the effects of higher interest rates on household spending and business investment. Weak foreign demand is also expected to constrain export growth.
In the second half of 2024, GDP growth is expected to pick up as the effect of higher interest rates on economic growth dissipates. Foreign demand is anticipated to strengthen, boosting exports.
Going forward, the Bank of Canada expects that inflation will remain near 3% for the next year. Greater excess demand and more stubborn core inflation are currently sustaining underlying price pressures. However, tight monetary policy will weigh on demand growth, and the economy is projected to enter into mild excess supply in the beginning of 2024. Inflation should then ease, reaching the Bank of Canada’s 2% target in the middle of 2025.
Text version
| Column1 | 2022 | 2023 | 2024 |
|---|---|---|---|
| Canadian GDP | 3.4% | 1.8% | 1.2% |
Annex: Tables
Table 1: Canadian trade by industry sector ($ millions)
| Exports | Imports | |||||
|---|---|---|---|---|---|---|
| Q2 – 2023 | Q/Q % | Y/Y % | Q2 – 2023 | Q/Q % | Y/Y % | |
| Goods | 185,906 | -3.9% | -8.6% | 192,036 | -0.3% | -1.0% |
| Resource products | 65,985 | -6.8% | -6.3% | 51,943 | 0.9% | -7.1% |
| Energy products | 37,658 | -10.8% | -36.2% | 10,176 | -15.7% | -27.4% |
| Non-resource products | 77,018 | 2.4% | 11.8% | 122,746 | 0.5% | 5.1% |
| Industrial machinery & equipment | 12,662 | -0.7% | 13.4% | 22,651 | -4.6% | 7.8% |
| Electronic machinery & equipment | 8,550 | -0.7% | 8.8% | 21,587 | -2.0% | 1.8% |
| Motor vehicles and parts | 25,792 | 6.4% | 23.2% | 33,668 | 5.6% | 18.1% |
| Aircraft & other transportation equipment | 7,702 | 13.2% | 34.3% | 7,110 | 16.6% | 17.7% |
| Consumer goods | 22,312 | -2.3% | -3.8% | 37,730 | -1.7% | -5.9% |
| Services | 44,614 | 2.7% | 12.0% | 47,651 | -0.3% | 6.7% |
| Travel | 9,942 | 2.3% | 28.4% | 9,784 | -7.1% | 26.3% |
| Transportation | 4,873 | -0.8% | 1.2% | 8,840 | -0.2% | -8.0% |
| Commercial | 29,405 | 3.4% | 9.2% | 28,558 | 2.1% | 6.4% |
| Government | 395 | 0.8% | 7.3% | 469 | 3.1% | 4.5% |
| Total Goods and Services | 185,906 | -3.9% | -8.6% | 192,036 | -0.3% | -1.0% |
Note: “Q/Q %” is the change from the previous quarter; “Y/Y %” is the change from the same quarter the previous year.
Sources: Statistics Canada Table 36-10-0019-01 & 36-10-0021-01. Balance of payments basis, seasonally adjusted.
Table 2: Canadian goods trade by trading partner ($ millions)
| Exports | Imports | |||||
|---|---|---|---|---|---|---|
| Q2 – 2023 ($ million) | Q/Q % | Y/Y % | Q2 – 2023 ($ million) | Q/Q % | Y/Y % | |
| United States | 148,181 | 2.5% | -8.3% | 123,654 | 4.3% | 0.8% |
| Mexico | 2,383 | -1.5% | -1.5% | 7,050 | 7.7% | 14.4% |
| European Union | 8,772 | 3.8% | -2.2% | 19,919 | 12.2% | 9.1% |
| France | 1,034 | -5.2% | 6.7% | 1,593 | 8.3% | 6.6% |
| Germany | 1,709 | -9.2% | -8.0% | 5,701 | 12.5% | 17.3% |
| United Kingdom | 2,776 | -37.6% | -49.9% | 3,524 | 50.5% | 13.4% |
| Indo-Pacific Region | 17,945 | -5.6% | -4.1% | 26,427 | 6.3% | -10.8% |
| China | 7,049 | -16.8% | 5.8% | 14,703 | 1.6% | -14.7% |
| Japan | 4,106 | -8.0% | -15.8% | 3,984 | 26.7% | 26.6% |
| Hong Kong SAR | 1,047 | 22.9% | 134.8% | 1,057 | 22.2% | -21.1% |
| South Korea | 1,966 | 16.2% | -19.0% | 2,557 | -1.7% | -15.4% |
| India | 1,520 | 49.8% | 18.6% | 1,465 | 9.0% | -16.0% |
| Australia | 816 | 2.9% | -21.2% | 737 | 41.2% | 7.4% |
| Indonesia | 492 | -29.4% | -37.6% | 370 | 0.5% | -30.2% |
| Singapore | 401 | -15.6% | 0.5% | 447 | -7.1% | -7.3% |
| Taiwan | 548 | 1.1% | -31.8% | 1,107 | 4.7% | -22.2% |
| Rest of the world | 10,452 | -15.2% | -5.4% | 16,275 | 3.7% | -7.8% |
| Total Goods Trade | 190,509 | -0.3% | -8.6% | 196,849 | 6.0% | -0.3% |
Notes: The Indo-Pacific region total includes only the 9 markets for which data are available. “Q/Q %” is the change from the previous quarter; “Y/Y %” is the change from the same quarter the previous year.
Source: Statistics Canada, Table 36-10-0023-01. Balance of payments basis, seasonally unadjusted.
Table 3: Canadian services trade by trading partner ($ millions)
| Exports | Imports | |||||
|---|---|---|---|---|---|---|
| Q2 – 2023 ($ million) | Q/Q % | Y/Y % | Q2 – 2023 ($ million) | Q/Q % | Y/Y % | |
| United States | 24,428 | 9.2% | 13.3% | 28,061 | -0.8% | 12.8% |
| Mexico | 633 | 14.1% | 37.3% | 721 | -31.8% | 6.5% |
| European Union | 5,168 | 3.4% | 14.4% | 6,015 | 2.6% | 6.2% |
| France | 1,348 | 1.8% | 26.6% | 961 | 8.2% | 8.5% |
| Germany | 981 | 11.9% | 30.6% | 1,034 | 5.1% | 1.7% |
| United Kingdom | 2,059 | 10.2% | 4.7% | 2,693 | 23.9% | 4.1% |
| Indo-Pacific Region | 4,955 | -25.8% | 4.3% | 5,246 | -4.2% | -10.4% |
| China | 1,186 | -30.4% | -18.8% | 781 | -6.6% | -27.1% |
| Japan | 526 | -3.3% | 12.4% | 909 | 14.6% | 12.9% |
| Hong Kong SAR | 622 | -3.9% | 4.9% | 1,285 | -5.6% | -20.5% |
| South Korea | 383 | -0.5% | 7.0% | 160 | -10.1% | -10.1% |
| India | 1,168 | -51.6% | 17.2% | 791 | -8.8% | 11.9% |
| Australia | 578 | 27.0% | 63.7% | 332 | -13.1% | 9.2% |
| Indonesia | 57 | -19.7% | 1.8% | 39 | -20.4% | -7.1% |
| Singapore | 316 | -4.0% | 0.0% | 667 | -2.2% | -17.5% |
| Taiwan | 119 | -8.5% | -19.0% | 282 | -14.5% | -13.0% |
| Rest of the world | 6,059 | -9.8% | 19.6% | 5,108 | -19.9% | 4.6% |
| Total Goods Trade | 43,302 | 0.3% | 13.0% | 47,844 | -2.8% | 7.4% |
Notes: The Indo-Pacific region total includes only the 9 markets for which data are available. “Q/Q %” is the change from the previous quarter; “Y/Y %” is the change from the same quarter the previous year.
Source: Statistics Canada, Table 12-10-0157-01. Balance of payments basis, seasonally unadjusted.
- Date modified: