
Quarterly economic and trade report – Q4 2023
Highlights
The global economy expanded in the 4th quarter (Q4) of 2023, with notable growth in the United States (U.S), as well as China and other emerging markets. After falling four consecutive quarters, world merchandise trade volumes grew in Q4.
Canada’s goods and service exports to the world rose 1.7% in the 4th quarter of 2023, with growth in services (+2.4%) outpacing goods (+1.5%). Energy exports, particularly crude oil volumes, contributed heavily to overall growth. Additionally, spending by foreign visitors to Canada bolstered travel services exports.
Canadian imports of goods and services edged up 0.3% in Q4. While imports of consumer and industrial goods increased, a notable decline in motor vehicle imports kept overall goods import growth subdued at 0.2%. On the services side, higher imports of transportation and commercial services helped bolster service import growth to 1.4%
Canada’s goods exports to the U.S. flatlined at 0%, while imports fell 1.7% in Q4. However, Canada’s trade in goods with the rest of the world grew, with exports (+6.9%) rising faster than imports (+3.3%).
Global economic activity in 2024 is expected to be subdued due to the lingering effects of elevated interest rates. However, as inflation subsides and prompts central banks to ease monetary policy, more favourable conditions for consumption, investment, and ultimately global trade should propel the world towards a projected 3.1% growth in 2024.
Table 1: Highlights – Fourth Quarter 2023
| % change, Q4 2023 vs Q3 2023 | % annual change (2023 vs 2022) | |
|---|---|---|
| Global real GDP* | 2.6% | 3.1% |
| Global merchandise trade volume | 0.5% | -1.9% |
| Canadian real GDP* | 1.0% | 1.1% |
| Canadian exports (goods & services) | 1.7% | 1.8% |
| Canadian imports (goods & services) | 0.3% | 3.3% |
Notes: *Throughout the report, GDP is quarterly changes at annualized rates. Source: Oxford Economics, Netherland Bureau for Economic Analysis, Statistics Canada; IMF January World Economic Outlook.
Most major economies post growth in Q4
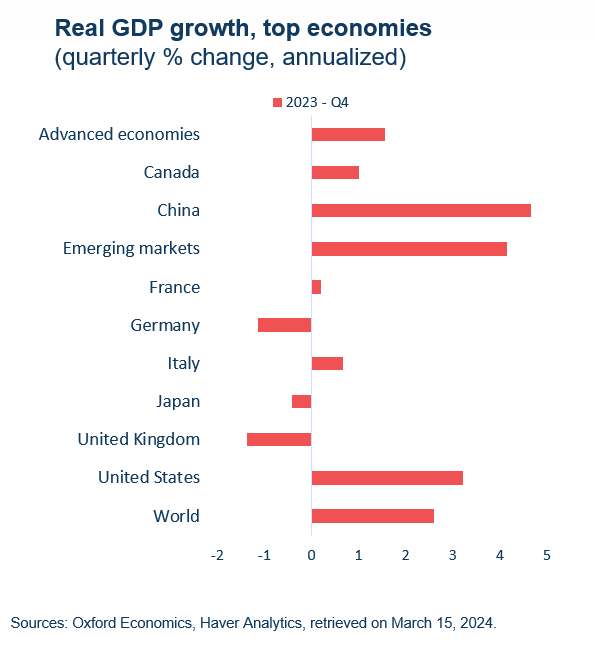
Global economic growth in Q4 (+2.6% annualized) was supported by gains across several G7 countries (Canada, U.S., Italy, France) and China. Overall, quarterly growth in advanced economies (+1.6% annualized) trailed behind growth in emerging markets (+4.2% annualized).
The U.S. economy grew at a solid 3.2% annualized rate in Q4, supported by increases in various sectors like consumer spending, local and state government spending, residential and non-residential investment, and exports. Additionally, a 2.2% quarterly rise in real disposable income boded well for consumer spending. However, as the U.S. government works towards it stated goal of deficit reduction, potential cuts to fiscal spending and tax hikes could dampen economic activity.
In China, the economy grew 4.7% on annualized basis in Q4. Private and government consumption were key contributors to this growth, and increased government spending on capacity building against natural disasters is expected to further propel economic activity into 2024.
In neighboring Japan, GDP declined a slight 0.4% (annualized) in Q4 with drags from private and government consumption as well as inventories.
Economic performance in Europe was lackluster in Q4, with GDP either contracting on an annualized basis in major economies like the U.K. (-1.4%) and Germany (-1.1%) or posting muted growth. The outlook for 2024 faces challenges as weak private and government consumption as well as investment are expected to restrain growth in the Eurozone.
Real GDP growth, top economies (quarterly % change, annualized)
Text version
| Real GDP growth, top economies (quarterly % change, annualized) | 2023 - Q4 |
|---|---|
| Advanced economies | 1.6 |
| Canada | 1.0 |
| China | 4.7 |
| Emerging markets | 4.2 |
| France | 0.2 |
| Germany | -1.1 |
| Italy | 0.7 |
| Japan | -0.4 |
| United Kingdom | -1.4 |
| United States | 3.2 |
| World | 2.6 |
Sources: Oxford Economics, Haver Analytics, retrieved on Mach 15, 2024.
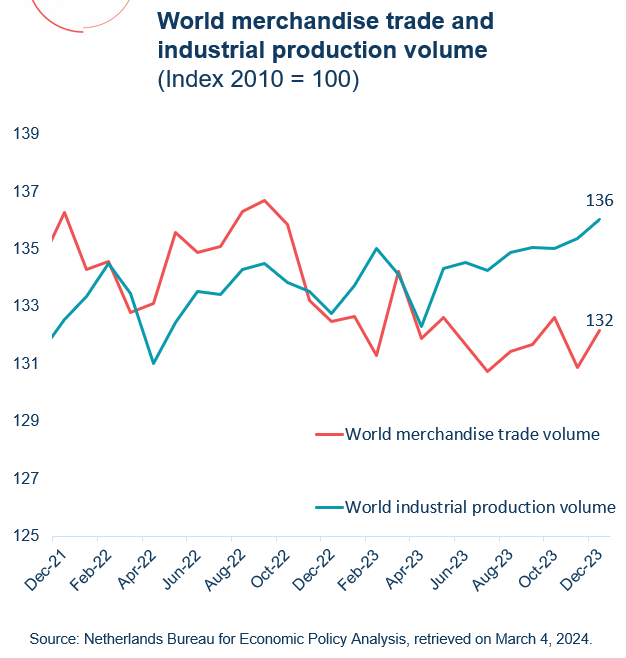
World merchandise trade volumes increase for the first time in four quarters
World merchandise trade volumes increased 0.5% in Q4, the first increase after four consecutive quarterly decrease. During Q4, both imports (+0.5%) and exports (+0.5%) expanded. On an annual basis, world merchandise trade volumes declined by 1.9% in 2023.
Economic growth in several regions supported domestic demand for foreign goods in Q4. Notably, import volumes in China (+1.7%) and other emerging economies in Asia (+4.0%) grew. U.S. import volumes also increased on a quarterly basis (+1.2%). However, in areas of the world where growth was more subdued, demand for foreign goods was less pronounced. Namely, overall import volumes from advanced economies fell slightly (-0.1%), with the Euro area experiencing a significant drop (-2.6%).
On the export side, export volumes from advanced economies grew modestly Q4 (+1.0%). While the U.S. posted a 0.9% gain in Q4, this represents a deceleration in growth from Q3. Emerging economies registered a 0.4% fall in export volumes, with notable slowdowns in China (-0.4%), and eastern Europe (-5.9%).
World industrial production edged up 0.5% in Q4, thanks to higher production volumes in both advanced economies (+0.2%) and emerging economies (+0.8%). Industrial production in China grew for a second quarter in a row, climbing 2.0%.
World merchandise trade and industrial production volume (index 2010 = 100)
Text version
| World merchandise trade and industrial production volume (index 2010 = 100) | World merchandise trade volume | World industrial production volume |
|---|---|---|
| Dec-21 | 136.3 | 132.5 |
| Jan-22 | 134.3 | 133.4 |
| Feb-22 | 134.6 | 134.5 |
| Mar-22 | 132.8 | 133.5 |
| Apr-22 | 133.1 | 131.0 |
| May-22 | 135.6 | 132.5 |
| Jun-22 | 134.9 | 133.5 |
| Jul-22 | 135.1 | 133.4 |
| Aug-22 | 136.3 | 134.3 |
| Sep-22 | 136.7 | 134.5 |
| Oct-22 | 135.9 | 133.8 |
| Nov-22 | 133.2 | 133.5 |
| Dec-22 | 132.5 | 132.8 |
| Jan-23 | 132.7 | 133.7 |
| Feb-23 | 131.3 | 135.0 |
| Mar-23 | 134.2 | 134.1 |
| Apr-23 | 131.9 | 132.3 |
| May-23 | 132.6 | 134.3 |
| Jun-23 | 131.7 | 134.6 |
| Jul-23 | 130.7 | 134.3 |
| Aug-23 | 131.4 | 134.9 |
| Sep-23 | 131.7 | 135.1 |
| Oct-23 | 132.6 | 135.0 |
| Nov-23 | 130.9 | 135.4 |
| Dec-23 | 132.2 | 136.0 |
Source: Netherlands Bureau for Economic Policy Analysis, retrieved on March 4, 2024.
Growth expected to remain muted in advanced economies
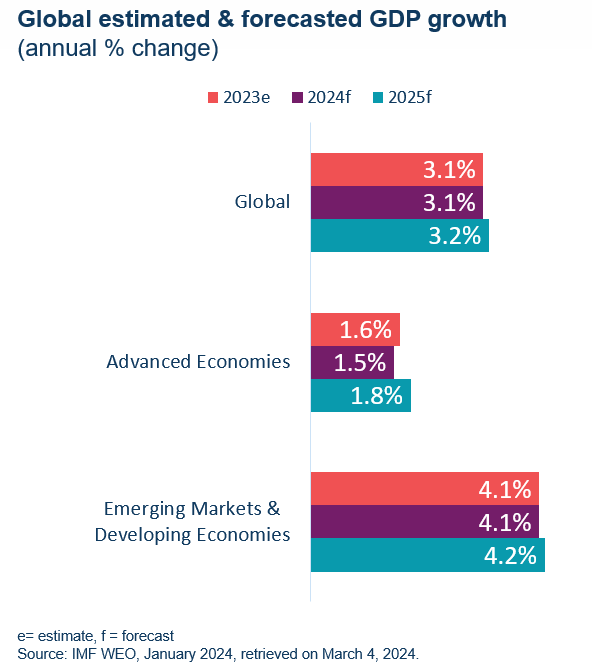
The IMF forecasts global economic growth to temper at 3.1% in 2024 (same as in 2023), before inching up slightly to 3.2% in 2025.
Economic growth in advanced economies is expected to drop to 1.5% in 2024, which falls below the historical average (2000-2019) of 1.9%. While the U.S. is projected to outperform the advanced economies average with 2.1% growth in 2024, growth is expected to fall to 1.7% in 2025. This deceleration is forecasted due to lagging effects of tighter monetary and fiscal policies, and dampened demand from a softening labour market.
While the IMF forecast for emerging economies predicts that real GDP growth will land at 4.1% in 2024, this figure remains below the 2000-2019 average of 5.5%. In China, economic growth is projected to reach 4.6% in 2024, buoyed by resilient economic performance in 2023 and the prospect of increased government spending. India’s economic performance is anticipated to expand notably, with growth projected at 6.5% this year.
A delicate balance of factors will determine the economic landscape for 2024. On the upside, a faster-than-expected slowdown in inflation offers hope for looser financial conditions. Furthermore, technological advancements like AI could unlock much needed productivity gains for economies that seize them. However, several risks remain. Geopolitical uncertainty, notably political instability in the Middle East, poses threats to commodity prices and supply chains. Moreover, stubbornly high inflation could necessitate prolonged monetary tightening and temper growth.
Global estimated & forecasted GDP growth (annual % change)
Text version
| GDP growth (annual % change) | 2023e | 2024f | 2025f |
|---|---|---|---|
| Global | 3.1 | 3.1 | 3.2 |
| Advanced Economies | 1.6 | 1.5 | 1.8 |
| Emerging Markets & Developing Economies | 4.1 | 4.1 | 4.2 |
e= estimate, f = forecast
Source: IMF WEO, January 2024, retrieved on March 4, 2024
Canadian GDP grew modestly in Q4
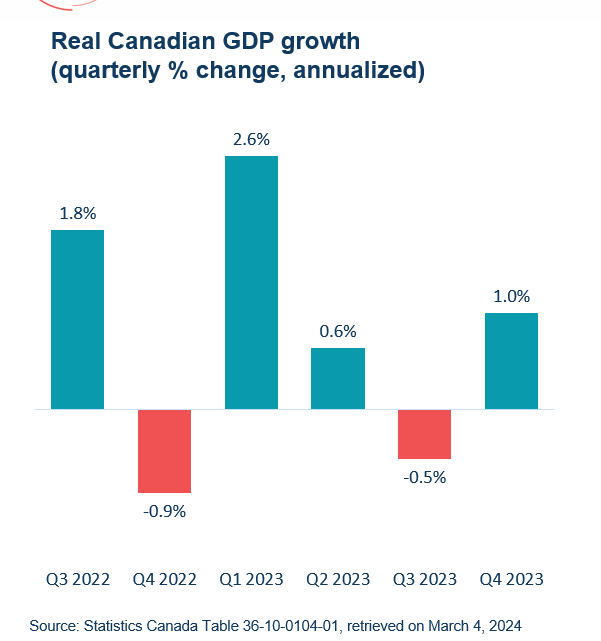
The Canadian economy expanded 1.0% (annualized) in Q4, following an upwardly revised loss of 0.5% in Q3. Higher exports of goods and services (+5.6%) and lower imports (-1.7%) were key contributors to growth. Notably, net trade added 2.4 percentage points to GDP growth in Q4.
Household consumption climbed 1.0% in Q4, making it the second largest contributor to growth. This increase was led by higher spending on trucks, vans, and utility vehicles, which are benefiting from easing supply chain issues. The household savings rate remained stable at 6.2% in Q4, as spending and disposable income grew at nearly the same pace.
On the other hand, business investment placed a notable drag on growth, falling 5.3% in Q4. Investments in inventories also fell as lower retail and wholesale trade inventories were partially, but not fully, offset by higher manufacturing inventories. Furthermore, government spending (-1.9%) also drew back in Q4.
Despite the quarterly gain, GDP fell again on a per capita basis as economic growth struggles to keep up with an ever-expanding population. This dynamic also played out in the labour market, where employment growth (+0.5%) lagged labour force growth (+0.7%) for the fourth consecutive quarter. As a result, the unemployment rate climbed to 5.8% in Q4. A silver lining from higher unemployment is that it signals a rebalancing between labour supply and demand, which is expected to help lower core inflation.
On an annual basis, real GDP grew 1.1% in 2023, which represents the slowest growth rate from 2016 (aside from the 2020 contraction). Several factors stifled growth, including high interest rates, forest fires and drought conditions, as well as strikes across several industries.
Real Canadian GDP growth (quarterly % change, annualized)
Text version
| Q3 2022 | Q4 2022 | Q1 2023 | Q2 2023 | Q3 2023 | Q4 2023 | |
|---|---|---|---|---|---|---|
| Real Canadian GDP growth (quarterly % change, annualized) | 1.8% | -0.9% | 2.6% | 0.6% | -0.5% | 1.0% |
Source: Statistics Canada Table 36-10-0104-01, retrieved on March 4, 2024
Both goods and service producing industries expand in Q4
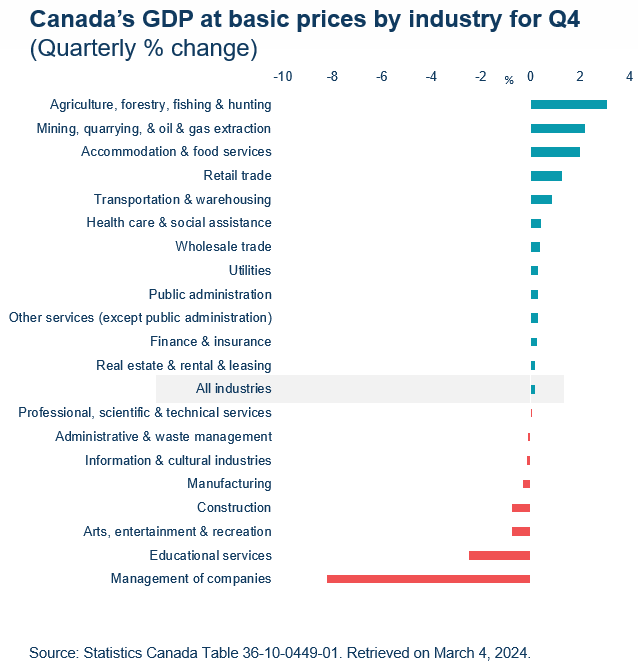
Both goods producing industries and service producing industries grew in real terms (0.2% and 0.1% respectively) in Q4. This marked the 10th consecutive quarter of growth for service producing industries.
Mining, quarrying, and oil and gas extraction (+2.2%) represented the largest driver of growth in the fourth quarter, largely thanks to growth in oil and gas extraction (+1.9%). In the service industries, retail trade (+1.2%) contributed the most to growth as gains were realized by health and personal care retailers.
Education services put a significant dent in growth, falling by 2.5% in Q4. Lower activity in elementary and secondary schools contributed the most to this decline, as strikes by Quebec public sector workers persisted from November to December.
The construction sector also contracted in Q4 (-0.7%) due to lower output in the engineering and other construction activities subsector. However, both residential and non-residential construction held strong, growing 1.3% and 1.6%, respectively.
Canada’s GDP at basic prices by industry for Q4
Text version
| Quarterly % GDP growth in Q4 | |
|---|---|
| Management of companies | -8.2 |
| Educational services | -2.5 |
| Arts, entertainment & recreation | -0.8 |
| Construction | -0.7 |
| Manufacturing | -0.3 |
| Information & cultural industries | -0.2 |
| Administrative & waste management | -0.1 |
| Professional, scientific & technical services | 0.0 |
| All industries | 0.2 |
| Real estate & rental & leasing | 0.2 |
| Finance & insurance | 0.2 |
| Other services (except public administration) | 0.3 |
| Public administration | 0.3 |
| Utilities | 0.3 |
| Wholesale trade | 0.3 |
| Health care & social assistance | 0.4 |
| Transportation & warehousing | 0.8 |
| Retail trade | 1.2 |
| Accommodation & food services | 2.0 |
| Mining, quarrying, & oil & gas extraction | 2.2 |
| Agriculture, forestry, fishing & hunting | 3.1 |
Source: Statistics Canada Table 36-10-0449-01. Retrieved on March 4, 2024.
Canadian trade ends Q4 on a positive note with growth in both exports and imports
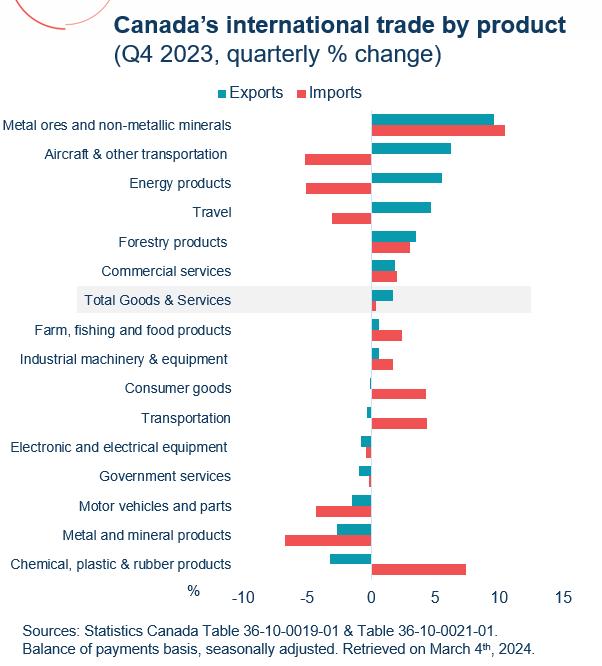
Canadian goods and services exports grew 1.7% in value in Q4, representing a second consecutive quarterly growth. Goods exports increased 1.5% while service exports expanded 2.4%. Energy products (+5.5%) led the increase in exports, which were bolstered by higher crude oil volumes. Overall, 6 of 11 goods categories expanded, with metal ores and non-metallic minerals posting the largest recovery (+9.6%) after falling most significantly in Q3. In terms of services, 2 of 4 categories expanded. Export of travel services recorded the highest growth at 4.6%, marking the 11th quarterly consecutive increase for this category.
After falling in the previous quarter, good and services imports posted a slight gain of 0.3%. Goods imports inched up 0.2%, while service imports grew 1.0%. Overall, 6 out of 11 goods import categories increased. Increases in the import of consumer goods (+4.3%) and chemical, plastic and rubber products (+7.4%) were largely offset by lower imports of motor vehicles (-4.3%). On the services side, 2 of 4 categories increased. After falling in the previous quarter, transportation services ballooned 4.3%. On the other hand, imports of travel services fell 3.1% in Q4. As expenses of Canadians travelling abroad fell and expenses of non-residents visiting Canada grew, Canada ended Q4 in a travel services surplus.
On an annual basis, total trade in goods and services grew 2.5% in 2023, with imports (+3.3%) growing at a faster pace than exports (1.8%).
Canada’s international trade by product (quarterly % growth in Q4)
Text version
| Quarterly % growth in Q4 | Exports | Imports |
|---|---|---|
| Metal ores and non-metallic minerals | 9.6 | 10.5 |
| Aircraft & other transportation | 6.2 | -5.2 |
| Energy products | 5.5 | -5.1 |
| Travel | 4.6 | -3.1 |
| Forestry products | 3.5 | 3.0 |
| Commercial services | 1.9 | 2.0 |
| Total Goods & Services | 1.7 | 0.3 |
| Farm, fishing and food products | 0.6 | 2.4 |
| Industrial machinery & equipment | 0.6 | 1.7 |
| Consumer goods | -0.1 | 4.3 |
| Transportation | -0.3 | 4.3 |
| Electronic and electrical equipment | -0.8 | -0.4 |
| Government services | -0.9 | -0.2 |
| Motor vehicles and parts | -1.5 | -4.3 |
| Metal and mineral products | -2.7 | -6.7 |
| Chemical, plastic & rubber products | -3.2 | 7.4 |
Sources: Statistics Canada Table 36-10-0019-01 & Table 36-10-0021-01.
Balance of payments basis, seasonally adjusted. Retrieved on March 4th 2024.
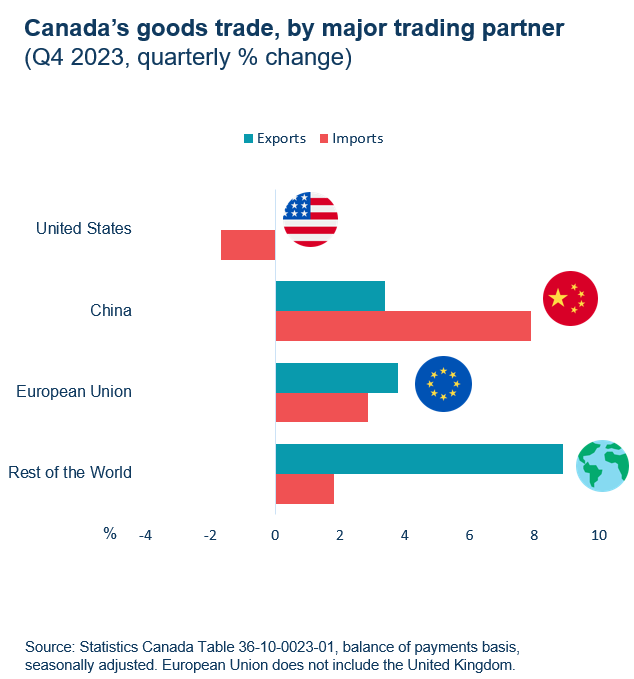
Goods trade growth in Q4 led by countries other than U.S.
Goods exports to the U.S. stagnated at 0.0%, while imports from the U.S. fell by 1.7% in Q4. Fluctuations in automotive trade partly explain these figures. At the start of Q4, strikes by U.S. auto workers hindered Canadian motor vehicle imports. Conversely, towards the end of the quarter, Canada exported fewer cars and light trucks due to model phase-outs.
On the other hand, Canada’s trade with non-U.S. countries expanded in Q4. Canadian exports to European Union countries grew modestly (+3.8%) as Canada exported various products ranging from minerals to aircraft parts. There were notable increases in exports to Italy, Spain, and the Netherlands, while exports to Belgium, France, and Germany fell on a quarterly basis. Furthermore, Canadian imports to the European Union also grew in Q4 (+2.9%).
Exports to China also expanded (+3.4%) in Q4 but were outpaced by import growth (+7.9%) which widened Canada’s goods trade deficit with China to $7.3B.
Canada’s goods trade, by major trading partner (quarterly % growth in Q4)
Text version
| Quarterly % growth in Q4 | Exports | Imports |
|---|---|---|
| United States | 0.0 | -1.7 |
| China | 3.4 | 7.9 |
| European Union | 3.8 | 2.9 |
| Rest of the World | 8.9 | 1.8 |
Source: Statistics Canada Table 36-10-0023-01, balance of payments basis, seasonally adjusted. European Union does not include the United Kingdom.
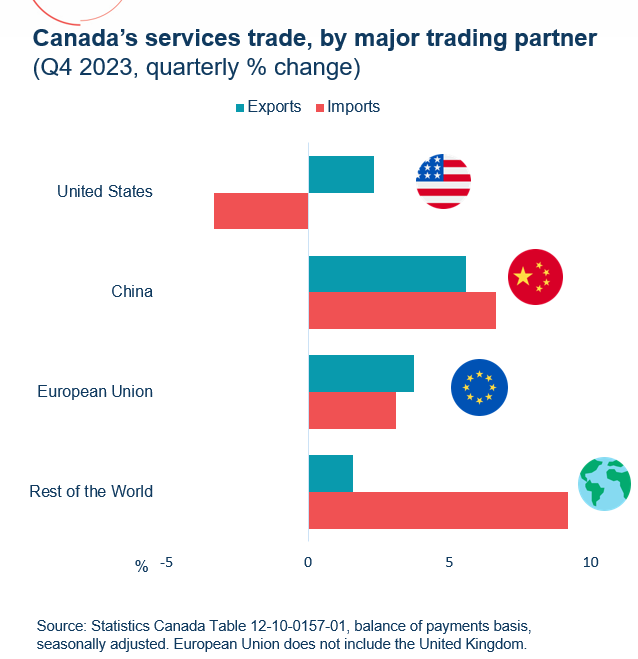
Canada’s service trade deficit narrowed in Q4
Service exports to the U.S. increased 2.3% in Q4, marking the seventh consecutive quarterly increase. Meanwhile, service imports from the US fell 3.3%. As a result, the services trade deficit with the U.S. contracted to $2.5 billion.
Both service exports and imports to countries other than the U.S. grew in Q4. Service exports to the EU grew 3.7% as a result of widespread increases in exports to major countries like Italy (+20.7), Spain (+27.8%), and Belgium (+4.3%). Imports from the EU also posted a gain (+3.1%).
After falling in the previous quarter, service exports to China jumped up 5.6% in Q4. However, Canadian service imports from China grew at a faster pace than exports at 6.7%.
Growth in the number of Canadian travellers abroad (+7.4%) outpaced growth in the number of non-residents visiting Canada (+4.6%) in Q4. While the large majority of non-resident visitors to Canada were U.S. residents, there was a notable increase (+12.1%) in the number of non-U.S. travellers to Canada.
Canada's international student population surged by 29.4% in 2023, with significant growth coming from India, Nigeria, and the Philippines. This influx of international students bolstered Canada’s service exports to the world.
Canada’s services trade, by major trading partner (quarterly % growth in Q4)
Text version
| Quarterly % growth in Q4 | Exports | Imports |
|---|---|---|
| United States | 2.3 | -3.3 |
| China | 5.6 | 6.7 |
| European Union | 3.7 | 3.1 |
| Rest of the World | 1.6 | 9.2 |
Source: Statistics Canada Table 12-10-0157-01, balance of payments basis, seasonally adjusted. European Union does not include the United Kingdom
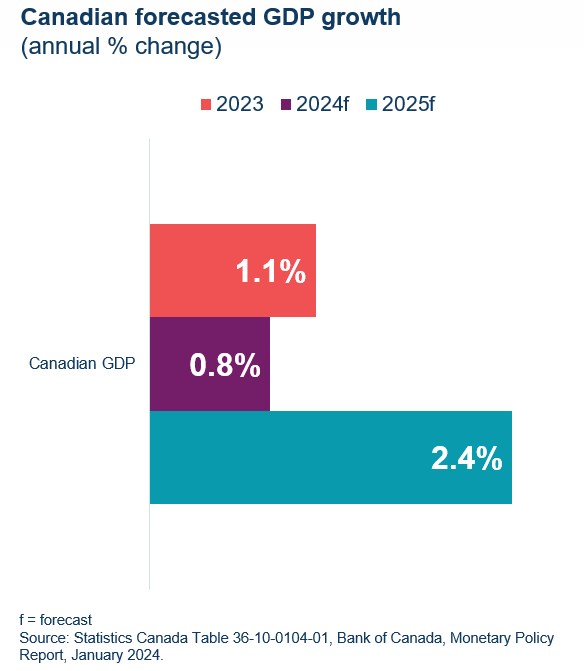
Canada's GDP forecasted to slow in 2024, with potential for higher growth in 2025
Canada's economy faces a potential deceleration in 2024 (0.8% growth) before speeding up in 2025 (2.4%), according to the Bank of Canada's January 2024 Monetary Policy Report.
The Bank of Canada anticipates inflation – which is already sitting at 2.8% as of February – to gradually approach the 2% target in the coming years. As past rate hikes continue to restrain consumption and investment and subdued foreign demand weighs on exports, output exceeds demand. Excess supply in the economy is forecasted to increase into the first half of 2024, thereby placing a downwards pressure on prices. While real wages have been rising in Canada, this trend may see some moderation as the labour market approaches a better balance between supply and demand. With these factors aligning, the Bank forecasts inflation to reach 2.2% in 2025. Despite these notes of optimism, persistent shelter inflation remains a challenge due to structural supply constraints, persistent demand from population growth and high mortgage interest costs.
In the short term, economic growth faces headwinds due to elevated interest rates, global uncertainty, and weak foreign demand for Canadian exports. However, as inflation subsides and the effects of past rate hikes wane, increased consumer spending and investment are anticipated to propel economic activity into 2025.
Canadian forecasted GDP growth (annual % change)
Text version
| Real GDP Growth (%) | 2023 | 2024f | 2025f |
|---|---|---|---|
| Canadian GDP growth | 1.1% | 0.8% | 2.4% |
f = forecast
Source: Statistics Canada Table 36-10-0104-01, Bank of Canada, Monetary Policy Report, January 2024.
Annex: Tables
Table 1: Canadian trade by industry sector ($ millions)
| Exports | Imports | |||||
|---|---|---|---|---|---|---|
| Q4 – 2023 | Q/Q % | Y/Y % | Q4 – 2023 | Q/Q % | Y/Y % | |
| Goods | 195,037 | 1.5 | 0.5 | 192,030 | 0.2 | -0.8 |
| Resource products | 113,539 | 2.3 | -5.5 | 61,276 | 0.4 | -7.9 |
| Energy products | 46,851 | 5.5 | -5.0 | 10,392 | -5.1 | -23.9 |
| Non-resource products | 76,144 | 0.1 | 10.9 | 123,542 | -0.1 | 2.9 |
| Industrial machinery & equipment | 12,893 | 0.6 | 5.4 | 22,366 | 1.7 | 1.1 |
| Electronic machinery & equipment | 8,262 | -0.8 | 3.1 | 20,855 | -0.4 | -2.2 |
| Motor vehicles and parts | 25,644 | -1.5 | 25.9 | 36,218 | -4.3 | 14.3 |
| Aircraft & other transportation equipment | 8,162 | 6.2 | 17.3 | 6,205 | -5.2 | 1.1 |
| Consumer goods | 21,183 | -0.1 | 0.4 | 37,898 | 4.3 | -2.3 |
| Services | 51,862 | 2.4 | 11.3 | 53,626 | 1.0 | 7.8 |
| Travel | 14,136 | 4.6 | 24.7 | 13,021 | -3.1 | 14.4 |
| Transportation | 4,881 | -0.3 | -2.3 | 8,661 | 4.3 | -2.4 |
| Commercial | 32,422 | 1.9 | 8.6 | 31,465 | 2.0 | 8.3 |
| Government | 423 | -0.9 | -1.2 | 478 | -0.2 | 6.7 |
| Total Goods and Services | 246,899 | 1.7 | 2.6 | 245,656 | 0.3 | 1.0 |
Note: “Q/Q %” is the change from the previous quarter; “Y/Y %” is the change from the same quarter the previous year.
Sources: Statistics Canada Table 36-10-0019-01 & 36-10-0021-01. Balance of payments basis, seasonally adjusted.
Table 2: Canadian goods trade by trading partner ($ millions)
| Exports | Imports | |||||
|---|---|---|---|---|---|---|
| Q4 – 2023 ($ million) | Q/Q % | Y/Y % | Q4 – 2023 ($ million) | Q/Q % | Y/Y % | |
| United States | 151,120 | 0.0 | 3.6 | 119,590 | -1.7 | -2.2 |
| Mexico | 2,154 | -13.0 | -18.9 | 7,361 | -1.0 | 19.2 |
| European Union | 8,572 | 3.8 | -10.9 | 18,614 | 2.9 | 5.9 |
| France | 894 | -17.0 | -14.9 | 1,504 | -2.2 | 0.9 |
| Germany | 1,712 | -1.2 | -10.3 | 5,034 | -5.7 | 0.7 |
| United Kingdom | 4,066 | 11.4 | 0.1 | 2,476 | -1.9 | 6.0 |
| Indo-Pacific Region | 18,472 | 6.4 | -9.3 | 27,350 | 6.4 | -0.5 |
| China | 7,728 | 3.4 | -14.8 | 15,051 | 7.9 | -7.6 |
| Japan | 3,799 | 4.9 | -13.2 | 4,287 | 6.5 | 44.0 |
| Hong Kong SAR | 1,171 | -28.1 | 55.7 | 888 | -5.6 | -13.9 |
| South Korea | 1,866 | 25.9 | -1.4 | 3,404 | 19.1 | 27.6 |
| India | 1,490 | 33.3 | -14.0 | 1,294 | -6.7 | -22.9 |
| Australia | 832 | 17.0 | 16.2 | 627 | -2.6 | -9.8 |
| Indonesia | 657 | 48.0 | -26.4 | 389 | -3.7 | -19.1 |
| Singapore | 475 | 21.8 | 15.0 | 423 | -12.6 | 0.0 |
| Taiwan | 454 | -8.1 | -12.9 | 987 | -1.8 | -21.5 |
| Rest of the world | 10,653 | 14.0 | -7.2 | 16,639 | 1.6 | -6.2 |
| Total Goods Trade | 195,037 | 1.5 | 0.5 | 192,030 | 0.2 | -0.8 |
Notes: The Indo-Pacific region total includes only the 9 markets for which data are available. “Q/Q %” is the change from the previous quarter; “Y/Y %” is the change from the same quarter the previous year.
Source: Statistics Canada, Table 36-10-0023-01. Balance of payments basis, seasonally unadjusted.
Table 3: Canadian services trade by trading partner ($ millions)
| Exports | Imports | |||||
|---|---|---|---|---|---|---|
| Q4 – 2023 ($ million) | Q/Q % | Y/Y % | Q4 – 2023 ($ million) | Q/Q % | Y/Y % | |
| United States | 27,602 | 2.3 | 11.2 | 30,087 | -3.3 | -0.1 |
| Mexico | 814 | 4.9 | 43.3 | 1,394 | 19.9 | 35.6 |
| European Union | 5,829 | 3.7 | 17.1 | 7,017 | 3.1 | 16.9 |
| France | 1,591 | 1.8 | 28.7 | 1,135 | 7.3 | 22.0 |
| Germany | 1,113 | 3.3 | 18.3 | 998 | -0.9 | 10.6 |
| United Kingdom | 2,340 | 2.7 | 9.9 | 2,835 | 13.9 | 12.4 |
| Indo-Pacific Region | 7,373 | 3.5 | 5.4 | 5,698 | 2.7 | 6.3 |
| China | 1,855 | 5.6 | 11.0 | 914 | 6.7 | -0.7 |
| Japan | 596 | 6.4 | 14.8 | 746 | -16.2 | 13.7 |
| Hong Kong SAR | 679 | 1.3 | -2.6 | 1,377 | 5.3 | -5.4 |
| South Korea | 413 | -15.9 | 13.2 | 206 | 17.7 | 17.0 |
| India | 2,612 | 6.3 | -1.3 | 949 | 2.8 | 26.0 |
| Australia | 706 | 2.5 | 22.1 | 393 | 8.9 | 19.1 |
| Indonesia | 58 | -3.3 | -9.4 | 51 | 13.3 | 27.5 |
| Singapore | 328 | 2.8 | 1.9 | 719 | 6.7 | -1.1 |
| Taiwan | 126 | 2.4 | -4.5 | 343 | 8.5 | 14.0 |
| Rest of the world | 7,904 | 0.2 | 10.9 | 6,595 | 10.9 | 39.7 |
| Total Services Trade | 51,862 | 2.4 | 11.3 | 53,626 | 1.0 | 7.8 |
Notes: The Indo-Pacific region total includes only the 9 markets for which data are available. “Q/Q %” is the change from the previous quarter; “Y/Y %” is the change from the same quarter the previous year.
Source: Statistics Canada, Table 12-10-0157-01. Balance of payments basis, seasonally unadjusted.
- Date Modified: