Archived information
Information identified as archived is provided for reference, research or recordkeeping purposes. It is not subject to the Government of Canada Web Standards and has not been altered or updated since it was archived. Please contact us to request a format other than those available.
New horizons for Canada: The return to a multi-polar world (2009)
An examination of Canada's trade and competitiveness performance in the emerging markets by Mykyta Vesselovsky
The Emerging World
An extraordinary change has come over the world in the past twenty years, one that will be obvious to future generations but whose repercussions are not yet fully understood by ours. Technological advances, primarily in the area of transmission and storage of information, have shattered the archaic notions of how things ought to function in most fields, from production and trade to war and politics33. The new ways of communicating, organizing and working are inviting the most remote corners of the world to be actors on the global economic stage; their previously dormant forces are now part and parcel of the broad current of human progress. These emerging economies that are organizing themselves to compete in the new global marketplace are enjoying high growth rates, rapid increases in their living standards (Figure 1) and a rising global prominence. In 2008, they accounted for 28 percent of world GDP—up from 17 percent in 199534.
At a Glance
- Growing integration of the world economy allows emerging economies that have made a firm commitment to free markets and good economic governance to generate sustained growth. In time, their per capita income can be expected to converge with that of the developed world, to the lasting benefit of both.
- As only a small part of the gap has been bridged so far, growth prospects remain favourable, especially for technology-induced growth based on productivity improvements.
- Tapping into these markets is crucial—thirty years hence, a gain of just 0.1 percent in the Canadian share of the import markets of Brazil, Russia, India and China (BRIC) would mean an export gain of $29 billion.
- Canada is already exporting 42 percent more to emerging and developing markets than predicted by economic modeling based on the factors that drive trade, such as GDP and distance. In particular, exports to China, Malaysia, Indonesia and Algeria are more than double what the model predicts. Key markets where Canadian exports are below potential include India and Brazil.
- In the U.S. market, our comparative advantage lies primarily in the automotive, wood and paper, and energy sectors. Outside the U.S. market, our advantage in the agri-food, metals and minerals, and aerospace sectors is significantly stronger, but we are at a disadvantage in the energy and automotive sectors.
- Competitiveness analysis in fifteen of the biggest emerging markets reveals that Canadian exports in several advanced manufacturing sectors are performing better in most of these markets than they do globally. Aerospace, in contrast, underperforms in these key emerging markets.
First among these stand Brazil, Russia, India and China (BRIC), champions of the emerging world. Their prominence is not just due to the high rates of growth they have been recently experiencing, although those are impressive. In real terms, Brazil's economy has grown by 46 percent since 1995, Russia's by 79 percent, India's by 136 percent and China's by a staggering 228 percent35. But equally impressive is their growth potential in the future. They occupy a vast area (29 percent of the land surface of the globe), contain over 40 percent of the world's population and are rich in human and natural resources. Their influence is felt everywhere, from the carbon footprint in the atmosphere—China's carbon dioxide emissions more than doubled between 1990 and 2004, nearly catching up to the world-leading United States36—to the emergence of the G20 as a forum to develop a collective response to the economic crisis. Those nations and the rest of the emerging world that they represent are finding their voices, and these are increasingly heard in the global debates.
This change, however, is not unexpected if one takes a look into the past. In fact, it is the global imbalance in favour of the West that is a recent phenomenon. Nearly all of human history was spent in conditions of near-universal international income parity. What is striking about the past few centuries of economic development is not the change in country rankings, but the colossal increase in disparity between the rich and the poor countries. The current income gap between one of the richest countries, Luxembourg, and one of the poorest, Liberia, is over 500 to 1. Two hundred and fifty years ago, it would perhaps have been around 5 to 1, and the broad difference between Europe and East and South Asia was smaller still, somewhere around 1.1-1.5 to 137. Reliable earlier figures are not available, but one thing is fairly certain: prior to about 1750, no society had experienced sustained growth in per capita income. Average incomes stagnated not far from the level of production of an average farmer (subsistence level) with temporary deviations, quickly corrected by population growth. At any rate, nothing approaching the modern income gap between the rich and the poor nations existed in 1750 or at any earlier time. Inequality on that scale was only made possible by the Industrial Revolution.38
Figure 1
GDP per capita (PPP), 1980-2007

Source: Office of the Chief Economist
Data: World Bank
Figure 1 Text Alternative
Figure 1 depicts GDP per capita on a Purchasing Power Parity (PPP) basis in constant 2005 intrenational $ for a number of countries over the period from 1980 to 2007. GDP per capita in Botswana expanded from 3,322 in 1980 to 12.664 in 2007, from 7,629 to 9.034 in Brazil, from 23,015 to 36,178 in Canada, from 525 to 5,046 in China, from 869 to 2,599 in India, from 18,644 to 31,607 in Japan, from 25,446 to 43,227 in the US, from 1,373 to 1,449 in Kenya and from 5,176 to 23,363 in South Korea.
Source: World Bank
This inequality is too great to persist, and economic research predicts that it will not. Income convergence between the rich and the poor countries is a prediction of virtually all growth theories, starting with the classic Solow (1956) and Ramsey (1928) models. Growth in these models is a dynamic process that trends towards a certain steady-state income level. This steady income level may be different for different countries, and it may be continuously changed by parameters such as technological progress. Subject to these qualifications, these models state that economic growth is faster in poorer countries, as they are further from their theoretical maximum income than the richer countries.39
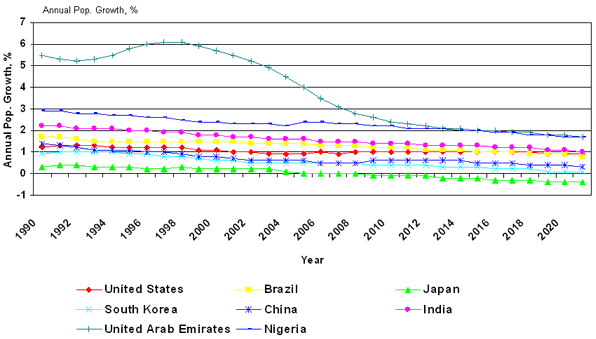
This suggests strongly that the differences in wealth observed today are part of a transitory phenomenon, and that the convergence of poorer nations to the living standards of the rich would be a return to the normal historical experience rather than a departure from it. As the emerging economies approach the income levels of the developed countries, they are undergoing a demographic transition and their population growth rates are slowing down, mitigating the greatest historical obstacle to growth (Figure 2). Several countries such as Japan and South Korea have successfully taken the path of growth; other emerging economies are poised to follow them.
Figure 2
Convergence in Population Growth, 1990-2021
Source: Office of the Chief Economist
Data: IHS Global Insight
Figure 2 Text Alternative
Figure 2 depicts annual actual and projected percentage population growth in various countries to illustrate a tendency to convergence. In the US the population grew by 1.2 in 1990, 1.0 in 2008 and is projected to grow by 0.9 in 2021; growth in Brazil was 1.7 in 1990, 1.3 in 2008 and is projected to grow by 0.8 in 2021; growth in Japan was 0.3 in 1990, 0.0 in 2008 and is projected to decline by 0.4 in 2021; growth in South Korea was 0.9 in 1990, 0.5 in 2008 and is projected to grow by 0.1 in 2021; growth in China was 1.4 in 1990, 0.5 in 2008 and is projected to grow by 0.3 in 2021; growth in India was 2.2 in 1990, 1.5 in 2008 and is projected to grow by 1.0 in 2021; growth in United Arab Emirates was 5.5 in 1990, 2.8 in 2008 and is projected to grow by 1.7 in 2021; growth in Nigeria was 2.9 in 1990, 2.3 in 2008 and is projected to grow by 1.7 in 2021.
Source: IHS Global Insight
Can we be reasonably sure of these predictions? Are these not saying that world poverty is decreasing with every year? Yes we can, and yes they do. World population has grown from 5.3 billion in 1990 to 6.7 billion in 2008, an impressive growth of 27 percent. However, the world's real economic output has grown 67 percent during the same period. And it is the emerging world that led the way: emerging economies grew by about 120 percent, more than twice the rate of the advanced ones40. Thus by the end of 2008, on average every person on the planet was 30 percent richer in real terms than in 1990.
Certainly, some will find these prospects optimistic. Economic progress rarely occurs in an unbroken fashion and is not without its risks. The challenges of the catch-up process are both difficult and little explored, and there may be setbacks and crises along the way. Export-based growth of Asian countries must eventually be supplemented and substituted by domestic demand sources as their own economies get closer to the size of the U.S. economy. The ongoing economic crisis is accentuating the need to find a solution to this dilemma. What these growth predictions effectively hinge on is that, as in the past, the emerging economies will find a way to overcome the challenges as they arise, including learning the most effective catch-up techniques from each other.
It should also be emphasized that the sources and consequences of this growth merit attention: internal distributional issues are a problem, and many societies, from the United States to China, are becoming more unequal. In the end, growth must serve other societal goals: "human development is the end—economic growth a means."41 But as we will see below, the integration of the world economy and the growth of global trade has allowed many countries to find the recipe to sustained growth, and has thus at least created the potential for the world to become not only a richer, but also a more equitable place in which to live.
Determinants of Growth and the Importance of Trade
While convergence theory predicts faster growth for poorer countries, the neoclassical exogenous growth models from which it arises do not explain the extent of the observed international income differences. Their main assumption, that the eventual steady income level is largely determined by the savings rate, is not consistent with the evidence that shows that savings rates and income levels are largely uncorrelated. As an example, the leading industrial powers—the United States and Japan—have vastly different savings rates, yet their recent economic history clearly shows them converging to a similar income level. To explain why some countries are rich and others are poor, additional issues must be considered.
The most important of these is productivity. The ability to produce more output from the same set of inputs characterizes firms, nations and eras as more productive. Ultimately, when all factors of production have been accounted for, a large residual remains: total factor productivity (TFP). Interpreted as a combination of changes in technology and changes in efficiency in the use of inputs, it is believed to explain most of the current international income differences.
And this is to the advantage of the emerging and developing world. It has already been noted that knowledge and information—the basis of modern productivity—are now spreading at an unprecedented rate, and at much lower cost than ever before. To catch up with the developed world under these conditions, there is no need to engage in costly creation of new techniques—only to apply the existing ones to the economic activities. Innovation and new technology are also likely to produce large, instant dividends, increasing the likelihood of their adoption. Finally, only the latest technologies need to be adopted, bypassing the long process of iterative invention and improvement. Thus, an updated version of the convergence theory would now state that those countries that manage to adapt and use the existing stock of productive knowledge in producing goods and services more efficiently will grow faster, and those that are currently using less of that stock will be able to catch up with others by adopting more of it.
This catch-up game only became possible recently, due to the increasingly integrated world economy and the removal of many barriers, a process that was accelerated by the end of the Cold War. Globalization benefited the emerging high-growth countries both on the import and export sides. They "imported what the rest of the world knew, and exported what it wanted."42 This, then, is the paradigm for growth and the role of trade in the integrated global economy.
But have the emerging economies already tapped into productivity increases as a source of potential wealth? Is their growth due to increased productivity or is it largely input-based—in other words, are they simply building new factories or optimizing production processes in the old ones? Evidence on this issue is somewhat mixed, not least because of the pitfalls in aggregate TFP calculations. Bosworth and Collins (2003)43 study the period spanning 1960 to 2000 and show that if China is excluded, TFP among East Asian countries grew no more rapidly than the world average. Rapid growth in that region is primarily explained by large increases in physical capital and contributions from increased human capital. On the other hand, China has exhibited tremendous productivity growth in the 1980-2000 period, reaching 5 percent per year in the last decade. Other studies contend that high growth rates in the emerging world (including China) are input-based, particularly due to increased urbanization and the consequent transfer of rural labour to a more productive urban economy. Overall, there is a broad consensus that China is considerably ahead of India in TFP growth, and that those two are ahead of Brazil and Russia. Yet in terms of overall productivity, evidence shows that emerging markets, BRIC countries in particular, remain far behind. For example, in ease of doing business (a proxy for institutional quality and productive efficiency), the only BRIC country in the top 100 is China and it ranks 83rd.44
By any measure then, the evidence indicates that the prospects for long-term growth of the emerging economies are very encouraging. Only a small part of the gap separating them from the developed world has been bridged so far (Figure 1) and therefore possibilities for both input-based and TFP growth have been barely tapped into45. Conditions for continuing progress include maintaining macroeconomic stability, high rates of saving and investment, good economic governance, and—perhaps most important—being able to rely on the integrated global economy with relatively few restrictions on trade and capital flows. While the current economic crisis may disrupt any or all of these in the short term, a truly seismic change would have to occur to upset the growth promise of the emerging world in the long term.
Trends and Projections for Emerging World Growth
This expected robust growth in the medium and long term will result in a tremendous opportunity for Canadian commercial performance, one that it is important to seize at an early stage. To illustrate the scope of these developments, consider some recent trends and projections in key emerging markets. In the five years from 2003 to 2008, emerging economies grew at an annual average rate of over 7 percent. Although the current global recession is affecting these countries significantly (recent forecasts suggest that their growth could be below 2 percent this year), economists expect that their share of world growth will continue to increase, as the conditions for long-term growth have been achieved in the last decade, namely structural reforms and better macroeconomic policies. In fact, both the global nature of the ongoing crisis and this spectacular growth are largely due to the same factor—the increasing integration of the world economy. While certainly painful, an economic crisis in these countries is a far cry from a traditional crisis involving famines or plagues, or a permanent crisis of unobserved rural poverty, whose incidence and harm have been drastically reduced by their recent economic progress.
Overall, the currently emerging economies will constitute the majority of the top 10 economies list in 2050, replacing several advanced economies, such as Italy and Spain (Table 1).
| Rank | GDP in 2008 | GDP in 2039 (GI) | GDP in 2050 (PwC) |
|---|---|---|---|
| 1 | U.S. | China | China |
| 2 | Japan | U.S. | U.S. |
| 3 | China | India | India |
| 4 | Germany | Japan | Brazil |
| 5 | France | U.K. | Japan |
| 6 | U.K. | France | Mexico |
| 7 | Italy | Germany | Russia |
| 8 | Russia | Italy | Indonesia |
| 9 | Spain | Russia | Germany |
| 10 | Brazil | Türkiye | U.K. |
Consider this:
- China already replaced Germany as the third-largest economy in 2007 and is on its way to surpassing Japan around 2010. It is expected to overtake the U.S. economy as the world's largest around 2025.
- PricewaterhouseCoopers (PwC) estimates that by 2050, China's GDP will exceed that of the United States by about 30 percent, both at market exchange and PPP.
- In the same year, India is projected to nearly catch up with the United States, while Mexico, Russia and Indonesia will overtake the German, U.K. and French economies.
- The top emerging economies—consisting of the BRIC countries, Mexico, Indonesia and Türkiye, the so-called E7—will overtake the current G7 and are projected to be 50 percent larger than the G7 by 2050. In 2007, E7 economies corresponded to about 25 percent of the size of the G7.
- BRIC international merchandise trade overtook that of the U.S. in 2007.
- PwC projects the following countries will have a larger GDP than Canada by 2050: Mexico, Indonesia, Vietnam, Türkiye and Nigeria.
Such long-term projections may prove to be overly optimistic as they neither account for any shocks that will affect these economies throughout this period, nor for the inherent risks to macroeconomic stability, governance and free-market commitment. As projections by PricewaterhouseCoopers (PwC) also rely significantly on labour force growth, these may end up being optimistic for countries with fast-growing populations. More conservative estimates by IHS Global Insight (GI) project fewer drastic differences in the top 10 club in 2039. GI estimates that the nominal GDP of emerging economies will exceed that of traditional advanced economies by 2030. But by any accounts, a major realignment will take place in world patterns of trade, output and wealth. By 2039, the combined GDP of emerging markets and developing countries will represent 58.7 percent of the world's total GDP (GI projection, April 2009).
Impact of Emerging Markets Growth on Canadian Commercial Interests
Canada is a trading nation. Our trade openness ratio is second only to Germany's among the G7. Consequently, any major shifts in global output and trade are likely to have relatively strong impacts on Canada. To estimate the effect on Canada's commercial performance, we conducted a brief market share analysis of Canadian exports to BRIC countries.
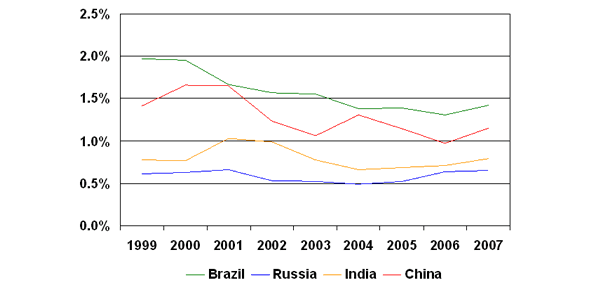
First, we compared the evolution of the total imports of BRIC countries with their imports from Canada46. For BRIC as a whole between 1999 and 2007, total imports have grown at an average annual rate of 17.8 percent (at current prices, in Canadian dollars), compared to 14.5 percent growth in imports from Canada47. This indicates that Canada's market share in these key emerging markets has declined, as shown in Figure 3. Note, however, that this is in line with Canada's overall merchandise exports falling significantly as a percentage of GDP between 1999 and 2007 (Table 2).
Figure 3
Canadian Shares of BRIC Import Markets
Source: Office of the Chief Economist
Figure 3 Text Alternative
Figure 3 depicts the percentage share Canadian exports to the BRIC countries (Brazil, Russia, India and China) accounts for in the respective country’s import market over the period from 1999 to 2007. Canada accounted for 2.0 percent of total imports into Brazil in 1999, but the share has been in decline to reach 1.4 in 2007. Canada accounted for 0.5 percent of total imports into Russia in 1999, comparable 0.7 in 2007. Canada accounted for 0.8 percent of total imports into India in 1999, and although reaching 1.0 in 2001 and 2002 was again 0.8 in 2007. Canada accounted for 1.4 percent of total imports into India in 1999, which rose to 1.7 in 2000 and 2001, but more recently fell back to 1.0 in 2006 and 1.2 in 2007.
Source: IHS Global Insight
| 1999 | 2007 | 2038 | Scenario 1 | Scenario 2 | ||
|---|---|---|---|---|---|---|
| Constant 2007 MS | 0.1% increase in MS | 0.1% decrease in MS | ||||
| Brazil | Market Share | 2.0% | 1.4% | 1.4% | 1.5% | 1.3% |
| Canadian Exports (billions of dollars) | 1.4 | 1.8 | 10.9 | 11.6 | 10.1 | |
| Competitiveness effect (billions of dollars) | - | 0.8 | -0.8 | |||
| Russia | Market Share | 0.6% | 0.6% | 0.6% | 0.7% | 0.5% |
| Canadian Exports (billions of dollars) | 0.2 | 1.3 | 7.9 | 9.1 | 6.7 | |
| Competitiveness effect (billions of dollars) | - | 1.2 | -1.2 | |||
| India | Market Share | 0.8% | 0.8% | 0.8% | 0.9% | 0.7% |
| Canadian Exports (billions of dollars) | 0.5 | 1.8 | 53.3 | 60.1 | 46.6 | |
| Competitiveness effect (billions of dollars) | - | 6.8 | -6.8 | |||
| China | Market Share | 1.4% | 1.1% | 1.1% | 1.2% | 1.0% |
| Canadian Exports (billions of dollars) | 3.5 | 11.7 | 234.2 | 254.6 | 213.9 | |
| Competitiveness effect (billions of dollars) | - | 20.4 | -20.4 | |||
| BRIC | Total Competitiveness effect (billions of dollars) | - | 29.1 | -29.1 | ||
| Canadian Exports-to-GDP ratio (%)* | 36.8 | 28.8 | 39.2 | 39.7 | 38.6 | |
Had Canadian exports kept pace with the growth of the BRIC imports (i.e., assuming a "constant market share"), the increase in Chinese imports from Canada over 1999-2007 would have been approximately one third greater ($10.9 billion instead of the actual increase of $8.3 billion). Thus the overall competitiveness effect over 1999-2007 in China is equivalent to a $2.6 billion export loss; in Brazil, the export loss is $0.7 billion. This contrasts with small export gains in Russia ($73.5 million) and in India ($19.0 million). Retaining market share in these emerging markets is by no means easy, but given their projected growth in import demand, the rewards of doing so are immense.
How immense? Let us take a look thirty years into the future. To do so, we examined Canada's exports to the world (top 20 destinations for Canadian merchandise, representing 95 percent of our exports), and developed three possible scenarios for 2038 based on forecasts by GI for the size of BRIC import markets in that year. The first scenario assumes Canada is able to maintain its current market share in BRIC markets. The second scenario posits that Canada is able to increase its market share in these markets by a mere one-tenth of a percentage point48. The last scenario (pessimistic) is one whereby our market share decreases by one-tenth of a percentage point, continuing on its current downward path.
The results of this analysis are shown in Table 2. Overall, the potential effect of increasing our market share in BRIC countries by just one-tenth of a percentage point by 2038 is equivalent to $29.1 billion in extra export earnings in that year49. Moreover, if Canada is able to maintain its 2007 market share everywhere in the world, our exports-to-GDP ratio would increase to 39.2 percent in 2038 (exceeding the 1999 level). With an increase of just one-tenth of a percentage point in market share in BRIC countries, Canada stands to increase this ratio to 39.7 percent in 2038.
If our market share in BRIC countries continues to decline, we stand to lose: $20.4 billion worth of exports in China, $6.8 billion in India, $1.2 billion in Russia, and $770 million in Brazil.
These figures, based on GI forecasts for the growth of BRIC demand for merchandise imports, underscore the potential consequences for Canada of adopting a policy of active engagement in key emerging markets to benefit from the fast growth in these countries: thirty years hence, a 1 percent increase in our BRIC market share would be worth $290 billion in exports.
Canadian Trade With the Emerging Markets: Are We Missing Opportunities?
Given the rising importance of the emerging markets, and Canada's relatively large distance from most of them, a crucial question arises: Is our proximity to the United States (and, relatively speaking, to most of the OECD countries) preventing us from seeing the opportunities in the emerging and developing world? Are we, in effect, over-trading with developed countries and under-trading with the rest? This question can be answered by an inquiry into the roots and causes of international trade according to economic theory. We conducted this exercise by employing the widely used, intuitively appealing and empirically successful gravity model. The idea behind this model originated with Newton's law of gravity (hence the name), which simply states that the force of attraction between two objects is directly proportional to their masses and inversely proportional to the square of the distance between them. Similarly, in the economic context, trade flows between two partners are assumed to be positively related to their economic masses (GDP) and negatively to the trading distance. With some additional variables that help explain trade flows, this sets up a powerful and robust model—in the sense of explaining a large proportion of variation in trade flows (70-80 percent) and doing so consistently across countries and time periods.
The Gravity Equation
A gravity model expresses an empirical regularity well known to trade economists, stating that trade flows between two countries are directly proportional to their economic size and inversely proportional to the distance between them, as follows:
Xij = A [YiYj /Dij] (1)
(X: trade flows, Y: GDP, D: distance)
Taking logarithms of both sides results in a standard log-linear form of the gravity equation, which is occasionally augmented by several other variables, according to the theoretical origins of the model or else thought to be of empirical importance. Those variables are assumed to be contained in the vector A.
However, the intuitive appeal of this specification was, until recently, not grounded in formal economic theory. Work by Anderson (1979), Deardorff (1998) and Anderson and van Wincoop (2003) established that to avoid the omitted variable bias and ad hoc specification, the gravity equation should be formally derived from theory. Following Anderson and van Wincoop (2003), among others, we used the following gravity equation:
1n Xj = 1n Yj + 1nDCj + 1nPij + WTOj + FTAj + LANDj + ENj +FRj + EMEj (2)
where X is Canadian exports to country j, Y is its real GDP, D is its distance from Canada, Pij is the relative producer price index, and the other terms are dummy variables for WTO membership, free trade agreement (FTA) with Canada, being landlocked, having English or French widely spoken, and being an emerging or developing economy according to the IMF in 2008.
We estimated this equation for the 2000-2007 period, modeling Canadian exports to all destinations where data permits (over 170 countries in all), and allowing for time variation across the years. Exports are explained by GDP, distance, price levels, WTO membership, FTA with Canada, use of English/French, being landlocked, and being an emerging/developing economy. The estimated coefficients were then used to generate predictions for 2007 Canadian export trade values that stem from the gravity theory. The difference between these predictions and the actual observed values determines whether we are, according to the model, over- or under-exporting to a particular country or region.
Our key finding (Table 3) was that the "emerging and developing markets" effect was positive (0.35) and strongly significant. This means that between 2000 and 2007, Canada was exporting 42 percent more to an average emerging or developing country than to a developed country, after adjusting for size, distance and all other factors considered by the model.
| Variable | Coefficient | t | |t| |
|---|---|---|---|
| Real Output | 1.04 | 72.95 | 0 |
| Distance | -1.06 | -14.19 | 0 |
| Price Levels | 0.4 | 4.91 | 0 |
| WTO | 0.46 | 6.64 | 0 |
| FTA | 0.19 | 1.21 | 0.227 |
| Landlocked | -0.49 | -7.07 | 0 |
| English | 0.65 | 10.88 | 0 |
| French | 0.13 | 1.89 | 0.059 |
| Emerging or Developing | 0.35 | 3.47 | 0.001 |
| Constant | -0.57 | -0.64 | 0.524 |
| Observations | 1359 | ||
| R2 | 0.89 | ||
Gravity Trade Model: Interpretation of Regression Results (Table 3)
- Overall, the equation explains 89 percent of variation in Canadian exports across the period—a very good fit.
- The reported coefficients are expressed as elasticities, measuring the proportional change in exports in response to a small change in the independent variable.
- The results of the estimation produce significant, expected and robust coefficients.
- The coefficient on the real output is significant and positive, as expected, and close to the theoretical value of 1.
- Distance has the expected negative coefficient close to -1, which is roughly in line with typical estimates.
- Price levels have the expected positive effect: countries with higher internal prices import more.
- The WTO membership of the destination enhances our merchandise exports, while the FTA effect is positive but not proven beyond a doubt (or "statistically significant")—possibly due to the small number of FTAs Canada has concluded. Being landlocked impacts trade negatively.
- Spoken English has a strong positive effect, while French is positive but not statistically significant.
- The "emerging and developing markets" variable is positive and significant at the 1 percent level, with an "over-export" factor to these equal to exp(0.35) = 1.42.
These results show that rather than missing opportunities and under-exporting to the emerging world, Canada is trading more than expected with the emerging and developing world. How can we explain this result? Several factors could be at play. First, the Canadian export product mix may be more attractive and better suited to the current needs of emerging markets—meaning that we possess a comparative advantage in the goods that they predominantly import. Second, Canadian exporters could already be taking advantage of potential opportunities in the emerging world, on account of its expected growth, and establishing themselves in those countries with a view to the future. Further research would be necessary to assess the validity of these hypotheses, as well as to investigate other potential explanations.
Country and Regional Analysis
The vast majority of our exports (93.7 percent) are expected to end up in the advanced economies. Canada slightly under-exports to these (by 1.4 percent), but significantly over-exports to Asia (by 74 percent), particularly to East Asian countries such as China and Indonesia, and to Africa (by 47 percent) (Table 4 and Table 5). Trade with East Asia is more than double expected, generating over-exports of over $6 billion. This raises the share of this region in our exports from the expected 2.0 percent to 3.4 percent and largely balances our under-exports to the advanced economies. Other regional results are of interest as well. There is substantial over-exporting to the Middle East (by 36 percent), and under-exporting to Emerging Europe by 22 percent (all due to Eastern Europe, as CIS actually shows modest over-exports). Both South Asia and Latin America are characterized by small under-exports (6 to 9 percent). Note that these estimates take into account the emerging market effect discussed in the previous section, and any over/under-exports are in addition to that effect.
| Group | EXPORTS, US$ M | Over/Under | Over/Under, % | Share | Over/Under | ||
|---|---|---|---|---|---|---|---|
| Predicted | Actual | Predicted | Actual | ||||
| Advanced Economies | 391,398 | 385,937 | -5,461 | -1.4% | 93.7% | 92.3% | -1.3% |
| Africa | 1,811 | 2,660 | 849 | 46.9% | 0.4% | 0.6% | 0.2% |
| Emerging Europe | 4,119 | 3,209 | -910 | -22.1% | 1.0% | 0.8% | -0.2% |
| Eastern Europe | 2,753 | 1,758 | -996 | -36.2% | 0.7% | 0.4% | -0.2% |
| CIS | 1,366 | 1,451 | 85 | 6.2% | 0.3% | 0.3% | 0.0% |
| Asia | 8,275 | 14,397 | 6,121 | 74.0% | 2.0% | 3.4% | 1.5% |
| East Asia | 5,382 | 11,680 | 6,298 | 117.0% | 1.3% | 2.8% | 1.5% |
| South Asia | 2,893 | 2,717 | -176 | -6.1% | 0.7% | 0.7% | 0.0% |
| Middle East | 1,233 | 1,673 | 440 | 35.7% | 0.3% | 0.4% | 0.1% |
| Latin America and Caribbean | 11,073 | 10,034 | -1,039 | -9.4% | 2.6% | 2.4% | -0.2% |
| TOTAL | 417,910 | 417,910 | 0 | 100% | 100% | 0% | |
| Actual Exports | Predicted Exports | Over/Under Trading | Over/Under | |
|---|---|---|---|---|
| Indonesia | $936,000,000 | $312,000,000 | $624,000,000 | 200.2% |
| China | $8,908,000,000 | $4,340,000,000 | $4,568,000,000 | 105.2% |
| Saudi Arabia | $648,000,000 | $490,000,000 | $158,000,000 | 32.3% |
| Venezuela | $714,000,000 | $627,000,000 | $87,000,000 | 13.9% |
| Japan | $8,597,000,000 | $8,110,000,000 | $487,000,000 | 6.0% |
| Egypt | $326,000,000 | $337,000,000 | ($11,000,000) | -3.2% |
| United Kingdom | $11,932,000,000 | $14,497,000,000 | ($2,566,000,000) | -17.7% |
| Mexico | $4,637,000,000 | $6,125,000,000 | ($1,488,000,000) | -24.3% |
| Türkiye | $631,000,000 | $995,000,000 | ($364,000,000) | -36.6% |
| France | $2,922,000,000 | $6,866,000,000 | ($3,944,000,000) | -57.4% |
A detailed country analysis shows severe under-exports to the Western European economies such as Germany and France (and the UK to a lesser degree). Among BRIC countries, Brazil and India are the two top under-export destinations in the emerging world—with -24 and -31 percent respectively. Conversely, exports to China are more than double expected, and exports to Algeria and Indonesia are triple the expected amounts.
These results are not easily accounted for on the aggregate level;50 considerable differences exist between countries in our sample that are unaccounted for by the simple model. The theory of international trade provides for several types of trade, depending on the incentive: trade in differentiated goods driven by monopolistic competition, trade driven by factor abundance, and trade driven by unit-labour requirements (comparative advantage). As an example, Canada's reasons to trade with the United States differ from its reasons to trade with South Africa (i.e., intra-industry, intra-firm, differentiated goods flows versus resource exports). This leads to a divergence of South Africa coefficients from the predictions of the model. Export mix matters, and so does Canadian comparative advantage in areas of specific interest to specific countries. Thus our understanding of the drivers of Canadian exports is enhanced with a regional analysis by sector, undertaken below.
In interpreting the above results, some consideration must be given to the peaking commodity prices, particularly for food and metals, which are the primary Canadian exports to some countries in the sample. However, the appropriate robustness checks showed that excluding 2007 from the sample actually slightly increases the over-exporting factor to the emerging markets—i.e., this factor is completely unrelated to the 2007 events. Moreover, while over-exporting to some countries in 2007 can be attributed to higher commodity prices, there are many cases of over-exporting that are not commodity-driven. Overall, despite the scale of these price shocks, they are not found to be the principal driver for the reported results.
Patterns of Canadian Competitive Performance: An Examination of Canada's Comparative Advantage in Emerging Markets
The aim of the analysis that follows is to develop a framework for a detailed analysis of Canada's trade with individual countries of interest. To answer questions about Canada's performance, an analysis of trade by sector is necessary, and we employed the comparative advantage approach to identify the patterns of Canada's competitiveness in a given market. We then compared these with the broad sectoral patterns of Canada's competitiveness in the world market as a whole. Supplemented by an analysis of local circumstances, sectors that perform relatively better in a particular market than in Canada's overall global benchmark may then be identified as potential examples to emulate in other countries ("lessons learned"). Sectors that perform relatively worse may in some cases be identified as potential opportunities, and hence targeted for trade promotion efforts.
Measures of Competitiveness
To measure the competitiveness of Canada's exports, we employed the concept of revealed comparative advantage (RCA)51. Dating back to the original motivation for international trade as expressed by David Ricardo, this concept is simply an observation that countries should export goods that they are relatively good at producing, and import the rest. To the extent that world trade can be explained by this simple Ricardian model, the observed competitive patterns may be interpreted as revealing the underlying comparative advantage through a real-life experiment52.
To define comparative advantage, it is usually stated that if the share of a commodity in Canada's exports to a country is greater than the share of the same commodity in the world's exports to the same country, then Canada is said to have a revealed comparative advantage in this particular commodity in this country. This advantage, however, will be compensated for by a disadvantage in some other area, as all commodity shares sum to a value of 1. For example, the share of construction, mining and lifting machinery in Canadian exports to South Africa is 7.7 percent, while the share of that commodity in global exports to South Africa is 3.9 percent. This means that Canada has a revealed comparative advantage in construction, mining and lifting machinery in South Africa relative to the world.
To actually calculate comparative advantage, we used the normalized RCA (NRCA)53 approach, which allows comparisons across different industry sectors, countries and time periods. A positive NRCA value indicates a comparative advantage, and a negative value indicates a disadvantage54.
Fixing the Benchmark: Canada's Competitiveness in non-U.S. markets
To benchmark Canada's comparative advantage in the emerging markets, we compared it with the Canadian RCA pattern in the rest of the world (which, for the purposes this article, is the world market excluding the United States), since the patterns of Canada's RCA in the world as a whole are driven largely by the disproportionate influence of the United States on Canadian trade. The pattern of Canadian exports to the world is very distinct from its exports to the non-U.S. markets. The NRCA index shows that in 200655 (and generally over the 2000-2006 period), in the world market, Canada held a large comparative advantage in the automotive, wood and paper, and energy sectors; a small advantage in the aerospace, agri-food, and metals and minerals56 sectors; a small disadvantage in chemicals and miscellaneous manufacturing; and a large disadvantage in the machinery and electrical equipment sector.
However, after excluding the United States, the pattern of NRCA in the rest of the world is quite different (Figure 5). Canada's comparative advantage in the agri-food, metals and minerals, and aerospace sectors increases greatly, while the wood and paper sector preserves its advantage. However, automotive products and particularly energy become areas of comparative disadvantage, while the machinery and electrical equipment sector becomes even more disadvantaged than before. These changes reflect Canada's different areas of specialization outside of the U.S. market.
Due to the enormous size and special character of the Canada-U.S. trading relationship, it dominates the patterns of Canadian RCA worldwide. Thus Canada's RCA in energy in the U.S. market causes Canada to post a high worldwide RCA in that sector, and yet Canada is very disadvantaged in energy exports to the rest of the world (Figure 4 and Figure 5). It may be surprising to think of energy (or even automotive products) as an area of comparative disadvantage for Canada. Yet this is easily explained when we compare the share of energy in Canadian world exports (21.1 percent) with its share when the U.S. market is excluded (4.8 percent). Meanwhile, the share of energy in total global exports is 15.0 percent. Conversely, while Canada's comparative advantage in metals and minerals seems very low in the world as a whole, this sector performs impressively in the non-U.S. markets. This is again due to the fact that the shares of metals and minerals in Canadian exports to the world (13.0 percent) versus the world excluding the U.S. market (19.5 percent) differ greatly.
Figure 4
Canada’s NRCA Patterns in the World
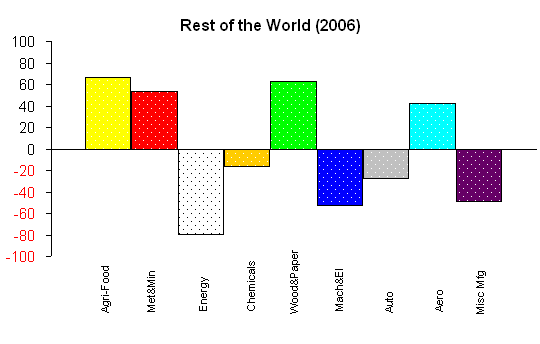
Figure 4 Text Alternative
Figure 4 depicts Normalized Revealed Comparative Advantage (NRCA) for Canadian World exports in 2006 by major sectors. In comparison to World imports from all countries, Canada over-performs (better than average) in the Agri-food (+23.5), Metals & Minerals (+14.3), Energy (+202.9), Wood & paper (+223.5), Auto (+295.8) and Aero (+46.8) sectors, but under-performs (worse than average) in the Chemicals (-105.5), Machinery & electrical (-469.3) and Miscellanous manufactures (-232.0) sectors.
Sources: UN Comtrade database and World Trade Atlas
Figure 5
Canada’s NRCA Patterns in the Rest of the World (Excluding the United States)
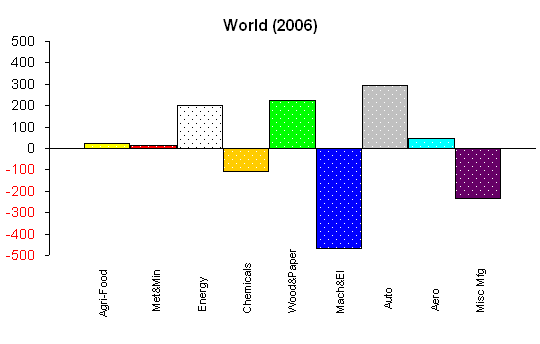
Figure 5 Text Alternative
Figure 5 depicts Normalized Revealed Comparative Advantage (NRCA) for Canadian exports to the World excluding the US in 2006 by major sectors. In comparison to World excluding US imports from all countries, Canada over-performs (better than average) in the Agri-food (+66.7), Metals & Minerals (+53.9), Wood & paper (+62.8), and Aero (+41.9) sectors, but under-performs (worse than average) in the Energy (-79.1), Chemicals (-105.5), Machinery & electrical (-52.6), Auto (-27.8), and Miscellanous manufactures (-49.3) sectors.
Sources: UN Comtrade database and World Trade Atlas
To address this comparability issue and analyse Canadian export performance in the emerging markets appropriately, we studied Canadian NRCA in the world excluding the United States. Figure 5, therefore, shows the appropriate benchmark for our comparison. It will be referred to in the rest of the analysis for the sake of brevity as the Canadian pattern of global comparative advantage.
Aggregate Versus Full Detail Analysis
The nine-sector broad view discussed above may hide crucial information. For example, Canada has a natural comparative advantage in wheat production in the world, which may be expected to result in a higher competitiveness in this area—but aggregation with the rest of the agri-food sector conceals that fact (Figure 4). Conversely, although Canada is at a comparative disadvantage in the chemicals sector, an RCA analysis at a more disaggregated level shows a significant comparative advantage in fertilizers (Table 6); similarly, in the world market, Canada's RCA performance in the metals and minerals sector shows a disadvantage between 2000 and 2005; however, Canada has a clear advantage in aluminum, nickel and articles thereof, as well as in zinc over that period. Therefore, a more disaggregated view is useful to nuance the broadly presented results.
Therefore, to make the analysis manageable yet informative, we considered two types of sectoral breakdown: a broad aggregation into nine major sectors discussed above and a more detailed analysis based on a DFAIT Clustered Trade Classification (CTC) system comprised of 53 commodities. This more detailed CTC analysis frequently yields insights that a broad aggregation would miss57.
Table 6 shows the top 10 ranking Canadian commodities by their comparative advantage score in the non-U.S. markets (among the 53 CTC commodities).
| CTC | CTC Name | NRCA | Rank |
|---|---|---|---|
| C44 | Wood and woodpulp | 55.90 | 1 |
| C10 | Cereals and seeds including canola | 54.15 | 2 |
| C75 | Nickel and articles thereof | 42.12 | 3 |
| C88 | Aerospace | 41.88 | 4 |
| C26 | Ores and concentrates | 33.64 | 5 |
| C02 | Meat, fish, live animals and their products | 23.45 | 6 |
| C31 | Fertilizers | 12.96 | 7 |
| C84.4 | Power-generating machinery | 11.20 | 8 |
| C28 | Inorganic chemicals including uranium | 10.77 | 9 |
| C07 | Vegetables, pulses and live trees and plants | 6.91 | 10 |
Canada's advantage in wood and wood pulp, cereals and seeds, nickel, aerospace, ores, as well and meat, fish and live animals is maintained in both the world and non-U.S. markets. Our lowest NRCA in the rest of the world is in energy, textiles, automotive products, iron and steel and their products, and ICT electrical and electronic equipment. Fertilizers, power-generating machinery and inorganic chemicals rank at a fair advantage.
Regional Competitiveness Analysis by Sectors
An analysis of individual countries is needed in order to compare the specific patterns of Canada's export performance in selected countries to the global benchmark. To this end, we evaluated competitiveness by sector both at the broad (i.e., nine sectors) and detailed (53 CTC commodities) levels on the NRCA basis, with Canadian exports evaluated against total world exports to the countries in question. Note that some commodities (energy, automotive products and aerospace products) form sectors of their own due to their size and importance.
For analysis, we selected 15 major emerging markets in five regions, all of which are in the top 20 destinations for Canadian merchandise exports in emerging markets. We used country-specific imports data58 to profile a pattern of competitiveness with advantages and disadvantages by sector. Comparing this to the pattern of Canadian global comparative advantage, we identified sectors of better-than-expected performance, using the term "over-exports" to refer to these, and "under-exports" otherwise. Over-exporting may provide lessons to learn for our commerce in neighbouring or similar countries, while under-exporting may indicate potential areas of opportunity59.
Given our definition of comparative advantage as a higher proportion of a commodity in the Canadian exports to a country than its proportion in the world's exports to that country, the following may be possible reasons for under-exporting a given commodity to a given market:
- abundant local supply of main commodities in the sector, causing unusual import product mix (e.g. Russia will import metals, but not nickel which is locally abundant);
- abundant regional supply of main commodities in the sector, causing imports from that destination to substitute for imports from Canada;
- local free trade agreements, which make it cheaper to import from an FTA partner than from Canada (trade diversion);
- non-tariff barriers that affect Canada more than other exporters;
- Canada's global pattern in that sector (e.g. aerospace) is mainly formed in other countries that are dissimilar to the country in question;
- large over-exports exist in another (dominant) sector in the same country;
- insufficient information or awareness of opportunities in a country.
Identifying which of these factors is relevant in a particular market would be the subject of further work building on the local market knowledge accumulated by the Trade Commissioner Service. Cases of unexploited opportunities which are explained by insufficient information are of the most interest, although the impact of trade preferences or barriers is also relevant to Canada's trade policy development.
In the individual country discussions, rankings (+/- numbers) denote the relative standing of the commodity in the local competitiveness ranking versus the global ranking. The more positive the ranking, the more a commodity is over-exported to a particular market, for a maximum possible rank of +52 (53 commodities in total). Tracking these rank movements was one of our principal means for identifying over- and under-exports60.
When discussing comparative advantage only, it is also useful to speak of a "local top 10" which simply refers to the top 10 commodities in the local competitiveness ranking.
Guide to Comparative Advantage Charts and Analysis
Asia
Normalized Revealed Comparative Advantage (NRCA) in China (2008)
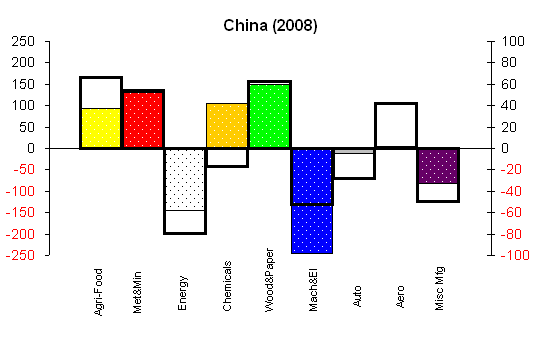
Black outlines represent global benchmarks (right axis). Coloured bars are specific to the country (left axis).
Normalized Revealed Comparative Advantage in China - Text Alternative
The figure depicts Normalized Revealed Comparative Advantage (NRCA) for Canadian exports to China in 2008 by major sectors. In comparison to Canadian export performance to the World excluding the US, Canadian exports to China over-performs (better than average) in the Energy, Chemicals, Auto and Miscellanous manufactures sectors; under-performs (worse than average) in the Agri-food, Wood & paper, Machinery & electrical and Aero sectors; and performs on par in the Metals & minerals sector.
Sources: UN Comtrade database and World Trade Atlas
Normalized Revealed Comparative Advantage (NRCA) in India (2007)
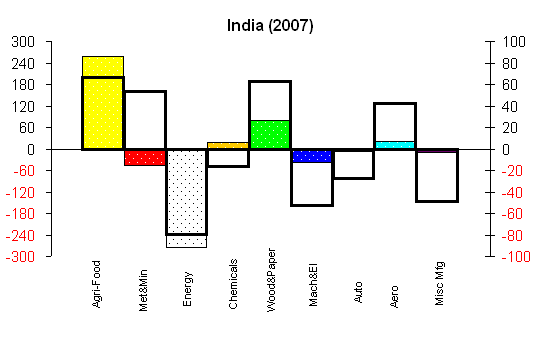
Black outlines represent global benchmarks (right axis). Coloured bars are specific to the country (left axis).
Normalized Revealed Comparative Advantage in India - Text Alternative
The figure depicts Normalized Revealed Comparative Advantage (NRCA) for Canadian exports to India in 2007 by major sectors. In comparison to Canadian export performance to the World excluding the US, Canadian exports to India over-performs (better than average) in the Agri-food, Chemicals, Machinery & electrical, Auto and Miscellanous manufactures sectors; under-performs (worse than average) in the Metals & minerals, Energy, Wood & paper and Aero sectors.
Sources: UN Comtrade database and World Trade Atlas
Normalized Revealed Comparative Advantage (NRCA) in Indonesia (2007)
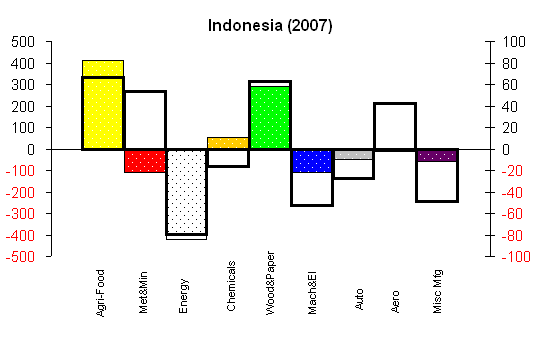
Black outlines represent global benchmarks (right axis). Coloured bars are specific to the country (left axis).
Normalized Revealed Comparative Advantage in Indonesia - Text Alternative
The figure depicts Normalized Revealed Comparative Advantage (NRCA) for Canadian exports to Indonesia in 2007 by major sectors. In comparison to Canadian export performance to the World excluding the US, Canadian exports to Indonesia over-performs (better than average) in the Agri-food, Energy, Chemicals, Machinery & electrical and Auto sectors; under-performs (worse than average) in the Wood & paper and Aero sectors; and performs on par in the Metals & minerals sector.
Sources: UN Comtrade database and World Trade Atlas
Normalized Revealed Comparative Advantage (NRCA) in Malaysia (2007)
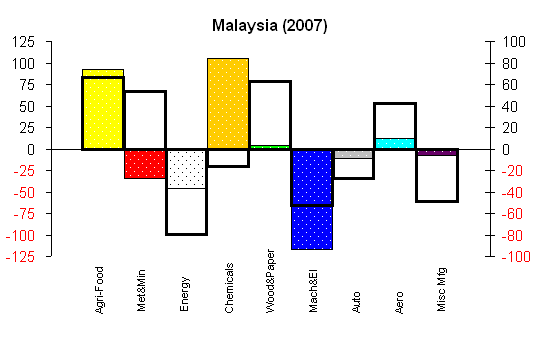
Black outlines represent global benchmarks (right axis). Coloured bars are specific to the country (left axis).
Normalized Revealed Comparative Advantage in Malaysia - Text Alternative
The figure depicts Normalized Revealed Comparative Advantage (NRCA) for Canadian exports to Malaysia in 2007 by major sectors. In comparison to Canadian export performance to the World excluding the US, Canadian exports to Malaysia over-performs (better than average) in the Agri-food, Energy, Chemicals, Auto and Miscellanous manufactures sectors; under-performs (worse than average) in the Metals & minerals, Wood & paper, Machinery & electrical and Aero sectors.
Sources: UN Comtrade database and World Trade Atlas
Asia is the key area of the emerging world. It is home to the biggest economic development success stories in history: Japan and the four Asian Tigers, which act as role models for their neighbours. Establishing a solid presence in Asia is crucial to the long-term prospects of any exporting nation. The earlier gravity analysis has shown considerable over-exporting by Canada to Asia as a whole. We examined in detail Canadian exports to four key emerging markets in Asia: China, India, Indonesia and Malaysia. The broad nine-sector pattern of Canadian competitiveness in these countries is depicted in the previous graphs. Our discussion of common trends in these graphs is followed by individual country specifics, with some discussion at the detailed 53-commodity level (CTC).
Common Themes
- Canada severely under-exports wood and paper to both countries.
- Exports of chemicals to both countries are close to the global benchmark.
- Miscellaneous manufacturing is less disadvantaged in both countries than globally.
- Machinery and electrical equipment is over-exported as well, particularly to South Africa.
- Other manufacturing sectors perform above the global benchmark: automotive exports do better in South Africa and aerospace exports do better in Algeria.
1.1 China
Key Over-Exports
- Organic chemicals
- Sulfur, salts and minerals
- Fats, oils, animal feed
- Rubber and its products
Key Under-Exports
- Inorganic chemicals (including uranium)
- Power-generating machinery
- Paper and print
- Precious stones and metals
China is by far Canada's largest merchandise trading partner among emerging markets, and second overall. It is the fourth-largest destination for Canadian exports, and the second-largest source of imports.
The key over-exported commodities relative to Canada's global comparative advantage in the chemicals sector are organic chemicals (ranked +38 over benchmark), rubber and its products (+23) and fertilizers (+3), although overall success is mitigated by under-exports of inorganic chemicals (-26 under benchmark). In the metals and minerals sector, sulphur, salts and minerals are over-exported (+11), but precious stones and metals are under-exported (-27). Fats, oils and animal feed are over-exported (+15) in the agri-food sector, although overall its performance is below par. Automotive exports are at less of a disadvantage than globally, i.e. over-exported (+8).
Paper and print are under-exported (-21), thus reducing competitiveness in the wood and paper sector, although wood and wood pulp are performing well, bringing this sector up to par. Power-generating machinery is significantly under-exported (-30), as is construction, mining and lifting machinery (-21), driving down competitiveness in our machinery and electrical equipment sector.
Note that Canada held a high comparative advantage in power-generating machinery in 2000, and remained at an advantage (although declining) until 2008 when it lost that advantage.
Significantly, between 2000 and 2008, Canadian performance in the aerospace and automotive sectors has deteriorated (both were areas of comparative advantage between 2000 and 2003), while our competitiveness in metals and minerals, and chemicals has been growing. This may be an indication that China is moving up the value chain in these areas, and is manufacturing its own aerospace and automotive products using imported raw materials. While Canada retains a large comparative advantage in cereals and seeds, this has decreased compared to 2000. In contrast, our advantage in sulphur, salt and minerals has grown over the last eight years.
1.2 India
Key Over-Exports
- Vegetables, pulses, trees and plants
- Paper and print
- Construction, mining, lifting machinery
- Fertilizers
Key Under-Exports
- Meat, fish, animals and their products
- Inorganic chemicals (including uranium)
- Precious stones and metals
- Power-generating machinery
India is Canada's fourth-largest destination for merchandise exports among emerging markets. In 2008, it ranked second as a destination for both Canadian fertilizers and vegetables after the United States.
The key commodities over-exported to India are vegetables and pulses (+9 over benchmark) that drive our advantage in the agri-food sector, fertilizers (+5) in the chemicals sector, and construction, mining and lifting machinery (+8) that raises our performance in the machinery and electrical equipment sector. Paper and print (+8) are over-exported, but under-exports of wood and pulp (-6) lead to overall under-exporting in the wood and paper sector. Similarly, lower than expected exports of meat, fish, animals and their products, inorganic chemicals and power-generating machinery are mitigating our advantage in the agri-food, chemicals and machinery and electrical equipment sectors, respectively. Under-exporting in metals and minerals is a significant departure from the benchmark, led by the under-exports of precious stones and metals (-39).
Canadian performance in wood and paper has been generally in decline since 2000, despite our strong competitiveness in paper and print. Metals and minerals, however, generally improved (except for in 2007). The advantage in the agri-food sector improved sharply in 2007 (reversing years of declines), attributable to vegetables and pulses as well as cereals and oilseeds. In 2007, Canada was the leading source of vegetables and pulses in India, holding 37.7 percent of the Indian import market.
1.3 Indonesia
Key Over-Exports
- Fruit and vegetable preparations
- Misc. scientific
- Construction, mining, lifting machinery
- Toys and sports equipment
Key Under-Exports
- Aerospace
- Power-generating instruments machinery
- Meat, fish, animals and their products
- Ores and concentrates
Indonesia is Canada's seventh-largest merchandise export market among emerging countries. It is an important importer of Canadian cereals—and Canada ranks first as a source of fertilizer and wood pulp imports in Indonesia.
Although the broad pattern of Canadian competitiveness in Indonesia is very similar to the performance in India, there are differences at the detailed commodity level. Significant over-exports exist in toys and sports equipment (+21 over benchmark), and miscellaneous (non-medical/optical) scientific instruments (+6)—both contributing to over-exporting in the miscellaneous manufacturing sector. As in India, construction, mining and lifting machinery over-exports (+12) are behind over-exports in the machinery and electrical equipment sector; under-exports of power-generating machinery (-25) are limiting our competitiveness here. Fruit and vegetable preparations (+17) are among the key over-exports to Indonesia in the agri-food sector (cereals rank first), but meat, fish, animals and their products are under-exported (-24). Low competitiveness in ores and concentrates (-13) is behind our under-exports in the metals and minerals sector; under-exports in the aerospace sector (-34) are considerable.
Although Canada is highly competitive in wood and wood pulp globally (first among the 53 CTC commodities), it is notable that Canada has a large advantage in this area in a country that holds wood in abundance. Canada is the leading provider of wood pulp (chemical and mechanical) to Indonesia (which imported $1.6 billion worth of wood pulp in 2008, almost 20 percent of which came from Canada). Wood pulp's second-place ranking (out of 53 commodities) and our large share of the Indonesian wood and paper import market may be an important lesson for our exporters.
Competitiveness in the chemicals sector has been increasing over 2000-2007, turning positive in 2004. Performance in machinery and electrical equipment has also been improving; while the high advantage in wood and paper has been in decline since 2000, it increased again in 2006 and 2007.
1.4 Malaysia
Key Over-Exports
- Plastics
- Fertilizers
- Fats, oils, animal feed
- Zinc and articles thereof
Key Under-Exports
- Precious stones and metals
- Paper and print
- Ores and concentrates
- Meat, fish, animals and their products
Malaysia is the thirteenth-largest destination for Canadian merchandise exports among emerging markets.
The key commodities over-exported to Malaysia are plastics (+38 over benchmark) and fertilizers (+6), both driving the impressive Canadian performance in the chemicals sector, with possible lessons to learn for other destinations. Over-exporting fats, oils and animal feed (+18) and fruit and vegetable preparations (+12) raises our agri-food sector to a better-than-expected performance.
Key under-exports to Malaysia include precious stones and metals (-34) and ores and concentrates (-26), leading to a relative disadvantage in metals and minerals; weak performance in paper and print (-26) is responsible for under-exports in the wood and paper sector. Meat, fish, animals and their products are also under-exported, restricting Canadian advantage in agri-food.
Canadian competitiveness in chemicals has increased over time, mainly due to fertilizers. Meanwhile, the advantage in wood and paper has been declining, similar to what was observed elsewhere in Asia. The disadvantage in metals and minerals has deepened over the 2003-2007 period.
The profound disadvantage in machinery and electrical equipment (despite electrical and electronic equipment being the second-largest Canadian export commodity in Malaysia) is indicative of the sheer size of the Malaysian import market in this sector. This sector, ranked first overall in Malaysian imports, thus remains a potential area of opportunity.
2. Latin America and the Caribbean (LAC)
Normalized Revealed Comparative Advantage (NRCA) in Mexico (2008)
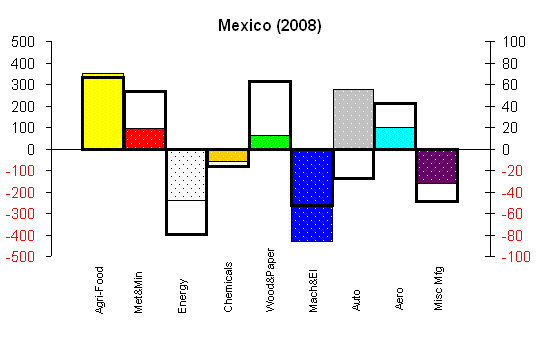
Black outlines represent global benchmarks (right axis). Coloured bars are specific to the country (left axis).
Normalized Revealed Comparative Advantage in Mexico - Text Alternative
The figure depicts Normalized Revealed Comparative Advantage (NRCA) for Canadian exports to Mexico in 2008 by major sectors. In comparison to Canadian export performance to the World excluding the US, Canadian exports to Mexico over-performs (better than average) in the Agri-food, Energy, Chemicals and Auto sectors; under-performs (worse than average) in the Metals & minerals, Wood & paper, Machinery & electrical, Aero and Miscellanous manufactures sectors.
Sources: UN Comtrade database and World Trade Atlas
Normalized Revealed Comparative Advantage (NRCA) in Brazil (2008)
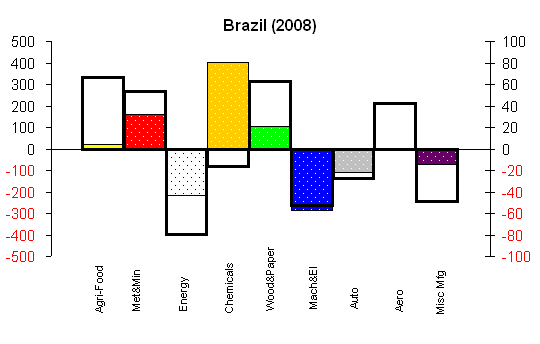
Black outlines represent global benchmarks (right axis). Coloured bars are specific to the country (left axis).
Normalized Revealed Comparative Advantage in Brazil - Text Alternative
The figure depicts Normalized Revealed Comparative Advantage (NRCA) for Canadian exports to Brazil in 2008 by major sectors. In comparison to Canadian export performance to the World excluding the US, Canadian exports to Brazil over-performs (better than average) in the Agri-food, Metals & minerals, Chemicals, Auto, Miscellanous manufactures sectors; under-performs (worse than average) in the Energy, Wood & paper, Machinery & electrical and Aero sectors.
Sources: UN Comtrade database and World Trade Atlas
Normalized Revealed Comparative Advantage (NRCA) in Venezuela (2008)
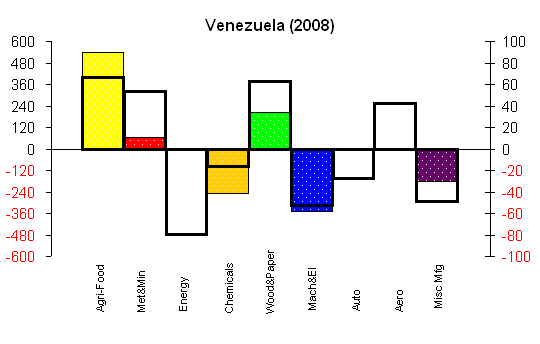
Black outlines represent global benchmarks (right axis). Coloured bars are specific to the country (left axis).
Normalized Revealed Comparative Advantage in Venezuela - Text Alternative
The figure depicts Normalized Revealed Comparative Advantage (NRCA) for Canadian exports to Venezuela in 2008 by major sectors. In comparison to Canadian export performance to the World excluding the US, Canadian exports to Venezuela over-performs (better than average) in the Agri-food, Energy, Auto and Miscellanous manufactures sectors; under-performs (worse than average) in the Metals & minerals, Chemicals, Wood & paper, Machinery & electrical and Aero sectors; and performs on par in the XXX sector.
Sources: UN Comtrade database and World Trade Atlas
Normalized Revealed Comparative Advantage (NRCA) in Colombia (2008)
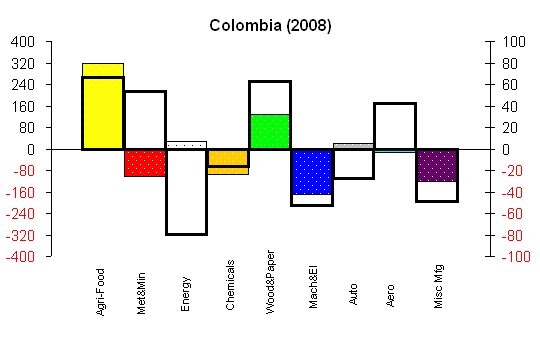
Black outlines represent global benchmarks (right axis). Coloured bars are specific to the country (left axis).
Normalized Revealed Comparative Advantage in Colombia - Text Alternative
The figure depicts Normalized Revealed Comparative Advantage (NRCA) for Canadian exports to Colombia in 2008 by major sectors. In comparison to Canadian export performance to the World excluding the US, Canadian exports to Colombia over-performs (better than average) in the Agri-food, Energy, Machinery & electrical, Auto and Miscellanous manufactures sectors; under-performs (worse than average) in the Metals & minerals, Chemicals, Wood & paper and Aero sectors.
Sources: UN Comtrade database and World Trade Atlas
Increased engagement in the Americas is a priority for the Government of Canada. The gravity model has shown some under-exporting to the region as a whole, particularly to Brazil. Although there is strong variation across surveyed countries, we noted some general patterns of comparative advantage in the region. We examined in detail Canadian exports to four key LAC countries: Mexico, Brazil, Venezuela and Colombia.
Common Themes
- Canadian exports to Brazil feature a pattern of competitiveness that is distinct from other LAC countries surveyed. Its highlights are over-trading in chemicals (primarily fertilizers) and under-trading in the agri-food sector relative to our global comparative advantage.
- For the other three countries, the agri-food sector in the LAC region is very competitive, even compared to strong Canadian global performance. This is driven by the advantage in cereals and seeds (including canola) and vegetables and pulses.
- With the exception of Brazil, the chemicals sector is on par or under-exporting compared with the global pattern (especially in Venezuela). Negative competitiveness in this area persists despite the competitiveness of fertilizers in Mexico and Colombia, where these are in the top 10.
- Metals and minerals are under-traded to all countries, but still show positive comparative advantage, except in Colombia. The types of minerals and metals exported vary according to country.
- Energy is somewhat over-exported to these markets, especially to Colombia.
- Wood and paper exports have less of an advantage than globally, especially in Mexico.
- With the exception of brazil, automotive products are over-exported considerably, especially to mexico. aerospace products are under-exported, although less so to mexico.
- Miscellaneous manufactured products appear to be less disadvantaged in Brazil than in the rest of LAC or globally.
2.1 Mexico
Key Over-Exports
- Automotive products
- Iron and steel and their products
- Other chemical industry products
- Construction, mining, lifting machinery
Key Under-Exports
- Power-generating machinery
- Inorganic chemicals (including uranium)
- Nickel and articles thereof
- Ores and concentrates
Mexico is Canada's second-largest merchandise export destination in the emerging markets, and our fifth-largest commercial partner worldwide in terms of merchandise trade.
Canadian exports to Mexico display considerable variability from the global patterns at the detailed level. Metals and minerals exports are characterized by a large advantage in iron, steel and their products (+46 above benchmark); however, under-exports in nickel and articles thereof (-13) and ores and concentrates (-13) lead to overall under-exports in this sector. Our performance in the machinery and electrical equipment sector displays a similar dichotomy—while construction machinery is over-exported (+13), power-generating machinery is under-exported (-35), resulting in overall exports being below the global benchmark. Near-benchmark performance in chemicals masks over-exports of certain commodities, e.g. other chemical industry products (+36), and under-exports of inorganic chemicals (-25).
The automotive sector (an area where Canada is generally not competitive globally) performs strongly in Mexico (+49 above benchmark) due to North American integration. At the commodity level, automotive products rank second out of 53 CTC commodities, but have seen a decline in their advantage in recent years. The aerospace sector is generally underperforming in the countries under analysis in the LAC region, but in Mexico it ranks third out of 53 commodities (considerably higher than before 2008).
2.2 Brazil
Key Over-Exports
- Fertilizers
- Sulfur, salt and minerals
- Paper and print
- Meat, fish, animals and their products
Key Under-Exports
- Power-generating machinery
- Ores and concentrates
- Inorganic chemicals (including uranium)
- Wood and wood pulp
Brazil is Canada's third-largest merchandise export market among emerging countries and the largest economy in the region.
In Brazil, the agri-food sector is severely under-exporting relative to the global benchmark, posting an NRCA of practically zero. This is primarily due to the weak exports of meat, fish, animals and their products (-25 under benchmark). An unusually high comparative advantage is shown in the chemicals sector, which in combination with the negative benchmark leads to large over-exports. Over-exporting occurs primarily for fertilizers (+6), although inorganic chemicals are under-exported (-27). The advantage in fertilizers has grown tremendously over last eight years; in 2000 it was negative.
By contrast, in 2000 Canada was competitive in the machinery and electrical equipment sector in Brazil. In 2008, however, this was an area of disadvantage close to the global benchmark, partly due to the under-exports of power-generating machinery (-35). In the metals and minerals sector, sulphur, salt and minerals were over-exported to Brazil (+12) ,but ores and concentrates were under-exported (-32). Competitiveness in the wood and paper sector trailed our performance in the rest of the world yet displayed a mixed picture: paper and print were over-exported (+8) while wood and wood pulp were under-exported (-16).
Some other commodities that show over-trading include: ships and boats, furniture and bedding, miscellaneous (non-medical/optical) scientific instruments, all in the miscellaneous manufacturing sector while the aerospace sector is under-exporting considerably.
2.3 Venezuela
Key Over-Exports
- Fruit and vegetable preparations
- Paper and print
- Energy
Key Under-Exports
- Power-generating machinery
- Fertilizers
- Inorganic chemicals (including uranium)
- Wood and wood pulp
Venezuela is our biggest market for cereals in the Western hemisphere after the United States. It ranks 11th among emerging countries as a destination for Canadian merchandise exports.
In the agri-food sector, our cereals exports dominate, as expected, but it is the high competitiveness of fruit and vegetable preparations (+17) that is interesting. The Canadian energy sector seems to be over-exporting to Venezuela as well (+31). Overall metals and minerals performance is lower than the benchmark, partly based on nickel under-exports (-6). Paper and print is over-exported (+9), but under-exports of wood and wood pulp cause the wood and paper sector to under-export overall. Under-exports of fertilizers (-24) and inorganic chemicals (-18) are behind the weaker chemicals performance, while under-exporting power generating machinery (-25) does not prevent overall exports in the machinery and electrical equipment sector from being on par with the global benchmark.
Competitiveness in the aerospace and automotive sectors is around zero, indicating a better-than-par automotive performance and a below-par performance in aerospace. However, between 2000 and 2005, Canadian automotive exports were an area of considerably greater advantage than in 2008. Railway stock and parts and miscellaneous (non-medical/optical) scientific instruments have performed better than expected in the miscellaneous manufacturing sector.
2.4 Colombia
Key Over-Exports
- Energy
- Automotive products
- Copper and articles thereof
- Paper and print
- Dairy, eggs and honey
Key Under-Exports
- Aerospace
- Aluminum
- Inorganic chemicals (including uranium)
- Wood and wood pulp
- Ores and concentrates
Colombia ranks 18th as a destination among the emerging countries for Canadian merchandise exports.
In the agri-food sector in Colombia, we noted that dairy, eggs and honey, an area of global export disadvantage, ranks among our top 10 competitive exports (+20), although sector competitiveness over time is declining. Among metals and minerals, copper exports to Colombia display very high competitiveness (+37) compared to our global performance. However, the sector as a whole was in an unusual position of competitive disadvantage, with aluminum (-23) and ores and concentrates (-13) in particular under-exporting. Energy was over-exported (+46) and so were automotive products (+43). Competitiveness in chemicals has been rising over time, but still remained at a disadvantage in 2008; under-exports in this area are partly due to inorganic chemicals (-25). This is offset by the declining competitiveness in wood and paper, underscored by weaker wood and wood pulp exports (-31).
3. Emerging Europe
Eastern Europe and the CIS are here classified together as "emerging Europe", although the countries in this grouping display marked differences. These differences, combined with their quickly evolving economies, make it difficult to generalize about the countries in this region. The two countries selected for consideration in this region are Russia and Türkiye. Emerging Europe is an area of relative under-trading according to the gravity analysis.
Common Themes
- The agri-food sector displays very strong competitiveness in both countries.
- The machinery and electrical equipment sector is performing much better in Russia than globally.
- The relative sector performance in Türkiye is very close to Canadian global pattern.
3.1 Russia
Key Over-Exports
- Agri-food machinery
- Construction, mining, lifting machinery
- Ships and boats
- Other machinery
- Meat, fish, animals and their products
Key Under-Exports
- Paper and print
- Inorganic chemicals (including uranium)
- Aluminum
- Ores and concentrates
- Vegetables and pulses
Russia is the fifth-largest destination market for Canadian merchandise among emerging countries. It is a key market for Canadian meat exporters (mainly pork).
In Russia, the over-exports in our agri-food sector are driven by massive meat exports (+5), and to a lesser extent by cereals and seeds. Vegetables and pulses were under-exported (-28). The metals and minerals sector is under-exporting to Russia, where none of the traditional commodities of comparative advantage such as nickel (-8), aluminum (-17) or ores and concentrates (-28) are in the top 10. This is probably because of the abundant local supplies of these commodities, yet overall there seems to be an import market in Russia for metals and minerals in which Canada is not a major participant. In the wood and paper sector, we are also at a comparative disadvantage in Russia: although our wood and wood pulp exports are in the top 10, the paper and print category is a significant under-exporter (-36).
Normalized Revealed Comparative Advantage (NRCA) in Russia (2008)
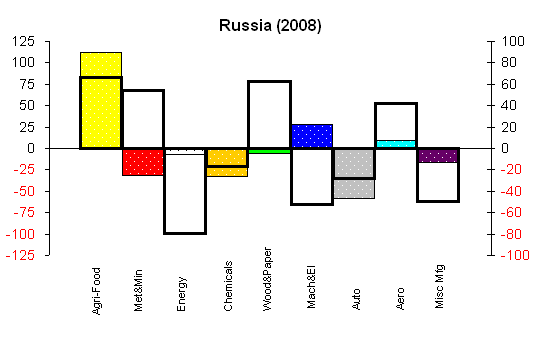
Black outlines represent global benchmarks (right axis). Coloured bars are specific to the country (left axis).
Normalized Revealed Comparative Advantage in Russia - Text Alternative
The figure depicts Normalized Revealed Comparative Advantage (NRCA) for Canadian exports to Russia in 2008 by major sectors. In comparison to Canadian export performance to the World excluding the US, Canadian exports to Russia over-performs (better than average) in the Agri-food, Energy, Machinery & electrical and Miscellanous manufactures sectors; under-performs (worse than average) in the Metals & minerals, Chemicals, Wood & paper, Auto and Aero sectors.
Sources: UN Comtrade database and World Trade Atlas
Normalized Revealed Comparative Advantage (NRCA) in Türkiye (2008)
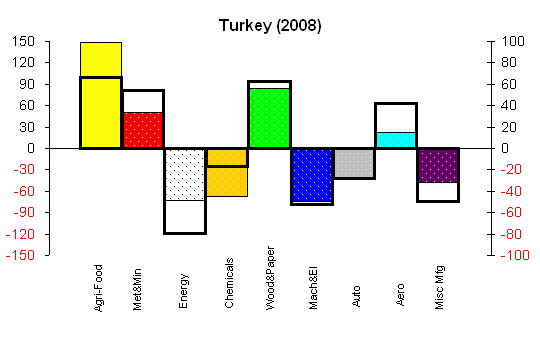
Black outlines represent global benchmarks (right axis). Coloured bars are specific to the country (left axis).
Normalized Revealed Comparative Advantage in Türkiye - Text Alternative
The figure depicts Normalized Revealed Comparative Advantage (NRCA) for Canadian exports to Türkiye in 2008 by major sectors. In comparison to Canadian export performance to the World excluding the US, Canadian exports to Türkiye over-performs (better than average) in the Agri-food, Energy, Machinery & electrical and Miscellanous manufactures sectors; under-performs (worse than average) in the Metals & minerals, Chemicals, Wood & paper and Aero sectors; and performs on par in the Auto sector.
Sources: UN Comtrade database and World Trade Atlas
In contrast, the performance of the machinery and electrical equipment sector yields important insights. This area of traditional disadvantage for Canadian exporters is booming in Russia, due to strong competitiveness in agri-food machinery (+18), construction, mining and lifting machinery (+15), and other machinery (+29). The positive performance of our miscellaneous manufacturing sector—especially ships and boats, furniture and bedding and certain scientific instruments – shows that there are further lessons to learn from Canadian performance in the Russian market. This advantage, however, has been declining since 2002, as it has in the automotive sector.
3.2 Türkiye
Key Over-Exports
- Vegetables, pulses and plants
- Iron and steel and their products
- Pharmaceutical products
- Copper and articles thereof
Key Under-Exports
- Precious stones and metals
- Power-generating machinery
- Aluminum
- Fertilizers
Türkiye ranks eighth among emerging countries as a destination for Canadian merchandise exports. It was the third-largest destination for Canadian iron and steel exports in 2008 after the United States and Mexico.
Türkiye is perhaps the most representative country of the overall Canadian pattern of global comparative advantage among the 15 countries considered. Strengths and weaknesses of Canadian exports in Türkiye roughly correspond to global patterns, with small differences. Metals and minerals are performing somewhat worse—precious stones and metals are under-exported at (-35) along with aluminum (-29) although iron and steel and their products, and copper and articles are over-exported—while agri-food, dominated by vegetables and pulses (+9), and energy are performing somewhat better.
Although pharmaceutical products are over-exported (+16), weakness in fertilizers (-31) and inorganic chemicals (-27) makes chemicals an under-exported sector. Power-generating machinery is under-exported (-39), leaving the machinery and electrical equipment sector on par with the global benchmark.
4. Africa
Africa consists predominantly of developing rather than emerging economies. South Africa and Algeria were selected for this analysis because they represent our largest export markets in Africa. The pattern of competitiveness in these countries not only differs from the rest of Africa, but also from each other: their economic structures are dissimilar and they are located at opposite corners of the continent. The gravity analysis has shown considerable over-trading with Africa as a whole, in particular with Algeria.
Normalized Revealed Comparative Advantage (NRCA) in South Africa (2008)
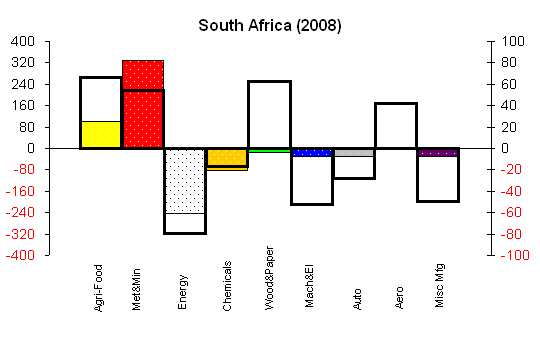
Black outlines represent global benchmarks (right axis). Coloured bars are specific to the country (left axis).
Normalized Revealed Comparative Advantage in South Africa - Text Alternative
The figure depicts Normalized Revealed Comparative Advantage (NRCA) for Canadian exports to South Africa in 2008 by major sectors. In comparison to Canadian export performance to the World excluding the US, Canadian exports to South Africa over-performs (better than average) in the Metals & minerals, Energy, Machinery & electrical, Auto and Miscellanous manufactures sectors; under-performs (worse than average) in the Agri-food, Chemicals, Wood & paper and Aero sectors.
Sources: UN Comtrade database and World Trade Atlas
Normalized Revealed Comparative Advantage (NRCA) in Algeria (2007)
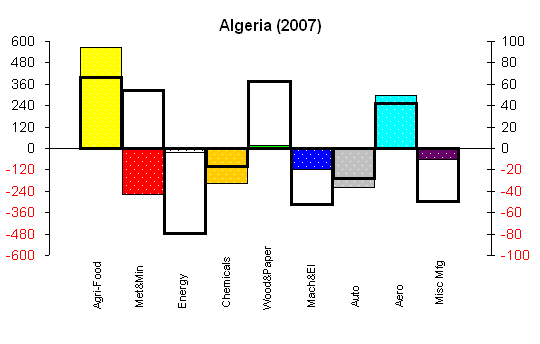
Black outlines represent global benchmarks (right axis). Coloured bars are specific to the country (left axis).
Normalized Revealed Comparative Advantage in Algeria - Text Alternative
The figure depicts Normalized Revealed Comparative Advantage (NRCA) for Canadian exports to Algeria in 2007 by major sectors. In comparison to Canadian export performance to the World excluding the US, Canadian exports to Algeria over-performs (better than average) in the Agri-food, Energy, Machinery & electrical, Aero and Miscellanous manufactures sectors; under-performs (worse than average) in the Metals & minerals, Chemicals, Wood & paper and Auto sectors.
Sources: UN Comtrade database and World Trade Atlas
Common Themes
- Canada severely under-exports wood and paper to both countries.
- Exports of chemicals to both countries are close to the global benchmark.
- Miscellaneous manufacturing is less disadvantaged in both countries than globally.
- Machinery and electrical equipment is over-exported as well, particularly to South Africa.
- Other manufacturing sectors perform above the global benchmark: automotive exports do better in South Africa and aerospace exports do better in Algeria.
4.1 South Africa
Key Over-Exports
- Sulfur, salts and minerals
- Precious stones and metals
- Construction, mining, lifting machinery
- ICT scientific instruments
Key Under-Exports
- Fertilizers
- Inorganic chemicals (including uranium)
- Paper and print
- Ores and concentrates
South Africa is the tenth-largest destination among emerging markets for our merchandise exports, and our largest export market in Africa.
The export advantage in metals and minerals is driven by over-exports in sulphur, salts and minerals (+13) and precious stones and metals (+10), in spite of under-exports in ores and concentrates (-23). Very high competitiveness here is, however, a recent development: an impressive increase in 2008 could be partly due to commodity price increases. Although the agri-food sector as a whole is below the global benchmark, there may be lessons to learn from the export performance of miscellaneous food (+15). Wood and paper may be a sector of unexploited opportunities in South Africa, as indicated by under-exporting in paper and print (-33) and wood and wood pulp (-20), but there may be lessons to learn in the machinery and electrical equipment sector (construction, mining and lifting machinery is over-exported at +14 over par), as well as miscellaneous manufacturing (ICT scientific instruments are over-exported at +21, miscellaneous non-medical/optical scientific instruments at +6 and both are among the top 10 in NRCA locally). Although fertilizers (-36) and inorganic chemicals (-33) are under-exported, under-trading is not a feature of the chemicals sector as whole.
4.2 Algeria
Key Over-Exports
- Vegetables, pulses and plants
- ICT electrical and electronic equip.
- Electric power-generating equip.
- Construction, mining, lifting machinery
Key Under-Exports
- Wood and wood pulp
- Power-generating machinery
- Meat, fish, animals and their products
- Inorganic chemicals (including uranium)
Algeria is Canada's leading commercial partner in Africa (and tenth in the world) in terms of merchandise trade, and a key source of imports (primarily crude oil). Algeria ranks twelfth as a destination for Canadian exports among emerging countries, and second in Africa.
In Algeria, the pattern of over-exporting in the agri-food sector is driven by large exports of cereals and seeds (+1, first in competitiveness overall) and vegetables and pulses (+7, third overall), although meat, fish, live animals and their products are under-exported (-26). Canada's advantage declined in this sector between 2000 and 2005. The aerospace sector is the other area of recent high competitiveness (ranking second overall), although this may only be a temporary spike (a 2007 development). Metals and minerals and wood and paper products are severely under-exported relative to the global pattern, driven largely by aluminum (-16) and wood and wood pulp (-45). Under-exporting in inorganic chemicals (-18) is behind slightly weaker-than-expected chemicals exports.
Some lessons may be learned from the high performers in the machinery and electrical equipment sector (3 of which are in the local top 10), particularly in areas where Canadian competitiveness is generally negative: ICT electrical and electronic equipment (+43), and electric power-generating equipment (+33). Construction, mining and lifting machinery (+10) is also over-exporting and is among top 10 competitive commodities – yet power-generating machinery is underperforming (-36).
5. Middle East
The Middle East offers as many challenges as it does opportunities. Countries in this region differ considerably in their economic structure from the neighbouring regions. There are also internal differences depending on whether an economy is oil-dominated, such as the United Arab Emirates (UAE) and Saudi Arabia, or not, for example, Egypt. These three countries are selected for our analysis.
Common Themes
- The agri-food sector demonstrates good overall performance, with small over-exports to the UAE and small under-exports to Egypt.
- The metals and minerals sector significantly under-exports to the two oil-based economies, but not to Egypt. The Canadian commodities making up this sector are globally competitive but nearly absent from the UAE's and Saudi Arabia's top 10.
- Due to small local import markets for energy, and their composition, Canada's energy exports perform better in this region than the global benchmark, although Canadian export volumes are very small.
- The wood and paper sector under-exports slightly to the oil-based economies.
- Some manufacturing sectors are doing very well. Automotive exports to Saudi Arabia are extremely competitive, and yet these flows are not matched by Canadian export data61. Aerospace products are over-exported to UAE. Some miscellaneous manufacturing components perform very well in the UAE and Egypt, leading to over-exports to those destinations.
5.1 United Arab Emirates (UAE)
Key Over-Exports
- Furniture and bedding
- Other machinery
- Metallurgy and machine tools
- ICT scientific instruments
- Miscellaneous food
Key Under-Exports
- Precious stones and metals
- Aluminum
- Inorganic chemicals (including uranium)
- Meat, fish, animals and their products
- Power-generating machinery
The UAE is the sixth-largest destination for our merchandise exports among the emerging markets.
The highlight of Canadian export performance in the UAE is the agri-food sector, over-exporting on the strength of cereals, vegetables and pulses, as well as the less traditional area of miscellaneous food (+16). The aerospace sector is also very competitive (second out of 53), on par with our global performance but in contrast to our performance in most emerging markets. Although the chemicals sector as a whole is not an area of competitive advantage, pharmaceutical products are in the top 10 in competitiveness, even though inorganic chemicals are under-exporting at (-32). Furniture and bedding (+28) along with ICT scientific instruments (+19) drives Canada's over-exports in miscellaneous manufacturing.
Normalized Revealed Comparative Advantage (NRCA) in Egypt (2008)
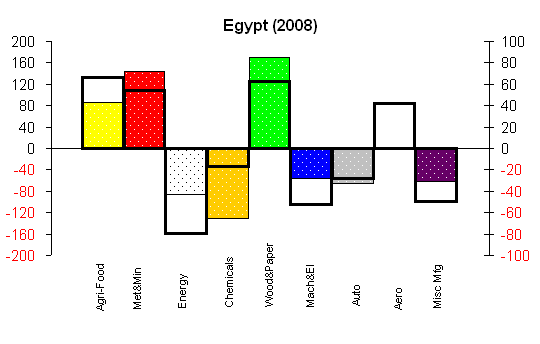
Black outlines represent global benchmarks (right axis). Coloured bars are specific to the country (left axis).
Normalized Revealed Comparative Advantage in Egypt - Text Alternative
The figure illustrates the Normalized Revealed Comparative Advantage (SCA) of Canadian exports to Egypt in 2008, by major sector. Compared to Canada's export performance to the world (excluding the United States), Canadian exports to Egypt outperform (above average) in the metals and minerals, energy, wood and paper, machinery and electrical equipment and various manufactured products; however, they are underperforming (below average) in the agri-food, chemicals, automotive and aerospace sectors.
Sources: UN Comtrade database and World Trade Atlas
Normalized Revealed Comparative Advantage (NRCA) in the United Arab Emirates (UAE, 2006)
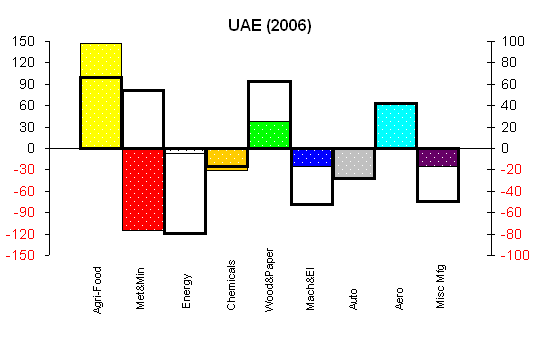
Black outlines represent global benchmarks (right axis). Coloured bars are specific to the country (left axis).
Normalized Revealed Comparative Advantage in the United Arab Emirates - Text Alternative
The figure depicts Normalized Revealed Comparative Advantage (NRCA) for Canadian exports to United Arab Emirates (UAE) in 2006 by major sectors. In comparison to Canadian export performance to the World excluding the US, Canadian exports to UAE over-performs (better than average) in the Agri-food, Energy, Machinery & electrical and Miscellanous manufactures sectors; under-performs (worse than average) in the Metals & minerals, Chemicals and Wood & paper sectors; and performs on par in the Auto and Aero sectors.
Sources: UN Comtrade database and World Trade Atlas
Normalized Revealed Comparative Advantage (NRCA) in Saudi Arabia (2007)
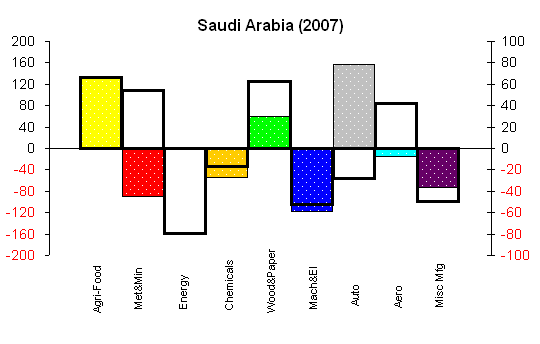
Black outlines represent global benchmarks (right axis). Coloured bars are specific to the country (left axis).
Normalized Revealed Comparative Advantage in Saudi Arabia - Text Alternative
The figure depicts Normalized Revealed Comparative Advantage (NRCA) for Canadian exports to Saudi Arabia in 2007 by major sectors. In comparison to Canadian export performance to the World excluding the US, Canadian exports to Saudi Arabia over-performs (better than average) in the Energy, Auto and Miscellanous manufactures sectors; under-performs (worse than average) in the Metals & minerals, Chemicals, Wood & paper, Machinery & electrical and Aero sectors; and performs on par in the Agri-food sector.
Sources: UN Comtrade database and World Trade Atlas
Canadian exports of machinery and electrical equipment are performing better in the UAE than globally, although this advantage has declined since 2002. Over-exports include metallurgy and machine tools (+21) and other machinery (+25), while under-exports include power-generating machinery (-26). The metals and minerals sector remains a sector of possible opportunity, with considerable under-exports in precious stones and metals (-38) and aluminum (-30).
5.2 Saudi Arabia
Key Over-Exports
- Automotive products
- Fruit and vegetable preparations
- Miscellaneous food
- Pharmaceutical products
- Precious stones and metals
Key Under-Exports
- Meat, fish, animal and their products
- Aerospace
- Aluminum
- Power-generating machinery
- Precious stones and metals
Saudi Arabia is Canada's largest partner in the region in terms of bilateral merchandise trade, and ranks ninth among emerging countries as a destination for Canadian exports.
The striking feature of Canadian export competitiveness in Saudi Arabia is the large advantage in the automotive sector (ranks 2nd, +49 over par in a 53-commodity list). Moreover, Saudi automotive imports do not seem to be reflected in the Canadian data (export levels as reported by Statistics Canada are considerably lower). This situation is particularly unusual outside the North American continent. The agri-food sector shows competitiveness on par with the global benchmark, but surprisingly, it is a very recent development as NRCA in this sector was negative prior to 2006. Within the sector, fruit and vegetable preparations and miscellaneous food are over-exported (both +16). Under-exporting in the metals and minerals sector is driven by aluminum (-29) and precious stones and metals (-23). As in the UAE, pharmaceutical products rank ninth among 53 commodities (+16). Power-generating machinery is the key under-exporter (-32) in the machinery and electrical equipment sector.
5.3 Egypt
Key Over-Exports
- Iron and steel and their products
- Paper and print
- Dairy, eggs and honey
- Ships and boats
Key Under-Exports
- Precious stones and metals
- Meat, fish, animals and their products
- Aluminum
- Inorganic chemicals (including uranium)
Egypt is a key country in the region, linking Africa and the Middle East, and exercising considerable influence in both regions. It ranks 19th among emerging countries as a destination for Canadian merchandise exports.
The broad competitiveness pattern in Egypt is similar to the global picture, except for the under-exporting in the aerospace sector (-7). However, the metals and minerals sector, while showing positive comparative advantage in 2008, i.e., over-exporting, had been consistently negative over 2000-07. The positive 2008 performance was due to a sharp increase in Egyptian imports of Canadian iron and steel and their products, which ranked first among 53 commodities (+49). This performance was somewhat offset by under-exporting of precious stones and metals (-31) and aluminum (-19).
Our performance in the agri-food sector is on par with the global benchmark, although it is interesting that the dairy, eggs and honey commodity group (an area of disadvantage for Canadian exporters) is among the top 10 in competitiveness (+22). Meat, fish, animals and their products are under-exported (-34). Strong competitiveness in the wood and paper sector is driven by paper and newsprint (+9). Chemicals are under-exported, partly due to the under-exporting of inorganic chemicals (-17) and fertilizers (-15). The miscellaneous manufacturing sector, although barely over-exporting overall, is an area of interest due to the good export performance in ships and boats, as well as miscellaneous (non-medical/optical) scientific instruments.
Conclusions
Increasing globalization and integration of the world economy is the principal force behind the observed economic rise of the emerging world. The increasing exchange of information and ideas, goods and services, and capital and labour produces many challenges—yet it also produces unprecedented wealth for hundreds of millions in these emerging nations. Their road to prosperity will not be easy—there will be crises, like the current one, that will test the resolve of these nations and their governments to stay the course. Strong foundations for stable, long-term growth will have to be developed, the chief challenge being the progress from input-based and export-based models to a sustained technology-based growth, as it is here that the greatest potential for convergence with the developed world's income and productivity lies. Economists predict that as long as the conditions for sustained growth remain in place (integrated global markets, good governance, macroeconomic stability and sufficiently high saving and, most important, investment rates), the emerging world will continue to catch up with the advanced economies in per capita income, with benefits to both sides.
Sustained growth in these markets will increase their importance for Canada. In BRIC countries alone, a gain of just 0.1 percent in Canadian market share in 2038 would mean a $29 billion gain in exports. To achieve these gains and more, it is important to establish an early foothold for Canadian goods and services in the emerging world. Canada's geographical position in this regard is not thought to be the most advantageous. Yet in spite of that, a gravity model of Canadian exports produces a surprising result: Canada exports 42 percent more on average to emerging and developing economies than to the developed countries, after adjusting for the main variables that explain trade flows (economic size, distance, price levels, language and trade agreements). Over and above this, some countries and regions show surprisingly high results—merchandise exports to the crucial East Asian market are more than double the expected exports, and nearly 50 percent higher to Africa. On the other hand, Canada under-exports to Eastern Europe, South Asia and Latin America. Among the BRIC countries, Canada over-exports to China but under-exports to the other three, particularly to India.
Applying the concept of comparative advantage creates a framework for the evaluation of Canadian export performance vis-à-vis our global competitiveness in specific sectors. This is of particular interest with regard to emerging markets as sustained growth usually leads to a movement up the value chain, and hence implies ongoing changes in the mix of traded merchandise.
The data show that in the U.S. market our comparative advantage pattern is characterized primarily by advantages in the automotive, wood and paper, and energy sectors. Outside the U.S. market our advantage in the agri-food, metals and minerals and aerospace sectors is significantly stronger, but we are at a disadvantage in the energy and automotive sectors. Our exports of machinery and electrical equipment and miscellaneous manufactured products are revealed to be at a relative disadvantage in both the world and the non-U.S. markets.
However, we find that the majority of the advanced manufacturing sectors are over-exporting to the largest emerging-market destinations relative to our global benchmark. The miscellaneous manufacturing and automotive products sectors do markedly better in these markets, and in most cases the machinery and electrical equipment sector does as well. Aerospace is the only sector that generally under-exports to these destinations, due to our strong performance in advanced economies (Western Europe) and consequently higher global benchmark in this area; among commodities, this is also the case for power generating machinery. Thus while resource-related sectors (agri-food, wood and paper and metals and minerals) account for most of our exports to emerging markets, Canadian manufacturing exports to these destinations are performing above par. This suggests that the emerging markets will play an important role in the future of the Canadian manufacturing sector.
The analysis also suggests insights and hypotheses of interest at the country level. For example, we learn that our chemicals sector is doing unusually well in China (mainly due to organic chemicals and fertilizers), and that while India seems to prefer to get its metals and minerals elsewhere, Canadian agri-food is extremely competitive there. Going more deeply, an unusually large Canadian disadvantage in machinery and electrical equipment in Malaysia reminds us that Malaysia is a large assembly hub for this equipment, and highlights Canada's limited participation in this trade. A conspicuous weakness of our agri-food exports to Brazil, on the other hand, may imply local self-sufficiency, or perhaps better-placed alternative suppliers such as Argentina. Finally, examining the time patterns of Canadian sectoral competitiveness in China, we can reflect upon our decreasing competitiveness in the aerospace and automotive sectors vis-à-vis our growing competitiveness in metals and minerals. This adds to the evidence that China is moving up the value chain in this sector, electing to build its own airplanes and automobiles, and procuring Canadian raw materials instead. While some of the proposed interpretations are only hypotheses, they may be validated with a detailed analysis of a specific market. The main value of the comparative advantage framework is that it suggests and guides the analysis of market opportunities on the basis of economic evidence.
Taken farther, the comparative advantage framework could also shed light on the reasons behind the under/over-exporting at the country level identified in the gravity model. Further work in the gravity model framework could also seek to explain why Canada exports more to emerging markets in aggregate than the model developed in this paper predicts. One possible explanation is that Canadian exporters have been forward-looking in recognizing the potential of the emerging markets and taking their expected future growth into account. Another explanation would emphasize the role of the product mix, and point out that emerging markets are voracious consumers of raw materials and resources. As Canada enjoys a comparative advantage in many of those, it is in a good position to supply them62. A more structured gravity model can help explain the differences in Canadian exports between countries, while detailed country studies using the suggested framework of comparative advantage could determine which of the export sectors are responsible for the overall country result and suggest trade expansion opportunities.
33. Consider that establishing a trans-Pacific communication line cost $73,000 in 1975, $2,000 in 1996 and $200 in 1999 ("The Internet and Latin America," Rockefeller Center for Latin American Studies, 1999). Communication now is nearly instant and costs under $0.02 a minute; Philip II of Spain, the first trans-Atlantic manager, had to wait several months for a reply from the Americas.
34. Nominal GDP basis, Global Insight, March 2009.
35. Real GDP growth 1995-2008, Global Insight, March 2009. Canada also did well, growing by 47 percent over this period.
36. From 2,399 Mt in 1990 to 5,007 Mt in 2004; U.S. emissions grew 25% to 6,046 Mt in the same period. Human Development Report 2007/2008, UNDP.
37. Estimates by Paul Bairoch, "Economics and World History," University of Chicago Press, 1999.
38. The above points have also been made eloquently in Robert Lucas, "The Industrial Revolution: Past and Future," 2003 Annual Report Essay, FRB of Minneapolis.
39. This concept, known as conditional beta-convergence, has received strong support in the economic literature.
40. Global Insight, March 2009.
41. Human Development Report 1996. It goes on to add that "policy-makers are often mesmerized by the quantity of growth. They need to be more concerned with its structure and quality"
42. This passage from the World Bank 2008 Growth Commission Report is worth quoting in full: "[emerging markets] imported ideas, technology, and know-how from the rest of the world [and] exploited global demand, which provided a deep, elastic market for their goods. The inflow of knowledge dramatically increased the economy's productive potential; the global market provided the demand necessary to fulfill it. To put it very simply, they imported what the rest of the world knew, and exported what it wanted."
43. Barry Bosworth and Susan M. Collins, "The Empirics of Growth: An Update," The Brookings Institution.
44. World Bank, Doing Business 2009 Report. Note that Singapore is number one in this ranking.
45. Of course, emerging economies differ widely among themselves and assessing limits to growth should be done with care. For example, Brazil's urbanization ratio is 85 percent, higher than most advanced countries, so little growth is to be expected from that source; but China at 42 percent and India at 29 percent have the most to gain from engaging their rural population in more productive processes.
46. Note that data are from Brazil, Russia, India and China official statistical agencies. Trade figures were converted to Canadian dollars to conduct the analysis.
47. Growing regional trade among East Asian economies, particularly with China, is a contributing factor.
48. The choice of 0.1 percentage point allows this analysis to be scaled to larger increases or decreases proportionally. For example, the competitiveness effect of a fall in market share of 0.5 percentage points in China ($101.9 billion) would be five times as great as that of a 0.1-percent decrease ($20.4 billion).
49. Total gains depend on the dynamic path of the market share increase.
50. Analysis of trade flows by sector could shed more light on the issue, allowing for the separation of commodities and advanced industrial products which likely follow different trade patterns.
51. The Balassa index (BRCA) was first developed to measure RCA in 1965. See Balassa (1965), "Trade liberalisation and revealed comparative advantage," Manch Sch Econ Soc Sci 33:99-123.
52. This Ricardian concept would be very poor at explaining modern trade between advanced nations. However, it is still a plausible simplification for countries that are very different (as is the case for Canada's trade with emerging markets). Note also that in the presence of trade barriers and trade costs, RCA is more accurately interpreted as measuring the competitiveness of a country's export industry against a competitor in a given market rather than the pure underlying comparative advantage—and this is exactly what we intended to measure.
53. Yu, Cai and Lung (2009), "The normalized revealed comparative advantage index," The Annals of Regional Science Vol. 43, No.1.
54. Note: NRCA is a symmetric index and the sum of NRCA indices across all trading sectors of a country always equals zero.
55. As we are analyzing total world trade by HS commodity, the latest year of available data with sufficient global coverage is 2006. This base year should be borne in mind when we compare these benchmarks to individual country results (most of which are available for 2008), but is not expected to invalidate these comparisons. NRCA results differ slightly from year to year, as the analysis over the 2000- 006 period shows. However, changes are usually small and occur around the middle of the distribution, for products with moderate (positive or negative) advantage.
56. Advantage in metals and minerals dates from 2006 only.
57. However, due to the volume of information, we will only refer to these results in the text. These are available for individual countries of interest upon request.
58. Country data sources and classifications differ slightly across countries and regions. Import data sources and classifications for NRCA analysis are as follows: UN Comtrade (World–HS1996; UAE–HS2002; Algeria, Egypt, Saudi Arabia–HS2007); domestic statistical agencies through World Trade Atlas (China, India, Indonesia, Malaysia, Mexico, Brazil, Venezuela, Colombia, Russia, Türkiye, South Africa–HS 2007).
59. A theoretically optimal Ricardian trading pattern would show high variance from sector to sector, indicating a skilful exploitation of advantage in some sectors combined with an avoidance of involvement in others. In practice, some levelling of this pattern is bound to occur due to product differentiation and other motivations for trade.
60. Tracking rank movements supplements the examination of charts, because the two patterns are not directly numerically comparable (different axes on the charts are used to represent approximate relative magnitudes).
61.This is likely due to their transhipment through the U.S. and incorrect destination reported in the data.
62.This naturally begs the question whether higher trade with emerging markets could be primarily due to high commodity prices, given that the gravity results are reported for 2007. However, sensitivity tests show similar results in other years (2000 to 2006).
- Date modified: