
Archived information
Information identified as archived is provided for reference, research or recordkeeping purposes. It is not subject to the Government of Canada Web Standards and has not been altered or updated since it was archived. Please contact us to request a format other than those available.
The Canadian Trade Commissioner Service and exporter performance (2010)
1. Overview
Until very recently, little was known about the characteristics and dynamics of the population of Canadian exporting firms. With the availability of Statistics Canada’s Exporter Register that links Canadian international trade transactions to longitudinal data on Canadian firms, it is now possible to examine the performance of Canadian exporters in a number of new dimensions. The data set also allows links to be made between exporter performance and assistance received from the Canadian Trade Commissioner Service (TCS), the Government of Canada’s export promotion service.
This feature article presents the firstever econometric assessment of the impact of the TCS on the export performance of Canadian firms: the results show this impact to be consistently positive. Indeed, exporters that received TCS assistance exported, on average, 18 percent more than comparable exporters that did not receive TCS assistance. The results also show that TCS assistance is effective in helping firms diversify into new markets: TCS clients export to 36 percent moremarkets than non-clients. In addition, the TCS has a positive impact on export product diversification.
The second part of this special feature explores exporter performance more generally and shows that it is the entry of firms into new markets, rather than growth in sales by existing exporters, that has been the growth engine for Canada’s export in recent years. New entrants drove the increase in exports to Asia and Latin America, and even in the U.S. market, the entry of new exporters was critical in offsetting the exit of many firms from this market.
Small and medium-sized enterprises (SMEs) have been at the forefront of firms entering new markets. Indeed, the share of every regional market held by Canadian SMEs has increased, and in Asia, SMEs account for nearly half of Canadian export sales.
2. The Impact of Trade Commissioner Services on Canadian Exporter Performance
Key Findings:
- Firms that access TCS services export on average 18 percent more than comparable firms that have not used these services.
- This means that every dollar spent on the TCS results in $27 dollars in increased exports.
- The TCS is also effective in assisting exporters to diversify their markets (TCS clients export to 36 percent more markets).
Recent international trade literature suggests that sunk costs associated withmarket entry are themain reason for low export market participation by domestic firms. In Canada, only 24 percent of Canadian manufacturers engaged in the export market (Baldwin and Gu, 2003). These sunk costs include the costs of obtaining market information for foreign countries, identifying foreign customers, finding reliable suppliers, developing distribution channels in foreign markets, dealing with the local regulations, learning how to adapt a product to local market conditions, andmany others. These costs must be borne to make export sales and are not recoverable if the attempt to export fails.
Recognizing that firms have to overcome additional costs to break into foreign markets, governments worldwide operate export promotion programs to assist their exporters. However, government intervention that encourages export market participation is appropriate only when there is market failure in providing information. Recently, Copeland (2008) sets out the case for trade and investment promotion policy. He argues that general information relevant for doing business abroad has many of the characteristics of a public good given that there are information spillovers, such that the success of single exporters can be imitated by other firms at a much lower cost. Such spillovers could result in under-investment in information, a market failure that would result in less exporting than is economically efficient.
Earlier empirical literature that evaluated the effectiveness of trade promotion programs had been focussedmainly on associating export promotion budgets with overall trade performance and had largely been carried out with aggregated data. The availability of firm-level data in recent years allows amore in-depth assessment, andmost of this literature shows a positive impact of trade promotion on export performance1. For instance, VolpeMartincus et al. (2008) report that the rate of export growth for assisted exporters was 17.0 percentage points higher than for non-assisted exporters.
TCS Clients: the data set for impact assessment
The impact of the TCS on Canadian exporter performance is assessed by linking the TCS client management data maintained by Foreign Affairs and International Trade Canada with Statistics Canada’s Exporter Register and Business Register. For each identified exporting firm, the combined dataset provides information on the trade promotion services the firm received, the firm’s merchandise exports by destination, and the firm’s key characteristics (size asmeasured by employment, length of time in business, length of export experience, sector, and productivity). The matched dataset covers the period from1999 to 20062. As the Exporter Register data is derived from customs documents, it includes only merchandise exports and excludes exports of services.
Figure 1
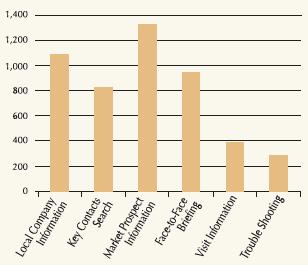
TCS Clients by Service Type (Annual Average)
Source: Statistics Canada’s Exporter and Business Register/ Authors’ calculations
Figure 1 Text Alternative
Figure 1 depicts the annual average number of TCS clients by service types: key contacts search: 1,091; local company information: 829; market prospect information: 1,333; face to face briefing: 946; visit information: 387; troubleshooting: 284.
On average, there were 5,747 TCS clients per year in the period of 1999 and 2006. About 60 percent of TCS clients were matched to Statistics Canada’s Business Register. Clients not matched to the Business Register would include: non-business entities such as business associations, universities, provincial and municipal governments and other federal departments; foreign firms targeted by the Invest in Canada program; and Canadian firms whose identifiers in the TCS clientmanagement systemare recorded differently than in the Business Register.
Of the TCS clientsmatched to the Business Register, approximately 65 percent (or 40 percent of all TCS clients) were matched to Statistics Canada’s Exporter Register. The remaining 35 percent of TCS clients in the Business Register would be firms receiving services for international commercial activities, such as export of services or investment abroad, that are not covered by the Exporter Register. They would also include firms preparing to export, as well as firms that are exporting but are not the exporter of record in customs documentation (for example, firms selling through a wholesaler).
With respect to the types of trade promotion services accessed by exporters, market prospect information and key contacts searches are the most frequently requested types of assistance, which suggests that information cost is the key obstacle to foreign market entry that firms are seeking to overcome with TCS assistance (See Figure 1).
For the period examined, 2,270 TCS clients were matched to the Exporter Register on average per year. This implies that only about 5 percent of the total population of Canadian merchandise exporters accessed TCS services. This coincides with survey work indicating a low level of awareness of the TCS within the Canadian business community.
Characteristics of firms who seek TCS assistance
In addition to allowing for program evaluation, the matching of the TCS clients to Statistic Canada’s Business and Exporter Registers allows for comparison of the TCS client population with the exporter population as a whole, to identify the profile of firms that are more likely to seek assistance.
SMEs comprise the vast majority of TCS clients. Over 50 percent of TCS clients are micro or small firms and some 30 percent are medium-sized firms.3 However, in the exporter population as a whole, only 3 percent of the micro-sized exporters use the TCS compared to almost 17 percent of the large-sized exporters. This means that the larger the firm, the more likely it is to seek TCS assistance (See Figure 2).
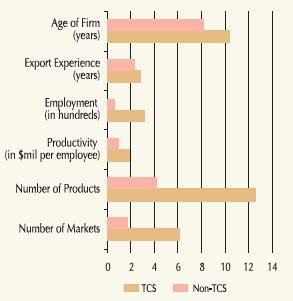
The likelihood that firms will seek TCS assistance also rises with the age of the firm (number of years in business), the number of markets it serves and the number of products it sells. TCS clients also have slightly higher productivity than the average exporter, and slightly more exporting experience (See Figure 3).
Figure 2
Propensity to Seek TCS Assistance by Firm Size

Source: Statistics Canada’s Exporter and Business Register/ Authors’ calculations
Figure 2 Text Alternative
Figure 2 depicts the propensity to seek TCS assistance by firm size; Micro 2.6, small 5.1, medium 7.4, large 16.8.
Figure 3
Characteristics of TCS and Non-TCS Exporters (Annual Average)
Source: Statistics Canada’s Exporter and Business Register/ Authors’ calculations
Figure 3 Text Alternative
Figure 3 depicts various characteristics of TCS assisted versus and non-TCS assisted exporters; the number of markets for TCS clients was 6.1 versus 1.8 for non-TCS exporters; the number of products for TCS clients was 12.6 versus 4.2 for non-TCS exporters; the productivity measure for TCS clients was 12.0 versus 11.8 for non-TCS exporters; the employment measure for TCS clients was 2.5 versus 1.8 for non-TCS exporters; the export experience measure for TCS clients was 2.8 versus 2.3 for non-TCS exporters; the average age of the firm for TCS clients was 10.4 versus 8.2 for non-TCS exporters.
Figure 4
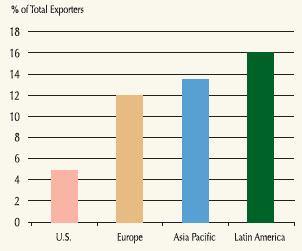
Distribution of TCS Clients by Region
Source: Statistics Canada’s Exporter and Business Register/ Authors’ calculations
Figure 4 Text Alternative
Figure 4 depicts the distribution (percent) of TCS clients by export destination; the U.S. 4.9, Europe 12.0, Asia Pacific 13.5 and Latin America 16.1.
Firms that export to non-U.S. markets rely more frequently on TCS assistance (See Figure 4). Only 5 percent of firms that exported to the U.S. market accessed TCS assistance, compared to 12 percent of those that exported to Europe, 13.5 percent of those that exported to Asia-Pacific and 16 percent of those that exported to Latin America. This confirms that market entry costs are higher for Canadian firms in non- U.S. markets, and therefore the incentive to lower these costs by accessing TCS assistance is greater.
Firms operating in the food and beverage and in the computer, electronic and electrical equipment sectors are more likely to seek TCS assistance. This suggests that for more differentiated products, TCS assistance is more valued. Table 1 shows the sectoral distribution of TCS clients and non-client exporters. The sectoral distribution of TCS client exporters was fairly stable in the sample years. The wholesale & retail and other services sectors had the largest number of exporters, but these firms were proportionately less likely to seek TCS assistance. Firms in these sectors would normally be providers of import/export services, acting as intermediaries for the goods producers.
Assessing the impact of the TCS: the methodology4
The average treatment effects method has been adopted as the empirical framework for the present analysis. This approach is an adaption of experimental trials that involve a treatment group and a randomly assigned control group. In the present case, exporters that received TCS assistance comprise the “treated” group. To be ascertained is whether exporters that received treatment perform better than comparable exporters that did not receive treatment, after con trolling for certain variables. Controlled variables include the following firmcharacteristics: number of years a firm was in business, number of employees as a measure of size, number of products, number of exportmarkets, lagged value-added productivity and years of export experience.
| Sector (NAICS code) | Non-TCS | TCS |
|---|---|---|
| Agriculture (100) | 5.5% | 3.0% |
| Mining (200) | 4.3% | 4.0% |
| Food & Beverage (311-312) | 2.4% | 9.1% |
| Textiles & Clothing (313-315) | 3.3% | 3.2% |
| Wood & Paper Products (321-323) | 5.3% | 4.0% |
| Petroleum, Chemicals & Plastics (324-327) | 6.1% | 8.7% |
| Primary & Fabricated Metal (331-332) | 6.3% | 5.3% |
| Machinery (333) | 5.4% | 8.6% |
| Computer, Electronic & Electrical Equipment (334-335) | 3.6% | 8.2% |
| Transportation Equipment (336) | 2.1% | 2.5% |
| Miscellaneous Manufacturing (316, 337-339) | 5.7% | 6.1% |
| Wholesale & Retail (400) | 32.1% | 20.9% |
| Other Services (500-900) | 17.9% | 16.6% |
Source: Statistics Canada’s Exporter and Business Register/Authors’ calculations
The quality of comparisons and the estimation of the treatment effect depend on controlling for firm-level characteristics. Research on firm heterogeneity shows that successful exporters are often those with higher productivity, which in turn allows these exporters to bring down destinationspecific sunk costs associated with accessing foreign markets. Similarly, the size of the firm, the amount of exporting experience, the number of exportmarkets and the number of products are also found to be associated with export performance. Thus, controlling for these firm-level characteristics should ensure comparison of like exporters. Nevertheless, it is still possible there are unobservable firm characteristics influencing the success of exporting firms, which could lead to bias in the results.
The impact of TCS assistance is tested over three different time horizons. In the same year in which assistance is received, exporters that receive assistance are found to export 17.9 percent more than comparable exporters who did not receive assistance. When the lagged effect of assistance is tested, the impact in the current year falls to 5.3 percent and in the year following assistance it is 12.4 percent, indicating that the impact of assistance increases with time. In a third test, the results show that exporters that received assistancemore than once during the period examined had exports in subsequent years that were 25.6 percent greater than non-clients.
These results suggest that the current year impact of 17.9 percent likely captures more than the concurrent effect. For exporters that received the assistance continuously over the sample period, the estimated coefficient might capture both the concurrent and lagged effects. However, in the test of current and lagged effects, the impacts cannot be added together because not all firms are accessing service in all the years included in the data set. The results show that the impact of the TCS on exporter performance is substantial.
The results also indicate that the effect increases with time, rising in the year following service, and that once TCS assistance starts to influence export performance, the effect can continue to provide benefits as long as the exporter continues to export. Indeed, the long term impact of the TCS (26 percent) is higher than the immediate or following year effects. This may be because the specification applies only to continuing exporters, and it would reflect multiple TCS services if an exporter had received assistance multiple times.
Market and product effects
The results indicate that TCS assistance plays a strong role in helping firms to diversify into new markets and to introduce new products into export markets. An exporter that accessed TCS assistance exports on average to 35.7 percent more markets than a comparable exporter that did not access TCS services. Similarly, an exporter with TCS assistance exports on average 15.5 percent more products than a comparable exporter without assistance.
Robustness Checks
Three robustness checks are carried out (see box), all of which corroborate the finding that TCS has a positive impact on exporter performance. The first check seeks to control for unobservable firm characteristics that might be driving export performance. The second controls for the influence of “peer exporters” and the third adopts a completely different methodology (propensity scorematching) to compare clients with non-clients.
We assess the impact of export promotion on Canadian exporter performance using the following equation:
Ε[y|ω, x] = γ + αω + xβ + ω(x - ψ)δ
where γ is the variable that measures exporter performance (exports for a particular year), ω is the dummy variable indicating if treatment has been received, x represents the control variables and ψ is the sample means of x. The estimated coefficient α measures the effect of TCS on exporter performance.
The timing of the TCS impact is tested with three different specifications of the equation.
1.1 The concurrent effect of TCS on exports: The treatment variable under this specification is a dummy variable that indicates if an exporter had received TCS assistance in the current year.
1.2 The lagged effect of TCS on exports: The treatment variable under this specification is a dummy variable that indicates if an exporter received TCS assistance in the preceding year.
1.3 The lingering effect of TCS on the value of exports: The treatment variable under this specification is a dummy variable that indicates if an exporter received TCS assistance in any of the years preceding the current period, but not in the current period. This estimation only includes exporters that are active in the export market for more than one year over the sample period.
The equation is thenmodified to gain further insights into the impact of the TCS:
2.1, 2.2 The market/product diversification effect of TCS. In these two cases the treatment variable is a dummy variable that indicates if an exporter had received TCS assistance in the current year, but the dependent variable is the number of markets/products served by the exporter, rather than the value of total exports by that exporter.
Robustness checks:
3.1 The panel fixed effect approach. This approach is used to control in part for unobservable firm characteristics. Unlike in the previous specifications where the data for the different years are pooled together, in this specification the data is organized in panel form. Only exporters who export consecutively at least for two years are included, reducing the sample size significantly compared to other regressions. The estimation result is expressed as the impact of the TCS on the growth rather than the level of exports (and is therefore not directly comparable to the results from the other specifications).
3.2 The effect of TCS under peer influence. This specification examines whether the effect of TCS is reduced if we control for the influence of other exporters exporting to the same destination (peer exporters). The value of exports by peer exporters in the preceding period who export to the same destination as the exporter in the current year are included. The treatment variable is the same as the one used for the estimation of the lagged effect estimation. The results show that after controlling for peer influence, the effect TCS assistance does not disappear nor does it decline.
3.3 (not shown in table) The effect of TCS evaluated with non-parametric techniques. Propensity score matching using the kernelmatching algorithm is applied to further validate the parametric estimation results. The treatment effect of TCS is positive and significant, which corroborates the findings based on the parametric estimations. The magnitude of the effect is much higher than those estimated using the parametric method, with TCS clients exporting 54 percent more than comparable non-TCS clients.
| Number | Specification | Estimated Coefficient for Treatment Variable (logarithm) | Export Gain (antilog equivalent) | |
|---|---|---|---|---|
| Current | Lagged or Lingering | |||
Notes:
| ||||
| 1.1 | Concurrent Effect | 0.165a (0.027) | 17.9% | |
| 1.2 | Lagged Effect | 0.052 (0.038) | 0.117a (0.029) | 12.4% |
| 1.3 | Lingering Effect | 0.228a (0.018) | 25.6% | |
| 2.1 | Market Diversification | 0.305a (0.008) | 35.7% | |
| 2.2 | Product Diversification | 0.144a (0.013) | 15.5% | |
| 3.1 | Firm Fixed Effect | 0.046a (0.018) | 4.9% | |
| 3.2 | Peer Influences | 0.079b (0.03) | 0.136a (0.029) | 14.6% |
Characteristics of firms that benefit the most from the TCS
The regression results provide insight into the types of firms that benefit the most from TCS assistance. These firms are typically “export–ready”, i.e. larger firms with more years of business experience, but with fewer years of exporting experience and less diversified markets and products lines.
Combining these findings with those regarding the types of firms that are most likely to seek TCS assistance, we can state that older and larger firms are both more likely to seek TCS assistance, and benefit more from that assistance. However, while TCS clients tend to have somewhat more export experience, the TCS benefit declines with increased years of export experience. Similarly, while TCS clients tend to export more products to more markets, the benefit of TCS assistance declines as the number of products and markets increases.
Caveats
Two cautionary notes should be taken into account in interpreting the results. First, firms that receive TCS assistance but that do not export are excluded from this analysis. In many cases, this is appropriate in that the service provided could be in support of commercial activities other than exports ofmerchandise and is therefore outside the scope of this study (e.g., export of services, or support for investment abroad). However, there may be cases where service was provided for exports ofmerchandise but no merchandise was exported by the client. These exporters were excluded fromthe data set available for this study, which could bias the results upwards. This could be addressed in a future study with an expanded data set.
Second, as noted at the outset, estimating the average treatment effect in this study involves comparing the performance of exporters who received treatment with the performance of comparable exporters who did not receive such treatment, while controlling for observable firm-level characteristics.Nevertheless, it is still possible that there are unobservable firmcharacteristics influencing the success of exporting firms, leading to biased estimation results.
Cost Benefit Analysis
The aggregate value of exports by all TCS clients over the seven-year period of the study (2000-2006)was $260 billion.5 Based on the estimate that TCS clients generate exports that are 17.9 percent higher than non-clients, the total value of the exports of these TCS clients would have been reduced by 17.9 percent to $220.5 billion, had they not received assistance. The estimated benefit from TCS assistance is therefore $39.5 billion.
Total government spending on the TCS over the period is estimated at $1.4 billion.6 Dividing the benefit of $39.5 billion by the cost of $1.4 billion, yields the following result: on average every $1 the government spends on the TCS results in a $27 increase in exports. This must be considered approximate. Results will be underestimated in that the cost of TCS services are included for which the associated benefits are not included (i.e., clients engaged in the export of services and other commercial activities outside of merchandise exports). Overestimation will occur to the extent the 17.9 percent benefit includes the impact of services received in previous years.
3. Changing Behaviour of Canadian Exporters
Key Findings:
- Exporters entering new markets make important contributions to Canada’s export performance. Between 2000 and 2006, new entrants accounted for all of the growth in exports.
- New market entrants have been particularly important for growth in exports to Asia and Latin America. In the U.S. market, they have offset the decline in exports caused by exporters exiting that market.
- Not only is the diversification of Canada’s export markets shown to be driven by new entrants, but it is the small and medium sized enterprises (SMEs) that are at the forefront of this diversification.
- SMEs have increased their share of the value of exports in all regions, and now account for nearly half of Canadian exports in the Asia-Pacific region.
4. General profile of Canadian exporters
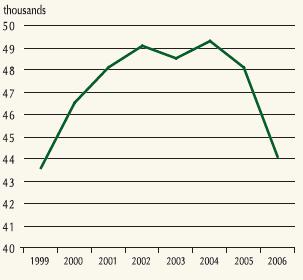
The number of Canadian exporters peaked in 2004 and has trended down since then (See Figure 5)7. As shown below, this decline in the number of exporters since 2004 is largely due to SME exporters departing the U.S. market. During the study period, Canadian exporters exported $360 billion and employed 3.4 million people annually. Total employment by Canadian exporting firms accounted for a fourth of total Canadian employment during this period. Both export values and employment peaked in 2005 before dropping in 2006.
Between 1999 and 2006, a typical Canadian exporter had been, on average, in business for 8.8 years, employed 73 people, exported 4.6 products to 2.0 countries, and generated total export sales worth $7.6 million.
Notably, the average number of markets served by each exporter increased from 1.7 in 1999 to 2.5 in 2006. In addition, the average number of years of experience of exporters doubled from 6 years in 1999 to almost 12 years in 2006, and the value of exports per exporter increased steadily from $7.4 million in 1999 to $8.6 million in 2006. However, the average number of products sold per firm did not increase over the period. The picture is thus one of a population of maturing firms gradually diversifying their export markets and increasing their export sales, but not their product palette.
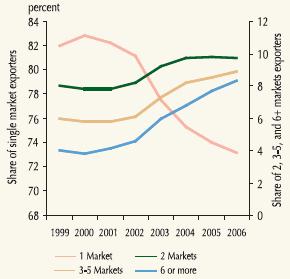
The average 2.5 markets served by a typical Canadian exporter remains lower than the 3.3 markets served by a typical U.S. exporter (Bernard, Jensen and Schott, 2005). This is not surprising, given the large number of Canadian exporters who are singlemarket exporters to the U.S. market. However, as Canadian firms increasingly entered non-U.S. markets, the number of single-market exporters fell steadily. In 1999, the number of single-market exporters accounted for 82 percent of the total Canadian exporter population, while in 2006 this share fell to 73 percent.
Similarly, there was a steady increase in the number of multi-country exporters. In 1999, only 14 percent of Canadian exporters shipped their products to between two and five destinations; in 2006 18.6 percent of Canadian exporters did so. Similarly, in 1999 only 4 percent of Canadian exporters exported to more than 6 destinations; in 2006, 8.3 percent of Canadian exporters did so. The latter group, exporting to the largest number of destinations, grew the fastest (See Figure 6).
Figure 5
Number of Canadian Exporters
Source: Statistics Canada’s Exporter and Business Register/ Authors’ calculations
Figure 5 Text Alternative
Figure 5 depicts the number of Canadian exporters 1999 to 2006; the number of exporters was 43,568 in 1999, which expanded to 49,314 in 2004 before falling back to 48,126 in 2005 and 44,127 in 2006.
Figure 6
Exporters by Number of Export Markets
Source: Statistics Canada’s Exporter and Business Register/ Authors’ calculations
Figure 6 Text Alternative
Figure 6 depicts the share of the total number of exporters accounted for exporters by the number of export markets served from 1999 to 2006. The percentage share of exporters shipping to a single market gradually declined from 82.0 in 1999 to 73.2 in 2006. . The percentage share of exporters shipping to two markets increased from 8.0 in 1999 to 9.7 in 2006. The percentage share of exporters shipping to 3-5 markets increased from 6.0 in 1999 to 8.9 in 2006. The percentage share of exporters shipping to 6 or more markets increased from 4.0 in 1999 to 8.3 in 2006.
Trends by Size of Exporter
Figure 7
Share of Exports by Size
Source: Statistics Canada’s Exporter and Business Register/ Authors’ calculations
Figure 7 Text Alternative
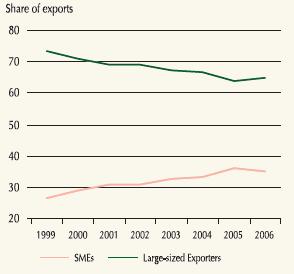
Figure 7 depicts the percentage share of exports by the size of the exporter 1999 to 2006. The share of exports accounted for by large-size exporters declined from 73.3% in 1999 to 64.8% in 2006, while the share for small and medium exporters increased from 26.7% to 35.2% over the same period.
The share of SMEs in the Canadian exporter population remained stable at 95 percent over the period, but their contribution to total Canadian exports increased to 35 percent in 2006 from slightly more than 25 percent in 1999 (See Figure 7).
Between 1999 and 2006,many SME single- market exporters expanded into non-U.S. markets to become multi-market exporters. The share of multi-market exporters in the total SME exporter group rose from 16 percent in 1999 to 25 percent in 2006, an increase of 9 percentage points. By comparison, the share of multi-market exporters among larger-sized firms only increased by 5 percentage points over the same period, from 54 percent to 59 percent (See Figure 8). Thus, the share ofmulti-market exporters rose more quickly within the SME population than among large-sized exporters.
It is noteworthy that the total number of multi-market SME exporters rose continuously until 2005 whereas the number of single- market SMEs (principally exporting to the U.S. market) first surged in the early 2000s and then fell back sharply as the Canadian dollar appreciated relative to the U.S. dollar post-2002. Indeed, the rate of expansion of multi-market SMEs accelerated in 2003 and 2004, the first two years that the Canadian dollar appreciated, coinciding with a decline in the single-market exporter group.
Sectoral Profile
Figure 8
Share of Multi-Market Exporters in Total Exports

Source: Statistics Canada’s Exporter and Business Register/ Authors’ calculations
Figure 8 Text Alternative
Figure 8 depicts the percentage share of multi-market exporters among the overall number of exporters for large-size exporters and small and medium sized (SME) exporters, respectively over the period from 2000 to 2006. For large size exporters the share was 52.3 in 2000 and gradually expanded to 60.8 in 2005 before falling back to 59.2 in 2006. The share for SMEs was 15.2 in 2000 and gradually increased to 24.9 in 2006.
The sectoral profile of the exporter population was relatively stable over the study period. Table 2 lists exporters by sector in 2006. Manufacturing plants made up about 42 percent of the total exporter population, but accounted for a substantially greater share of total Canadian exports (62.5 percent). This was largely due to the highly concentrated transportation equipment sector that constituted only 2.3 percent of the total Canadian exporter population but generated 20 percent of total export sales. Primary industries (e.g. agriculture andmining) accounted for about 10 percent of exports and a slightly smaller share of exporters. Tertiary industries (wholesale and retail distribution and the services sector) accounted for a large share of total exporters, but contributed a much lower proportion of total export values.
Within manufacturing, resource-based sectors (wood and paper products, petroleum, chemical and plastics, primary and fabricated metal) accounted for 18 percent of total Canadian exporters and represented over 28 percent of total Canadian export values. By contrast, the textiles and apparel and miscellaneous manufacturing sectors, are dominated by a large number of SMEs that generate a relatively small share of total exports.
| Sector (NAICS) | Number of Exporters | Proportion of All Exporters | Value of Exports | Proportion of All Exports |
|---|---|---|---|---|
| Agriculture (100) | 2,021 | 4.5% | $4,100,000,000 | 1.1% |
| Mining (200) | 1,729 | 3.9% | $34,800,000,000 | 9.2% |
| Food & Beverages (311-312) | 1,233 | 2.8% | $12,200,000,000 | 3.2% |
| Textile & Clothing (313-315) | 1,479 | 3.3% | $3,100,000,000 | 0.8% |
| Wood & Paper (321-323) | 2,283 | 5.1% | $29,300,000,000 | 7.7% |
| Petroleum, Chemical & Plastics (324-327) | 2,941 | 6.6% | $41,900,000,000 | 11.0% |
| Primary & Fabricated Metal (331-332) | 2,985 | 6.7% | $37,500,000,000 | 9.9% |
| Machinery (333) | 2,726 | 6.1% | $13,500,000,000 | 3.5% |
| Computer, Electronics & Electrical Equipment (334-335) | 1,754 | 3.9% | $14,700,000,000 | 3.9% |
| Transportation Equipment (336) | 1,016 | 2.3% | $78,300,000,000 | 20.6% |
| Miscellaneous Manufacturing (316, 337-339) | 2,493 | 5.6% | $7,400,000,000 | 1.9% |
| Wholesale & Retail (400) | 13,880 | 31.0% | $63,500,000,000 | 16.7% |
| Other Services (500-900) | 8,245 | 18.4% | $40,000,000,000 | 10.5% |
Source: Statistics Canada’s Exporter and Business Register/Authors’ calculations
Market Profile
The most remarkable feature of Canadian exporter dynamics over the period of the study was the gradual shift away from the U.S. market towards markets in Europe, Asia and Latin America. As shown in Table 3, between 2001 and 2006, the number of Canadian firms that exported to the U.S. market, fell by 15 percent8, while the number exporting to Asia, Europe, and Latin America increased sharply, with the biggest increase to Latin America (Figure 9).
| United States | Europe | Asia Pacific | Latin America | Other | |
|---|---|---|---|---|---|
| 1999 | 38,862 | 6,371 | 4,502 | 2,675 | 4,383 |
| 2000 | 41,578 | 6,451 | 4,731 | 2,675 | 4,416 |
| 2001 | 42,876 | 6,973 | 5,166 | 2,888 | 4,926 |
| 2002 | 43,111 | 7,638 | 5,880 | 3,118 | 5,647 |
| 2003 | 41,219 | 9,092 | 6,798 | 3,784 | 7,152 |
| 2004 | 40,553 | 10,169 | 7,853 | 4,508 | 8,434 |
| 2005 | 39,519 | 10,253 | 8,126 | 4,903 | 9,038 |
| 2006 | 36,276 | 9,552 | 7,784 | 4,670 | 8,548 |
| Numeric Change 2001-2006 | -6,600 | 2,579 | 2,618 | 1,782 | 3,622 |
| Percentage Change 2001-2006 | -15.4% | 37.0% | 50.7% | 61.7% | 73.5% |
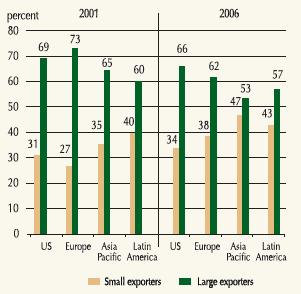
SME exporters led the migration into new export markets both in terms of number of exporters and value of exports. The increase in export value generated by SME exporters is especially notable in the Asian markets. In 1999, SME exportersmade up 35 percent of total export sales to Asia; in 2006, this share reached 47 percent—almost as much as the contribution by large-sized exporters (See Figure 10).
Figure 9
Growth in Number of Exporters, 2001-2006

Source: Statistics Canada’s Exporter and Business Register/ Authors’ calculations
Figure 9 Text Alternative
Figure 9 depicts percentage growth in the number of exporters by destination of exports from 2001 to 2006. The number of exporters shipping to the U.S. declined by 15.4 over this period, exporters shipping to Europe expanded by 37.0, exporters shipping to Asia Pacific increased by 50.7, exporters shipping to Latin America by 61.7 and exporters shipping to other destinations expanded by 73.5.
Figure 10
Share of Value of Exports by Size of Firm
Source: Statistics Canada’s Exporter and Business Register/ Authors’ calculations
Figure 10 Text Alternative
Figure 10 depicts the share of value of exports by the size of firm and the shipping destination in 2001 and 2006, respectively. Large size firms accounted for 69 percent of exports to the U.S. in 2001 and small and medium enterprises (SMEs) for 31 percent; large size firms accounted for 73 percent of exports to Europe in 2001 and SMEs for 27 percent; large size firms accounted for 65 percent of exports to Asia Pacific in 2001 and SMEs for 35 percent; large size firms accounted for 60 percent of exports to Latin America in 2001 and SMEs for 40 percent. Large size firms accounted for 66 percent of exports to the U.S. in 2006 and small and medium enterprises (SMEs) for 34 percent; large size firms accounted for 62 percent of exports to Europe in 2006 and SMEs for 38 percent; large size firms accounted for 53 percent of exports to Asia Pacific in 2006 and SMEs for 47 percent; large size firms accounted for 57 percent of exports to Latin America in 2006 and SMEs for 43 percent.
Direct trade versus through intermediaries
The mechanisms which support market diversification depend on a number of factors, including distance tomarket, significance of trade costs and size and productivity of the exporting firm. When trade costs (e.g., establishing own distribution networks) are high and potential markets are distant, exporters (particularly SMEs) are more likely to use intermediaries such as wholesalers and retailers to facilitate exporting. As such, the share of exports handled by wholesalers and retailers increases with the difficulty faced by exporters in accessing destinationmarkets. As illustrated in Table 4, 70 percent of SME export sales to Asia and Latin America were by wholesalers and retailers in 2001. In more mature markets such as the United States and Europe, the share of SME exports via wholesale and retail networks was about 50 percent.
| United States SME | United States Large | Asia SME | Asia Large | Europe SME | Europe Large | Latin America SME | Latin America Large | |
|---|---|---|---|---|---|---|---|---|
| Agricultural & Commodities | 8.5% | 6.7% | 13.1% | 6.6% | 12.7% | 12.6% | 6.9% | 3.8% |
| Food & Beverages | 5.1% | 4.9% | 4.7% | 5.5% | 5.6% | 2.4% | 5.2% | 5.3% |
| Wood, Paper & Chemical | 15.5% | 20.8% | 5.0% | 27.3% | 9.2% | 17.3% | 5.1% | 30.4% |
| Other Manufacturing | 20.8% | 55.4% | 7.0% | 21.7% | 25.3% | 56.6% | 11.7% | 33.4% |
| Wholesale & Retail | 49.6% | 12.2% | 70.0% | 39.0% | 46.8% | 9.8% | 70.8% | 27.1% |
| United States SME | United States Large | Asia SME | Asia Large | Europe SME | Europe Large | Latin America SME | Latin America Large | |
|---|---|---|---|---|---|---|---|---|
| Agricultural & Commodities | 11.4% | 7.4% | 29.1% | 12.0% | 22.3% | 18.6% | 7.6% | 5.2% |
| Food & Beverages | 3.4% | 4.4% | 3.0% | 6.2% | 4.2% | 2.3% | 3.6% | 6.5% |
| Wood & Paper & Chemical | 14.1% | 22.9% | 4.1% | 22.9% | 6.6% | 13.7% | 8.3% | 28.1% |
| Other Manufacturing | 19.5% | 52.2% | 10.9% | 27.5% | 37.8% | 52.1% | 17.4% | 32.2% |
| Wholesale & Retail | 51.0% | 13.1% | 52.1% | 31.3% | 28.5% | 13.2% | 57.7% | 27.9% |
Source: Statistics Canada’s Exporter and Business Register/Authors’ calculations
Of particular note is the decline of the importance of intermediaries in SME export sales to Asia and Latin America over the study period. This share dropped from 70 percent in 2001 to around 50 percent in 2006; presumably once firms have established their potential for direct sales in foreign markets, the need for intermediaries diminishes.
Entry and Exit Dynamics
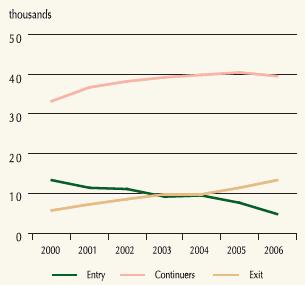
Turnover or “churn” in the exporter population is considerable. On average, about 9,500 new Canadian firms entered the export market every year between 2000 and 2006, accounting for almost one quarter of the total Canadian exporter population. At the same time, a similar number of firms exited the export market (See Figure 11).
At the beginning of the study period, the number of exporters entering the export market exceeded those departingmarkets by a wide margin; however, by the end of the period, this situation had reversed. The dramatic decrease in the number of new entrants combined with the sharp increase in the number of exiting firms resulted in a net decrease in the number of exporters by the end of the period. As noted previously, the net decrease in number of Canadian exporters was a phenomenon exclusive to the U.S.market. Canadian exporters continued to enter non-U.S. markets.
The impact of this exporter churn on the annual value of exports was modest since, on average, continuing exporters accounted for 99 percent of the total value of exports. Nevertheless, as shown below, new entrants have a considerable impact on the value of exports over the longer term.
New exporters often start out with one export destination and generate very small export sales initially. Over 90 percent of all new exporters in Canada started off exporting to one destination, in most cases (for 85 percent of these new exporters) the United States was their first destination. In 2000, the value of exports generated by all new entrants summed to $1.98 billion, which is equivalent to 0.6 percent of total exports for the year. That share shrank to only 0.4 percent in 2006, reflecting the declining number of new entrants.
New trading relationships are much more fragile and prone to failure than those that are established. About 50 percent of exporters who started in 2000 were no longer exporting after two years, and after six years, only a quarter of new exporters were still exporting.
However, once the new entrants established themselves in the export market, their export revenues increased significantly (See Figure 12).
Figure 11
Number of Entries, Continuers and Exiters, 2000-2006
Source: Statistics Canada’s Exporter and Business Register/ Authors’ calculations
Figure 11 Text Alternative
Figure 11 depicts the number of new users (entries), continued users (continuers) and previous users of TCS services, which have ceased using TCS services (exiters) over the period 2000 to 2006. The number of new entries slowed from 13,164 in 2000 to 4.736 in 2006, continued users numbered 33,301 in 2000 and had expanded to 39,391 in 2006, the number of exiters gradually expanded from 5,642 in 2000 to 13,311 in 2006.
Figure 12
The Average Value of Exports per Firmafter Initial Entry
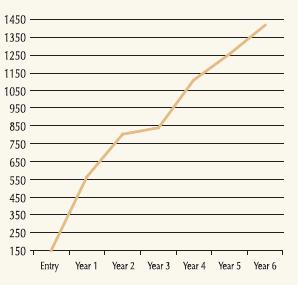
Source: Statistics Canada’s Exporter and Business Register/ Authors’ calculations
Figure 12 Text Alternative
Figure 12 depicts the average value of exports per firm after a varied number of years following the initial use of TCS services. In the same year as the initial use of TCS services the average value of exports was C$150,697; one year after initial use C$566,841; two years after initial use C$804,456; two years after initial use C$804,456; three years after initial use C$839,738; four years after initial use C$1,108,436; five years after initial use C$1,257,768; six years after initial use C$1,414,082.
Market diversification of Canadian exporters was driven by the different entry and exit dynamics in the four regional markets. Between 2000 and 2006, there was a net exit from the U.S. market as the total number of new entrants (49,336) was less than the total number of exiters (51,091). By contrast, new entrants outnumbered exiters in each of the othermajor regionalmarkets. The number of net entries was 792 for Asia, 821 for Europe, and 345 for Latin America.
While the number of continuing exporters to the U.S.market remained stable, this was not the case in the other three markets. Net increases in the number of continuing exporters were significant in Asia, Europe and Latin America. This indicates that new entrants in these latter three markets were able to consolidate their initial footholds in their new markets. This outcome is significant given the importance of continuing exporters in generating export sales.
| United States Entries | United States Continuers | United States Exits | Asia Pacific Entries | Asia Pacific Continuers | Asia Pacific Exits | Europe Entries | Europe Continuers | Europe Exits | Latin America Entries | Latin America Continuers | Latin America Exits | |
|---|---|---|---|---|---|---|---|---|---|---|---|---|
| 2000 | 11,129 | 30,449 | 4,668 | 715 | 4,016 | 327 | 966 | 5,485 | 427 | 318 | 2,357 | 162 |
| 2001 | 9,483 | 33,393 | 6,077 | 639 | 4,527 | 366 | 870 | 6,103 | 553 | 263 | 2,625 | 174 |
| 2002 | 7,608 | 35,503 | 7,268 | 866 | 5,014 | 523 | 1,136 | 6,502 | 650 | 340 | 2,778 | 233 |
| 2003 | 6,647 | 34,572 | 8,011 | 924 | 5,874 | 657 | 1,281 | 7,811 | 782 | 403 | 3,381 | 256 |
| 2004 | 6,174 | 34,379 | 7,788 | 1,091 | 6,762 | 745 | 1,417 | 8,752 | 922 | 513 | 3,995 | 285 |
| 2005 | 5,371 | 34,148 | 8,375 | 821 | 7,305 | 910 | 775 | 9,478 | 1,298 | 424 | 4,479 | 447 |
| 2006 | 2,924 | 33,352 | 8,904 | 503 | 7,281 | 1,239 | 598 | 8,954 | 1,590 | 236 | 4,434 | 595 |
| Total | 49,336 | 51,091 | 5,559 | 4,767 | 7,043 | 6,222 | 2,497 | 2,497 |
Source: Statistics Canada’s Exporter and Business Register/Authors’ calculations
Export growth can be decomposed into changes in the value of exports by established exporters (i.e., the intensive margin) and changes in the set of exporting firms (the extensive margin)9. Comparing the cumulative contribution of entries and continuers to total export growth between 2000 and 2006 yields the finding that the diversification of Canadian exports into non-U.S. markets has been mainly driven by changes at the extensivemargin of trade.While continuing exporters explain a large part of the total value of exports, it was new entrants that accounted for most of the growth.
Table 6 shows the notable contribution of net entries to export growth. Total exports grew by 2.2 percent10 between 2000 and 2006. Continuing exporters (i.e., those that were exporters in both 2000 and 2006) reduced overall export growth by 1.4 percentage points. By contrast, new entrants contributed 9.4 percentage points to growth. Meanwhile, exiters subtracted 5.8 percentage points from export growth. Thus, the net contribution by new entrants to total export growth over the period was almost 4 percentage points. Analysis of the entry and exit dynamics taking place during the period confirms that the extensivemargin was farmore important in explaining the overall export growth than the intensive margin.
| Export Growth | Continuing Exporters | Contribution of Entrants | Contribution of Exits | Net Entrants | |
|---|---|---|---|---|---|
| Total | 2.2% | -1.4% | 9.4% | -5.8% | 3.6% |
| U.S. | -3.5% | -5.6% | 7.6% | -5.5% | 2.1% |
| Asia | 28.7% | 14.7% | 30.6% | -16.7% | 13.9% |
| Europe | 33.5% | 21.9% | 24.4% | -12.9% | 11.5% |
| Latin America | 23.2% | 5.4% | 33.1% | -15.2% | 17.9% |
Source: Statistics Canada’s Exporter and Business Register/Authors’ calculations.
Table 6 also reports the decomposition of Canadian export growth by region. Total Canadian exports to the U.S. market declined by 3.5 percent between 2000 and 2006. This reflected the fact that the positive contribution of new entrants of 7.6 percentage points was more than offset by the negative contribution of continuing exporters of 5.6 percentage points, together with the negative contribution of 5.5 percentage points from exiters. The decline in export sales by continuing exporters highlights the deterioration of the trading environment for Canadian firms in the U.S. market, which induced many exporting firms to exit the U.S.market, particularly those that were less competitive. That said, without the large contribution of new entrants offsetting the negative effects of these departures and continuers, the decline in export sales would have been significantly greater. This underscores the vital importance of continuing export promotion to encourage new entrants: countries that depend on their existing export bases will suffer a steady erosion of their export performance.
In Asia, total Canadian export growth was high, up 28.7 percent from 2000 to 2006. Of this, 14.7 percentage points can be accounted for by the expansion of existing trading relationships (i.e., growth at the intensive margin). New entrants contributed an even greater 30.6 percentage points, while exiters subtracted 16.7 percentages points, resulting in a contribution from net entry of 13.9 percentage points.
Total export growth to Latin America reached 23.2 percent during the study period. Growth at the intensivemargin contributed 5.4 percentage points while gross entries contributed significantly more (33.1 percentage points). The contribution of net entries was 17.9 percentage points. Clearly, with respect to Canada’s total export growth to Latin America, the extensivemargin contributed much more significantly to growth than the intensive margin.
Europe accounted for the highest export growth among all of Canada’s destination regions, increasing by 33.5 percent. Of this, 21.9 percentage points can be accounted for by export sales of continuing exporters. This result is consistent with the findings in the previous section that Europe recorded the greatest growth in the number of continuing exporters among all regions. The gross contribution of new entrants amounted to 24.4 percentage points; this was partially offset by the negative contribution of exiters of 12.9 percentage points, resulting in a contribution from net entries of 11.5 percentage points.
5. Conclusion
The recent availability of export data at the firm level permits closer analysis of Canadian export performance than is possible with aggregated data. Linking these data with data from TCS client management database made feasible this first-ever econometric assessment of the impact of the Trade Commissioner Service (TCS) on Canadian exporter performance.
The estimation results show that TCS assistance has a consistently positive effect on the value of Canadian exports. Exporters that received assistance export almost 18 percent more on average than comparable exporters that did not receive such assistance. This finding is robust across a range of specifications and alternativemethodologies. Furthermore, cost-benefit analysis suggests that every dollar spent on the TCS yields $27 in export sales. The assessment also finds that the TCS helps its clients export 15 percent more products to 36 percent more markets.
While the analysis shows that the typical Canadian firmhasmuch to gain fromTCS assistance, it also shows that some types of firms benefit more than others. Those that benefitmore include firms that have been in business longer and are larger, which indicates that they are “export ready.” These firms are also characterized by lower productivity, less export experience, and are less diversified in their products and markets, all indicators suggesting a greater need for assistance.
The firm-level data can also be used to analyze the dynamics underlying the diversification of Canada’s exports away fromthe U.S. market. The average number of export destinations served per firm increased from 1.7 markets in 1999 to 2.5 markets in 2006, and the proportion of multi-market exporters in the total Canadian exporter population increased from 18 percent to almost 27 percent over the same period. The diversification was led by SME exporters, particularly towards Asia where SMEs now account for almost half of the value of exports to that region.
By tracking cohorts ofmarket entrants, it is possible to identify the high attrition rate of firms that enter into export markets. Only a quarter of the 13,000 new entrants in 2000 were still exporting in 2006. However, these survivors had increased their export sales more than nine-fold from an average of about $150,000 to over $1.4 million.
Reflecting the rapid increase in export sales for firms that are able to establish themselves in export markets, new entrants play a significant role over time in driving the growth of Canadian exports, particularly in emerging markets, even after subtracting the negative impact of firms that exitedmarkets. In Asia, net new entrants accounted for half of the growth in exports over the study period. In Latin America, new entrants accounted for almost 80 percent of export growth.
New entrants also played an important role in limiting the decline in Canadian export performance in the key U.S. market. Had it not been for the contribution of new entrants, exports to the U.S. between 2000 and 2006 would have declined by over 10 percent, rather than less than 4 percent as was actually the case.
Together, these findings with respect to the impact of new entrants on export growth underscore the vital importance of continuing export promotion aimed at helping new exporters overcome entry barriers, even in established markets. The analysis presented in this special feature demonstrates that the TCS is highly effective at helping exporters overcome barriers tomarket entry and diversify their markets.
References
Alvarez, Roberto E. and Gustavo T. Crespi. 2000. “ Exporter Performance and Promotion Instruments: Chilean Empirical Evidence,” Estudios de Economía 27(2): 225-241.
Baldwin, John R. AndWulong Gu. 2003. “Participation in exportmarkets and productivity performance in Canadian manufacturing,” Economic analysis research paper series, Statistics Canada Catalogue no. 11F0027MIE — No. 011.
Bernard, Andrew B., J Bradford Jensen and Peter K. Schott. 2005. “Importers, Exporters and Multinationals: A Portrait of Firms in the U.S. that Trade Goods,” Discussion Paper CES 05-20, Bureau of the Census, Center for Economic Studies, Washington, DC.
Bernard, Andrew B., J. Bradford Jensen, Stephen J. Redding, and Peter K. Schott. 2007. “Firms in International Trade,” NBER Working Paper No. 13054.
Chen, Shenjie and Emily Yu “Exporter Dynamics in Canada: Market Diversification in a Changing International Economic Environment” in Dan Ciuriak (ed.), Trade Policy Research 2010 Ottawa: Foreign Affairs and International Trade Canada.
Copeland, Brian R. 2008. “Is There a Case for Trade and Investment Promotion Policy?” in Dan Ciuriak (ed.), Trade Policy Research 2007. Ottawa: Foreign Affairs and International Trade Canada: 1-64.
Eaton, Jonathan, Samuel Kortum and Francis Kramarz. 2004. “Dissecting Trade: Firms, Industries, and Export Destinations,” Research Department Staff Report 332, Federal Reserve Bank of Minneapolis.
Eaton, Jonathan, Marcela Eslava, Maurice Kugler and James Tybout. 2007. “Export Dynamics in Colombia: Firm-Level Evidence,” NBER Working Paper No. 13531.
Girma, Sourafel, Yundan Gong, Holger Görg, and Zhihong Yu. 2007. “Can Production Subsidies Foster Export Activity? Evidence from Chinese Firm Level Data,” CEPR Discussion Paper No. 6052.
Imbens, GuidoW. 2004. “Nonparametric estimation of average treatment effects under exogeneity: A review,” Review of Economics and Statistics, 86(1), February: 4-29.
Lawless, Martina, 2009. “FirmExport Dynamics and the Geography of Trade,” Journal of International Economics 77(2): 245-254.
Lederman, Daniel,Marcelo Olarreaga and Lucy Payton. 2010. “Export Promotion Agencies: Do they work?” Journal of Development Economics 91(2), March: 257-265.
Van Biesebroeck, Johannes, Emily Yu and Shenjie Chen “The Impact of Trade Promotion Services on Canadian Exporter Performance “in Dan Ciuriak (ed.), Trade Policy Research 2010 Ottawa: Foreign Affairs and International Trade Canada
Volpe Martincus, Christian and Jerónimo. Carballo. 2008. “Is Export Promotion Effective in Developing Countries? Firm-Level Evidence on the Intensive and the ExtensiveMargins of Exports,” Journal of International Economics 76(1), September: 89-106.
Volpe Martincus, Christian, Jerónimo Carballo and and Pablo Garcia. 2010. “FirmSize and the Impact of Export Promotion Programs,” in Dan Ciuriak (ed.) Trade Policy Research 2010. Ottawa: Department of Foreign Affairs and International Trade.
Wagner, Joachim. 2007. “Why More West than East German Firms Export,” IZA Working Paper No. 2656, Institute for the Study of Labour, Bonn, Germany.
Wooldridge, Jeffrey M. 2002. Econometric Analysis of Cross Section and Panel Data. CambridgeMA:MIT Press.
1. Alvarez and Crespi (2000), Volpe Martincus and Carballo (2008) and Volpe Martincus, Carballo and Garcia (2010).
2. The most recent Exporter Register data, published following the initiation of this study, is for 2008.
3. The client exporter population is divided into four groups: the micro (1 to 10 employees), small (11 to 50 employees), medium (51 to 200 employees) and large (more than 200 employees).
4. See Van Biesebroeck, Yu and Chen (2010).
5. It should be noted that this export value excludes TCS clients that were eliminated from the regression analysis due to missing data in the Business Register
6. This amount includes the cost of maintaining TCS offices both abroad and headquarters. It does not include the cost of FDI promotion, which the study does not measure, or of the trade policy activities of DFAIT.
7. Statistics Canada’s publication “A Profile of Canadian Exporters” excludes the firms with annual exports less than $30,000. In this study, all exporters are included; therefore, the number of exporters reported in this paper is greater than that reported by Statistics Canada.
8. Note that exporters exiting the U.S. market might continue to export to other markets, e.g., faster-growing emerging markets.
9. See Chen and Yu (2010).
10. Statistics Canada’s publication “A Profile of Canadian Exporters” includes exports by all exporters including those who are not matched to the Business Register, while the data reported in this feature article include firms matched to the Business Register only. Therefore, the growth rates presented reported here will differ from those based on the published data.
- Date modified: