
The position and length of Canadian supply chains
Colin Scarffe
July 2022
Key points
- Canada specializes in the early (upstream) production stages of the supply chain. In general, Canada’s exports will be earlier in the value chain and closer to raw materials, while Canada’s imports will come from later in the value chain and be closer to final goods. This means that, in general, the Canadian economy is more susceptible to disruptions that happen in the later stages of supply chains, and is less susceptible to disruptions from the beginning stages of supply chains.
- A few notable industries—such as natural resource industries—exemplify Canada’s role as early producers in supply chains. Despite exporting different baskets of goods and services to each trading partner, Canadian exports to all trade partners are, on average, located in the early stages of the supply chain.
- Since 1997, Canadian exports have moved to slightly earlier production stages (closer to raw materials) in the value chain, while Canada’s import positioning has stayed relatively constant. The shift in exports to earlier stages occurred in the 2000’s due to a growing share of oil and gas extraction in exports and a diminishing share of auto vehicle manufacturing.
- Since 2010, there have been no major trends for Canada’s trade with the U.S., Mexico, or the rest of the world. The one exception has been China. While Canada’s exports to China still skew closer to the early stages of the value chain and closer raw materials, over the past 10 years these exports have moved further along the value chain closer to the final stages of production. Likewise, while Canada’s imports from China still skew closer to the final stages of the value chain and closer to final goods, over the last 10 years these imports have shifted towards the early stages of the value chain and have become closer to raw materials.
1. Introduction
Several events have recently brought supply chains, or global value chains (GVCs), into the public spotlight.Footnote 1 In the early days of the COVID-19 pandemic, many countries shut production facilities in an effort to contain the pandemic’s spread. Later, a shift in consumption from services to goods increased the pressure on supply chains, and transportation networks to keep up with demand. Prior to the pandemic, rising protectionism and trade tensions among countries that have historically been pro-free trade, were already beginning to influence the positioning and structure of global supply chains. In the post-COVID period, protectionism along with increased disruptions from climate change events will likely keep supply chains in the spotlight for many years to come. In the Canadian context, a more specific question emerges: how might supply chain disruptions affect Canadians and Canadian businesses?
In order to analyze the vulnerability and risks of a supply chain disruption to Canada, it is important to understand where Canada and Canadian firms fit into GVCs. On the one hand, if Canada’s production mainly happens at the beginning—or upstream—of a GVC, the primary concern would be a negative demand shock to Canadian industries. On the other, if Canadian production happens at the end—or downstream—of a GVC, the primary concern would be a supply shock to key inputs. If Canada’s production is in the middle of a GVC, both supply and demand shocks are concerns. This paper will attempt to answer where Canada fits into the global production process by assessing the upstreamness and downstreamness of Canadian production and trade.
This paper is organized as follows: section 2 presents the data and provides a detailed discussion on the methodology used to measure the position of production and trade for Canada. Section 2.1 provides simple measures of upstreamness and downstreamness, which are essential for understanding the results. Section 2.2 presents more complex measures, which are the basis for most of the paper. The measures in section 2.2 are mathematically technical; however, they follow the same logic as the simple measures in section 2.1. Section 3 presents the results for the upstreamness and downstreamness of Canadian industries. Section 4 provides the results for Canadian production and trade positioning in 2019 as well as Canada’s main trading partners. Section 5 examines how Canada’s upstreamness and downstreamness has changed over time. Lastly, section 6 concludes.
2. Data and methodology
All of the data in this paper comes from Statistics Canada’s symmetric Input-Output (IO) tables. An IO table models the structure of an economy, detailing how industries acquire their inputs (either intermediate inputs or value added) and what they do with their output (producing either intermediate inputs for other industries or final goods). The most recent Canadian IO tables have 234 goods and services industries, which will be the basis for measuring Canada’s GVC positioning in this paper. At the time of writing, the latest IO table was 2019 and is the basis for sections 3 and 4. In section 5, the IO tables from 1997-2019 are used.
This paper is an attempt to classify where Canada fits into the production process. Two complementary measures are used to quantify the production process:
- Output upstreamness from final goods
- Input downstreamness from value added
Output upstreamness refers to how far are an industry’s outputs from being a final good (i.e. consumed directly, a capital good, or exported). The output upstreamness measures the industry positioning by examining the use of the outputs. On the other hand, input downstreamness refers to how far are an industry’s inputs from being a value added input (i.e. labour, capital, or natural resources). The input downstreamness measures the industry positioning by examining the source of the inputs.
The auto industry can be used as an example for the two measures, and are used in figure 1 as the two end points. When the metals used to make a car are mined, the outputs are far from being a final good, and the inputs are close to being natural resources. Resultantly, mining is both an upstream (based on the outputs) and not a downstream (based on the inputs) industry. The metals are then processed, which is then used to construct the frame of the car. At this point, the outputs become less upstream (closer to a final good) and the inputs are more downstream (further away from value added). Finally, the car frame (along with many other components) are assembled into a car and sold as a consumer good. The car is a final good (not upstream from anything) while the inputs are have all been through several stages of production prior to final assembly (far away from value added).
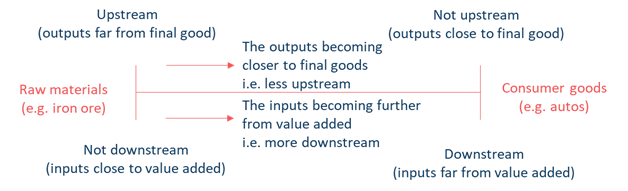
Importantly, not all supply chains will be the same length; two industries that have similar upstream positions might have very different downstream positions and vice-versa. For example, automobile and light-duty motor vehicle manufacturing and education both produce final goods almost exclusively. However, autos are a downstream industry (most of the inputs have been through multiple stages of production) whereas education is not a downstream industry because most of the input is value added in the form of labour and human capital. This is a case where one industry (autos) has a longer supply chain than another (education), and hopefully clarifies why it is important to examine both the inputs and outputs. For the rest of the paper moving up the value chain and further away from final goods will be referred to as becoming more upstream, and moving down the value chain and further away from raw materials will be referred to as becoming more downstream.
2.1 Two simple measures
This sub-section will attempt to quantify where an industry falls in the production process using the simplest relations possible. This sub-section will use the simple measures found in Antràs and Chor (2018). The total use (or output) of a sector can be divided into two classifications: intermediate outputs—which are used as inputs in other industries—and final goods—which include outputs that are directly consumed, capital goods, and exports. The basic relation is:

Text version
Yi is equal to the sum from j to n of Zij plus Fi
The total use of sector i (Yi) is equal to the sum of all intermediate output (Zij) from sector i to each sector j (including sector i itself), plus the output that are final goods (Fi). The simple measure of output upstreamness is the share of an industry’s output that is used as an intermediate inputs for other industries. Alternatively, the simple measure is one minus the share of the industry’s output that is final goods. Formally:

Text version
Ui is equal to the sum from j to n of Zij divided by Yi which is equivalent to 1 minus Fi divided by Yi
A sector where the output is largely final goods will have an upstreamness score, or , close to zero. A sector where the output is primarily intermediate inputs for other industries will have a score close to one. For example, sectors that process raw materials are upstream; they will have large intermediate outputs (Zji) and small final outputs (Fi). These sectors will have upstream scores close to one. On the other hand, construction sectors are not upstream as construction is generally not used as an intermediate input for other industries. They will have limited intermediate outputs and be mostly comprised of final outputs; resultantly, construction industries have an upstream score close to zero.
An alternative method to using the output of an industry is to focus on the inputs into an industry to measure the position in the production process. The basic relation for inputs, and the counterpart of equation (1) is:

Text version
Yi is equal to the sum from i to n of Zij plus VAj
Where the total inputs (Yj) of industry j (which is the exact same as the output Yi in equation (1) when i equals j) is equal to the sum of intermediate inputs (Zij) used by sector j from each sector i, plus the value added (VAj) in sector j. In general, there are three sources of value added: labour, capital, and natural resources. The simple measure of input downstreamness is the share of the industry’s input that are intermediate outputs from other industries—or one minus the share of the industry’s input that is value added. Formally:

Text version
Dj is equal to the sum from i to n of Zij divided by Yj which is equivalent to 1 minus VAj divided by Yj
If an industry uses many intermediate inputs (such as construction) then it is a downstream industry and will have a higher downstream score (i.e. a score close to one)—the inputs have passed through many stages of production before entering this industry. On the other hand, if it has a high value added (such as natural resource extraction) then it is not a downstream industry and will have a score close to zero. Using the network diagram found in the appendix, the two simple measures of upstreamness and downstreamness measure the lines “a.” and “b.” for all industries.
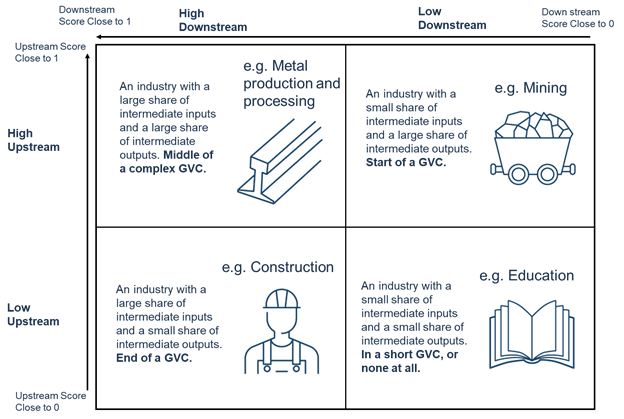
Figure 2 presents a summary of the four types of industry characterizations. Re-enforcing a point made earlier, not all industries have the same length of value chain. Many goods industries will go through many stages of production and will therefore have a longer value chain. Many service industries do not have multiple stages of production (that are measurable by an IO-table) and will therefore have a short value chain. When an industry is in the middle of a long and complex value chain, it is possible that an industry is both more upstream and more downstream than another.
2.2 Using the IO structure for a single economy
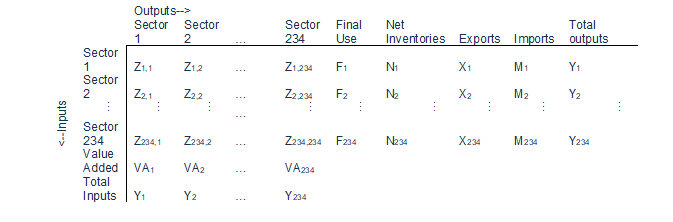
More complex measures of upstreamness and downstreamness are developed in this section taking advantage of the IO table’s structure and well developed algebra. The measures in this section are based on the work of Antràs et al. (2012), Miller and Temurshoev (2015), and Antràs and Chor (2018). Figure 3 depicts the basic structure of an IO table.
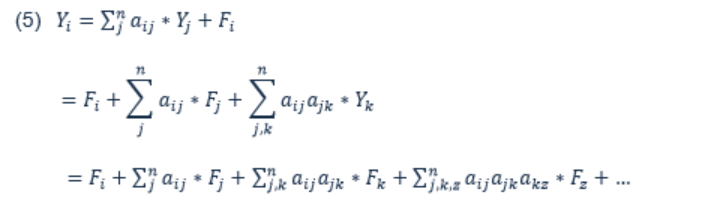
Instead of only calculating the share of intermediate goods in a sector’s output, the relation between sectors can be used to count the number of steps in production it takes for the output of a sector to become a final good. Starting with a closed economy (setting inventories, exports and imports to zero) and letting , equation (1) can be re-written:Footnote 2
Text version
Yi is equal to the sum from j to n of aji multiplied by Yj plus Fi
Yi is equal to Fi plus the sum from j to n of aji multiplied by Fj plus the sum from j and k to n of aji multiplied by ajk multiplied by Yk
Yi is equal to Fi plus the sum from j to n of aji multiplied by Fj plus the sum from j and k to n of aji multiplied by ajk multiplied by Fk plus the sum from j, k, and z to n of aji multiplied by ajk multiplied by akz multiplied by Fz plus etc.
The key part of the final line of equation (5) is that each term specifies the number of steps needed for outputs to become final goods. The first term requires only one step to become a final good (that is the output itself), the second term requires the refinement of one additional industry before becoming a final good (two steps), the third term requires the refinement of two additional industries before becoming a final good (three steps) etc. In order to measure of upstreamness of production, the numbers of steps needed to become a final good are counted.

Text version
Ui multiplied by Yi is equal to one times Fi plus two times the sum from j to n of aji multiplied by Fj plus three times the sum from j and k to n of aji multiplied by ajk multiplied by Fk plus four times the sum from j, k, and z to n of aji multiplied by ajk multiplied by akz multiplied by Fz plus etc.
Although equation (6) seems like it is a summation of an infinite number of terms, as long as the “a’s” are less than one, it is a geometric sum which simplifies to [I-A]-2F, where A is a matrix of the aji’s and F is the vector of final demand by industry. Using the relation for F in the first line of equation (5), it simplifies further to:
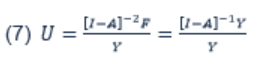
Text version
U is equal to the Identity minus the A matrix to the exponent minus 2, multiplied by the F vector, all divided by the Y vector. Which is equal to the Identity minus the A matrix inverse, multiplied by the Y vector and all divided by the Y vector
The third term in equation (7) is the Leontief inverse multiplied by industry share of output and is the basis for IO multipliers. Using a result found in Miller and Temurshoev, the output upstreamness in (7) can be interpreted as the total number of forward linkages in a given industry. An industry such as electricity generation has high output upstreamness because it has many forward linkages. Many countries, such as China, choose to subsidize industries with high forward linkages because many industries indirectly benefit from the subsidy.
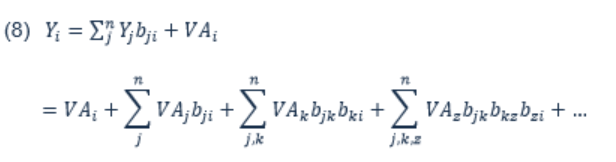
A similar process can be done for the input downstreamness. Letting , equation (3) can be re-written as:Footnote 3
Text version
Yi is equal to the sum from j to n of Yj multiplied by bji plus VAi
Yi is equal to VAi plus the sum from j to n of VAj multiplied by bji plus the sum from j and k to n of VAk multiplied by bjk multiplied by bki plus the sum from j, k, and z to n of VAz multiplied by bjk multiplied by bkz multiplied by bzi plus etc.
Similar to equation (5), the key part of equation (8) is that each term represents how far away the inputs are from being primary factors (i.e. the value added). The first term includes primary factors for industry i. In the second term, the primary factors have been transformed by one stage of production first. In the third term, the primary factors have been transformed by two stages of production, etc. Counting all stages of production results in:

Text version
Di is equal to one times VAi divided by Yi plus two times the sum from j to n of VAj divided by Yi multiplied by bji plus three times the sum from j and k to n of VAk divided by Yi multiplied by bjk multiplied by bki plus four times the sum from j, k, and z to n of VAz divided by Yi multiplied by bjk multiplied by bkz multiplied by bzi plus etc.
D is equal to VA transpose multiplied by the identity minus the B matrix to the exponent minus two, all divided by the Y vector
D is equal to Y transpose multiplied by the identity minus the B matrix inverse, all divided by the Y vector
(Where VA’ is the transpose of the value added vector, and B is the matrix of bji’s)
This time, the total input shares are multiplied by the Ghosh inverse, or the input counterpart to the Leontief inverse. In the same way that the output upstreamness in (7) can be interpreted as the number of forward linkages, the input downstreamness in (9) can be interpreted as the number of backward linkages. Industries that have a high number of backward linkages are also often targets for subsidies because they can increase demand in a large number of industries.
The upstreamness and downstreamness measures are different—although mathematically and conceptually quite similar—ways of measuring the same thing. Miller and Temurshoev (2015) highlight the mathematical links between the two methods. One of the main takeaways from Miller and Temurshoev is that when the upstreamness and downstreamness of each industry is weighted by its share of output, then these two measures will give the exact same result. However, when the industry upstreamness and downstreamness measures are weighted by exports and imports, they will tend to give different results. These more complex measures of upstreamness and downstreamness attempt to account for all the lines in the network diagram found in the appendix.
Lastly, the terms set to zero—net inventories, imports, and exports—need to be accounted for on the output side of the economy. Following Antràs et al. (2012), the following adjustment is made to the elements within the A matrix:Footnote 4
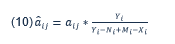
Text version
aji hat is equal to aji multiplied by Yi divided by Yi minus Ni plus Mi minus Xi
As many of the results in this paper will be about Canada’s role in international supply chains, the results are based on the Canadian IO tables. This means that exports and imports are placed as if they were going through a Canadian production process. In practice, after leaving Canada or arriving in Canada, the traded products could have different values of upstreamness and downstreamness depending on the partner economy’s IO table; however, it is expected that industries would have similar upstream and downstream placements across economies, and thus the values would be similar.Footnote 5
3. Industry Results
To begin the analysis, the complex measures of upstreamness and downstreamness are plotted against the simple measures for each industry in figure 4.
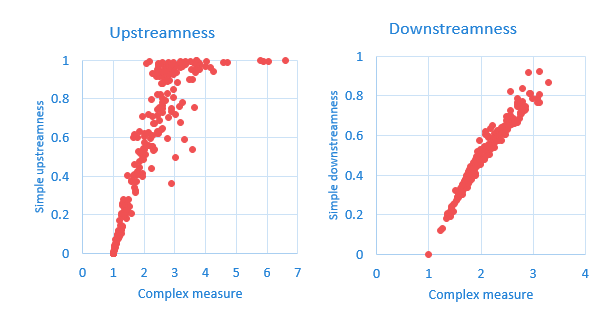
Figure 4 - Text version
| Industry | Description | Upstream | simple upstreamness | Domestic downstream | simple downstreamness |
|---|---|---|---|---|---|
| BS111A00 | Crop production (except cannabis, greenhouse, nursery and floriculture production) | 2.87167 | 0.735631765 | 2.150010079 | 0.525807653 |
| BS1114A0 | Greenhouse, nursery and floriculture production (except cannabis) | 1.7092 | 0.561149877 | 2.125945159 | 0.537895993 |
| BS111CL0 | Cannabis production (licensed) | 1 | 0 | 2.120325405 | 0.601437024 |
| BS111CU0 | Cannabis production (unlicensed) | 1 | 0 | 1.517747591 | 0.320952155 |
| BS112A00 | Animal production (except aquaculture) | 2.84956 | 0.955159005 | 2.940425936 | 0.811927441 |
| BS112500 | Aquaculture | 2.2801 | 0.663758006 | 2.395199977 | 0.576290043 |
| BS113000 | Forestry and logging | 3.94806 | 0.963858438 | 2.335320097 | 0.600445657 |
| BS114000 | Fishing, hunting and trapping | 2.2646 | 0.661100345 | 1.897825183 | 0.397365135 |
| BS115A00 | Support activities for crop and animal production | 3.77445 | 0.98515593 | 1.464160797 | 0.219021784 |
| BS115300 | Support activities for forestry | 4.51861 | 0.990993547 | 2.065102171 | 0.481418805 |
| BS211110 | Oil and gas extraction (except oil sands) | 3.54886 | 0.895507564 | 1.886295564 | 0.457472313 |
| BS211140 | Oil sands extraction | 3.72287 | 0.964119778 | 1.849122489 | 0.441233508 |
| BS212100 | Coal mining | 4.12172 | 0.996743196 | 1.651248943 | 0.316209241 |
| BS212210 | Iron ore mining | 4.80345 | 0.991239631 | 1.776463324 | 0.367518713 |
| BS212220 | Gold and silver ore mining | 6.08769 | 0.995847192 | 1.911010169 | 0.443032174 |
| BS212230 | Copper, nickel, lead and zinc ore mining | 6.72409 | 0.997689722 | 1.733903333 | 0.358113742 |
| BS212290 | Other metal ore mining | 6.40919 | 0.996865148 | 1.883497087 | 0.431377968 |
| BS212310 | Stone mining and quarrying | 2.93943 | 0.991268351 | 1.866465849 | 0.431887772 |
| BS212320 | Sand, gravel, clay, and ceramic and refractory minerals mining and quarrying | 3.3527 | 0.9869198 | 1.857648281 | 0.422271754 |
| BS212392 | Diamond mining | 2.82647 | 0.935078751 | 2.025182828 | 0.48181972 |
| BS21239A | Other non-metallic mineral mining and quarrying (except diamond and potash) | 3.81175 | 0.973989445 | 1.744938287 | 0.366369881 |
| BS212396 | Potash mining | 3.6722 | 0.93711891 | 1.54632371 | 0.28593562 |
| BS21311A | Support activities for oil and gas extraction | 3.49268 | 0.996652135 | 1.732959304 | 0.340458394 |
| BS21311B | Support activities for mining | 2.84554 | 0.622293346 | 1.856345719 | 0.429928959 |
| BS221100 | Electric power generation, transmission and distribution | 2.54896 | 0.644419654 | 1.576984444 | 0.302512256 |
| BS221200 | Natural gas distribution | 2.32221 | 0.543578723 | 1.356094227 | 0.194960871 |
| BS221300 | Water, sewage and other systems | 2.44468 | 0.617210163 | 1.941724375 | 0.45396451 |
| BS23A000 | Residential building construction | 1 | 0 | 2.198079061 | 0.550591291 |
| BS23B000 | Non-residential building construction | 1 | 0 | 2.120154094 | 0.539058376 |
| BS23C100 | Transportation engineering construction | 1 | 0 | 2.25845308 | 0.611563521 |
| BS23C200 | Oil and gas engineering construction | 1 | 0 | 2.145927349 | 0.591905821 |
| BS23C300 | Electric power engineering construction | 1 | 0 | 1.995496551 | 0.465345428 |
| BS23C400 | Communication engineering construction | 1 | 0 | 2.570571686 | 0.724996702 |
| BS23C500 | Other engineering construction | 1 | 0 | 2.21185182 | 0.587085255 |
| BS23D000 | Repair construction | 2.80497 | 0.990339795 | 1.901220533 | 0.411102503 |
| BS23E000 | Other activities of the construction industry | 2.96031 | 0.959565375 | 1.637890012 | 0.303316895 |
| BS311100 | Animal food manufacturing | 2.91006 | 0.688690129 | 2.933252409 | 0.811915581 |
| BS311200 | Grain and oilseed milling | 2.54539 | 0.745793253 | 2.796831427 | 0.839854389 |
| BS311300 | Sugar and confectionery product manufacturing | 1.60802 | 0.383084358 | 2.60080699 | 0.682018473 |
| BS311400 | Fruit and vegetable preserving and specialty food manufacturing | 1.41508 | 0.261436321 | 2.53486352 | 0.690763967 |
| BS311500 | Dairy product manufacturing | 1.59317 | 0.377864156 | 3.082729574 | 0.769595627 |
| BS311600 | Meat product manufacturing | 1.8234 | 0.485498749 | 3.113859365 | 0.765215591 |
| BS311700 | Seafood product preparation and packaging | 1.96312 | 0.561076991 | 2.697514953 | 0.785497355 |
| BS311800 | Bakeries and tortilla manufacturing | 1.45773 | 0.287047465 | 2.440895961 | 0.612462175 |
| BS311900 | Other food manufacturing | 1.59143 | 0.375528952 | 2.502667711 | 0.662213412 |
| BS312110 | Soft drink and ice manufacturing | 1.71074 | 0.379196533 | 2.499030813 | 0.669080482 |
| BS312120 | Breweries | 1.81378 | 0.439171636 | 2.066971983 | 0.492273594 |
| BS3121A0 | Wineries and distilleries | 1.42166 | 0.255745048 | 2.215379337 | 0.556271119 |
| BS312200 | Tobacco manufacturing | 1.1779 | 0.085638356 | 1.893090626 | 0.437600665 |
| BS31A000 | Textile and textile product mills | 2.0376 | 0.613816969 | 2.496560857 | 0.65664368 |
| BS31B000 | Clothing and leather and allied product manufacturing | 1.24707 | 0.15101278 | 2.359811541 | 0.622388048 |
| BS321100 | Sawmills and wood preservation | 3.10252 | 0.969955772 | 2.566857543 | 0.691123473 |
| BS321200 | Veneer, plywood and engineered wood product manufacturing | 2.46069 | 0.976097783 | 2.451314013 | 0.638263049 |
| BS321900 | Other wood product manufacturing | 2.46288 | 0.972872525 | 2.486967992 | 0.658782415 |
| BS322100 | Pulp, paper and paperboard mills | 3.4561 | 0.889047044 | 2.558739891 | 0.70189512 |
| BS322200 | Converted paper product manufacturing | 2.57063 | 0.749183108 | 2.596356817 | 0.67346355 |
| BS323000 | Printing and related support activities | 2.8825 | 0.959381073 | 2.241681632 | 0.542935192 |
| BS324110 | Petroleum refineries | 2.80772 | 0.705523639 | 2.566917036 | 0.824725391 |
| BS3241A0 | Petroleum and coal product manufacturing (except petroleum refineries) | 3.28331 | 0.969596886 | 2.786718736 | 0.773859352 |
| BS325100 | Basic chemical manufacturing | 4.20469 | 0.95822152 | 2.488762295 | 0.677516785 |
| BS325200 | Resin, synthetic rubber, and artificial and synthetic fibres and filaments manufacturing | 3.81166 | 0.987750355 | 2.562114436 | 0.660144831 |
| BS325300 | Pesticide, fertilizer and other agricultural chemical manufacturing | 3.74347 | 0.945048651 | 2.485909975 | 0.696837367 |
| BS325400 | Pharmaceutical and medicine manufacturing | 2.05504 | 0.740128943 | 2.447699201 | 0.646991891 |
| BS325500 | Paint, coating and adhesive manufacturing | 2.99439 | 0.927938981 | 2.584384321 | 0.679130278 |
| BS325600 | Soap, cleaning compound and toilet preparation manufacturing | 1.66751 | 0.333848023 | 2.433349647 | 0.645720456 |
| BS325900 | Other chemical product manufacturing | 3.48806 | 0.952159465 | 2.602346746 | 0.679265336 |
| BS326100 | Plastic product manufacturing | 2.84054 | 0.924144599 | 2.519050813 | 0.645253122 |
| BS326200 | Rubber product manufacturing | 2.99197 | 0.85076222 | 2.627688216 | 0.677662672 |
| BS327A00 | Non-metallic mineral product manufacturing (except cement and concrete products) | 2.63798 | 0.875719313 | 2.273767442 | 0.59725372 |
| BS327300 | Cement and concrete product manufacturing | 2.47102 | 0.983008919 | 2.30832111 | 0.626034676 |
| BS331100 | Iron and steel mills and ferro-alloy manufacturing | 3.77453 | 0.998893629 | 2.702303094 | 0.769255962 |
| BS331200 | Steel product manufacturing from purchased steel | 3.79807 | 0.997739598 | 2.857345957 | 0.744575814 |
| BS331300 | Alumina and aluminum production and processing | 4.19864 | 0.943801343 | 2.763510789 | 0.709116456 |
| BS331400 | Non-ferrous metal (except aluminum) production and processing | 5.92302 | 0.998427851 | 3.11642242 | 0.921606431 |
| BS331500 | Foundries | 3.56682 | 0.995607938 | 2.461208673 | 0.604881137 |
| BS332100 | Forging and stamping | 3.19631 | 0.978932277 | 2.630405704 | 0.686055094 |
| BS332A00 | Cutlery, hand tools and other fabricated metal product manufacturing | 2.66562 | 0.881686264 | 2.228201014 | 0.540240057 |
| BS332300 | Architectural and structural metals manufacturing | 2.68622 | 0.981679782 | 2.441413667 | 0.614673292 |
| BS332400 | Boiler, tank and shipping container manufacturing | 2.62978 | 0.848304633 | 2.449282504 | 0.606106283 |
| BS332500 | Hardware manufacturing | 2.82275 | 0.975824656 | 2.470517839 | 0.632699382 |
| BS332600 | Spring and wire product manufacturing | 2.5951 | 0.932308417 | 2.558657443 | 0.663550008 |
| BS332700 | Machine shops, turned product, and screw, nut and bolt manufacturing | 2.9348 | 0.951143772 | 2.161600909 | 0.50390712 |
| BS332800 | Coating, engraving, cold and heat treating and allied activities | 3.63683 | 0.987004268 | 2.104835866 | 0.498247959 |
| BS333100 | Agricultural, construction and mining machinery manufacturing | 2.42104 | 0.481681412 | 2.387369859 | 0.612250924 |
| BS333200 | Industrial machinery manufacturing | 1.73415 | 0.30880507 | 2.287559593 | 0.575982465 |
| BS333300 | Commercial and service industry machinery manufacturing | 1.92653 | 0.395635938 | 2.247375686 | 0.568407319 |
| BS333400 | Ventilation, heating, air-conditioning and commercial refrigeration equipment manufacturing | 2.25888 | 0.784567897 | 2.316387952 | 0.574334478 |
| BS333500 | Metalworking machinery manufacturing | 2.29544 | 0.569925061 | 2.266625337 | 0.56402597 |
| BS333600 | Engine, turbine and power transmission equipment manufacturing | 2.91369 | 0.854598274 | 2.280605334 | 0.569830326 |
| BS333900 | Other general-purpose machinery manufacturing | 2.31306 | 0.562259308 | 2.427463106 | 0.622817327 |
| BS334100 | Computer and peripheral equipment manufacturing | 1.29483 | 0.133923217 | 2.308542238 | 0.593402867 |
| BS334200 | Communications equipment manufacturing | 1.92206 | 0.520583683 | 2.226227859 | 0.567977675 |
| BS334A00 | Other electronic product manufacturing | 2.08094 | 0.637082093 | 2.178415939 | 0.544224288 |
| BS334400 | Semiconductor and other electronic component manufacturing | 3.22036 | 0.964480512 | 2.366357248 | 0.611821174 |
| BS335100 | Electric lighting equipment manufacturing | 2.18396 | 0.720278844 | 2.301171752 | 0.590037294 |
| BS335200 | Household appliance manufacturing | 1.31759 | 0.183013877 | 2.549413434 | 0.685393758 |
| BS335300 | Electrical equipment manufacturing | 2.74345 | 0.798425794 | 2.503882283 | 0.6307656 |
| BS335900 | Other electrical equipment and component manufacturing | 2.64091 | 0.900664066 | 2.697279255 | 0.664299641 |
| BS336110 | Automobile and light-duty motor vehicle manufacturing | 1.02227 | 0.017451335 | 3.284526338 | 0.867929312 |
| BS336120 | Heavy-duty truck manufacturing | 1.06225 | 0.033032446 | 2.983044993 | 0.789445974 |
| BS336200 | Motor vehicle body and trailer manufacturing | 1.21227 | 0.151628777 | 2.732421639 | 0.686559104 |
| BS336310 | Motor vehicle gasoline engine and engine parts manufacturing | 2.40071 | 0.906630568 | 2.861175184 | 0.729702582 |
| BS336320 | Motor vehicle electrical and electronic equipment manufacturing | 2.52787 | 0.908437664 | 2.774152404 | 0.737247737 |
| BS336330 | Motor vehicle steering and suspension components (except spring) manufacturing | 2.48638 | 0.939116685 | 3.076573432 | 0.786517643 |
| BS336340 | Motor vehicle brake system manufacturing | 2.26303 | 0.919908435 | 2.829692166 | 0.725955221 |
| BS336350 | Motor vehicle transmission and power train parts manufacturing | 2.48932 | 0.934847973 | 2.636885647 | 0.659609225 |
| BS336360 | Motor vehicle seating and interior trim manufacturing | 2.53551 | 0.947137853 | 3.129844292 | 0.809704827 |
| BS336370 | Motor vehicle metal stamping | 2.59763 | 0.991256676 | 2.769744699 | 0.712649046 |
| BS336390 | Other motor vehicle parts manufacturing | 2.37732 | 0.925488975 | 2.751755099 | 0.716421567 |
| BS336400 | Aerospace product and parts manufacturing | 2.58316 | 0.646780993 | 2.39078192 | 0.610241913 |
| BS336500 | Railroad rolling stock manufacturing | 1.52757 | 0.250117615 | 2.801114614 | 0.751035187 |
| BS336600 | Ship and boat building | 1.26187 | 0.092799363 | 2.176120496 | 0.53256977 |
| BS336900 | Other transportation equipment manufacturing | 2.03099 | 0.504487509 | 2.789129145 | 0.728836282 |
| BS337100 | Household and institutional furniture and kitchen cabinet manufacturing | 1.46335 | 0.400750543 | 2.262457509 | 0.56838406 |
| BS337200 | Office furniture (including fixtures) manufacturing | 1.32858 | 0.229829793 | 2.356319349 | 0.594968711 |
| BS337900 | Other furniture-related product manufacturing | 1.30522 | 0.225524062 | 2.519080957 | 0.663237818 |
| BS339100 | Medical equipment and supplies manufacturing | 1.88342 | 0.656696939 | 2.133692385 | 0.531620025 |
| BS339900 | Other miscellaneous manufacturing | 1.76762 | 0.379777319 | 2.525858064 | 0.694439949 |
| BS411000 | Farm product merchant wholesalers | 2.89497 | 0.803116684 | 1.753524288 | 0.415014905 |
| BS412000 | Petroleum and petroleum products merchant wholesalers | 2.51291 | 0.616454317 | 1.74994155 | 0.400706552 |
| BS413000 | Food, beverage and tobacco merchant wholesalers | 1.64728 | 0.355281633 | 1.821202165 | 0.419591088 |
| BS414000 | Personal and household goods merchant wholesalers | 1.7029 | 0.4076122 | 1.840703953 | 0.433728431 |
| BS415000 | Motor vehicle and motor vehicle parts and accessories merchant wholesalers | 1.9806 | 0.507873756 | 1.865938853 | 0.440424516 |
| BS416000 | Building material and supplies merchant wholesalers | 2.46651 | 0.828991806 | 1.575480114 | 0.29971945 |
| BS417000 | Machinery, equipment and supplies merchant wholesalers | 2.31708 | 0.566740569 | 1.562379074 | 0.290621052 |
| BS418000 | Miscellaneous merchant wholesalers | 2.88775 | 0.733366238 | 1.826596962 | 0.424802046 |
| BS419000 | Business-to-business electronic markets, and agents and brokers | 2.47143 | 0.739031648 | 1.634032624 | 0.340042067 |
| BS441000 | Motor vehicle and parts dealers | 1.39989 | 0.17406543 | 1.639248842 | 0.337851227 |
| BS442000 | Furniture and home furnishings stores | 1.43283 | 0.255674906 | 1.918279415 | 0.486682532 |
| BS443000 | Electronics and appliance stores | 1.55112 | 0.297288159 | 1.709057223 | 0.378098548 |
| BS444000 | Building material and garden equipment and supplies dealers | 2.04877 | 0.56380019 | 1.682407146 | 0.358689092 |
| BS445000 | Food and beverage stores | 1.23062 | 0.133114605 | 1.674768231 | 0.362325605 |
| BS446000 | Health and personal care stores | 1.39705 | 0.232890629 | 1.720615386 | 0.387475663 |
| BS447000 | Gasoline stations | 1.55218 | 0.2497332 | 1.588268999 | 0.317843373 |
| BS448000 | Clothing and clothing accessories stores | 1.15881 | 0.066049104 | 1.85815063 | 0.465271706 |
| BS451000 | Sporting goods, hobby, book and music stores | 1.26982 | 0.130308346 | 1.746205053 | 0.406196284 |
| BS452000 | General merchandise stores | 1.42567 | 0.222506395 | 1.675254546 | 0.367262788 |
| BS453A00 | Miscellaneous store retailers (except cannabis) | 1.36882 | 0.192945546 | 1.787500717 | 0.42982697 |
| BS453BL0 | Cannabis stores (licensed) | 1.820989077 | |||
| BS453BU0 | Cannabis stores (unlicensed) | 1 | 0 | 1.352668471 | 0.206741067 |
| BS454000 | Non-store retailers | 1.46057 | 0.235617947 | 1.890797742 | 0.478389428 |
| BS481000 | Air transportation | 1.95024 | 0.487813057 | 2.30948197 | 0.58848278 |
| BS482000 | Rail transportation | 3.01809 | 0.54654162 | 1.752637656 | 0.360777974 |
| BS483000 | Water transportation | 3.46182 | 0.648451212 | 2.704830246 | 0.756164111 |
| BS484000 | Truck transportation | 3.19648 | 0.69689718 | 2.328688361 | 0.598417887 |
| BS485100 | Urban transit systems | 1.08014 | 0.052172155 | 2.903289846 | 0.91967832 |
| BS48A000 | Other transit and ground passenger transportation and scenic and sightseeing transportation | 1.76155 | 0.661515346 | 1.809103495 | 0.38002427 |
| BS485300 | Taxi and limousine service | 2.20508 | 0.650500758 | 2.146842796 | 0.556342303 |
| BS486A00 | Crude oil and other pipeline transportation | 3.5854 | 0.499869961 | 1.689886804 | 0.36558455 |
| BS486200 | Pipeline transportation of natural gas | 2.87248 | 0.377655607 | 1.419194066 | 0.215644752 |
| BS488000 | Support activities for transportation | 3.19821 | 0.78354627 | 2.154839161 | 0.553109719 |
| BS491000 | Postal service | 2.51219 | 0.705066776 | 1.417474204 | 0.194556121 |
| BS492000 | Couriers and messengers | 2.98069 | 0.960679492 | 2.129607634 | 0.541253028 |
| BS493000 | Warehousing and storage | 3.23033 | 0.80892483 | 1.5333092 | 0.273378034 |
| BS511110 | Newspaper publishers | 2.54536 | 0.755329178 | 2.061483076 | 0.527453406 |
| BS5111A0 | Periodical, book and directory publishers | 2.31608 | 1.155199807 | 2.071828794 | 0.543855868 |
| BS511200 | Software publishers | 2.34452 | 0.519148547 | 1.706947223 | 0.380192502 |
| BS5121A0 | Motion picture and video industries (except exhibition) | 3.61875 | 0.775933191 | 2.696701808 | 0.745445916 |
| BS512130 | Motion picture and video exhibition | 1.25856 | 0.126889321 | 2.341236859 | 0.576274083 |
| BS512200 | Sound recording industries | 2.72307 | 0.984549323 | 2.392154459 | 0.640161648 |
| BS515100 | Radio and television broadcasting | 2.73187 | 1.006577513 | 2.234310871 | 0.55655593 |
| BS515200 | Pay and specialty television | 2.86044 | 1.060936238 | 2.583441926 | 0.656984661 |
| BS517000 | Telecommunications | 1.84645 | 0.409374371 | 1.861802768 | 0.427685516 |
| BS518000 | Data processing, hosting, and related services | 3.09578 | 0.893971268 | 1.789436257 | 0.418163231 |
| BS519000 | Other information services | 2.99971 | 1.192138429 | 1.971091502 | 0.518313249 |
| BS521000 | Monetary authorities - central bank | 2.15585 | 0.993047101 | 1.604028931 | 0.322721298 |
| BS5221A0 | Banking and other depository credit intermediation | 2.20166 | 0.598456279 | 1.436930524 | 0.240494607 |
| BS522130 | Local credit unions | 1.85705 | 0.445764937 | 1.76063294 | 0.420856283 |
| BS522200 | Non-depository credit intermediation | 2.27577 | 0.613912758 | 2.08619845 | 0.606746645 |
| BS522300 | Activities related to credit intermediation | 2.60561 | 0.81085757 | 1.908661463 | 0.492972294 |
| BS52A000 | Financial investment services, funds and other financial vehicles | 1.98227 | 0.49002267 | 2.22700826 | 0.653004136 |
| BS524100 | Insurance carriers | 2.03895 | 0.547296513 | 1.967532972 | 0.574397401 |
| BS524200 | Agencies, brokerages and other insurance related activities | 3.03303 | 0.974842098 | 1.602554508 | 0.33132397 |
| BS531100 | Lessors of real estate | 1.76179 | 0.40841503 | 1.678017963 | 0.369206791 |
| BS531A00 | Offices of real estate agents and brokers and activities related to real estate | 1.37703 | 0.231783141 | 1.964468427 | 0.502148784 |
| BS5311A0 | Owner-occupied dwellings | 1 | 0 | 1.215401435 | 0.122080862 |
| BS532100 | Automotive equipment rental and leasing | 2.88867 | 0.977662466 | 1.764119001 | 0.401866434 |
| BS532A00 | Rental and leasing services (except automotive equipment) | 2.69761 | 0.807365708 | 1.835006813 | 0.419450897 |
| BS533000 | Lessors of non-financial intangible assets (except copyrighted works) | 3.09108 | 3.049211852 | 1.941166946 | 0.521938752 |
| BS541100 | Legal services | 2.45426 | 0.72171341 | 1.541439867 | 0.289273411 |
| BS541200 | Accounting, tax preparation, bookkeeping and payroll services | 2.81896 | 0.897981519 | 1.604330053 | 0.318392534 |
| BS541300 | Architectural, engineering and related services | 2.67258 | 0.967744554 | 1.669929512 | 0.356896726 |
| BS541400 | Specialized design services | 2.80082 | 0.949299106 | 1.851879236 | 0.451220537 |
| BS541500 | Computer systems design and related services | 2.48313 | 0.637284265 | 1.72579918 | 0.399505567 |
| BS541600 | Management, scientific and technical consulting services | 3.08791 | 0.892846537 | 1.660759332 | 0.350022542 |
| BS541700 | Scientific research and development services | 1.54558 | 0.20082742 | 1.634196153 | 0.336771417 |
| BS541800 | Advertising, public relations, and related services | 2.90584 | 0.921044936 | 1.851970518 | 0.448446391 |
| BS541900 | Other professional, scientific and technical services | 2.7155 | 0.797845583 | 1.875023397 | 0.465750418 |
| BS551113 | Holding companies | 3.38224 | 0.964763656 | 1.792994435 | 0.443252248 |
| BS561100 | Office administrative services | 3.11086 | 1.639374276 | 1.601466842 | 0.322621925 |
| BS561A00 | Facilities and other support services | 3.20338 | 0.995328841 | 1.684076754 | 0.36490546 |
| BS561300 | Employment services | 3.32399 | 0.990467108 | 1.698223067 | 0.373533893 |
| BS561400 | Business support services | 3.03609 | 1.084908944 | 1.692571305 | 0.367776489 |
| BS561500 | Travel arrangement and reservation services | 2.32563 | 0.736381703 | 1.778639749 | 0.414473485 |
| BS561600 | Investigation and security services | 2.65099 | 0.921963714 | 1.55436338 | 0.287642523 |
| BS561700 | Services to buildings and dwellings | 2.801 | 0.899334499 | 1.926784769 | 0.448442605 |
| BS562000 | Waste management and remediation services | 2.76827 | 0.902947307 | 1.857747883 | 0.451007329 |
| BS610000 | Educational services | 1.92258 | 0.524105768 | 1.841697227 | 0.440449893 |
| BS621100 | Offices of physicians | 2.09608 | 0.9835059 | 1.494762218 | 0.257185631 |
| BS621200 | Offices of dentists | 1.07534 | 0.066061147 | 1.691738543 | 0.353260567 |
| BS621A00 | Miscellaneous ambulatory health care services | 1.69141 | 0.623246319 | 1.345311676 | 0.17983782 |
| BS623000 | Nursing and residential care facilities | 1.28013 | 0.251870807 | 1.441182723 | 0.230530307 |
| BS624000 | Social assistance | 1.32435 | 0.277415675 | 1.931823438 | 0.466691114 |
| BS71A000 | Performing arts, spectator sports and related industries, and heritage institutions | 2.12225 | 0.538986952 | 1.980222175 | 0.489210606 |
| BS713A00 | Amusement and recreation industries | 1.50509 | 0.278792079 | 1.935106969 | 0.48010444 |
| BS713200 | Gambling industries | 1.25842 | 0.128331573 | 2.141099927 | 0.597420039 |
| BS721100 | Traveller accommodation | 1.86283 | 0.518676216 | 1.868365846 | 0.40929875 |
| BS721A00 | Recreational vehicle (RV) parks, recreational camps, and rooming and boarding houses | 1.1811 | 0.116289441 | 1.782818916 | 0.393241659 |
| BS722000 | Food services and drinking places | 1.45553 | 0.229250199 | 2.262937238 | 0.540029084 |
| BS811100 | Automotive repair and maintenance | 1.91656 | 0.389684381 | 1.820699746 | 0.406501945 |
| BS811A00 | Repair and maintenance (except automotive) | 2.52193 | 0.726240764 | 1.768311236 | 0.383878141 |
| BS812A00 | Personal care services and other personal services | 1.35812 | 0.161119265 | 1.868668497 | 0.43899018 |
| BS812200 | Funeral services | 1.06179 | 0.047004081 | 1.980366254 | 0.454976237 |
| BS812300 | Dry cleaning and laundry services | 1.78082 | 0.509293855 | 1.958142369 | 0.463057495 |
| BS813000 | Business, professional and other membership organizations | 2.95258 | 0.977221803 | 1.77965562 | 0.38368481 |
| BS814000 | Private households | 1 | 0 | 1 | 0 |
| NP610000 | Educational services | 1.18703 | 0.126483638 | 1.655733356 | 0.327057167 |
| NP621000 | Ambulatory health care services | 1.32512 | 0.283321672 | 1.807066957 | 0.4048132 |
| NP624000 | Social assistance | 1.20588 | 0.175774291 | 1.565681522 | 0.287851078 |
| NP710000 | Arts, entertainment and recreation | 1.24048 | 0.125819368 | 1.999244994 | 0.50534606 |
| NP813100 | Religious organizations | 1.15096 | 0.076551751 | 1.555470617 | 0.284632016 |
| NP813A00 | Grant-making, civic, and professional and similar organizations | 1.09657 | 0.059021834 | 1.998799495 | 0.531233744 |
| NP999999 | Other non-profit institutions serving households | 1.12725 | 0.081604548 | 2.188129558 | 0.634448518 |
| GS611100 | Elementary and secondary schools | 1.01998 | 0.014069625 | 1.252170529 | 0.13299835 |
| GS611200 | Community colleges and C.E.G.E.P.s | 1.16423 | 0.103047809 | 1.480707868 | 0.251106038 |
| GS611300 | Universities | 1.10948 | 0.052225301 | 1.405546929 | 0.19993684 |
| GS611A00 | Other educational services | 1 | 0 | 1.550903949 | 0.28885979 |
| GS622000 | Hospitals | 1.10419 | 0.075402464 | 1.639294664 | 0.351159949 |
| GS623000 | Nursing and residential care facilities | 1.04679 | 0.042069273 | 1.415687669 | 0.216036435 |
| GS911100 | Defence services | 1.01432 | 0.007478455 | 1.642387843 | 0.331350558 |
| GS911A00 | Other federal government services (except defence) | 1.16395 | 0.090116787 | 1.64653794 | 0.347463887 |
| GS912000 | Other provincial and territorial government services | 1.11687 | 0.065211948 | 2.080145417 | 0.621436637 |
| GS913000 | Other municipal government services | 1.26945 | 0.142839285 | 1.608579275 | 0.320798035 |
| GS914000 | Other aboriginal government services | 1 | 0 | 1.967790869 | 0.510970785 |
| PRM100000 | Taxes on products | #N/A | #N/A | #N/A | #N/A |
| PRM200000 | Subsidies on products | #N/A | #N/A | #N/A | #N/A |
| PRM300000 | Subsidies on production | #N/A | #N/A | #N/A | #N/A |
| PRM400000 | Taxes on production | #N/A | #N/A | #N/A | #N/A |
| PRM500000 | Wages and salaries | #N/A | #N/A | #N/A | #N/A |
| PRM600000 | Employers' social contributions | #N/A | #N/A | #N/A | #N/A |
| PRM700000 | Gross mixed income | #N/A | #N/A | #N/A | #N/A |
| PRM800000 | Gross operating surplus | #N/A | #N/A | #N/A | #N/A |
| TOTAL | Total | #N/A | #N/A | #N/A | #N/A |
The simple measures have a tight correlation with the complex measures of upstreamness and downstreamness—particularly on the downstream side. On the upstream side, there is more variability, especially for the industries that are the most upstream (those that produce almost exclusively intermediate goods for other industries). This is because a greater share of the outputs will be influenced by the upstreamness of other industries—thus allowing for greater variation in their own upstreamness.
The high degree of correlation between the simple measures and the complex measures is expected and a beneficial feature which serves as a check on the theory and calculations; if there was a major divergence, it could be debated as to which measure is better and thus lead to arbitrary conclusions. However, since they lead to similar findings, the choice of measure is less important. Given that the complex measures attempt to treat the intermediate goods heterogeneously, which accounts for variable supply chain length, these will be the measure of choice for the rest of the paper. Next, figure 5 has the complex measures plotted against one another.
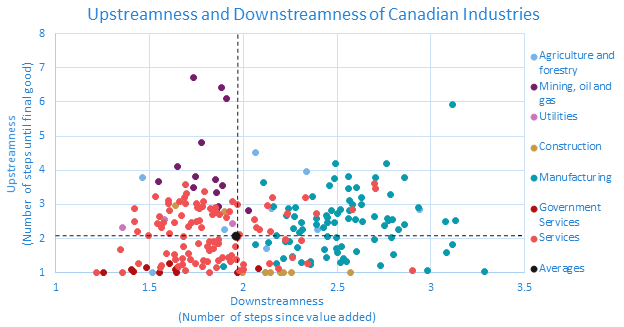
Figure 5 - Text version
| Industry | Description | Upstream | Domestic Downstream | Overall upstreamness | Overall downstreamness |
|---|---|---|---|---|---|
| BS111A00 | Crop production (except cannabis, greenhouse, nursery and floriculture production) | 2.871669586 | 2.150010079 | 2.06556106 | 1.962935314 |
| BS1114A0 | Greenhouse, nursery and floriculture production (except cannabis) | 1.709198407 | 2.125945159 | 2.06556106 | 1.962935314 |
| BS111CL0 | Cannabis production (licensed) | 1 | 2.120325405 | 2.06556106 | 1.962935314 |
| BS111CU0 | Cannabis production (unlicensed) | 1 | 1.517747591 | 2.06556106 | 1.962935314 |
| BS112A00 | Animal production (except aquaculture) | 2.849559474 | 2.940425936 | 2.06556106 | 1.962935314 |
| BS112500 | Aquaculture | 2.280099642 | 2.395199977 | 2.06556106 | 1.962935314 |
| BS113000 | Forestry and logging | 3.948059902 | 2.335320097 | 2.06556106 | 1.962935314 |
| BS114000 | Fishing, hunting and trapping | 2.264604035 | 1.897825183 | 2.06556106 | 1.962935314 |
| BS115A00 | Support activities for crop and animal production | 3.774453536 | 1.464160797 | 2.06556106 | 1.962935314 |
| BS115300 | Support activities for forestry | 4.518608956 | 2.065102171 | 2.06556106 | 1.962935314 |
| BS211110 | Oil and gas extraction (except oil sands) | 3.548858026 | 1.886295564 | 2.06556106 | 1.962935314 |
| BS211140 | Oil sands extraction | 3.722869939 | 1.849122489 | 2.06556106 | 1.962935314 |
| BS212100 | Coal mining | 4.121720706 | 1.651248943 | 2.06556106 | 1.962935314 |
| BS212210 | Iron ore mining | 4.803448779 | 1.776463324 | 2.06556106 | 1.962935314 |
| BS212220 | Gold and silver ore mining | 6.087688845 | 1.911010169 | 2.06556106 | 1.962935314 |
| BS212230 | Copper, nickel, lead and zinc ore mining | 6.724092658 | 1.733903333 | 2.06556106 | 1.962935314 |
| BS212290 | Other metal ore mining | 6.409186794 | 1.883497087 | 2.06556106 | 1.962935314 |
| BS212310 | Stone mining and quarrying | 2.939429669 | 1.866465849 | 2.06556106 | 1.962935314 |
| BS212320 | Sand, gravel, clay, and ceramic and refractory minerals mining and quarrying | 3.352696932 | 1.857648281 | 2.06556106 | 1.962935314 |
| BS212392 | Diamond mining | 2.826472063 | 2.025182828 | 2.06556106 | 1.962935314 |
| BS21239A | Other non-metallic mineral mining and quarrying (except diamond and potash) | 3.811747552 | 1.744938287 | 2.06556106 | 1.962935314 |
| BS212396 | Potash mining | 3.672204916 | 1.54632371 | 2.06556106 | 1.962935314 |
| BS21311A | Support activities for oil and gas extraction | 3.492675473 | 1.732959304 | 2.06556106 | 1.962935314 |
| BS21311B | Support activities for mining | 2.845539791 | 1.856345719 | 2.06556106 | 1.962935314 |
| BS221100 | Electric power generation, transmission and distribution | 2.548957339 | 1.576984444 | 2.06556106 | 1.962935314 |
| BS221200 | Natural gas distribution | 2.322205724 | 1.356094227 | 2.06556106 | 1.962935314 |
| BS221300 | Water, sewage and other systems | 2.444678935 | 1.941724375 | 2.06556106 | 1.962935314 |
| BS23A000 | Residential building construction | 1 | 2.198079061 | 2.06556106 | 1.962935314 |
| BS23B000 | Non-residential building construction | 1 | 2.120154094 | 2.06556106 | 1.962935314 |
| BS23C100 | Transportation engineering construction | 1 | 2.25845308 | 2.06556106 | 1.962935314 |
| BS23C200 | Oil and gas engineering construction | 1 | 2.145927349 | 2.06556106 | 1.962935314 |
| BS23C300 | Electric power engineering construction | 1 | 1.995496551 | 2.06556106 | 1.962935314 |
| BS23C400 | Communication engineering construction | 1 | 2.570571686 | 2.06556106 | 1.962935314 |
| BS23C500 | Other engineering construction | 1 | 2.21185182 | 2.06556106 | 1.962935314 |
| BS23D000 | Repair construction | 2.804972676 | 1.901220533 | 2.06556106 | 1.962935314 |
| BS23E000 | Other activities of the construction industry | 2.960309147 | 1.637890012 | 2.06556106 | 1.962935314 |
| BS311100 | Animal food manufacturing | 2.910059612 | 2.933252409 | 2.06556106 | 1.962935314 |
| BS311200 | Grain and oilseed milling | 2.545386598 | 2.796831427 | 2.06556106 | 1.962935314 |
| BS311300 | Sugar and confectionery product manufacturing | 1.608016606 | 2.60080699 | 2.06556106 | 1.962935314 |
| BS311400 | Fruit and vegetable preserving and specialty food manufacturing | 1.415081648 | 2.53486352 | 2.06556106 | 1.962935314 |
| BS311500 | Dairy product manufacturing | 1.593172297 | 3.082729574 | 2.06556106 | 1.962935314 |
| BS311600 | Meat product manufacturing | 1.823403086 | 3.113859365 | 2.06556106 | 1.962935314 |
| BS311700 | Seafood product preparation and packaging | 1.963121493 | 2.697514953 | 2.06556106 | 1.962935314 |
| BS311800 | Bakeries and tortilla manufacturing | 1.457729039 | 2.440895961 | 2.06556106 | 1.962935314 |
| BS311900 | Other food manufacturing | 1.591426888 | 2.502667711 | 2.06556106 | 1.962935314 |
| BS312110 | Soft drink and ice manufacturing | 1.710741141 | 2.499030813 | 2.06556106 | 1.962935314 |
| BS312120 | Breweries | 1.813775075 | 2.066971983 | 2.06556106 | 1.962935314 |
| BS3121A0 | Wineries and distilleries | 1.421661381 | 2.215379337 | 2.06556106 | 1.962935314 |
| BS312200 | Tobacco manufacturing | 1.177903497 | 1.893090626 | 2.06556106 | 1.962935314 |
| BS31A000 | Textile and textile product mills | 2.037599248 | 2.496560857 | 2.06556106 | 1.962935314 |
| BS31B000 | Clothing and leather and allied product manufacturing | 1.247073258 | 2.359811541 | 2.06556106 | 1.962935314 |
| BS321100 | Sawmills and wood preservation | 3.102520976 | 2.566857543 | 2.06556106 | 1.962935314 |
| BS321200 | Veneer, plywood and engineered wood product manufacturing | 2.46068603 | 2.451314013 | 2.06556106 | 1.962935314 |
| BS321900 | Other wood product manufacturing | 2.462875103 | 2.486967992 | 2.06556106 | 1.962935314 |
| BS322100 | Pulp, paper and paperboard mills | 3.456095659 | 2.558739891 | 2.06556106 | 1.962935314 |
| BS322200 | Converted paper product manufacturing | 2.570629871 | 2.596356817 | 2.06556106 | 1.962935314 |
| BS323000 | Printing and related support activities | 2.882497376 | 2.241681632 | 2.06556106 | 1.962935314 |
| BS324110 | Petroleum refineries | 2.80772147 | 2.566917036 | 2.06556106 | 1.962935314 |
| BS3241A0 | Petroleum and coal product manufacturing (except petroleum refineries) | 3.283314285 | 2.786718736 | 2.06556106 | 1.962935314 |
| BS325100 | Basic chemical manufacturing | 4.204689324 | 2.488762295 | 2.06556106 | 1.962935314 |
| BS325200 | Resin, synthetic rubber, and artificial and synthetic fibres and filaments manufacturing | 3.811661053 | 2.562114436 | 2.06556106 | 1.962935314 |
| BS325300 | Pesticide, fertilizer and other agricultural chemical manufacturing | 3.743469305 | 2.485909975 | 2.06556106 | 1.962935314 |
| BS325400 | Pharmaceutical and medicine manufacturing | 2.05504125 | 2.447699201 | 2.06556106 | 1.962935314 |
| BS325500 | Paint, coating and adhesive manufacturing | 2.994394964 | 2.584384321 | 2.06556106 | 1.962935314 |
| BS325600 | Soap, cleaning compound and toilet preparation manufacturing | 1.667514809 | 2.433349647 | 2.06556106 | 1.962935314 |
| BS325900 | Other chemical product manufacturing | 3.488062815 | 2.602346746 | 2.06556106 | 1.962935314 |
| BS326100 | Plastic product manufacturing | 2.840542542 | 2.519050813 | 2.06556106 | 1.962935314 |
| BS326200 | Rubber product manufacturing | 2.991974182 | 2.627688216 | 2.06556106 | 1.962935314 |
| BS327A00 | Non-metallic mineral product manufacturing (except cement and concrete products) | 2.637976331 | 2.273767442 | 2.06556106 | 1.962935314 |
| BS327300 | Cement and concrete product manufacturing | 2.47102323 | 2.30832111 | 2.06556106 | 1.962935314 |
| BS331100 | Iron and steel mills and ferro-alloy manufacturing | 3.774528249 | 2.702303094 | 2.06556106 | 1.962935314 |
| BS331200 | Steel product manufacturing from purchased steel | 3.798073896 | 2.857345957 | 2.06556106 | 1.962935314 |
| BS331300 | Alumina and aluminum production and processing | 4.198638824 | 2.763510789 | 2.06556106 | 1.962935314 |
| BS331400 | Non-ferrous metal (except aluminum) production and processing | 5.923020948 | 3.11642242 | 2.06556106 | 1.962935314 |
| BS331500 | Foundries | 3.566816041 | 2.461208673 | 2.06556106 | 1.962935314 |
| BS332100 | Forging and stamping | 3.196309725 | 2.630405704 | 2.06556106 | 1.962935314 |
| BS332A00 | Cutlery, hand tools and other fabricated metal product manufacturing | 2.665619086 | 2.228201014 | 2.06556106 | 1.962935314 |
| BS332300 | Architectural and structural metals manufacturing | 2.68622234 | 2.441413667 | 2.06556106 | 1.962935314 |
| BS332400 | Boiler, tank and shipping container manufacturing | 2.62977502 | 2.449282504 | 2.06556106 | 1.962935314 |
| BS332500 | Hardware manufacturing | 2.822754643 | 2.470517839 | 2.06556106 | 1.962935314 |
| BS332600 | Spring and wire product manufacturing | 2.595104375 | 2.558657443 | 2.06556106 | 1.962935314 |
| BS332700 | Machine shops, turned product, and screw, nut and bolt manufacturing | 2.934801693 | 2.161600909 | 2.06556106 | 1.962935314 |
| BS332800 | Coating, engraving, cold and heat treating and allied activities | 3.636829526 | 2.104835866 | 2.06556106 | 1.962935314 |
| BS333100 | Agricultural, construction and mining machinery manufacturing | 2.421038798 | 2.387369859 | 2.06556106 | 1.962935314 |
| BS333200 | Industrial machinery manufacturing | 1.73415123 | 2.287559593 | 2.06556106 | 1.962935314 |
| BS333300 | Commercial and service industry machinery manufacturing | 1.926527383 | 2.247375686 | 2.06556106 | 1.962935314 |
| BS333400 | Ventilation, heating, air-conditioning and commercial refrigeration equipment manufacturing | 2.258881382 | 2.316387952 | 2.06556106 | 1.962935314 |
| BS333500 | Metalworking machinery manufacturing | 2.295439809 | 2.266625337 | 2.06556106 | 1.962935314 |
| BS333600 | Engine, turbine and power transmission equipment manufacturing | 2.913694266 | 2.280605334 | 2.06556106 | 1.962935314 |
| BS333900 | Other general-purpose machinery manufacturing | 2.313057741 | 2.427463106 | 2.06556106 | 1.962935314 |
| BS334100 | Computer and peripheral equipment manufacturing | 1.294833594 | 2.308542238 | 2.06556106 | 1.962935314 |
| BS334200 | Communications equipment manufacturing | 1.922056612 | 2.226227859 | 2.06556106 | 1.962935314 |
| BS334A00 | Other electronic product manufacturing | 2.080935294 | 2.178415939 | 2.06556106 | 1.962935314 |
| BS334400 | Semiconductor and other electronic component manufacturing | 3.220355508 | 2.366357248 | 2.06556106 | 1.962935314 |
| BS335100 | Electric lighting equipment manufacturing | 2.183962244 | 2.301171752 | 2.06556106 | 1.962935314 |
| BS335200 | Household appliance manufacturing | 1.317590725 | 2.549413434 | 2.06556106 | 1.962935314 |
| BS335300 | Electrical equipment manufacturing | 2.743446768 | 2.503882283 | 2.06556106 | 1.962935314 |
| BS335900 | Other electrical equipment and component manufacturing | 2.640906636 | 2.697279255 | 2.06556106 | 1.962935314 |
| BS336110 | Automobile and light-duty motor vehicle manufacturing | 1.022271973 | 3.284526338 | 2.06556106 | 1.962935314 |
| BS336120 | Heavy-duty truck manufacturing | 1.062250899 | 2.983044993 | 2.06556106 | 1.962935314 |
| BS336200 | Motor vehicle body and trailer manufacturing | 1.212265364 | 2.732421639 | 2.06556106 | 1.962935314 |
| BS336310 | Motor vehicle gasoline engine and engine parts manufacturing | 2.400707743 | 2.861175184 | 2.06556106 | 1.962935314 |
| BS336320 | Motor vehicle electrical and electronic equipment manufacturing | 2.527866394 | 2.774152404 | 2.06556106 | 1.962935314 |
| BS336330 | Motor vehicle steering and suspension components (except spring) manufacturing | 2.486383143 | 3.076573432 | 2.06556106 | 1.962935314 |
| BS336340 | Motor vehicle brake system manufacturing | 2.263026827 | 2.829692166 | 2.06556106 | 1.962935314 |
| BS336350 | Motor vehicle transmission and power train parts manufacturing | 2.489324265 | 2.636885647 | 2.06556106 | 1.962935314 |
| BS336360 | Motor vehicle seating and interior trim manufacturing | 2.535510496 | 3.129844292 | 2.06556106 | 1.962935314 |
| BS336370 | Motor vehicle metal stamping | 2.597634519 | 2.769744699 | 2.06556106 | 1.962935314 |
| BS336390 | Other motor vehicle parts manufacturing | 2.377320417 | 2.751755099 | 2.06556106 | 1.962935314 |
| BS336400 | Aerospace product and parts manufacturing | 2.583158814 | 2.39078192 | 2.06556106 | 1.962935314 |
| BS336500 | Railroad rolling stock manufacturing | 1.527567411 | 2.801114614 | 2.06556106 | 1.962935314 |
| BS336600 | Ship and boat building | 1.261869507 | 2.176120496 | 2.06556106 | 1.962935314 |
| BS336900 | Other transportation equipment manufacturing | 2.030994153 | 2.789129145 | 2.06556106 | 1.962935314 |
| BS337100 | Household and institutional furniture and kitchen cabinet manufacturing | 1.463347508 | 2.262457509 | 2.06556106 | 1.962935314 |
| BS337200 | Office furniture (including fixtures) manufacturing | 1.328584824 | 2.356319349 | 2.06556106 | 1.962935314 |
| BS337900 | Other furniture-related product manufacturing | 1.305223216 | 2.519080957 | 2.06556106 | 1.962935314 |
| BS339100 | Medical equipment and supplies manufacturing | 1.883415404 | 2.133692385 | 2.06556106 | 1.962935314 |
| BS339900 | Other miscellaneous manufacturing | 1.767623186 | 2.525858064 | 2.06556106 | 1.962935314 |
| BS411000 | Farm product merchant wholesalers | 2.894967796 | 1.753524288 | 2.06556106 | 1.962935314 |
| BS412000 | Petroleum and petroleum products merchant wholesalers | 2.51290741 | 1.74994155 | 2.06556106 | 1.962935314 |
| BS413000 | Food, beverage and tobacco merchant wholesalers | 1.647277094 | 1.821202165 | 2.06556106 | 1.962935314 |
| BS414000 | Personal and household goods merchant wholesalers | 1.702904199 | 1.840703953 | 2.06556106 | 1.962935314 |
| BS415000 | Motor vehicle and motor vehicle parts and accessories merchant wholesalers | 1.98059621 | 1.865938853 | 2.06556106 | 1.962935314 |
| BS416000 | Building material and supplies merchant wholesalers | 2.466513015 | 1.575480114 | 2.06556106 | 1.962935314 |
| BS417000 | Machinery, equipment and supplies merchant wholesalers | 2.317079945 | 1.562379074 | 2.06556106 | 1.962935314 |
| BS418000 | Miscellaneous merchant wholesalers | 2.887750004 | 1.826596962 | 2.06556106 | 1.962935314 |
| BS419000 | Business-to-business electronic markets, and agents and brokers | 2.471433216 | 1.634032624 | 2.06556106 | 1.962935314 |
| BS441000 | Motor vehicle and parts dealers | 1.399894983 | 1.639248842 | 2.06556106 | 1.962935314 |
| BS442000 | Furniture and home furnishings stores | 1.432829437 | 1.918279415 | 2.06556106 | 1.962935314 |
| BS443000 | Electronics and appliance stores | 1.551116871 | 1.709057223 | 2.06556106 | 1.962935314 |
| BS444000 | Building material and garden equipment and supplies dealers | 2.048772405 | 1.682407146 | 2.06556106 | 1.962935314 |
| BS445000 | Food and beverage stores | 1.230620485 | 1.674768231 | 2.06556106 | 1.962935314 |
| BS446000 | Health and personal care stores | 1.397047685 | 1.720615386 | 2.06556106 | 1.962935314 |
| BS447000 | Gasoline stations | 1.552177554 | 1.588268999 | 2.06556106 | 1.962935314 |
| BS448000 | Clothing and clothing accessories stores | 1.158808069 | 1.85815063 | 2.06556106 | 1.962935314 |
| BS451000 | Sporting goods, hobby, book and music stores | 1.269824633 | 1.746205053 | 2.06556106 | 1.962935314 |
| BS452000 | General merchandise stores | 1.425668876 | 1.675254546 | 2.06556106 | 1.962935314 |
| BS453A00 | Miscellaneous store retailers (except cannabis) | 1.368815936 | 1.787500717 | 2.06556106 | 1.962935314 |
| BS453BL0 | Cannabis stores (licensed) | 1 | 1.820989077 | 2.06556106 | 1.962935314 |
| BS453BU0 | Cannabis stores (unlicensed) | 1 | 1.352668471 | 2.06556106 | 1.962935314 |
| BS454000 | Non-store retailers | 1.460567251 | 1.890797742 | 2.06556106 | 1.962935314 |
| BS481000 | Air transportation | 1.950236154 | 2.30948197 | 2.06556106 | 1.962935314 |
| BS482000 | Rail transportation | 3.018089118 | 1.752637656 | 2.06556106 | 1.962935314 |
| BS483000 | Water transportation | 3.461818749 | 2.704830246 | 2.06556106 | 1.962935314 |
| BS484000 | Truck transportation | 3.196480747 | 2.328688361 | 2.06556106 | 1.962935314 |
| BS485100 | Urban transit systems | 1.08013538 | 2.903289846 | 2.06556106 | 1.962935314 |
| BS48A000 | Other transit and ground passenger transportation and scenic and sightseeing transportation | 1.761551649 | 1.809103495 | 2.06556106 | 1.962935314 |
| BS485300 | Taxi and limousine service | 2.205081868 | 2.146842796 | 2.06556106 | 1.962935314 |
| BS486A00 | Crude oil and other pipeline transportation | 3.585395249 | 1.689886804 | 2.06556106 | 1.962935314 |
| BS486200 | Pipeline transportation of natural gas | 2.872476919 | 1.419194066 | 2.06556106 | 1.962935314 |
| BS488000 | Support activities for transportation | 3.198210098 | 2.154839161 | 2.06556106 | 1.962935314 |
| BS491000 | Postal service | 2.512193713 | 1.417474204 | 2.06556106 | 1.962935314 |
| BS492000 | Couriers and messengers | 2.980693729 | 2.129607634 | 2.06556106 | 1.962935314 |
| BS493000 | Warehousing and storage | 3.23032505 | 1.5333092 | 2.06556106 | 1.962935314 |
| BS511110 | Newspaper publishers | 2.545360764 | 2.061483076 | 2.06556106 | 1.962935314 |
| BS5111A0 | Periodical, book and directory publishers | 2.316081105 | 2.071828794 | 2.06556106 | 1.962935314 |
| BS511200 | Software publishers | 2.344516098 | 1.706947223 | 2.06556106 | 1.962935314 |
| BS5121A0 | Motion picture and video industries (except exhibition) | 3.618746545 | 2.696701808 | 2.06556106 | 1.962935314 |
| BS512130 | Motion picture and video exhibition | 1.258560694 | 2.341236859 | 2.06556106 | 1.962935314 |
| BS512200 | Sound recording industries | 2.72306772 | 2.392154459 | 2.06556106 | 1.962935314 |
| BS515100 | Radio and television broadcasting | 2.731872333 | 2.234310871 | 2.06556106 | 1.962935314 |
| BS515200 | Pay and specialty television | 2.860444453 | 2.583441926 | 2.06556106 | 1.962935314 |
| BS517000 | Telecommunications | 1.846446095 | 1.861802768 | 2.06556106 | 1.962935314 |
| BS518000 | Data processing, hosting, and related services | 3.095780466 | 1.789436257 | 2.06556106 | 1.962935314 |
| BS519000 | Other information services | 2.999711712 | 1.971091502 | 2.06556106 | 1.962935314 |
| BS521000 | Monetary authorities - central bank | 2.155852638 | 1.604028931 | 2.06556106 | 1.962935314 |
| BS5221A0 | Banking and other depository credit intermediation | 2.201661669 | 1.436930524 | 2.06556106 | 1.962935314 |
| BS522130 | Local credit unions | 1.857049179 | 1.76063294 | 2.06556106 | 1.962935314 |
| BS522200 | Non-depository credit intermediation | 2.275768202 | 2.08619845 | 2.06556106 | 1.962935314 |
| BS522300 | Activities related to credit intermediation | 2.605612524 | 1.908661463 | 2.06556106 | 1.962935314 |
| BS52A000 | Financial investment services, funds and other financial vehicles | 1.982273415 | 2.22700826 | 2.06556106 | 1.962935314 |
| BS524100 | Insurance carriers | 2.038949873 | 1.967532972 | 2.06556106 | 1.962935314 |
| BS524200 | Agencies, brokerages and other insurance related activities | 3.033028752 | 1.602554508 | 2.06556106 | 1.962935314 |
| BS531100 | Lessors of real estate | 1.761790219 | 1.678017963 | 2.06556106 | 1.962935314 |
| BS531A00 | Offices of real estate agents and brokers and activities related to real estate | 1.377028292 | 1.964468427 | 2.06556106 | 1.962935314 |
| BS5311A0 | Owner-occupied dwellings | 1 | 1.215401435 | 2.06556106 | 1.962935314 |
| BS532100 | Automotive equipment rental and leasing | 2.88867017 | 1.764119001 | 2.06556106 | 1.962935314 |
| BS532A00 | Rental and leasing services (except automotive equipment) | 2.697612379 | 1.835006813 | 2.06556106 | 1.962935314 |
| BS533000 | Lessors of non-financial intangible assets (except copyrighted works) | 3.091084577 | 1.941166946 | 2.06556106 | 1.962935314 |
| BS541100 | Legal services | 2.454257133 | 1.541439867 | 2.06556106 | 1.962935314 |
| BS541200 | Accounting, tax preparation, bookkeeping and payroll services | 2.818959098 | 1.604330053 | 2.06556106 | 1.962935314 |
| BS541300 | Architectural, engineering and related services | 2.672584742 | 1.669929512 | 2.06556106 | 1.962935314 |
| BS541400 | Specialized design services | 2.800818399 | 1.851879236 | 2.06556106 | 1.962935314 |
| BS541500 | Computer systems design and related services | 2.483125772 | 1.72579918 | 2.06556106 | 1.962935314 |
| BS541600 | Management, scientific and technical consulting services | 3.087912365 | 1.660759332 | 2.06556106 | 1.962935314 |
| BS541700 | Scientific research and development services | 1.545582645 | 1.634196153 | 2.06556106 | 1.962935314 |
| BS541800 | Advertising, public relations, and related services | 2.905839895 | 1.851970518 | 2.06556106 | 1.962935314 |
| BS541900 | Other professional, scientific and technical services | 2.715500181 | 1.875023397 | 2.06556106 | 1.962935314 |
| BS551113 | Holding companies | 3.382238162 | 1.792994435 | 2.06556106 | 1.962935314 |
| BS561100 | Office administrative services | 3.110863264 | 1.601466842 | 2.06556106 | 1.962935314 |
| BS561A00 | Facilities and other support services | 3.203380793 | 1.684076754 | 2.06556106 | 1.962935314 |
| BS561300 | Employment services | 3.323992394 | 1.698223067 | 2.06556106 | 1.962935314 |
| BS561400 | Business support services | 3.036092668 | 1.692571305 | 2.06556106 | 1.962935314 |
| BS561500 | Travel arrangement and reservation services | 2.325628698 | 1.778639749 | 2.06556106 | 1.962935314 |
| BS561600 | Investigation and security services | 2.650985996 | 1.55436338 | 2.06556106 | 1.962935314 |
| BS561700 | Services to buildings and dwellings | 2.800997596 | 1.926784769 | 2.06556106 | 1.962935314 |
| BS562000 | Waste management and remediation services | 2.768269943 | 1.857747883 | 2.06556106 | 1.962935314 |
| BS610000 | Educational services | 1.922583551 | 1.841697227 | 2.06556106 | 1.962935314 |
| BS621100 | Offices of physicians | 2.096082738 | 1.494762218 | 2.06556106 | 1.962935314 |
| BS621200 | Offices of dentists | 1.075342466 | 1.691738543 | 2.06556106 | 1.962935314 |
| BS621A00 | Miscellaneous ambulatory health care services | 1.691407954 | 1.345311676 | 2.06556106 | 1.962935314 |
| BS623000 | Nursing and residential care facilities | 1.280134014 | 1.441182723 | 2.06556106 | 1.962935314 |
| BS624000 | Social assistance | 1.324351087 | 1.931823438 | 2.06556106 | 1.962935314 |
| BS71A000 | Performing arts, spectator sports and related industries, and heritage institutions | 2.122253723 | 1.980222175 | 2.06556106 | 1.962935314 |
| BS713A00 | Amusement and recreation industries | 1.505086366 | 1.935106969 | 2.06556106 | 1.962935314 |
| BS713200 | Gambling industries | 1.258424792 | 2.141099927 | 2.06556106 | 1.962935314 |
| BS721100 | Traveller accommodation | 1.862827496 | 1.868365846 | 2.06556106 | 1.962935314 |
| BS721A00 | Recreational vehicle (RV) parks, recreational camps, and rooming and boarding houses | 1.18109991 | 1.782818916 | 2.06556106 | 1.962935314 |
| BS722000 | Food services and drinking places | 1.455530141 | 2.262937238 | 2.06556106 | 1.962935314 |
| BS811100 | Automotive repair and maintenance | 1.916562472 | 1.820699746 | 2.06556106 | 1.962935314 |
| BS811A00 | Repair and maintenance (except automotive) | 2.521933581 | 1.768311236 | 2.06556106 | 1.962935314 |
| BS812A00 | Personal care services and other personal services | 1.358121266 | 1.868668497 | 2.06556106 | 1.962935314 |
| BS812200 | Funeral services | 1.061785917 | 1.980366254 | 2.06556106 | 1.962935314 |
| BS812300 | Dry cleaning and laundry services | 1.780817209 | 1.958142369 | 2.06556106 | 1.962935314 |
| BS813000 | Business, professional and other membership organizations | 2.95257563 | 1.77965562 | 2.06556106 | 1.962935314 |
| BS814000 | Private households | 2.06556106 | 1.962935314 | ||
| NP610000 | Educational services | 1.18702669 | 1.655733356 | 2.06556106 | 1.962935314 |
| NP621000 | Ambulatory health care services | 1.325115344 | 1.807066957 | 2.06556106 | 1.962935314 |
| NP624000 | Social assistance | 1.205883381 | 1.565681522 | 2.06556106 | 1.962935314 |
| NP710000 | Arts, entertainment and recreation | 1.240480382 | 1.999244994 | 2.06556106 | 1.962935314 |
| NP813100 | Religious organizations | 1.150958985 | 1.555470617 | 2.06556106 | 1.962935314 |
| NP813A00 | Grant-making, civic, and professional and similar organizations | 1.096574213 | 1.998799495 | 2.06556106 | 1.962935314 |
| NP999999 | Other non-profit institutions serving households | 1.127254852 | 2.188129558 | 2.06556106 | 1.962935314 |
| GS611100 | Elementary and secondary schools | 1.019980799 | 1.252170529 | 2.06556106 | 1.962935314 |
| GS611200 | Community colleges and C.E.G.E.P.s | 1.164229511 | 1.480707868 | 2.06556106 | 1.962935314 |
| GS611300 | Universities | 1.109475349 | 1.405546929 | 2.06556106 | 1.962935314 |
| GS611A00 | Other educational services | 1 | 1.550903949 | 2.06556106 | 1.962935314 |
| GS622000 | Hospitals | 1.104193127 | 1.639294664 | 2.06556106 | 1.962935314 |
| GS623000 | Nursing and residential care facilities | 1.046789994 | 1.415687669 | 2.06556106 | 1.962935314 |
| GS911100 | Defence services | 1.01432046 | 1.642387843 | 2.06556106 | 1.962935314 |
| GS911A00 | Other federal government services (except defence) | 1.163945433 | 1.64653794 | 2.06556106 | 1.962935314 |
| GS912000 | Other provincial and territorial government services | 1.116873546 | 2.080145417 | 2.06556106 | 1.962935314 |
| GS913000 | Other municipal government services | 1.269447966 | 1.608579275 | 2.06556106 | 1.962935314 |
| GS914000 | Other aboriginal government services | 1 | 1.967790869 | 2.06556106 | 1.962935314 |
| PRM100000 | Taxes on products | #N/A | #N/A | 2.06556106 | 1.962935314 |
| PRM200000 | Subsidies on products | #N/A | #N/A | 2.06556106 | 1.962935314 |
| PRM300000 | Subsidies on production | #N/A | #N/A | 2.06556106 | 1.962935314 |
| PRM400000 | Taxes on production | #N/A | #N/A | 2.06556106 | 1.962935314 |
| PRM500000 | Wages and salaries | #N/A | #N/A | 2.06556106 | 1.962935314 |
| PRM600000 | Employers' social contributions | #N/A | #N/A | 2.06556106 | 1.962935314 |
| PRM700000 | Gross mixed income | #N/A | #N/A | 2.06556106 | 1.962935314 |
| PRM800000 | Gross operating surplus | #N/A | #N/A | 2.06556106 | 1.962935314 |
| TOTAL | Total | #N/A | #N/A | 2.06556106 | 1.962935314 |
The average GVC positioning for all Canadian industries has an upstream measure of 2.07, and a downstream measure of 1.96.Footnote 6 This means that on average, it takes four production stages to convert value-added activities into final goods. While the averages are quite similar for upstreamness and downstreamness—as stated earlier, without the open economy adjustment they would be the exact same—the upstream measure has a wider spread than the downstream measure. The weighted standard deviation for upstreamness is just over 1, while the standard deviation for downstreamness is just over 0.2.Footnote 7
There is a wider spread on the outputs produced by industries (the upstreamness) than the inputs consumed by industries (the downstreamness). Some industries produce outputs that will, on average, take 6 to 7 more steps to become final goods; however, other industries will produce outputs that are consumed right away. The inputs to industries have a shorter span. No industry has only value added activities, thus no industry has a downstream score of exactly one; concurrently, no industry has inputs with a downstream score higher than 3.3.Footnote 8 The reason is that industries are classified by what is produced, rather than what is consumed. Some industries will produce a single good or service, which leads to some industries having more extreme upstream scores. However, each industry will use several intermediate inputs, thus creating more centred downstream scores.
The industries that are below and to the left of the average (the large black dot and dashed lines) have the shortest value chains and will have the least spillovers to other industries if they experience a shock or disruption. These are largely services that operate independently of other industries. While the spillovers may be minimal, many of the industries are important for the economy and society, such as hospitals, where most of the inputs are value-added activities and most of the outputs are consumed as final goods. Consequently, a disruption to hospitals is unlikely to have many spillovers into supply chains.Footnote 9 Of the 234 industries that are in the IO tables, 50 of them, representing 31.1% of the value in the Canadian economy, are in the bottom left quadrant. These industries have the shortest GVCs and rank low on both upstreamness and downstreamness.
The industries that are in the bottom-right (below average upstreamness, above average downstreamness) of figure 5 are downstream industries at the end of a GVC. These are mainly manufacturing and construction industries where the inputs have already been through at least two stages of production, and the outputs have fewer than two stages left to produce a final good. The most downstream industries are auto and food manufacturing industries. Both autos and food use inputs that go through multiple stages of production first, and both will have a high proportion of final goods as their output. These industries are vulnerable to supply shocks, and shocks to these industries will cause demand shocks up the value chain. The exact interpretation of downstreamness is the total number of backwards linkages for an industry. The more backwards linkages, the higher the chance to be hit with a supply disruption, and at the same time, create a demand disruption for multiple industries further upstream. For example, if there is a negative supply shock (for example, a semi-conductor shortage) to the automobile and light-duty motor vehicle manufacturing industry, a negative demand shock for various motor-vehicle parts manufacturing industries would ensue. That would have a ripple effect to other manufacturing industries, and eventually a negative demand shock for various upstream industries that process raw materials and mining. Some 53 industries, representing 25.1% of the value in the Canadian economy, are in the bottom right quadrant that are downstream industries.
The industries that are in the upper-left (above average upstreamness, below average downstreamness) of the diagram are upstream industries at the start of a GVC. These include a large variety of industries including natural resources, utilities, and some services industries that have not been through many stages of production, but produce intermediate inputs for other industries. The most upstream industries are in the mining sector. These industries are most vulnerable to demand shocks and if these industries experience a disruption, it causes a supply shock down the value chain. The exact interpretation of the upstreamness measure is the total number of forward linkages. The more forward linkages an industry has, the greater the susceptibility to demand shocks while creating supply shocks for other industries further downstream. For example, a disturbance to copper, nickel, lead, and zinc ore mining will cause the intermediate inputs for other industries to become more expensive and/or scarce; this will, in turn, raise prices throughout the value chain and eventually cause final goods to be more expensive. Some 60 industries, representing 24.9% of the value in the Canadian economy, are upstream industries.
The final section are the industries that are in the upper-right of the diagram; these high-upstream, high-downstream industries sit in the middle of complex GVCs. Disruptions to these industries cause supply effects for some industries and demand effects for others. The industry in the top and to the right of figure 5, non-ferrous metal production and processing, is one of the most downstream industries while at the same time being one of the most upstream. The average input into this industry has already been through 3 stages of production, and the outputs of this industry will go through another 6 stages of production before becoming a final good. An interference in this industry would cause a demand disruption for many of the upstream industries such as mining, while simultaneously causing a supply disruption for manufacturing industries. Some 71 industries, representing 18.9% of the value in the Canadian economy, are both high upstream and high downstream industries.
Interestingly, industries that have both high upstream and high downstream measures have the highest total amount of industries (71), whereas industries that have both low upstream and low downstream measures have the lowest number of industries (50). However, the opposite is true when it comes to value; the high upstream and downstream industries represent 18.9% of the value in the Canadian economy, while the low upstream and downstream industries represent 31.1% of the value in the Canadian economy. The reason is due to the fact that services, which tend to fall into the neither upstream nor downstream category, are some of the largest industries with a wide range of activities. Products and industries tend to be classified by what is produced; this makes for easy classification when it comes to goods industries—it’s easy to differentiate between the process that makes auto and truck suspension components and auto and truck brake components. Thus, many goods industries produce a homogenous good (particularly those at the beginning or end of value chains) and are resultantly smaller. However, for services, what is produced is harder to track since there is no physical good. Consequently, this leads to larger and more heterogeneous industries.Footnote 10 Of the 10 largest industries by value, 9 of them are in service industries that would not typically belong to a value chain, or classified as inputs in an IO table (e.g. owner-occupied dwellings, other provincial government services, etc.). This is seen more easily in figure 6, which aggregates from figure 5 using industry share of value.

Figure 6 - Text version
| Upstream | Downstream | Size | |
|---|---|---|---|
| Agriculture and forestry | 2.82 | 2.36 | $ 100,104,894.00 |
| Mining, oil and gas | 3.94 | 1.83 | $ 207,992,641.00 |
| Utilities | 2.52 | 1.56 | $ 61,916,376.00 |
| Construction | 1.28 | 2.13 | $ 354,156,554.00 |
| Manufacturing | 2.60 | 2.64 | $ 761,246,021.00 |
| Government Services | 1.13 | 1.67 | $ 591,807,389.00 |
| Services | 2.03 | 1.77 | $1,988,161,840.00 |
Of note, figure 5 and figure 6 have similarities to previous work on supply chain vulnerability done by the Office of the Chief Economist. (Boileau and Sydor, 2020) In their paper, Boileau and Sydor attempt to measure the vulnerability of Canadian industries to potential supply and demand disruptions. While the analyses share some commonalities, the methodologies are distinct. Ultimately the goal of the previous paper was to classify the vulnerability of industries, whereas this paper attempts to classify where industries fit into supply chains.
4. Results for Canadian trade
One of the main tasks of this paper is to characterize how Canada fits into GVCs—does Canada specialize in activities that are closer to the beginning or end of the value chain. In order to make this characterization, Canada’s international trade is examined. To begin, figure 7 displays an aggregate upstream and downstream position for production, exports, and imports, using a weighted average.
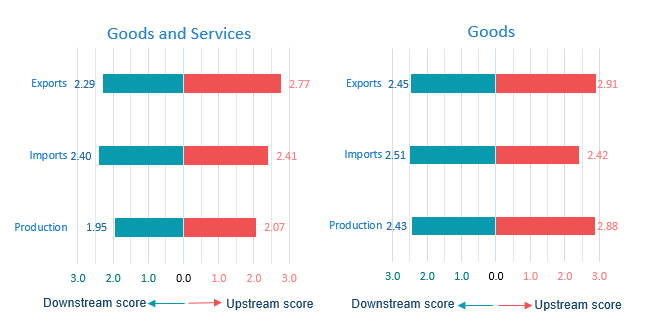
Figure 7 - Text version
| Overall upstream | Overall downstream | Import Upstream | Import downstream | Export upstream | Export downstream | |
| Goods share | ||||||
| Goods & Services | 2.07 | 1.95 | 2.41 | 2.40 | 2.77 | 2.29 |
| Goods | 2.88 | 2.43 | 2.42 | 2.51 | 2.91 | 2.45 |
| Services | 1.77 | 1.78 | 2.35 | 1.89 | 2.37 | 1.83 |
| Production | Imports | Exports |
The first noteworthy feature of the above graphs is that Canadian production of goods and services has a much shorter supply chain than Canadian trade. The reason is that services have shorter value chains (see figure 6) and make up the majority of Canadian production. Goods industriesFootnote 11 make up only 26% of Canadian production even though they make up 83% of imports and 74% of exports. Thus, the increased share of goods makes it natural for Canadian international trade to have longer value chains than Canadian production. Excluding services, Canadian production has a similar supply chain positioning and length to exports.
The next important finding is that Canadian exports are, on average, in the early parts of the supply chain, while Canadian goods imports come from the later stages of the supply chain. Canadian goods exports have an upstream score of 2.91, while having a downstream score of 2.45. This means that, on average, Canadian exports will go through more production stages once they leave the country than they had been through prior to export. Put differently, most of the production stages will happen once the goods leave Canada. Goods imports are more balanced—the downstream score is only 0.1 higher than the upstream score. Although this range is much narrower for imports than for exports, it still means that the majority of the production occurs prior to the imports arriving in Canada
Another way of examining Canadian trade is to compare the scores for exports and imports. While the downstream scores are similar (only marginally higher for imports), exports are more upstream than imports. There are two implications from this; the first implication is derived from the definitions of upstreamness and downstreamness: Canadian imports are closer to final goods than Canadian exports. Again, this implies that Canada specializes in the early stages of the value chains. The second is that given the similarity of the downstream score, the larger upstream score implies that Canadian exports tend to be involved in longer value chains and conversely, Canadian imports come from shorter value chains.
Building on the evidence presented in figure 7, figure 8 shows the positioning of Canadian trade with its major trade partners: the U.S., China, the European Union (excluding the United Kingdom, the EU-27), Mexico, and the rest of the world (ROW). This suggests that Canada’s specialization in the early parts of the supply chain are not due to any particular trade relationship, but rather a feature of Canadian trade in general.
Canadian exports have a similar upstream and downstream scores that does not vary much by destination. The downstreamness index has a narrow range of only 2.1 (EU) to 2.4 (Mexico). The upstreamness index also has only a slightly broader range of 2.7 (U.S.) to a high of 3.1 (rest of the world—the grouping of countries that are not the U.S., EU-27, China, or Mexico partners). This means that exports will require more production steps after being exported than they went through prior to being exported. In other words, Canadian exports to all destinations are generally at the beginning of the supply chain.
On the import side, the upstreamness and downstreamness measures tell different stories. The downstream measure is largely the same across origins, with the range being less than 0.2. However, the upstream measure for imports varies more than the three other measures (import and export downstreamness, and export upstreamness). This may indicate that not all Canadian imports are similar. The imports from Mexico and China are much less upstream (i.e. closer to a final good) than the imports from the U.S. and the rest of the world. China historically has been known as the place of final assembly across Asia, and thus it is expected that Canadian imports from China would contain more final goods (Fang et al. 2010). For Mexico, the key driver for the low upstream measure is the autos trade. While Mexico and Canada are both apart of the integrated North American auto production process, Mexico does much of the final assembly, and thus exports many final goods (Klier & Rubenstein 2017). On the other hand, imports from the U.S. and the rest of the world are more upstream (in fact, more upstream than downstream), indicating that Canada uses many of these imports for further production.
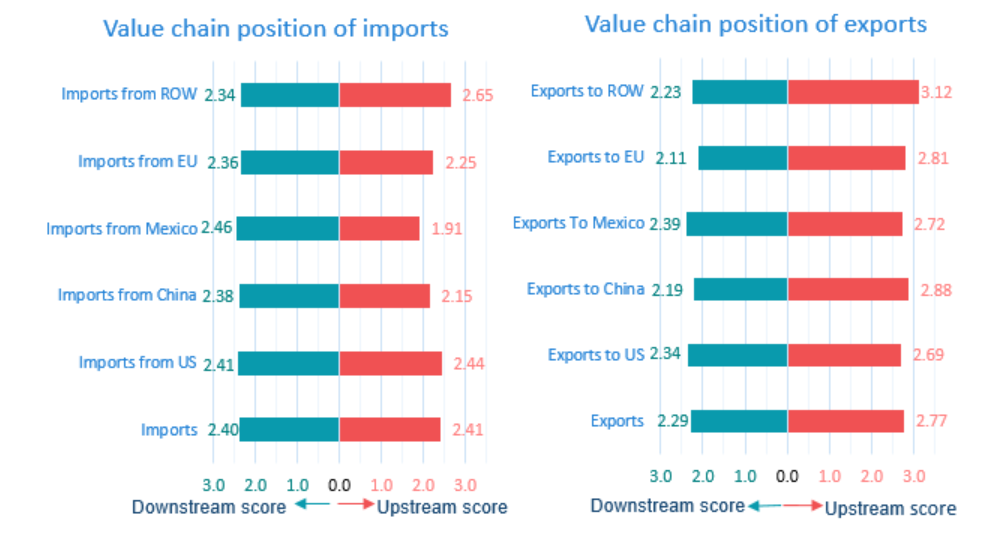
Figure 8 - Text version
| Upstreamness | Downstream | Downstreamness | |
|---|---|---|---|
| Overall | 2.065561 | 1.951852 | -1.95185 |
| Imports | 2.410709 | 2.396357 | -2.39636 |
| Imports from US | 2.438315 | 2.406339 | -2.40634 |
| Imports from China | 2.15041 | 2.38247 | -2.38247 |
| Imports from Mexico | 1.912343 | 2.463016 | -2.46302 |
| Imports from EU | 2.246564 | 2.35629 | -2.35629 |
| Imports from ROW | 2.649954 | 2.336203 | -2.3362 |
| Exports | 2.770931 | 2.293868 | -2.29387 |
| Exports to US | 2.693764 | 2.33795 | -2.33795 |
| Exports to China | 2.875192 | 2.193513 | -2.19351 |
| Exports To Mexico | 2.720074 | 2.391734 | -2.39173 |
| Exports to EU | 2.809331 | 2.108257 | -2.10826 |
| Exports to ROW | 3.118857 | 2.230808 | -2.23081 |
Based on the narrow range of value chain positioning, it would seemingly be plausible that similar products are traded. However, this would be an erroneous conclusion as the exports and imports are different for each market, despite having proximate upstream and downstream values. To explore the idea of similarity, the Finger-Kreinin (1979) similarity index is used. The details of the index can be found in the appendix, and the results can be found in figure 9. In the table, the upper triangular blue matrix are the results for the import similarity, and the lower triangular pink matrix are the results for the export similarity. As a guideline, anything below 0.67 is not similar, and anything above 0.67 is a similar.
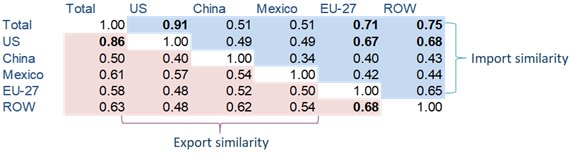
Contrary to the upstream and downstream analysis in figure 7, the industries that Canada imports from are slightly more similar than the types of industries from which Canada exports. Only two pairs (the U.S. and total, and EU-27 and ROW) have similar exports, whereas there are five pairs of similar imports. The main takeaway is not that Canadian imports across different origins are similar, but rather Canadian exports to different destinations are dissimilar.
While the export industries vary by destination, the upstream and downstream export scores are comparable across destinations. In other words, the products Canada exports to its major trading partners are different, but the role Canada plays in the supply chain is similar. This suggests that it is not the case that Canada specializes in specific products that are located at the beginning of the supply chain, but rather, Canada specializes in early supply chain activities.
Canada’s specialization in the early value chain activities implies that Canadian exports are more exposed to demand shocks than supply shocks. This is not to say that supply shocks cannot cause problems for Canadian industries—returning to the industry analysis in figure 5 and 6, all industries use some intermediate goods—but in general, there’s more potential for there to be downstream problems rather than upstream problems for Canadian exports. The COVID-19 pandemic is a good illustration to highlight Canada’s vulnerabilities. There was (or still is) a supply issue of securing enough semi-conductors which has led to slowdowns in many industries—particularly the auto industry. But in general, most of the supply issues have been for consumer goods while it has been domestic factors (notably plant closures to protect workers’ health) that has restricted Canadian exports more than any upstream import factors.
5. Changes in the value chain positioning over time
The next objective of this paper is to determine how Canada’s supply chain positioning has changed over time. In order to determine the dynamics of Canada’s value chain positioning, the Canadian IO tables from 1997-2019 are used. IO tables have changed over the years, but the figures in this section use both the most current and the 1961 link that is comparable across all the years.Footnote 13 Figure 10 has the results for production.Footnote 14
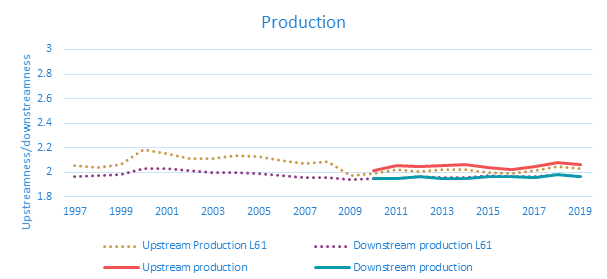
Figure 10 - Text version
| Year | Upstream production | Downstream production | Upstream Production L61 | Downstream production L61 |
|---|---|---|---|---|
| 1997 | 2.052368 | 1.96496 | ||
| 1998 | 2.040677 | 1.973754 | ||
| 1999 | 2.063947 | 1.982313 | ||
| 2000 | 2.181081 | 2.031535 | ||
| 2001 | 2.148402 | 2.033965 | ||
| 2002 | 2.114286 | 2.017359 | ||
| 2003 | 2.109613 | 1.998667 | ||
| 2004 | 2.133451 | 1.997454 | ||
| 2005 | 2.124599 | 1.986915 | ||
| 2006 | 2.099149 | 1.973743 | ||
| 2007 | 2.072368 | 1.953419 | ||
| 2008 | 2.086246 | 1.955894 | ||
| 2009 | 1.970784 | 1.937937 | ||
| 2010 | 2.01502 | 1.948295 | 1.98851 | 1.951664 |
| 2011 | 2.052181 | 1.948191 | 2.017935 | 1.952592 |
| 2012 | 2.042345 | 1.962459 | 2.006087 | 1.967972 |
| 2013 | 2.052839 | 1.952023 | 2.021133 | 1.956189 |
| 2014 | 2.066442 | 1.948776 | 2.019107 | 1.955458 |
| 2015 | 2.04214 | 1.968422 | 2.001193 | 1.97501 |
| 2016 | 2.024537 | 1.964143 | 1.98868 | 1.968009 |
| 2017 | 2.049934 | 1.958005 | 2.011476 | 1.960806 |
| 2018 | 2.080502 | 1.97842 | 2.042379 | 1.983365 |
| 2019 | 2.065561 | 1.962935 | 2.027306 | 1.968216 |
If the late 1990s are excluded from the sample, then it would be viable to say that the measures have trended downwards (indicating shorter value chains), if only slightly. This would likely be attributable to the increasing amount of services that are present in the economy. However, with those 3 years in the late 1990s included, figure 9 shows that Canada’s production in 2019 is fairly similar to what it was in the late 1990s, despite increasing slightly in the early 2000s and decreasing towards the end of that decade.Footnote 15 Next, figure 11 has the results for Canadian imports and exports over time.

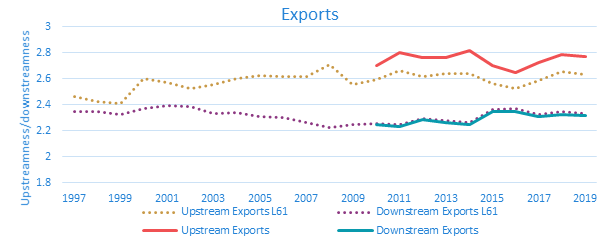
Figure 11- Text version
| Year | Upstream Exports | Downstream Exports | Upstream Exports L61 | Downstream Exports L61 | Upstream imports | Downstream imports | Upstream imports L61 | Downstream imports L61 |
|---|---|---|---|---|---|---|---|---|
| 1997 | 2.465844 | 2.351965 | 2.328859 | 2.372683 | ||||
| 1998 | 2.422833 | 2.348355 | 2.316361 | 2.363843 | ||||
| 1999 | 2.412602 | 2.328825 | 2.333863 | 2.340835 | ||||
| 2000 | 2.598223 | 2.370903 | 2.474356 | 2.433985 | ||||
| 2001 | 2.572156 | 2.393827 | 2.433631 | 2.477576 | ||||
| 2002 | 2.527997 | 2.38319 | 2.38989 | 2.443717 | ||||
| 2003 | 2.553337 | 2.334409 | 2.376117 | 2.410174 | ||||
| 2004 | 2.604059 | 2.342673 | 2.413269 | 2.412442 | ||||
| 2005 | 2.621439 | 2.309948 | 2.393718 | 2.394996 | ||||
| 2006 | 2.614195 | 2.29942 | 2.364844 | 2.388552 | ||||
| 2007 | 2.613612 | 2.262457 | 2.326699 | 2.361469 | ||||
| 2008 | 2.708647 | 2.222661 | 2.35677 | 2.364803 | ||||
| 2009 | 2.556023 | 2.247745 | 2.267516 | 2.352607 | ||||
| 2010 | 2.705172 | 2.248785 | 2.591745 | 2.259898 | 2.351914 | 2.336354 | 2.297897 | 2.357903 |
| 2011 | 2.802975 | 2.234569 | 2.66362 | 2.244884 | 2.409397 | 2.336092 | 2.342796 | 2.358842 |
| 2012 | 2.761184 | 2.284401 | 2.617315 | 2.297647 | 2.402211 | 2.361436 | 2.333625 | 2.391315 |
| 2013 | 2.760201 | 2.267538 | 2.637667 | 2.27889 | 2.37692 | 2.360312 | 2.32936 | 2.383776 |
| 2014 | 2.814699 | 2.250902 | 2.643952 | 2.264014 | 2.424325 | 2.379293 | 2.347889 | 2.408602 |
| 2015 | 2.70333 | 2.344692 | 2.56337 | 2.364356 | 2.396656 | 2.410122 | 2.333523 | 2.44363 |
| 2016 | 2.650417 | 2.351743 | 2.524124 | 2.369031 | 2.383474 | 2.409631 | 2.325556 | 2.435202 |
| 2017 | 2.721139 | 2.311921 | 2.589275 | 2.328611 | 2.384982 | 2.403591 | 2.329252 | 2.427787 |
| 2018 | 2.78589 | 2.325511 | 2.654446 | 2.344905 | 2.423394 | 2.430048 | 2.370339 | 2.458726 |
| 2019 | 2.770931 | 2.316028 | 2.630826 | 2.332947 | 2.410709 | 2.416582 | 2.354543 | 2.445508 |
The positioning and dynamics of Canadian exports and Canadian imports tell two very different stories. For Canadian imports, the upstream and downstream position is more or less the same, and there has been very little movement in the measures since 1997. Canadian exports, on the other hand, have a sizeable gap between their upstream and downstream measures, which has widened over the last 20 years. This means Canadian exports can be expected to go through more stages of production outside of Canada than the number of production stages that they have been through preparing to be exported.
The dynamics for exports have a clean story—and for people familiar with Canadian trade, an expected narrative. Most of the dynamics for exports have to do with a growing share of oil and gas extraction, coupled with a shrinking share in manufacturing. Between 2001 and 2008, the share of oil and gas extraction in exports increased 8.9 percentage points (p.p.), from 8.2% to 17.2%. Oil and gas extraction also became slightly more downstream (going from 1.6 to 1.4) while maintaining the same upstreamness score of 3.6. Conversely, motor vehicle manufacturing lost export share, decreasing from 13.2% of exports in 2001 to 6.9% of exports in 2008. It became slightly more downstream (going from 3.1 to 3.3) while also becoming slightly less upstream (1.2 to 1.1). Thus, this is the case of an upstream industry gaining share while a downstream industry lost share. The narrative also fits other dynamics of the graph—the price of oil plunged at the end of 2014 and beginning of 2015 causing a short recession in Canada. On the graph, this corresponds to the sudden decrease in upstreamness and increase in downstreamness. Since then, oil prices have somewhat recovered, but are still not back to the level observed in the early 2010’s.
Lastly, the IO tables do not have detail on Canada’s major trading partners prior to 2010, but the dynamics can still be assessed for the 2010s.Footnote 16 Figure 12 has the dynamics for the U.S., China, Mexico, and the R.O.W.
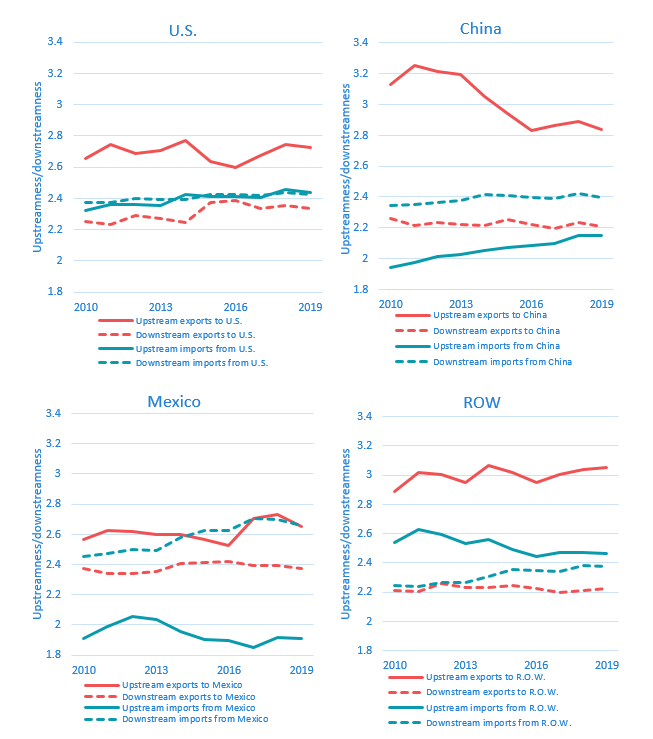
Figure 12 - Text version
| Year | Upstream exports to U.S. | Downstream exports to U.S. | Upstream imports from U.S. | Downstream imports from U.S. | Upstream exports to China | Downstream exports to China | Upstream imports from China | Downstream imports from China | Upstream exports to Mexico | Downstream exports to Mexico | Upstream imports from Mexico | Downstream imports from Mexico | Upstream exports to R.O.W. | Downstream exports to R.O.W. | Upstream imports from R.O.W. | Downstream imports from R.O.W. |
|---|---|---|---|---|---|---|---|---|---|---|---|---|---|---|---|---|
| 2010 | 2.656252 | 2.252924 | 2.320752 | 2.375038 | 3.131811 | 2.257471 | 1.940894 | 2.343068 | 2.564782 | 2.374005 | 1.907106 | 2.451987 | 2.885365 | 2.208689 | 2.539857 | 2.243232 |
| 2011 | 2.74291 | 2.23425 | 2.360115 | 2.375151 | 3.25308 | 2.213647 | 1.973582 | 2.349651 | 2.624766 | 2.33961 | 1.986739 | 2.471679 | 3.014894 | 2.206684 | 2.629174 | 2.242712 |
| 2012 | 2.686767 | 2.287139 | 2.361166 | 2.400392 | 3.215888 | 2.232067 | 2.010874 | 2.36251 | 2.620182 | 2.341809 | 2.056524 | 2.500228 | 3.001887 | 2.258434 | 2.597252 | 2.267244 |
| 2013 | 2.708645 | 2.272028 | 2.356569 | 2.393868 | 3.1924 | 2.220273 | 2.027427 | 2.378891 | 2.597019 | 2.352358 | 2.033196 | 2.496093 | 2.952482 | 2.230521 | 2.529922 | 2.266789 |
| 2014 | 2.767383 | 2.245822 | 2.423342 | 2.395362 | 3.049549 | 2.217263 | 2.052949 | 2.413266 | 2.597685 | 2.403496 | 1.95896 | 2.58214 | 3.062742 | 2.232587 | 2.563422 | 2.308444 |
| 2015 | 2.634517 | 2.372703 | 2.413616 | 2.422968 | 2.93942 | 2.250718 | 2.073069 | 2.40724 | 2.566274 | 2.413555 | 1.901721 | 2.628013 | 3.01761 | 2.243195 | 2.488862 | 2.353828 |
| 2016 | 2.596502 | 2.384847 | 2.409054 | 2.425851 | 2.832652 | 2.219448 | 2.084535 | 2.395853 | 2.524205 | 2.419995 | 1.893764 | 2.628526 | 2.952132 | 2.226964 | 2.446765 | 2.348578 |
| 2017 | 2.675366 | 2.337432 | 2.403252 | 2.415619 | 2.863305 | 2.193514 | 2.099481 | 2.388191 | 2.705608 | 2.391734 | 1.852889 | 2.70213 | 3.005663 | 2.200302 | 2.474473 | 2.342967 |
| 2018 | 2.746335 | 2.351373 | 2.456631 | 2.439542 | 2.892404 | 2.235522 | 2.15321 | 2.422427 | 2.728913 | 2.391607 | 1.917966 | 2.695759 | 3.037466 | 2.213135 | 2.47099 | 2.379719 |
| 2019 | 2.72613 | 2.334945 | 2.438315 | 2.423539 | 2.840369 | 2.211275 | 2.15041 | 2.399004 | 2.649505 | 2.375213 | 1.912343 | 2.655973 | 3.050652 | 2.22499 | 2.465816 | 2.378654 |
The dynamics for Canada’s trade with the U.S. and Mexico have been stable for the last 10 years and are the same as described in figure 7: Canada’s exports to both the U.S. and Mexico are more upstream than Canada’s imports, while Canadian imports from Mexico have a low upstream value and a relatively high downstream value. Once again, this is consistent with Canada specializing in the early stages of the value chain. The dynamics of Canada’s trade with the rest of the world are also consistent with Canada moving towards earlier parts of the supply chain: exports have become more upstream, while imports have become less upstream and slightly more downstream.
At any static point in time, Canada’s trade with China fits the narrative of Canada exporting early stages of value chains and importing final goods; however, the dynamics for Canada’s trade with China have changed substantially over the past 10 years. Canadian exports to China have become less upstream than they were at the beginning of the decade, while imports from China have become more upstream. This result is unexpected because it contradicts the recent narrative attached to Chinese trade. For much of the 2000s, China was the final assembly point for many supply chains across Asia and they held a high percentage of foreign content in their exports (see, for example, Scarffe 2020, or Kee and Tang (2016) for firm level evidence). However, the narrative has been changing into one where China is doing more of the value added activities along the supply chain. Chor, Manova, and Yu (2021) calculate Chinese production and trade upstreamness (the same measure presented in this paper) using Chinese IO tables between 1992-2014. They find that while Chinese exports have had a relatively stable upstreamness, Chinese imports have had a sharp rise in their upstreamness. They conclude that China’s role in the supply chain is expanding. This narrative contradicts figure 11 which suggests China’s supply chains are contracting rather than expanding.
Using a shift-share to decompose the change in positioning into within industry effects and between industry effects reveals that the decrease in upstreamness for exports has been driven by changes in export shares between industries, while the increase in upstreamness for imports has been balanced between the two effects. For Canadian exports, there are three industry types driving these results. First, mining and similar industries—particularly non-ferrous metal production and processing—have become a smaller share of Canada’s exports to China. These are upstream industries and the decreasing shares mean that Canadian exports become less upstream. Second, automobile and light-duty motor vehicle manufacturing went from 0.04% of exports in 2010 to 2.5% of Canadian exports to China in 2019. Autos are not upstream and increasing these exports lowers the upstream score of Canadian exports to China. Lastly, university services and other service industries (such as food and drinking places)—which are not upstream nor downstream—are becoming a larger share of Canadian exports to China.
It may be possible to reconcile the decrease in the mining sector exports with Chor et al.; perhaps China is sourcing those imports from other countries or producing more domestically. However, the increasing share of the latter two industries are more difficult to harmonize with Chor et al. The larger share of autos and larger share of service exports are the result of rapidly growing affluence in China. It would be expected that the increase in buying power would affect China’s trade with all countries, instead of being a particular aspect of the Canada-China relationship. The data for Chor et al. stop in 2014 so it is possible that more recent analysis is congruent; however, the trend of increased enrollment by Chinese students at Canadian post-secondary institutions started at least as early as the late 90s and thus thinking that the last 5 year would reveal a different trend is unconvincing. A definitive explanation would require examining China’s multilateral trade patterns and is beyond the scope of this work.
6. Conclusion
The purpose of this paper is to categorize where Canada fits into global value chains. Key findings indicate that Canadian exports are more upstream (outputs are further away from final goods) and less downstream (inputs are closer to value added) than Canadian imports. This is consistent with the notion that Canada specializes in producing goods in the earlier portion of the value chain while importing goods from the end of the value chain. Further supporting this statement is the finding that Canadian exports to all major trading partners (and the rest of the world in aggregate) are more upstream and less downstream than Canadian imports,. Despite the fact that for each trade partner, Canada exports and imports a different set of products. This means that Canadian consumption may be more vulnerable to supply shocks as Canada imports many final goods, while Canadian exports are more vulnerable to demand shocks as Canada’s production happens mainly at the start of the value chain. There are some major industries that produce final goods and are more susceptible to supply shocks (such as the auto industry and manufacturing in general); but in aggregate, most of Canada’s exports are in the earlier portions of supply chains and are more susceptible to demand shocks.
The gap between the upstreamness and downstreamness of Canadian exports has grown since the late 1990s. Most of this happened in the 2000’s due to a growing share of oil and gas extraction—an upstream industry with outputs that are far from a final good—and a diminishing share of auto vehicle manufacturing—a downstream industry where the outputs are largely final goods. Analysis of trade with the U.S., Mexico, and the rest of the world suggest that Canada’s place in the value chain has not changed in the last 10 years. However, contrary to the existing literature, Canada’s exports to China have become less upstream while imports have become more upstream. Whether this is specific to Canada’s trade with China, or an entirely new pattern in Chinese trade is left to future work.
References
Antràs, P., Chor, D., Fally, T., & Hillberry, R. (2012). Measuring the upstreamness of production and trade flows. American Economic Review, 102(3), 412-16.
Antràs, P., & Chor, D. (2018). On the measurement of upstreamness and downstreamness in global value chains (pp. 126-194). Routledge.
Boileau, D., & Sydor, A. (2020). Vulnerability of Canadian Industries to Disruptions in Global Supply Chains. Global Affairs Canada. Ottawa.
Chor, D., Manova, K., & Yu, Z. (2021). Growing like China: Firm performance and global production line position. Journal of International Economics, 130, 103445.
Fang, Tony, Caroline Gunterberg, and Emma Larsson. "Sourcing in an increasingly expensive China: Four Swedish cases." Journal of Business Ethics 97, no. 1 (2010): 119-138.
Finger, J.M. and Kreinin, M.E. (1979) Measure of Export Similarity and Its Possible Uses. Economic Journal, 89, 905-912. http://dx.doi.org/10.2307/2231506
Kee, H.L., Tang, H. (2016). Domestic value added in exports: theory and firm evidence from China. American Economic Review, 106 (6), 1402–1436.
Klier, T., & Rubenstein, J. (2017). Mexico’s growing role in the auto industry under NAFTA: Who makes what and what goes where. Economic perspectives, 41(6),1-29.
Miller, R. E., & Temurshoev, U. (2017). Output upstreamness and input downstreamness of industries/countries in world production. International Regional Science Review, 40(5), 443-475.
Scarffe, C. (2020). The Canada-China Global Commerce Picture and Supply Chain Links. Global Affairs Canada. Ottawa.
Statistics Canada. (2020). Symmetric input-output tables, 2019.
Statistics Canada. (nd). Symmetric input-output tables, 1997-2018.
Appendix
The below network diagram attempts to show how value added turns into a final good, and how the measures of supply chain positioning works. The simple measures of supply chain positioning account only for the share of inputs that are value added, and the share of outputs that are final goods—lines “a.” and “b.”, respectively. The more complex measures attempt to account for all the different industry linkages, specifically, how many productions steps have the intermediate inputs already been through, and how many more production stages the intermediate outputs will go through.
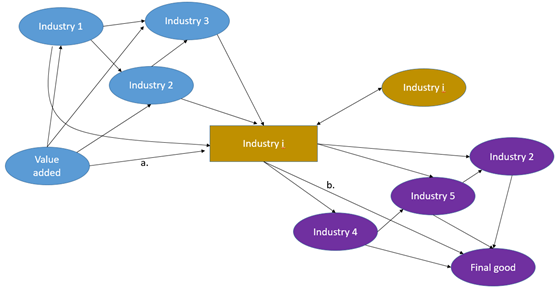
Note: Industry i (the gold box) is downstream from the blue circles and is upstream to the purple circles.
Technical Appendix A: open economy adjustment
This is a rephrasing of the arguments put forth in Antràs et al. (2012). Re-writing equation (1) to include imports, exports, and net inventories:Footnote 17

Text version
Yi is equal to the sum from j of Zij plus Fi plus Xi minus Mi plus Ni
The problem is that in order to construct inter-industry flows, the imports, exports, and net inventories need to be decomposed into the share that becomes final goods, and the share that become intermediate goods. This means that the share of gross output that is used as intermediate inputs in other industries (including cross-border) is:
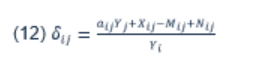
Text version
Deltaji is equal to ajiYj plus Xji minus Mji plus Nji divided by Yi
Xji is equal to deltaji multiplied by Xi
Mji is equal to deltaji multiplied by Mi
Nji is equal to deltaji multiplied by Ni
However, in practice we lack data on inter-industry cross-border flows; additionally we lack data on inter-industry flows of net inventories.Footnote 18 In order to proceed an assumption is made that for each industry i, the share of exports, imports, and net inventories all have the same share of output that are used as intermediate outputs and final outputs. In other words:
Putting these three assumptions into equation (11), the delta matrix becomes:
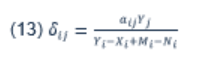
Text version
Deltaji is equal to aji times Yj divided by Yi minus Xi plus Mi minus Ni
Which is equivalent to changing the A matrix to:
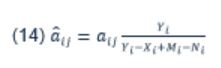
Text version
aji hat is equal to aji multiplied by yi divided by Yi minus Ni plus Mi minus Xi
Technical Appendix B: Finger-Kreinin similarity measure
The Finger-Kreinin (1979) similarity measure uses a simple formula where the product or industry shares are compared to the shares of a different basket. The similarity measure takes the lower of the two shares for each industry, and sums across industries. Letting a and b be vectors with components denoted by subscript i, the similarity between the two vectors can be calculated as:

Text version
S as a function of a and b is equal to the sum from I to N of the minimum of the two elements ai and bi, such that the sum from I to N of ai is equal to one, and the sum from I to N of bi is equal to one.
Thus, if the vectors a and b were identical, the similarity would be one. If there was no overlap between the two vectors, the similarity would be zero.
As a benchmark, a simulation of two vectors of length 234 (the number of Canadian industries) were randomly generated from a uniform distribution, and then a similarity measure was constructed. This simulation was performed 10,000 times using Stata 16. The average similarity measure was 0.67 with a standard deviation of 0.02. Using this as a benchmark, anything below 0.67 is not similar, and anything above 0.67 is a similar.
It is worth noting that the length of the vector is important. As the number of components of the vector increases, the expected share of each component decreases. As the expected share of each component decreases, the expected value of the similarity index also decreases. Thus the use of 0.67 as a benchmark similarity cut-off stated in the paper is only valid when the vectors are of length 234.
- Date modified: