Trade and gender: The Canada-Finland story

Text version - Trade and gender: The Canada-Finland story
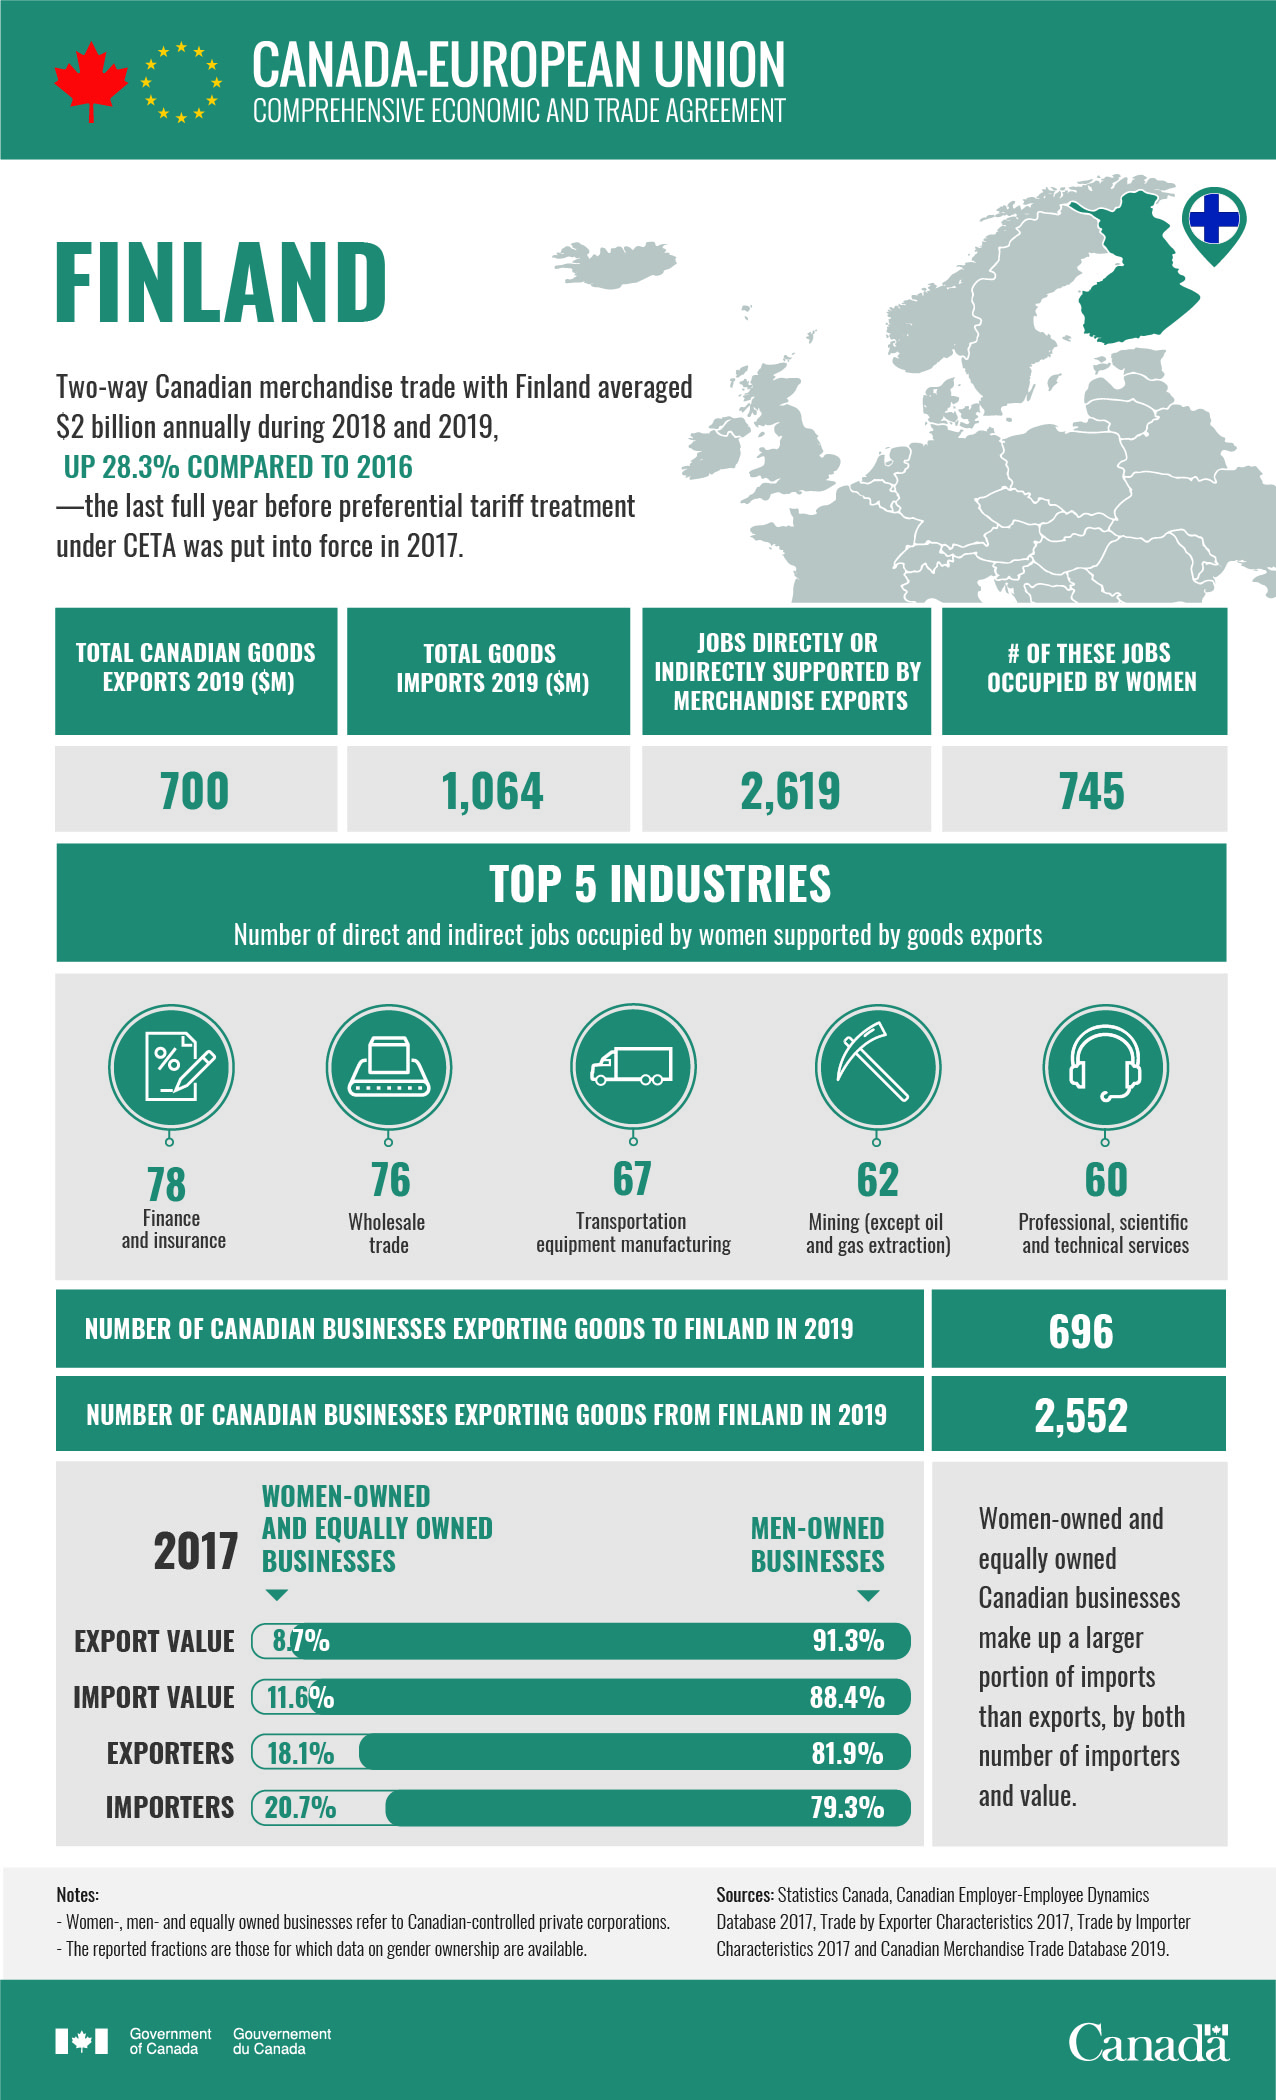
Two-way Canadian merchandise trade with Finland averaged $2 billion annually during 2018 and 2019. This was up 28.3% compared to 2016 — the last full year before preferential tariff treatment under CETA was put into force in 2017.
In 2019, Canada exported $700 million in goods to Finland and imported $1,064 million worth of goods.
In Canada, 2,619 jobs are directly or indirectly supported by merchandise exports to Finland. Women hold 745 of these jobs.
Top 5 industries
Jobs held by women that are directly or indirectly supported by goods exports to Finland:
- Finance and insurance: 78
- Wholesale trade: 76
- Transportation equipment manufacturing: 67
- Mining (except oil and gas extraction): 62
- Professional, scientific and technical services: 60
The number of Canadian businesses exporting goods to the Finland in 2019 was 696, while the number of Canadian businesses importing goods from the Finland was 2,552.
Women-owned and equally owned businesses in 2017:
- Export value: 8.7%
- Import value: 11.6%
- Exporters: 18.1%
- Importers: 20.7%
Men-owned businesses in 2017:
- Export value: 91.3%
- Import value: 88.4%
- Exporters: 81.9%
- Importers: 79.3%
Women-owned and equally owned Canadian businesses make up a larger portion of imports than exports, by both number of importers and value.
Notes: Women-, men- and equally owned businesses refer to Canadian-controlled private corporations. The reported fractions are of those for which data on gender of ownership are available.
Direct jobs: Initial trade transactions support jobs directly.
Indirect Jobs: Additional jobs supported indirectly due to an increase in business-to-business (e.g. supply chain) transactions that result from the initial trade.
Sources: Statistics Canada, Canadian Employer-Employee Dynamics Database 2017, Trade by Exporter Characteristics 2017, Trade by Importer Characteristics 2017 and Canadian Merchandise Trade Database 2019.
- Date modified: