
Trade and Gender: United States
Text version - Trade and Gender: United States
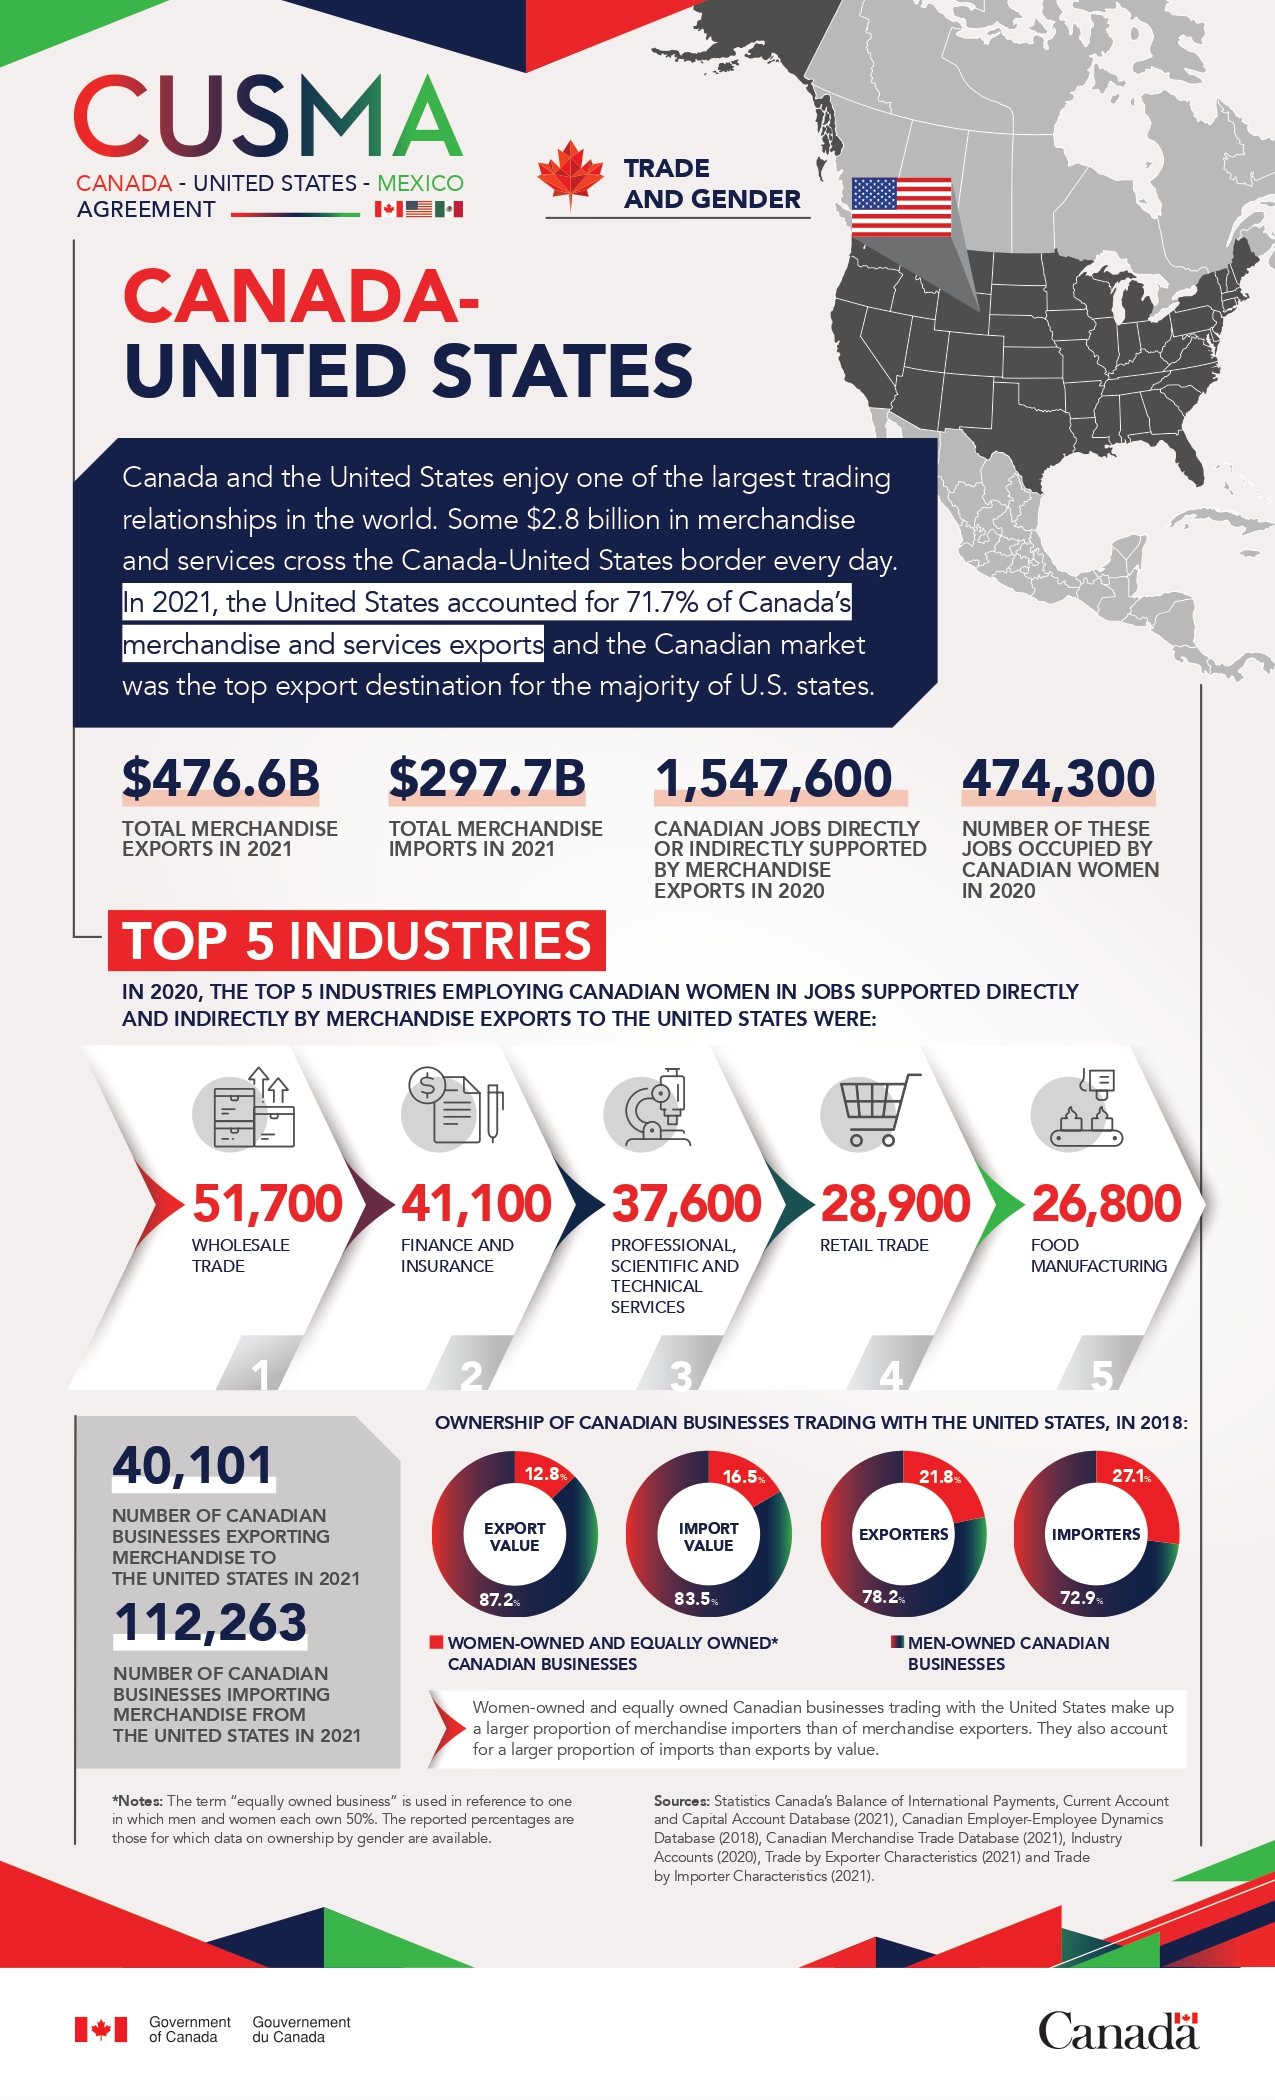
Canada and the United States enjoy one of the largest trading relationships in the world. Some $2.8 billion in merchandise and services cross the Canada-United States border every day. In 2021, the United States accounted for 71.7% of Canada’s merchandise and services exports and the Canadian market was the top export destination for the majority of U.S. states.
In 2021, Canada exported $476.6 billion in merchandise to the United States and imported $297.7 billion worth of merchandise.
In 2020 in Canada, 1,547,600 jobs were directly or indirectly supported by merchandise exports to the United States. Of these, 474,300 were occupied by Canadian women.
Top 5 industries
In 2020, the top 5 industries employing Canadian women in jobs supported directly and indirectly by merchandise exports to the United States were:
- Wholesale trade: 51,700 jobs
- Finance and insurance: 41,100 jobs
- Professional, scientific and technical services: 37,600 jobs
- Retail trade: 28,900 jobs
- Food manufacturing: 26,800 jobs
The number of Canadian businesses exporting merchandise to the United States, in 2021 was 40,101, and the number of Canadian businesses importing merchandise from the United States, in 2021 was 112,263.
Ownership of Canadian Businesses Trading with the United States, in 2018:
Women-owned and equally owned businesses*:
- Export value: 12.8%
- Import value: 16.5%
- Exporters: 21.8%
- Importers: 27.1%
Men-owned businesses:
- Export value: 87.2%
- Import value: 83.5%
- Exporters: 78.2%
- Importers: 72.9%
Women-owned and equally owned Canadian businesses trading with the United States make up a larger proportion of merchandise importers than of merchandise exporters. They also account for a larger proportion of imports than exports by value.
*Notes:
- The term “equally owned business” is used in reference to one in which men and women each own 50%. The reported percentages are those for which data on ownership by gender are available.
Sources: Statistics Canada’s Balance of International Payments, Current Account and Capital Account Database (2021), Canadian Employer-Employee Dynamics Database (2018), Canadian Merchandise Trade Database (2021), Industry Accounts (2020), Trade by Exporter Characteristics (2021) and Trade by Importer Characteristics (2021).
- Date modified: