
Atāmitowin: Identifying and overcoming challenges facing Indigenous exporters
A joint report by the Canadian Council for Indigenous Business and Global Affairs Canada
September 2024
Table of contents
- About the title
- Acknowledgments
- Key messages
- Executive summary
- Chapter 1: Introduction
- Chapter 2: Obstacles to growth
- Chapter 3: Export activity of Indigenous SMEs–motivations and challenges
- Chapter 4: Trade supports and policies to support exporters
- Chapter 5: Case Studies in 3 First Nations communities
- Chapter 6: Conclusion
- Bibliography
- Appendix: Econometric analysis
About the title
Our second report title celebrates the significance of Cree languages—the most widely spoken Indigenous languages in Canada, with over 86,000 speakers in 2021. These languages thrive among First Nations people in the Prairies (Manitoba, Saskatchewan, and Alberta). Cree connects these communities and has facilitated trade and commerce for generations, including trade connections during and after the first contact. Our team explored various English words and phrases—including “relationships,” “reciprocity,” “expansion,” “growth,” and “exchange (over great distances)”—but ultimately, we settled on “trade.” The Cree translation, “Atāmitowin,” captures the essence of this report series, emphasizing the crucial role of language and cultural preservation in economic rejuvenation.
About the cover
The cover design is by Angie Saltman, an Red River Métis artist, who aimed to capture the essence of the Indigenous trade on Turtle Island.
The foundation of the design is a Loon—one of the original clans in Anishinaabe governance.
The Loon represents the diplomat who travels to build working relationships. Similarly, modern entrepreneurs often travel when exporting their goods and services.
Turtle Island includes Canada, the US, and Mexico. It sits at the centre of the design, ready to go in any of the four directions, because they are all a part of the Indigenous economy.
The Killer Whale (Orca) symbolizes family, community, protection, and power and is often used to represent the Pacific Northwest. It is a reminder of the importance of kinship and the history of Indigenous people, even as they move across the land and seas.
On the right of the design, the Caribou represents the Eastern areas of Turtle Island. Caribou travel large distances while remaining together as a group for community, safety, and raising their young. This community reflects the importance of people-to-people connections in Indigenous trade.
The Medicine Wheel central to the design shows the interconnectedness of all our relations. It emphasizes balance, harmony, and respecting all living things while understanding our place in the universe. In this design, black represents water, red is for the land, yellow is for fire, and white (pointing North) is for air.
There’s an Anishinaabe saying that when all nations of the world drum together, we’ll connect as one race and find peace. The artist believes that as Indigenous economies expand through trade and growth, we’ll shift business philosophies globally to the sustainability first mindset and realize we must live in reciprocity with mother earth to sustain a safe place for our children and future generations to enjoy.
Acknowledgments
This study was co-authored by the Canadian Council for Indigenous Business (CCIB) and the Office of the Chief Economist of Global Affairs Canada (GAC). It was also funded by Global Affairs Canada.
The authors are indebted to all the Indigenous entrepreneurs, communities, and councils who have invested valuable time in sharing their experiences with us. We hope the products of our collaborative work will allow them to view these investments as beneficial to Indigenous economies.
The authors thank the project’s Indigenous advisory committee, comprised of First Nations, Métis, and Inuit leaders who provided guidance, advice, and feedback at every stage of the project.
This report was authored by Lucas Alexiou, Cody Lewis, and Andy Avgerinos from CCIB and Jacqueline Palladini and Michelle Zilbergerts from Global Affairs Canada. The authors would like to thank those who reviewed the report, including officials from Crown-Indigenous Relations and Northern Affairs Canada, Indigenous Services Canada, and Global Affairs Canada. Any errors or omissions are those of the authors.
We are thankful for contributions from Big River Analytics and their expertise in weighting the national survey data and their feedback on the survey design, Environics Research Group, who administered the national survey, and the Bank of Canada for their contributions to the survey questionnaire and project funding.
Graphic design and layout were developed by Saltmedia, and copy editing was completed by Kaitlin Littlechild.
As nationwide organizations, both Global Affairs Canada and the CCIB acknowledge that our project was undertaken on many Indigenous lands. We hope to honour this through our work to support the Indigenous Peoples who live, work, and do business on this land.
This work is published under the joint responsibility of Global Affairs Canada and the CCIB. The opinions and arguments expressed do not necessarily reflect the official views of the Government of Canada.
Canadian Council for Indigenous Business
Canadian Council for Indigenous Business (CCIB) is committed to the full participation of Indigenous Peoples in Canada’s economy. As a national, non-partisan association, CCIB has a mission to promote, strengthen, and enhance a prosperous Indigenous economy through the fostering of business relationships, opportunities, and awareness. CCIB offers knowledge, resources, and programs to its members to foster economic opportunities for Indigenous Peoples and businesses across Canada.
CCIB’s work is dedicated to supporting Indigenous economies across Canada and bolstering meaningful and mutually beneficial relationships between Indigenous and non-Indigenous peoples, businesses, and communities. CCIB does this through diverse programming, providing tools, training, network building, major business awards, and national events.
CCIB’s research shows that Indigenous entrepreneurs are motivated by a desire to innovate, expand, and profit from their businesses, with many giving back to their communities. However, they also face unique challenges to their growth and development. A better understanding of these realities by businesses and governments, combined with the skills of Indigenous business owners, creates opportunities for everyone.
For more information, visit www.CCIB.com
Office of the Chief Economist, Global Affairs Canada
The Office of the Chief Economist at Global Affairs Canada (GAC) consists of a team of economists who research and advise on international commerce topics for the benefit of Canadians.
The team provides advice to policymakers and research on current issues, including:
- supply chains
- inclusive trade
- impacts of trade agreements
- foreign direct investment
- performance of Canadian exporting firms
The Office of the Chief Economist supports Global Affairs Canada’s inclusive trade mandate to ensure that the benefits of trade flow to all segments of society. Our inclusive trade research evaluates the impacts of trade on traditionally underrepresented groups such as women, Indigenous Peoples, and racialized people. This includes understanding the export activities of Indigenous entrepreneurs and the challenges they face.
Our work informs Global Affairs Canada trade policies, including the negotiations of free trade agreements and our Trade Commissioner Service programs, which help Canadian businesses succeed in international markets.
Key messages
- The Canadian Council for Indigenous Business (CCIB) and Global Affairs Canada (GAC) partnered to better understand the experiences of Indigenous exporters and the challenges they face using a novel national survey of 2,603 Indigenous businesses, case studies in 3 First Nations communities, and discussions with community economic development officers. The survey and interviews focused on business activity in 2020.
- We co-published a report in September 2023, Adàwe: Export Experiences of Indigenous Entrepreneurs, which found a sizable gap in export propensity in 2020 between Indigenous small and medium-sized enterprises (SMEs) (7.2%) and the average Canadian SME (12.1%).
- Recognizing the benefits of trade, this report investigates the barriers to firm growth and exporting while exploring the supports and policies reported by Indigenous SMEs as being helpful.
- We find that Indigenous SMEs are more likely to report several obstacles to firm growth compared to the average Canadian SME, including labour attraction, regulation, and access to financing.
- Economic conditions were a leading hurdle to firm growth, reported by nearly 2 out of 3 Indigenous SMEs in 2020. More than two-thirds of Indigenous SMEs who reported that they stopped exporting cited the pandemic as their main reason for doing so.
- Geographic factors played a role in determining or exacerbating the most pertinent obstacles to firm growth. Physical and digital infrastructure, access to business advisory, and financing were more prominently reported as obstacles by Indigenous SMEs located in remote regions and those located within Indigenous communities.Footnote 1
- Regarding export obstacles, intellectual property protections, market knowledge, administrative barriers in Canada, financing, and logistics were more pronounced for Indigenous SME exporters than the national average. Border obstacles were also more pronounced challenges for Indigenous SME exporters (40.3%) compared to the national average (31.2%).
- When asked which program supports would be most helpful for exporting, Indigenous SMEs put people-to-people connections—particularly Indigenous-to-Indigenous connections—at the top of the list.
- Indigenous exporters in remote areas and those within Indigenous communities identify help accessing financing as an important tool to support exporting, with 77.4% and 67.4% of Indigenous SME exporters, respectively, identifying financing as very helpful.
- Policies specifically related to bolstering intellectual property protections for businesses incorporating Indigenous Traditional Knowledge into their products or services were among the most significant policy supports cited, particularly among exporters in remote locations, within Indigenous communities, and those that are majority women-owned.
Executive summary
Atāmitowin aims to enhance our understanding of the obstacles facing Indigenous entrepreneurs and exporters. This is the second and final report resulting from a recent partnership between the Canadian Council for Indigenous Business (CCIB) and Global Affairs Canada (GAC).
Our previous report, Adàwe, sought to illuminate the exporting and business activities of Indigenous-owned small and medium-sized enterprises (SMEs). Using a novel national survey of 2,603 Indigenous-owned businesses, Adàwe uncovered an export gap: 7.2% of Indigenous SMEs export compared to the Canadian SME average of 12.1%.Footnote 2
Atāmitowin builds on this work by examining the growth and exporting obstacles that might explain this gap and explores what we heard from Indigenous entrepreneurs themselves about possible supports. A better understanding of obstacles and supports can inform governments and communities serving these businesses, ultimately helping them find international success that benefits Indigenous and non-Indigenous communities at home.
Recognizing the unique business operating environments and challenges that come with locations in remote regions or within Indigenous communities, we enrich our national survey analysis with case studies from 3 First Nations communities, including extensive interviews with businesses and economic development officers (EDOs). Acknowledging that these voices are not always well captured in traditional surveys, special attention is paid to these businesses.
Growth and exporting obstacles
Our national survey and case studies on First Nations reserves investigate challenges and obstacles to business growth for exporters and non-exporters alike, using 2020 as the reference year. Overall, the top 3 obstacles were economic conditions, attracting employees with the right skills or qualifications, and the costs of doing business.
While these 3 obstacles were also reported by Indigenous SMEs located in remote or Indigenous communities, those businesses were relatively more likely to report physical and digital infrastructure gaps, with 30 to 50% of these businesses naming these obstacles, respectively. Furthermore, we found that even when the effects of remoteness are controlled for in the econometric analysis, firms located within Indigenous communities are associated with higher odds of reporting physical and digital infrastructure barriers to growth.
An analysis of export obstacles emphasized the severe impacts of the COVID-19 pandemic on export activity, with 61.5% of Indigenous SME exporters reporting it as a moderate or major obstacle to exporting. Logistical and border obstacles rounded out the top three. While COVID-19 exacerbated these obstacles, logistics and border challenges were also highly reported as export obstacles by Indigenous exporters before the pandemic.
A lack of financing or cash flow was the fourth most reported export obstacle (38.9% of Indigenous SME exporters). It was very highly reported by Indigenous SMEs located in Indigenous communities (59.5%) and by those in remote regions (56.3%). The econometric analysis finds that this challenge is especially pertinent for SMEs in Indigenous communities, which are associated with 1.9 times higher odds of reporting the difficulty as a barrier to export.
Trade programs and policy supports
Our survey and interviews heard from Indigenous entrepreneurs about what trade program and policy supports they would find most beneficial. Businesses overwhelmingly reported people-to-people connections as the leading trade program support. Connections with Indigenous clients and partners topped the list, with around two-thirds of Indigenous SMEs who export or plan to start exporting reporting them as being “very helpful.”
Regarding trade policy, simpler customs procedures topped the list of most helpful supports for current exporters (59.7%) and SMEs that intend to export (56.5%).
Indigenous SMEs in remote regions, Indigenous communities, or those majority-owned by women prioritized supports differently. In general, these businesses put relatively more emphasis on intellectual property protections, help accessing sources of financing, mentorship, and help with marketing plans, among others.
While acknowledging the diversity of experiences among Indigenous-owned SMEs, Atāmitowin proposes 5 general priority areas in supporting Indigenous SMEs on their export journeys:
- Building a skilled workforce:8% of Indigenous SMEs face substantial challenges in finding employees with the right skills and qualifications, and they report this as a challenge at a much higher rate than the average Canadian SME (50.3%).
- Financing and capital: Indigenous SMEs experienced obstacles to accessing financing when growing a business or exporting, and this was particularly pronounced for Indigenous businesses operating within Indigenous communities.
- Physical and digital infrastructure: These obstacles were more pronounced for Indigenous SMEs operating from remote areas or those in Indigenous communities. From road access to reliable internet, many businesses in the First Nations case studies also emphasized the criticality of these needs.
- Intellectual property (IP) protections: Indigenous SME exporters are almost 4 times more likely to report IP protections as a barrier to exporting than the Canadian average. These barriers were reported more prevalently by Indigenous businesses in remote areas, in Indigenous communities, or owned by women.
- People-to-people connections: Indigenous SMEs strongly value supports that help them connect with partners, clients, and customers. Organizations offering supports to exporters should take note of the recommendation for Indigenous-to-Indigenous connections and the importance placed on them.
The research and findings in both Adàwe and Atāmitowin establish an understanding of Indigenous export activity, identify and quantify challenges, and explore important business and policy supports. This work, completed by Global Affairs Canada and CCIB, aims to support Indigenous Peoples’ leadership in growing the Indigenous economy and contributing more broadly to the Canadian economy.
Chapter 1: Introduction
Global Affairs Canada (GAC) and the Canadian Council for Indigenous Business’s (CCIB) Adàwe report highlighted the remarkable achievements of Indigenous SME exporters.
Indigenous SMEs operate across diverse industries, with their products and services reaching markets worldwide, including the United States, the United Kingdom, Australia, and many others. Adàwe also highlighted the role of Indigenous women in narrowing gender gaps within exporting, with Indigenous SME exporters being nearly twice as likely to be majority women-owned compared to the national average.Footnote 3
Despite these achievements, Indigenous businesses continue to face barriers hindering their full potential for export expansion. Adàwe estimated that 7.2% of Indigenous SMEs currently export, which is significantly lower than the national average of 12.1%. This disparity is even more pronounced for firms situated in remote areas or within Indigenous communities.Footnote 4 This gap underscores the need to identify and address the challenges faced by Indigenous SMEs in fully participating in and reaping the benefits of trade.
In this report, we deepen our understanding of the obstacles experienced by Indigenous businesses and the supports they deem important. Building on the findings in Adàwe, we pay special attention to obstacles reported by firms located in remote regions or within Indigenous communities.
This report focuses on several distinct areas of study. Following this introduction, Chapter 2 assesses barriers to business growth for Indigenous exporters and non-exporters alike. In Chapter 3, we explore the barriers Indigenous exporters face in international expansion and what drives firms to begin or stop exporting. Throughout this analysis, we employ both descriptive analyses using survey data as well as econometric analysis to quantify which firm characteristics are statistically associated with obstacles to growth and export. In Chapter 4, we shift our focus from obstacles to supports as we draw on insights from Indigenous firms about which supports they report as useful for exporting.
Recognizing the unique conditions affecting First Nations businesses located on reserve, Chapter 5 features case studies in 3 First Nations communities. This inclusion aims to amplify voices that typical national surveys may not fully capture. Drawing upon insights from interviews, we explore the business environment and challenges facing these firms. We conclude by summarizing the main findings in Chapter 6.
As Indigenous firms contribute to job creation, economic diversification, community development, and the strength of the Canadian economy, our findings carry implications for broader societal well-being. We hope this report offers meaningful insights that can guide the formulation of policies and initiatives aimed at cultivating a more inclusive and equitable economic landscape in Canada, particularly through economic reconciliation.
1.1 Project approach
Our inaugural 2019 co-published report, Indigenous-Owned Exporting Small and Medium Enterprises in Canada, investigated the export experiences of Indigenous SMEs.Footnote 5 This report provided an initial glimpse into the characteristics and challenges faced by Indigenous exporters. However, the constraints of a small sample size limited the depth of the findings, and the inherent diversity within Indigenous enterprises underscored the need for ongoing and more comprehensive studies.Footnote 6
Following this first report, CCIB and Global Affairs Canada partnered again to build on earlier work with 2 additional studies—Adàwe (2023) and Atāmitowin (2024).Footnote 7Footnote 8 Each iterative report builds on previous findings to strengthen the understanding of the complex conditions and experiences of Indigenous SMEs.
The survey methodology has been significantly enhanced in the current CCIB-GAC partnership. In 2021, the CCIB and Global Affairs Canada’s survey captured 2,603 Indigenous firms in Canada. This marks a notable increase in sample size, more than double the number of respondents compared to the 2019 study.Footnote 9 Furthermore, this latest partnership includes in-depth interviews and case studies of 3 First Nations communities and interviews with several economic development officers (EDO) to ensure that these unique challenges are captured. These special qualitative and quantitative data sets form the basis for our present report and its precursor, Adàwe.
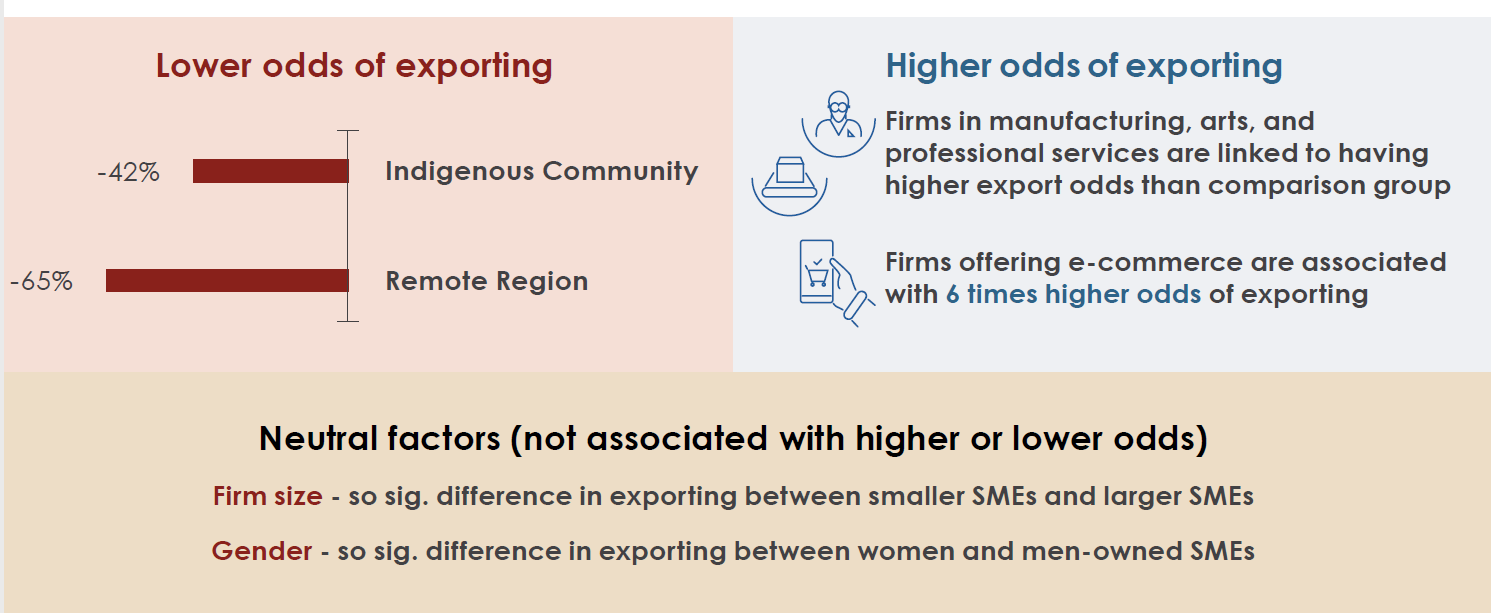
As we investigate the business obstacles and supports for Indigenous SMEs in this report, special attention is paid to the factors Adàwe found to be significant in exporting. Notably, Adàwe found that firms in remote areas or within Indigenous communities were associated with lower odds of exporting. In comparison, certain industries and e-commerce were factors that were associated with higher odds of exporting. Some factors didn’t have statistically significant effects, such as the owner’s gender or firm size.
Figure 1: Key findings of econometric analysis from Adàwe report
Text version - Figure 1
| Lower odds of exporting | Higher odds of exporting | Neutral factors (not associated with higher or lower odds) |
|---|---|---|
| Location within Indigenous community (-42%) | Firms in manufacturing, arts, and professional services are linked to having higher export odds than comparison group | Firm size — no significant difference in exporting between smaller SMEs and larger SMEs |
| Remote region (-65%) | Firms offering e-commerce are associated with 6 times higher odds of exporting | Gender — no significant difference in exporting between women and men-owned SMEs |
Source: Canadian Council for Indigenous Business & Global Affairs Canada (2023), adapted from regression results
Note: Statistical significance levels: Indigenous community (5% level), remote region (1% level), virtual sales (0.1% level)
In this report, we build on these findings to understand what mechanisms underpin the relationship between exporting and Indigenous firm characteristics. Namely, we employ comparative analysis to understand how barriers to growth and supports differ among firms based on geographic characteristics of interest. Furthermore, we enrich the descriptive work with econometric analysis to further discern which factors have a statistically significant association with obstacles to firm growth and export.Footnote 10 Detailed econometric results are provided in the appendix.
1.2 About the data
This report includes several components that capture as many Indigenous business voices as possible. It consists of an in-depth national telephone survey of 2,600 Indigenous majority-owned businesses. Statistics Canada estimates that 11,900 Indigenous-owned businesses had employees in Canada in 2018. Based on this estimate, the CCIB-GAC survey heard from more than 14% of the Indigenous-owned employer business population. A large majority (91.1%) of respondents choose to participate in the interview in English, while the remaining 8.9% of respondents elected to participate in French.Footnote 11
The work also included case studies in 3 First Nations communities, business surveys with 64 firms, and interviews with 3 EDOs. Interviews were conducted in the participants' official language of choice.
This report and the Adàwe report use a novel national data set that asked majority Indigenous-owned firms about their business experiences in 2020. The questionnaire and timeframe were designed to allow for comparison with national averages using Statistics Canada’s Survey of Financing and Growth of Small and Medium Enterprises (SFGSME).
To more accurately represent the true Indigenous business population, Big River Analytics weighted the national survey data. Weighted results are presented throughout this report, unless otherwise specified.
For further details about the data set, weighting method, and research ethics employed in this work, please see Adàwe.Footnote 12
Definitions
Indigenous SMEs: Firms that are self-identified Indigenous majority-owned (i.e., 51% or higher ownership) and have 1–499 employees. There were 1,537 Indigenous SMEs included in the national survey.
Exporters: Indigenous SMEs that exported in 2020. In the national survey, we spoke with 111 Indigenous SME exporters.
Previous exporters: Indigenous SMEs that did not export in 2020 but did export in a previous year. The national survey included 92 previous exporters.
SMEs with export experience: Indigenous SMEs that exported at any time, whether past or present. The number of experienced exporters is equivalent to the sum of exporters and previous exporters, totalling 203 Indigenous SMEs in our national survey.
SMEs that intend to export: Indigenous SMEs that were not exporting in 2020 but indicated plans to expand internationally. Our national survey captured 214 Indigenous SMEs in this definition.
Chapter 2: Obstacles to growth
Key messages
- Compared to the national average, Indigenous SMEs were significantly more likely to report several obstacles to growth. They were 1.9 times as likely to report that access to financing is a barrier to growth and 1.2 times as likely to report barriers with labour attraction. Government regulation was also more pronounced for Indigenous SMEs than the national average.
- Skilled labour attraction and economic conditions were the top obstacles for Indigenous SMEs, affecting over 60% of firms.
- Firms in Indigenous communities report physical and digital infrastructure barriers to growth at higher rates than Indigenous firms outside of Indigenous communities (9.6 and 12.3 percentage points higher, respectively).
- Indigenous SMEs in remote areas also report physical and digital infrastructure barriers at higher rates than those in urban areas (11.1 and 15.1 percentage points higher, respectively).
- More than 2 out of 5 Indigenous SMEs in Indigenous communities report that finance or access to equity or capital are significant hindrances to growth.
- In general, Indigenous exporting firms faced similar challenges to business growth as non-exporters, with some exceptions: notably, they experienced a higher incidence of challenges in accessing equity and capital, reliable internet, and higher business costs.
2.1 Obstacles to firm growth
Indigenous businesses across Canada are diverse, and unique cultural, historical, and geographic contexts shape their experiences. In Adàwe, we explored some of these distinctions, such as variations in industry, ownership, and targeted markets. Building upon this foundation, this report focuses on how these differences can exacerbate barriers within the business landscape, specifically regarding firm growth obstacles.
The connection between exporting and firm growth has been well-established in the literature. Numerous studies find a positive correlation between exporting activities, productivity improvements, and overall firm growth.Footnote 13Footnote 14 Firm size, in particular, been positively related to export propensity in the literature.Footnote 15 Considering this relationship, identifying barriers to growth is a natural starting point for empowering the success of Indigenous firms as they venture into international markets.
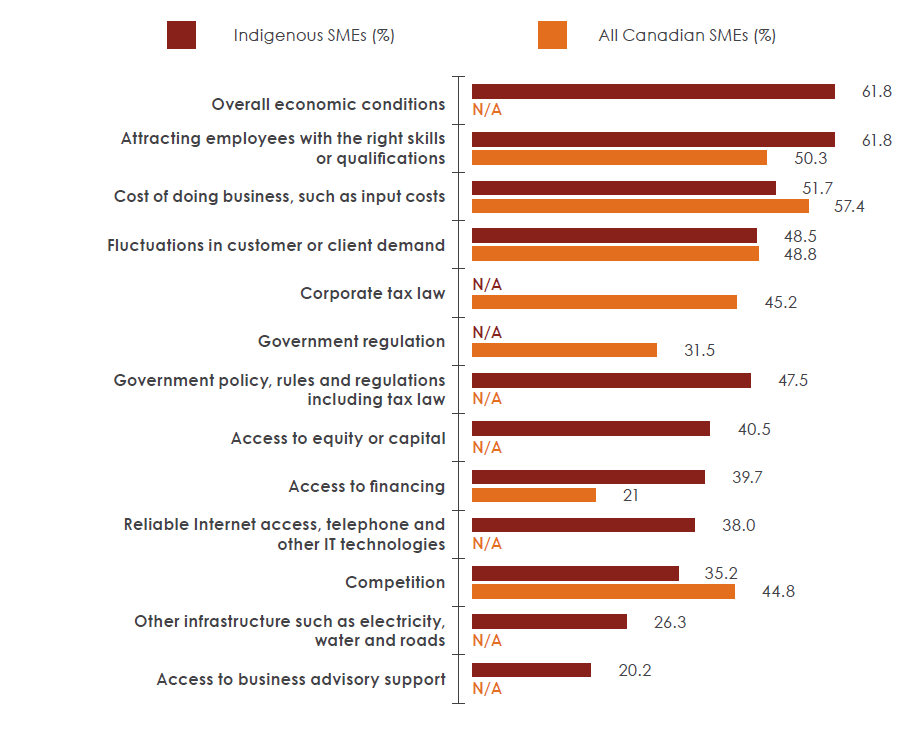
Figure 2: Comparison of obstacles to business growth between Indigenous and all Canadian SMEs
Text version - Figure 2
| Significant challenge to business growth | Indigenous SMEs (%) | All Canadian SMEs (%) |
|---|---|---|
| Overall economic conditions | 61.8 | - |
| Attracting employees with the right skills or qualifications | 61.8 | 50.3 |
| Cost of doing business, such as input costs | 51.7 | 57.4 |
| Fluctuations in customer or client demand | 48.5 | 48.8 |
| Corporate tax law | - | 45.2 |
| Government regulation | - | 31.5 |
| Government policy, rules and regulations including tax law | 47.5 | - |
| Access to equity or capital | 40.5 | - |
| Access to financing | 39.7 | 21.0 |
| Reliable Internet access, telephone, and other IT technologies | 38.0 | - |
| Competition | 35.2 | 44.8 |
| Other infrastructure such as electricity, water, and roads | 26.3 | - |
| Access to business advisory support | 20.2 | - |
Source: Canadian Council for Indigenous Business & Global Affairs Canada’s Survey of Indigenous Firms, 2021; Statistics Canada. Table 33-10-0447-01 Obstacles to business growth for small and medium-sized enterprises.
Notes: There are variances in obstacle descriptions between the SFGSMEs and the CCIB-GAC survey. Notable examples include: 1) the SFGSME identifies “recruiting and retaining skilled employees," while the CCIB-GAC survey identifies “attracting employees with the right skills or qualifications regulations”; 2) the SFGSME identifies “rising input costs,” while the CCIB-GAC survey identifies “cost of doing business such as input costs”; 3) the SFGSME identifies “government regulations,” while the CCIB-GAC survey identifies “government policy, rules, and regulations such as tax law”; and 4) the SFGSME identifies “obtaining financing,” while the CCIB-GAC survey identifies “access to financing.” For instance, where data is not comparable, “N/A” is indicated on the graph.
Economic conditions
Indigenous SMEs report a myriad of obstacles to growth, but overall economic conditions were reported as one of the most pressing. This finding is unsurprising, considering that the survey asked respondents about their experiences in 2020.
The COVID-19 pandemic resulted in exceptional disruptions to the Canadian and world economy. Businesses faced many challenges, from supply chain interruptions to enforced closures and remote work mandates. Many firms encountered financial strains due to fluctuating markets, regulatory barriers, cash flow constraints, and uncertain economic conditions.Footnote 16
Moreover, travel restrictions and social-distancing measures hampered traditional networking and business development avenues, impacting firms’ ability to engage with clients, partners, and markets.Footnote 17 At the same time, the shift to remote work necessitated rapid adaptations in operational models, technological investments, and new cybersecurity measures.
While the pandemic impacted firms of all sizes, there is evidence that smaller firms in Canada and the world were more likely to cease operations and experience more significant reductions in sales than larger firms.Footnote 18Footnote 19 Thus, the high rate of Indigenous SMEs that reported that economic barriers restricted growth generally mirrors the experiences of SMEs domestically and in other economies.
Even though pandemic-related challenges were not exclusive to Indigenous firms, evidence suggests that Indigenous firms may have been disproportionately affected by negative economic expectations during the pandemic. A 2024 study by the Bank of Canada that used the CCIB-GAC survey data set revealed that Indigenous firms exhibited stronger inflation expectations and weaker wage growth forecasts in 2021 than the average private sector firm in Canada.Footnote 20
While it is crucial to consider the pandemic when interpreting the survey results, it is equally important to recognize the extensive body of literature that highlights pre-existing obstacles for Indigenous businesses.Footnote 21Footnote 22 Consequently, one difficulty in this analysis is disentangling barriers that emerged due to the pandemic from those that already existed within Indigenous communities (and were potentially exacerbated by the ongoing crisis). For example, during the COVID-19 pandemic, various Indigenous communities implemented shutdown measures to safeguard the health of their members.Footnote 23 While these actions were taken to ensure community well-being, they also restricted access to external visitors and services, which had ramifications on commerce. Thus, when interpreting the survey results, it is essential to consider the interplay between documented challenges within Indigenous communities, such as infrastructure and socioeconomic barriers, and pandemic-related factors.
Labour needs
Labour attraction was reported to be just as significant as barriers stemming from economic conditions. More than 3 out of 5 Indigenous SMEs indicated that attracting employees with the necessary skills or qualifications is a barrier to growing their business—a figure that is above the national average of 50.3%.
Indigenous SMEs that report labour as an obstacle to growth are more likely to be in the services industries. More than 70% of Indigenous SMEs in each of the following industries reported that labour attraction poses a significant obstacle to growth:
- transportation and warehousing
- arts, entertainment, and recreation
- health care
- accommodation and food service
Once again, the context of the pandemic is front of mind when thinking about the high proportion of firms in the service industries that report labour as a growth barrier. Notably, social-distancing measures and lockdown restrictions during the COVID-19 pandemic impacted high-contact service industries severely.Footnote 24
While firms’ expectations about labour availability appear to be improving according to the 2024 first quarter results of Statistic’s Canada Canadian Survey on Business Conditions, some challenges persist, especially among select industries. Notably, entrepreneurs in accommodation and food services, construction and healthcare expected labour challenges into 2024.Footnote 25
Skills growth, training, and funding opportunities are critical for Indigenous Peoples to advance their careers, improve Indigenous labour-market and entrepreneurship results, and further economic reconciliation in Canada, as detailed in research by the CCIB.Footnote 26 Thus, increased access to education and other capacity-building resources are critical avenues to consider when working towards a truly inclusive economy, especially one that enables opportunities for growth and success for marginalized groups.
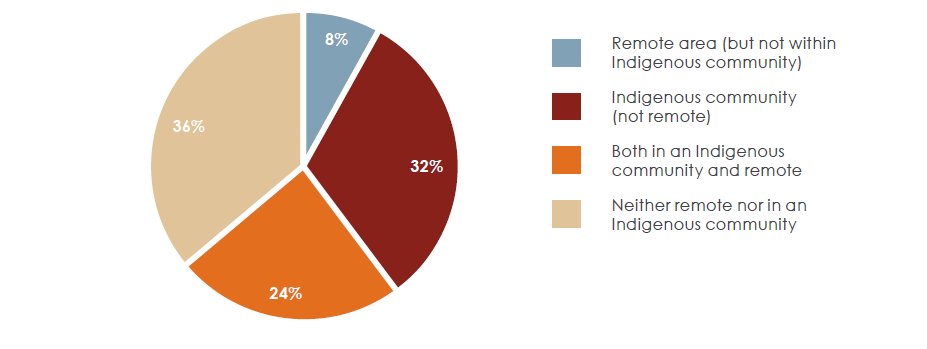
Geographic characteristics can constrain recruitment for Indigenous SMEs. We use Statistics Canada’s Index of Remoteness and postal code information to classify firms as either urban (for example, Toronto, Vancouver, Edmonton, Winnipeg), semi-connected (for example, Belleville, Thunder Bay, Whitehorse, Nanaimo) or remote (for example, Igloolik, Yellowknife, Iqaluit, Arctic Bay). For a full explanation of the remoteness indicator, please see Adàwe. Using our definitions, 32% of all Indigenous SMEs in our survey are in remote areas, 57% of all Indigenous SMEs are located within Indigenous communities, and 24% of all Indigenous SMEs are in both remote areas and Indigenous communities.Footnote 27
Figure 3: Firm location of Indigenous SMEs
Text version - Figure 3
| Firm location of Indigenous SMEs | % of Indigenous SMEs |
|---|---|
| Neither remote nor in an Indigenous community | 36 |
| Both in an Indigenous community and remote | 24 |
| Remote area (but not within Indigenous community) | 8 |
| Indigenous community (not remote) | 32 |
Source: Canadian Council for Indigenous Business & Global Affairs Canada’s Survey of Indigenous Firms, 2021; Statistics Canada’s Index of Remoteness
Firms that operate outside of urban areas can be exposed to unique challenges. Notably, lower population densities, vast distances, and limited transit infrastructure can restrict access to sizable labour pools.Footnote 28
One First Nations business owner who participated in our case studies highlighted the difficulty in attracting labour due to the community’s considerable distance from urban centres, stating:
“A major hurdle is attracting employees. My community is uniquely challenged by geography, being two hours away from the nearest major city center and lacking accommodations for employees and their families.”
- Firm owner from First Nations Community #2
Many labour-related barriers also stem from inadequate infrastructure. Another case study interview participant remarked:
“There is a lack of accommodations [housing] to draw in and keep talent. It’s difficult for single applicants and the applicants who have families.”
- First Nations business owner in Community #2
Labour challenges can also stem from a lack of qualified workforce to draw from, particularly for businesses that want to hire Indigenous workers. When asked what would help international expansion efforts, one Indigenous firm owner noted they “have the cash flow to hire someone, but it is very difficult for a small business to find qualified people, especially wanting to hire an Indigenous person.”
Another firm owner remarked that they wish to have guidance on “where to find staff,” specifically “Métis/Indigenous employees,” while another noted that they are looking for “Indigenous technical employees.”
Government regulation
Nearly half (47.5%) of Indigenous SMEs cite government policy, rules, and regulations (including tax law) as significant barriers to growth. The SFGSME covering the national average posed a slightly different question, making comparisons difficult as it separates rules and regulations from taxes and finds that 31.5% of all Canadian SMEs cited the former as an obstacle, while 45.2% cited corporate tax rates. Thus, it is unclear whether government regulation is identified as a more important barrier to growth by Indigenous SMEs and if this finding relates to legislation specific to Indigenous Peoples, such as the Indian Act.
Business financing
The most pronounced barrier for Indigenous SMEs compared to the national average is access to finance. Some 39.7% of Indigenous SMEs indicated that access to financing is a barrier to firm growth compared to only 21.0% of all Canadian SMEs. Indigenous SMEs have lower rates of credit use: in 2020, only 10.9% of Indigenous SMEs indicated that private lending sources, such as bank loans, are the main sources of financing for their business.Footnote 29 In contrast, 34.6% of all Canadian SMEs used credit from financial institutions to start their business.Footnote 30
Several factors complicate access to finance for Indigenous businesses. A study by the Bank of Canada finds that a sizeable percentage of First Nations communities are far from financial institutions. The research found that the median travel distance between a band office and a financial institution branch is 24 kilometres.Footnote 31 Thus, for the 45.7% of SMEs in our study that are both First Nations-owned and located within Indigenous communities, large distances to banking institutions may be one of the factors at play when it comes to challenges with accessing financing.Footnote 32
Furthermore, the Indian Act could limit credit opportunities for firms within First Nations reserves. Restrictions to property rights under the Indian Act, such as the inability to use reserve land as collateral, may limit access to low-cost, secured loans.Footnote 33 As a result, First Nations-owned firms located on reserves may face larger hurdles in securing financing from banking institutions. Adàwe explores the impacts of the Indian Act on company financing in greater detail. Namely, our econometric analysis finds that Indigenous SMEs in Indigenous communities are associated with 1.3 times higher odds of reporting financing as a significant barrier to growth, when compared to their counterparts.Footnote 34
Furthermore, the experience of a First Nations business owner offers a firsthand perspective into the challenges businesses on reserves face when seeking equity. They remarked the following:
“As an Indigenous person, it is a fact that I do not have equity; I cannot use my home as equity on reserve lands, so there is a huge lack of equity. How are you supposed to get equity?”
- First Nations business owner in Community #1
Other studies have highlighted sentiments of mistrust and alienation from mainstream banking institutions that Indigenous Peoples have experienced.Footnote 35 Thus, accessibility barriers to finance may also stem from the discomfort of interacting with banking institutions, in addition to geographical distances, limitations stemming from the Indian Act, and collateral requirements.
There is an Indigenous business financing ecosystem in Canada. It is made up of government institutions such as Export Development Canada and Business Development Bank of Canada, as well as Indigenous and non-Indigenous financial institutions. The National Aboriginal Capital Corporations Association, for example, is a network of over 50 Indigenous financial institutions. They have provided over $3 billion in loans to businesses owned by First Nations, Métis and Inuit people, with the goal of supporting Indigenous economic growth.Footnote 36
Digital and physical infrastructure
From reliable internet access to water and roads, many Indigenous SMEs report digital (38.0%) and physical (26.3%) infrastructure as obstacles to growth. Given the importance of e-commerce, with Adàwe finding that e-commerce was associated with 6 times higher odds of exporting, it is concerning that so many Indigenous SMEs don’t have reliable access. Research by CCIB and Google Canada has shown that, when available, Indigenous businesses are making use of online tools, such as online search (75%), online advertising (61%), and other marketing tools like social media to reach new customers at higher rates than the average Canadian business.Footnote 37 These findings indicate that Indigenous businesses are interested in leveraging technology to access new markets both domestically and internationally.
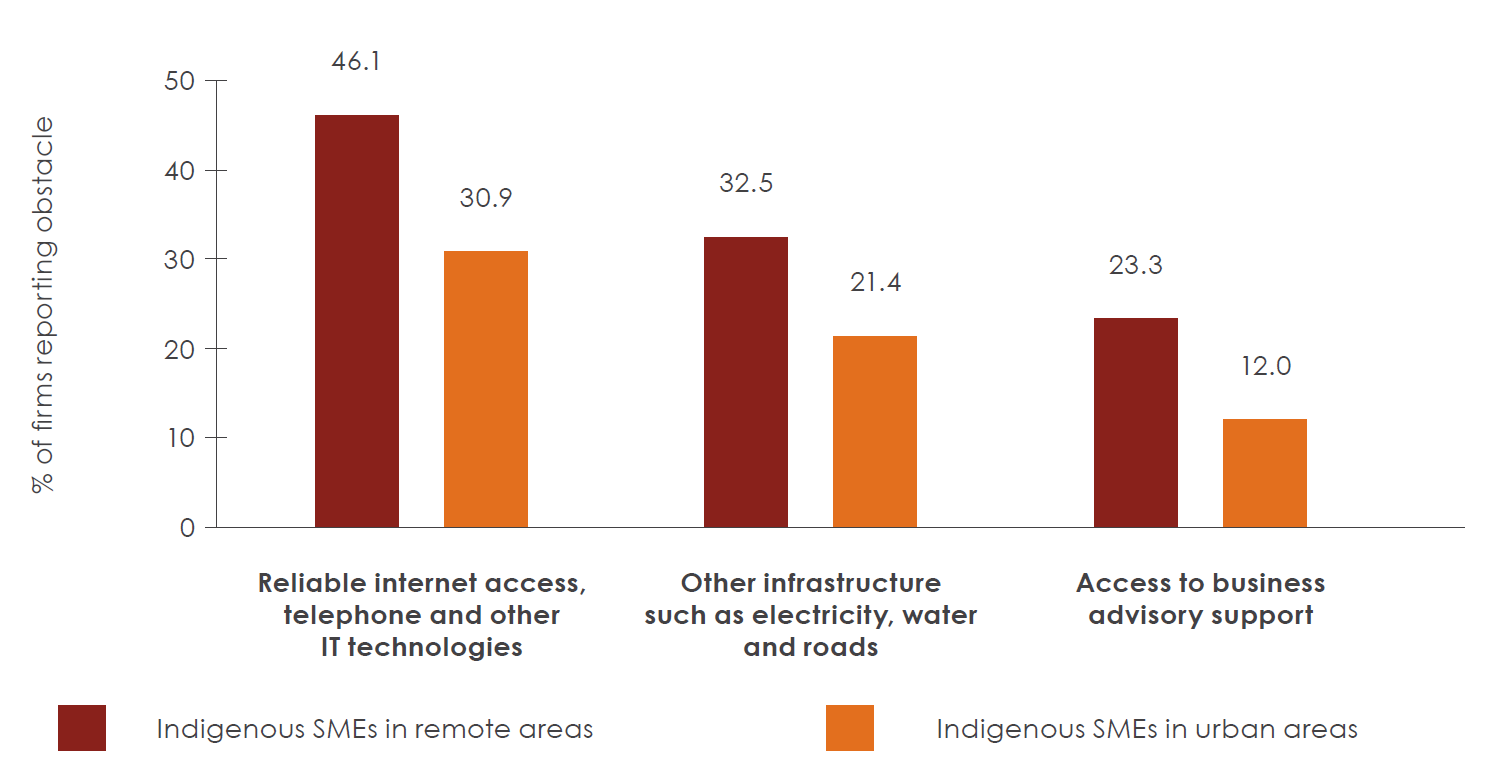
Digital infrastructure is the top growth obstacle, with the biggest difference between Indigenous firms in remote regions and urban areas. Our national survey reveals that 46.1% of Indigenous SMEs in remote areas report IT-related barriers to growth, compared to just 30.9% of Indigenous SMEs in urban areas. When business characteristics such as size and industry are controlled for, our econometric analysis finds that Indigenous SMEs in remote communities are associated with having 1.7 times higher odds of reporting information technology (IT) obstacles to growth compared to their urban counterparts.
Figure 4: Top 3 disparities in growth obstacles between Indigenous SMEs in urban and remote areas
Text version - Figure 4
| Significant challenge to business growth | Indigenous SMEs in remote areas (% of firms reporting obstacle) | Indigenous SMEs in urban areas (% of firms reporting obstacle) |
|---|---|---|
| Reliable internet access, telephone, and other IT technologies | 46.1 | 30.9 |
| Other infrastructure such as electricity, water, and roads | 32.5 | 21.4 |
| Access to business advisory support | 23.3 | 12.0 |
Source: Canadian Council for Indigenous Business & Global Affairs Canada’s Survey of Indigenous Firms, 2021
Remote communities in Canada often lack the same access to high-speed internet as their urban counterparts. In 2021, only 59.5% of rural and remote households had access to minimum connection speeds—a figure far below the national average of 90.9%.Footnote 38 Furthermore, internet connectivity often comes at a higher cost for remote clients. However, through a 10-year spending plan, the federal government promises to connect 95% of Canadians to high-speed internet capabilities by 2026 and 100% of Canadians by 2030.Footnote 39
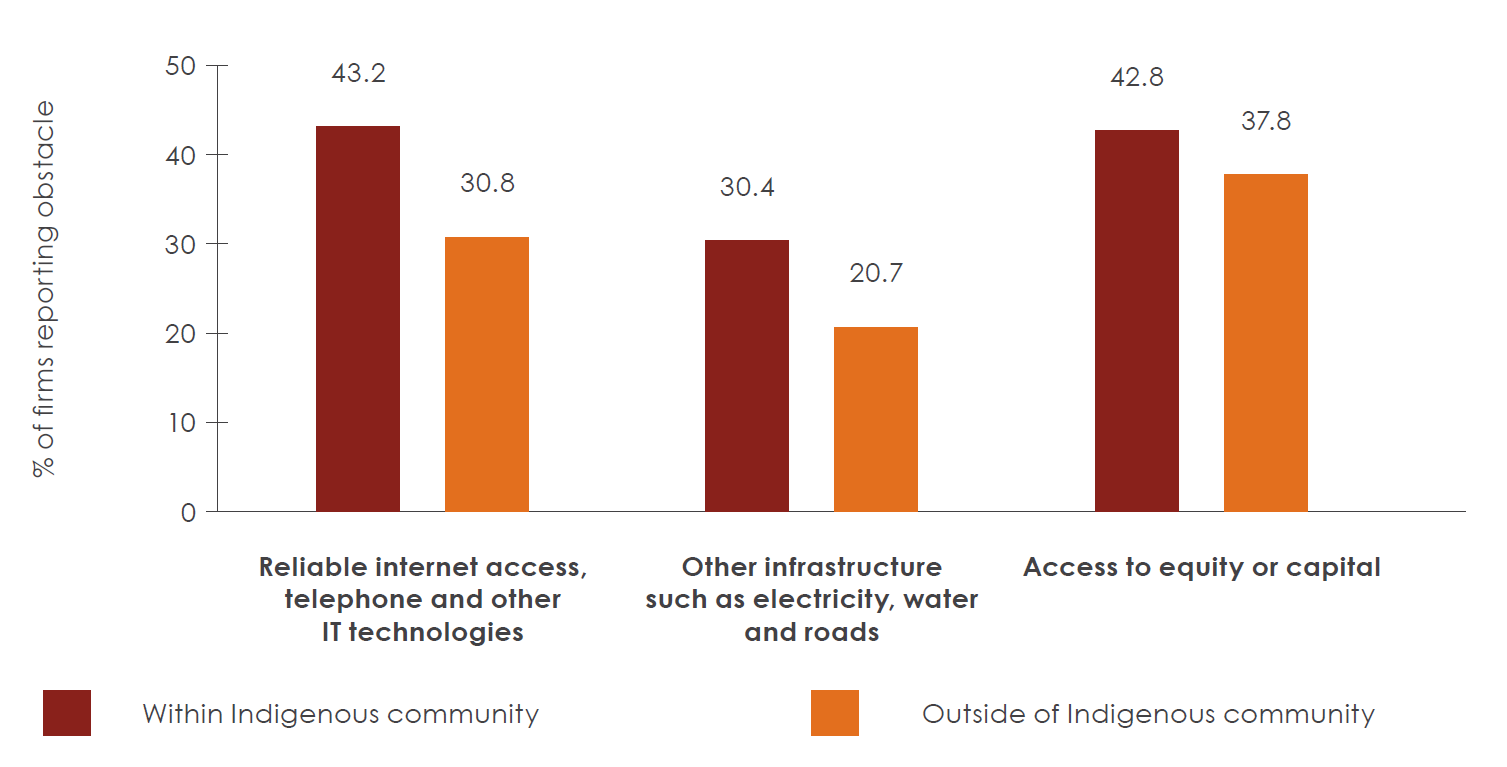
Figure 5: Top 3 disparities in growth obstacles between SMEs in and outside of Indigenous communities
Text version - Figure 5
| Significant challenge to business growth | Within Indigenous community (% of firms reporting obstacle) | Outside of Indigenous community (% of firms reporting obstacle) |
|---|---|---|
| Reliable Internet access, telephone, and other IT technologies | 43.2 | 30.8 |
| Other infrastructure such as electricity, water, and roads | 30.4 | 20.7 |
| Access to equity or capital | 42.8 | 37.8 |
Source: Canadian Council for Indigenous Business & Global Affairs Canada’s Survey of Indigenous Firms, 2021
Reliable digital infrastructure is also an obstacle, with the biggest difference between Indigenous firms in Indigenous communities compared to those located outside of Indigenous communities. Our econometric analysis reveals that Indigenous SMEs within Indigenous communities are associated with having 1.8 times the odds of reporting digital infrastructure as a barrier to growth.
Studies have consistently highlighted that Indigenous communities grapple with distinct digital infrastructure-related challenges, particularly within First Nations reserves.Footnote 40 A report by the Auditor General of Canada highlights that households in First Nations reserves can experience more severe connectivity gaps than households that are merely in remote regions. Namely, the report finds that only 42.9% of households in First Nations reserves have access to minimum connectivity speeds (a figure markedly below the 59.5% of remote households that have access to the same speeds).Footnote 41
We heard firsthand accounts of the struggles that firm owners experience with reliable internet access:
“Access to internet can be an issue depending on where you are. The internet in our city is very slow and can cause significant issues when running an online business. It slows everything down.”
- First Nations business owner in Community #3
“Internet and phone access pose significant obstacles as my network provider doesn't cover the area where I market my goods. This strains my ability to communicate effectively with customers.”
- Firm owner from First Nations Community #1
Physical infrastructure, such as roads, electricity, and water, was reported as a growth barrier by more than a quarter of Indigenous SMEs in our national survey. Like digital infrastructure, physical infrastructure challenges were more prevalent among Indigenous firms in remote regions and those located in Indigenous communities.
Some 32.5% of firms in remote areas reported that inadequate physical infrastructure, including roads, electricity, and water, is a barrier to growth. Econometric analysis also finds that Indigenous firms in remote areas are linked to having 1.4 times higher odds of reporting physical infrastructure barriers to growth than Indigenous SMEs in urban areas.
A First Nations business owner shares one poignant example of challenges related to infrastructure:
“I think that the electricity rates are the main issue if I open up a storefront.”
- First Nations business owner in Community #2
While the degree of remoteness is evidently important for infrastructure obstacles, so too is the location of a firm either within or outside of Indigenous communities, such as First Nations reserves. Econometric analysis finds that Indigenous SMEs in Indigenous communities are associated with 1.6 higher odds of reporting physical infrastructure barriers to growth, even when the effects of remoteness are controlled for.
Competition
Competition is reported as a barrier by over one-third (35.2%) of Indigenous SMEs, making it a sizeable, though one of the lowest-ranked, barrier to growth.
Industry-related differences, such as a high degree of specialization for Indigenous firms, could explain why competition is perceived as less of a barrier than for national averages. For example, the econometric analysis reveals that firms in select industries, such as retail trade, are linked to higher odds of reporting competition as a barrier to growth than accommodation and food services. According to one estimate, the Indigenous art market in the United States was valued at US$1.5 billion in 2020, with a projected annual growth rate of 8%.Footnote 42 Thus, Indigenous SMEs that specialize in producing traditional and cultural products could produce highly differentiated products, which would contextualize why competition is perceived as a less significant barrier to growth.
However, this indicates a need to prevent the misappropriation and copying of Indigenous traditional and cultural products to ensure that they are not forced to compete with non-Indigenous entities in this space. The United States currently has the Indian Arts and Crafts Act (1990), which makes it illegal to “offer or display for sale, or sell, any art or craft product in a manner that falsely suggests it is Indian produced, an Indian product, or the product of a particular Indian or Indian tribe or Indian arts and crafts organization, resident within the United States,” but no similar legislation currently exists in Canada, which has led to a rise in counterfeiting issues.Footnote 43 For example, an investigative journalist found that 75% of the 40 shops in Gastown, Vancouver, were selling fake Indigenous art.Footnote 44
Geographic factors may reduce the challenging effects of competition for the 74.8% of Indigenous SMEs located outside of urban areas. Research indicates that rural areas tend to foster more start-up firms per capita, which are often born out of demand to fill a necessity.Footnote 45 In remote areas, consumers contend with significant distances to access goods and services, which creates a demand for local entrepreneurs to cater to these needs. Consequently, rural regions may be somewhat shielded from urban competition, allowing businesses to operate within less saturated markets.Footnote 46 A lower share of remote Indigenous SMEs reported market competition as a moderate or major barrier (31.0%) than the Indigenous SME average (35.2%).
2.2 Obstacles to growth for exporters
In general, Indigenous SME exporters report barriers to growth at similar rates to non-exporters. For instance, economic conditions and attracting employees with the right skills are the top 2 business challenges for both groups.
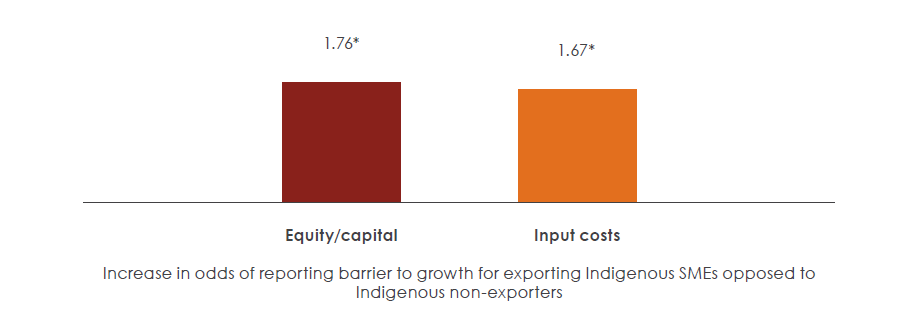
However, equity, capital, and input costs are barriers that are statistically more pronounced for Indigenous exporters. When firm characteristics are controlled for, Indigenous SME exporters are associated with having 1.8 times higher odds of reporting that access to equity or capital is a barrier to growth than non-exporting firms, according to our econometric analysis. Furthermore, Indigenous SME exporters have 1.7 times higher odds of reporting rising input costs as a barrier to growth than non-exporters—even after industry-related differences are controlled for.
Figure 6: Statistically significant obstacles to growth for Indigenous SME exporters
Text version - Figure 6
| Statistically significant obstacles to growth | Equity/capital | Business/input costs |
|---|---|---|
| Increase in odds of reporting barrier to growth for exporting Indigenous SMEs opposed to Indigenous non-exporters | 1.76* | 1.67* |
Notes: * represents 5% significance level. Result obtained when other factors are controlled for, such as industry, size, use of virtual sales, and geographic characteristics. Please see Table 1.1A for complete regression.
Source: Canadian Council for Indigenous Business & Global Affairs Canada’s Survey of Indigenous Firms, 2021
Our previous report, Adàwe, found that exporters are more likely to use virtual sales than non-exporters. We now find that reliable communications infrastructure is a notable challenge for Indigenous SMEs exporters. Some 4.8 percentage points more Indigenous exporters than non-exporters highlighted that reliable internet and IT tools are noteworthy obstacles to firm growth.
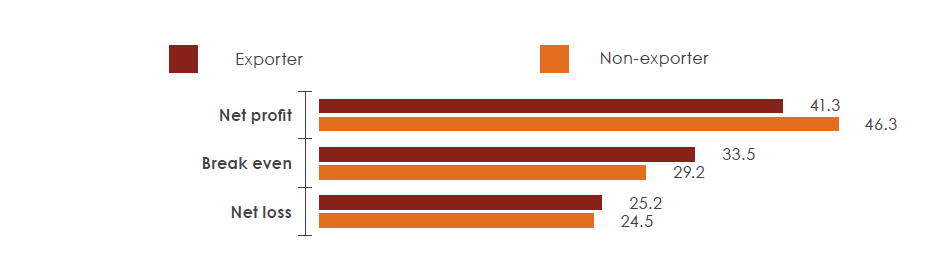
In 2020, Indigenous exporters’ profits were slightly harder hit than those of non-exporters, with a smaller share reporting a net profit (41.3% vs. 46.3%). Most Indigenous exporters either broke even or incurred a net loss, underscoring their strained financial position in 2020. A sizable number of the Indigenous SME exporters who reported a net loss were in service-related industries, such as accommodation and food services, as well as transportation and warehousing. This disparity in financial standing between exporting and non-exporting firms during that period emphasizes the heightened vulnerability of exporters to economic turbulence and increased prices. It could also be indicative of pandemic-related challenges for firms in service industries.
Figure 7: Revenues in 2020 for Indigenous SMEs by export status
Text version - Figure 7
| Revenues in 2020 | Indigenous exporter (%) | Indigenous non-exporter (%) |
|---|---|---|
| Net profit | 41.3 | 46.3 |
| Break even | 33.5 | 29.2 |
| Net loss | 25.2 | 24.5 |
Source: Canadian Council for Indigenous Business & Global Affairs Canada’s Survey of Indigenous Firms, 2021
Business challenges for First Nations, Métis, and Inuit firms
There is much diversity among Indigenous Peoples in Canada, including within First Nations, Métis, and Inuit identities. Geographical locations, spiritual and cultural practices, and historical and modern contexts are all factors that may differentiate the experiences of Indigenous entrepreneurs.
Compared to the Indigenous SME average, First Nations-owned Indigenous SMEs are slightly more likely to report challenges related to access to equity (+2.3 percentage points), access to financing (+1.9 percentage points), and access to business support (+0.8 percentage points). These statistics likely reflect systemic barriers within financial and support ecosystems, as discussed throughout this report. Furthermore, given that a majority of First Nations firms in our study are based within reserves, it is important to consider the ramifications of the Indian Act on access to finance and equity.
Métis-owned firms, conversely, are significantly more impacted by obstacles stemming from government policy and regulations (such as tax law) (+13.0 percentage points), business costs (+11.2 percentage points), and overall economic conditions (+8.1 percentage points). Industry composition may partly explain some of these challenges. Notably, a significant portion of Métis-owned firms are in the construction industry and are thus likely to be exposed to volatile input costs such as commodity price fluctuations.
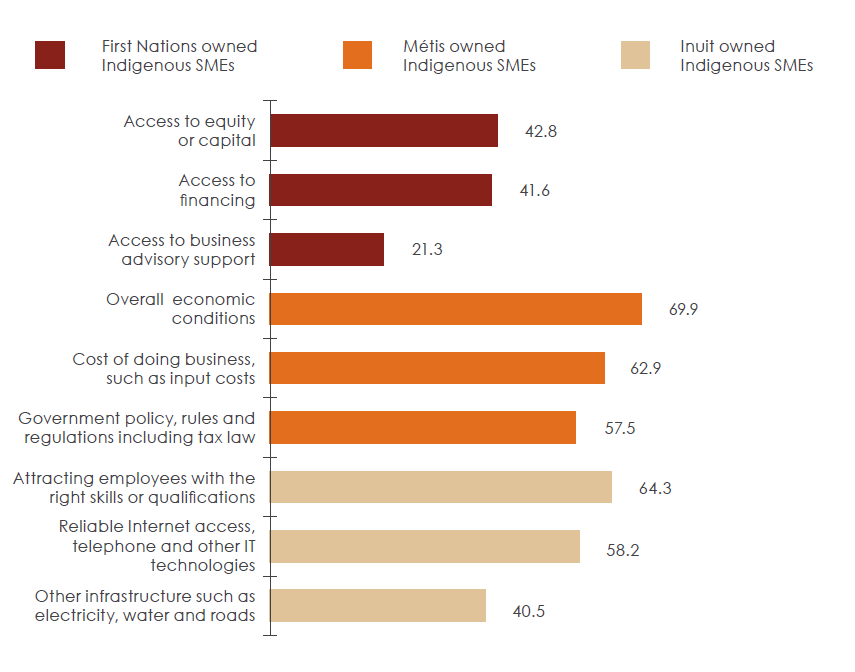
Inuit-owned firms starkly deviate from the Indigenous SME average and are more likely to face challenges related to IT (+20.2 percentage points), infrastructure (+14.2 percentage points), and labour attraction (+2.5 percentage points). As Inuit tend to inhabit remote parts of Canada, these figures likely showcase the impacts of remoteness on access to labour and infrastructure.
Figure 8: Largest discrepancies in obstacles to growth among First Nations, Métis, and Inuit-owned firms when compared to Indigenous average
Text version - Figure 8
| Obstacle to growth | First Nations owned Indigenous SMEs |
|---|---|
| Access to equity or capital | 42.8 |
| Access to financing | 41.6 |
| Access to business advisory support | 21.3 |
| Obstacle to growth | Métis owned Indigenous SMEs |
|---|---|
| Overall economic conditions | 69.9 |
| Cost of doing business, such as input costs | 62.9 |
| Government policy, rules and regulations including tax law | 57.5 |
| Obstacle to growth | Inuit owned Indigenous SMEs |
|---|---|
| Attracting employees with the right skills or qualifications | 64.3 |
| Reliable Internet access, telephone and other IT technologies | 58.2 |
| Other infrastructure such as electricity, water and roads | 40.5 |
Source: Canadian Council for Indigenous Business & Global Affairs Canada’s Survey of Indigenous Firms, 2021.
For more information on obstacles to firm growth by identity of ownership, please see Table 2.4A in the appendix.
Chapter 3: Export activity of Indigenous SMEs–motivations and challenges
Key messages
- Indigenous SMEs begin exporting for various reasons, with interest from international customers being the most common (reported by nearly one-third of firms).
- For nearly every barrier, Indigenous SMEs are more likely to report facing moderate or major export obstacles than the average SME in Canada.
- The pandemic was the most reported export obstacle for Indigenous SMEs, with 61.5% reporting it as a moderate or major obstacle.
- More than two-thirds of Indigenous SMEs who stopped exporting in 2020 reported that the pandemic was the main factor behind their decision. For SMEs who stopped exporting in the previous year, a lack of profits (26.0%) was the main motivator.
- Intellectual property protection and market knowledge stand out as export obstacles reported at significantly higher rates by Indigenous SME exporters than the national average, 3.8 times higher and 2.3 times higher, respectively.
- Remotely located Indigenous SMEs are associated with nearly 4 times higher odds of reporting that location is a moderate or major obstacle to exporting compared to firms in urban areas.
- Firms in Indigenous communities are associated with magnified odds of experiencing export barriers related to financing, financial risk, discrimination, logistics, and the effects of the pandemic.
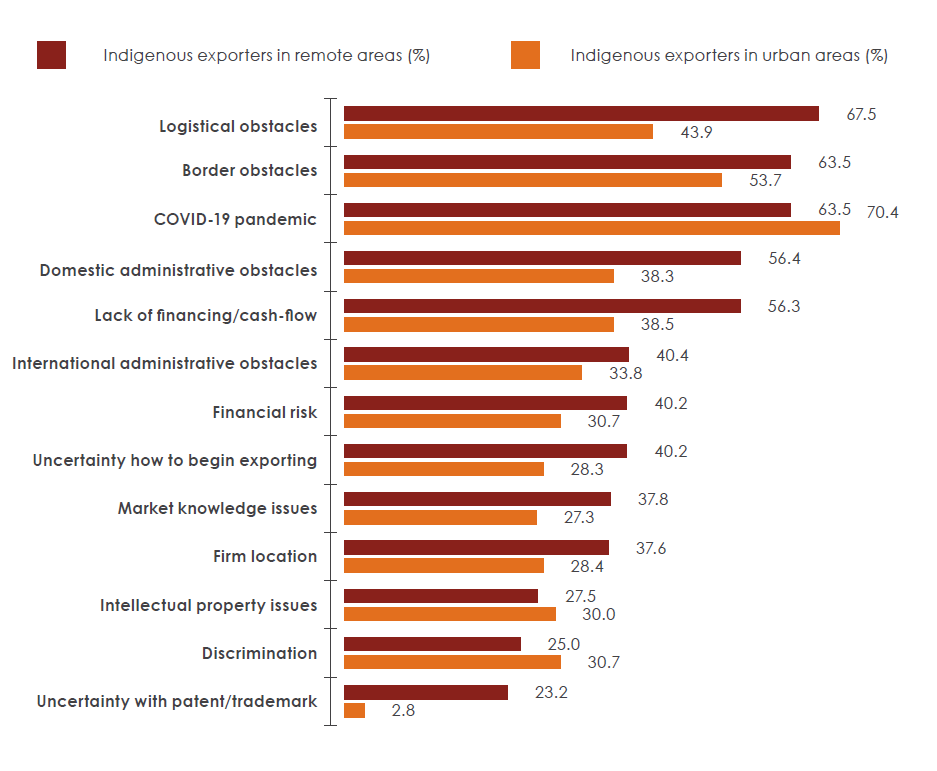
Figure 9: Heatmap of obstacles to export for various segments of Indigenous SME exporters
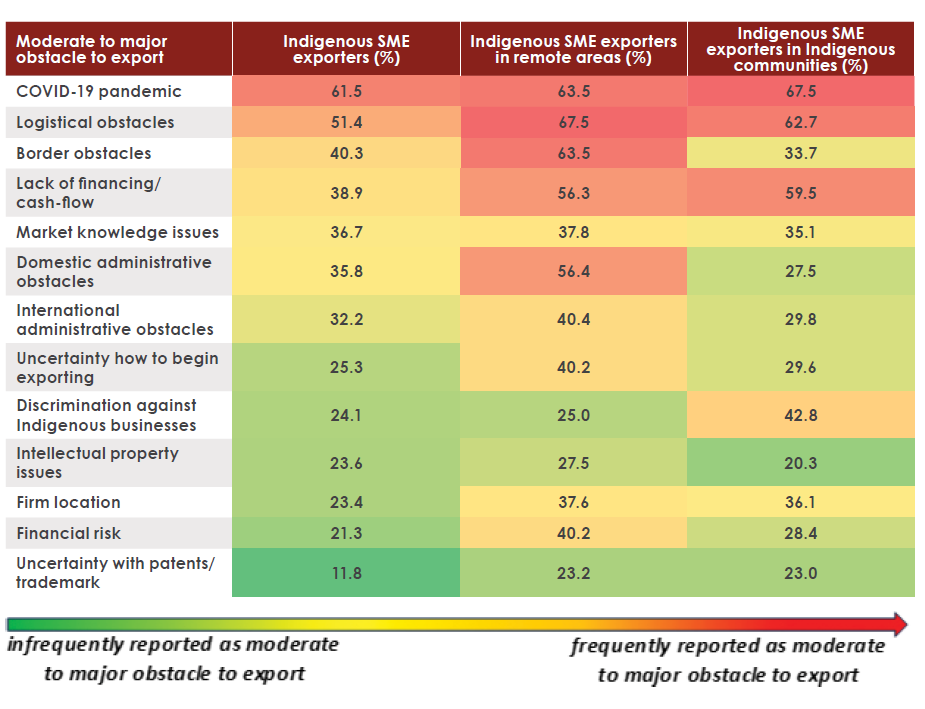
Text version - Figure 9
| Moderate to major obstacle to export | Indigenous SME exporters (%) | Indigenous SME exporters in remote areas (%) | Indigenous SME exporters in Indigenous communities (%) |
|---|---|---|---|
| COVID-19 pandemic | 61.5 | 63.5 | 67.5 |
| Logistical obstacles | 51.4 | 67.5 | 62.7 |
| Border obstacles | 40.3 | 63.5 | 33.7 |
| Lack of financing/cash-flow | 38.9 | 56.3 | 59.5 |
| Market knowledge issues | 36.7 | 37.8 | 35.1 |
| Domestic administrative obstacles | 35.8 | 56.4 | 27.5 |
| International administrative obstacles | 32.2 | 40.4 | 29.8 |
| Uncertainty how to begin exporting | 25.3 | 40.2 | 29.6 |
| Discrimination against Indigenous businesses | 24.1 | 25.0 | 42.8 |
| Intellectual property issues | 23.6 | 27.5 | 20.3 |
| Firm location | 23.4 | 37.6 | 36.1 |
| Financial risk | 21.3 | 40.2 | 28.4 |
| Uncertainty with patent/trademark | 11.8 | 23.2 | 23.0 |
Source: Canadian Council for Indigenous Business & Global Affairs Canada’s Survey of Indigenous Firms, 2021
Note: Percentages reflect % of firms (of each segment) that reported the export obstacle as moderate to significant.
3.1 Reasons to export for Indigenous firms
Most Indigenous firms do not start their business with the intention of exporting. In fact, the CCIB-GAC national survey estimates that only 24.9% of Indigenous SMEs with export experience started their business with exporting in mind, suggesting that the choice to venture into international markets typically happens later.
The decision to enter international markets often stems from a combination of factors. “Push” factors like market saturation, excess production capacity, or the need for diversification can motivate companies to overcome domestic limitations and seek growth opportunities abroad. For instance, companies might seek international markets to sustain growth when facing limited domestic growth potential due to saturation or intense competition. Similarly, having surplus production capacity can drive companies to explore export opportunities to achieve economies of scale and improve efficiency.
“Pull” factors such as high demand in foreign markets, attractive profit margins, or favourable trade conditions may entice companies to enter international markets. This offers not only increased sales potential via a broader customer base, but increased production can lower per unit production costs and enable greater productivity. Competitive advantages like unique products, expertise, or technological advancements may also pull companies to markets where their offerings are valued.Footnote 47
Trade agreements can support companies with international expansion. Canada has 15 free trade agreements that cover 60% of global GDP, giving SMEs access to 1.5 billion customers. Canada has also been advancing Trade and Indigenous Peoples chapters in its ongoing trade agreement negotiations. These chapters seek to enhance the ability of Indigenous Peoples and businesses to benefit from the opportunities created under the agreement.
Figure 10: Top reasons to start exporting for Indigenous SMEs
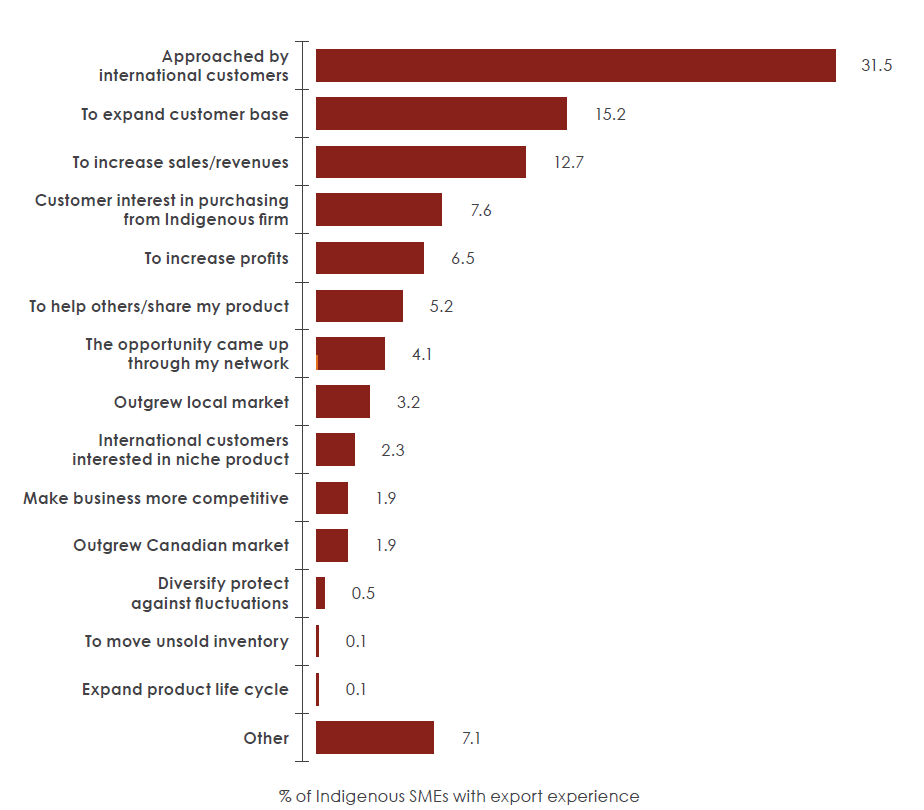
Text version - Figure 10
| Top reason to start exporting | % of Indigenous SMEs with export experience |
|---|---|
| Approached by customers in other countries | 31.5 |
| To expand customer base | 15.2 |
| To increase sales/revenues | 12.7 |
| Customers interested in purchasing from Indigenous firm | 7.6 |
| To increase profits | 6.5 |
| To help others/share my product | 5.2 |
| The opportunity came up through my network | 4.1 |
| Outgrew local market | 3.2 |
| International customers interested in niche product | 2.3 |
| Make business more competitive | 1.9 |
| Outgrew Canadian market | 1.9 |
| Diversify/protect against fluctuations | 0.5 |
| To move unsold inventory | 0.1 |
| Expand product life cycle | 0.1 |
| Other | 7.1 |
Source: Canadian Council for Indigenous Business & Global Affairs Canada’s Survey of Indigenous Firms, 2021.
Note: This was an open-ended question. Respondents were asked the main reason they began to export and other reasons that motivated this decision. This chart shows the main reasons for exporting.
International clients and demand for Indigenous products
The primary driver behind why Indigenous firms start exporting is international demand: 31.5% report starting because they were approached by customers in other countries. Almost half of these firms are in the professional, scientific, and technical services industry.
An additional 7.6% of Indigenous SMEs said they were approached by customers interested in buying from an Indigenous firm specifically. These firms were primarily in arts, entertainment, and recreation as well as manufacturing sectors.
A strong customer base can also be enticing. Some 15.2% of Indigenous SMEs with export experience pinpoint the expansion of their customer base as a factor fueling their decision to export.
Financial motivators
Indigenous firms also cite financial reasons as pivotal drivers that draw them towards exporting, with 12.7% of Indigenous SMEs with export experience indicating that growth in sales or revenues was their primary motivation to export. Profits were also a large motivating factor for 6.5% of Indigenous SMEs with export experience.
3.2 Obstacles to exporting
Indigenous SME exporters consistently report barriers to exporting at higher rates than the average Canadian SME exporter. This section uses 2 approaches to explore obstacles in greater depth. First, we compare Indigenous responses to questions on challenges in 2020 to the national average. Second, we conduct econometric analysis to identify which business characteristics, such as location in remote or Indigenous communities, are associated with statistically higher or lower odds of reporting each obstacle.Footnote 48
COVID-19 pandemic
From border closures and widespread labour shortages to skyrocketing input costs and supply chain disruptions, Canadian businesses had to weather many new challenges to stay afloat, let alone export to global markets in 2020. Some 61.5% of Indigenous SMEs reported that the pandemic presented a moderate or major obstacle to exporting.
Pandemic-related research conducted by the CCIB finds further evidence of the immense pressures COVID-19 placed on Indigenous firms; by January 2021, 58% of Indigenous firms surveyed by the CCIB had applied for government financial assistance due to the pandemic, and 52% received funding.Footnote 49 In a separate survey, Statistics Canada’s Canadian Survey on Business Conditions (2021 Q1) indicated that Indigenous businesses were 12.2 percentage points more likely to access the Canada Emergency Business Account (CEBA) than the national average.Footnote 50
Figure 11: Moderate and major obstacles to export
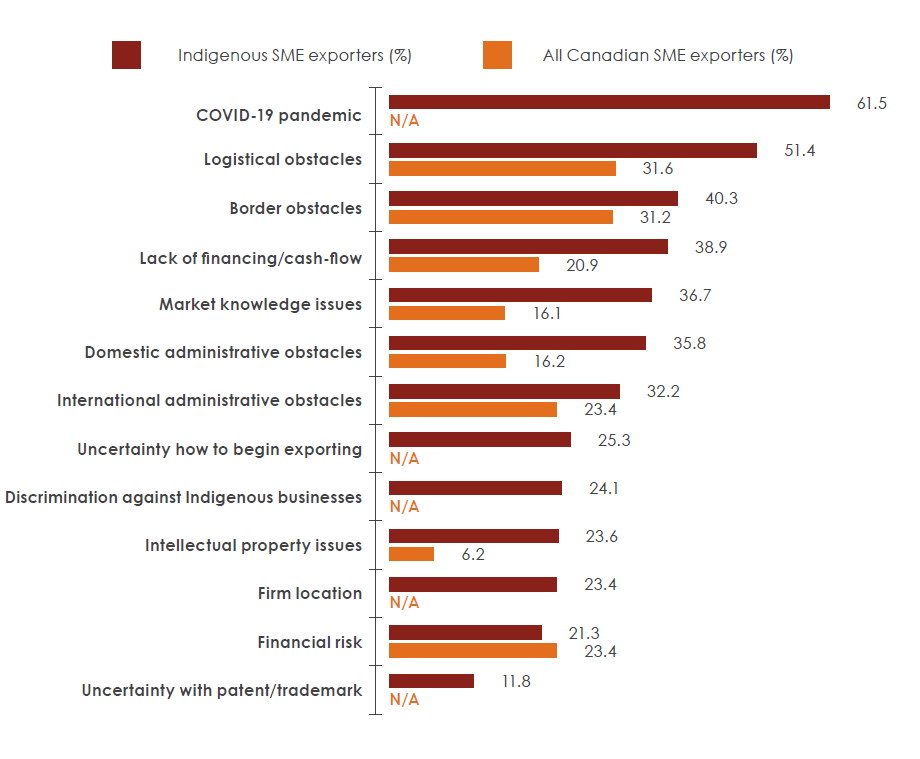
Text version - Figure 11
| Obstacle to export | Indigenous SME exporters (%) | All Canadian SME exporters (%) |
|---|---|---|
| COVID-19 pandemic | 61.5 | - |
| Logistical obstacles | 51.4 | 31.6 |
| Border obstacles | 40.3 | 31.2 |
| Lack of financing/cash-flow | 38.9 | 20.9 |
| Market knowledge issues | 36.7 | 16.1 |
| Domestic administrative obstacles | 35.8 | 16.2 |
| International administrative obstacles | 32.2 | 23.4 |
| Uncertainty how to begin exporting | 25.3 | - |
| Discrimination against Indigenous businesses | 24.1 | - |
| Intellectual property issues | 23.6 | 6.2 |
| Firm location | 23.4 | - |
| Financial risk | 21.3 | 23.4 |
| Uncertainty with patent/trademark | 11.8 | - |
Source: Canadian Council for Indigenous Business & Global Affairs Canada’s Survey of Indigenous Firms, 2021; Statistics Canada. Table 33-10-0451-01 Obstacles to exporting for small and medium-sized enterprises, 2022.
Note: The CCIB-GAC survey asked more extensive questions on export obstacles than the SFGSMEs. As a result, some categories cannot be compared to the national average. This is indicated with “N/A.”
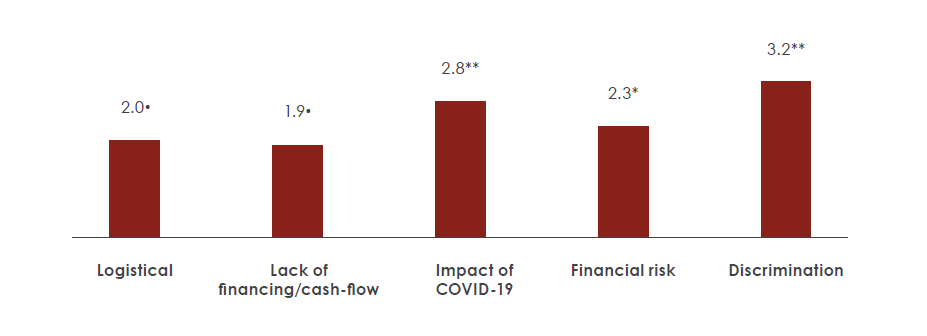
Our econometric analysis reveals that the COVID-19 pandemic stood out as one of the most significant obstacles for firms within Indigenous communities. Indigenous SMEs with export experience that were based in Indigenous communities were linked to 2.8 times higher odds of reporting pandemic-related obstacles to exporting—even after other characteristics, such as remoteness, are controlled for.
Figure 12: SMEs in Indigenous communities: Statistically significant obstacles to exporting
Text version - Figure 12
| Statistically significant obstacles to exporting | Logistical | Lack of financing/cash-flow | Impact of COVID-19 | Financial risk | Discrimination |
|---|---|---|---|---|---|
| Increase in odds of reporting barrier to exporting for Indigenous SME with export experience in Indigenous community, as opposed to Indigenous SME with export experience outside of Indigenous community. | 2.0• | 1.9• | 2.8** | 2.3* | 3.2** |
Notes: ** represents 1% significance level, * represents 5% significance level, and represents 10% significance level. Result obtained when other factors are controlled for, such as industry, size, use of virtual sales, and remoteness. Please see Table 1.2A for complete regression.
Source: Canadian Council for Indigenous Business & Global Affairs Canada’s Survey of Indigenous Firms, 2021.
In our community case studies, we heard from a First Nations firm owner who shared how challenges during the pandemic “became too difficult to overcome,” especially considering that the owner had “invested so much savings into it to try to make this business beneficial for family.” Another First Nations business owner remarked how sales plummeted during the lockdown and became a significant obstacle to exporting.
Logistical obstacles
Logistical obstacles, including distance to customers, transportation costs, and brokerage fees, are reported as a moderate or major obstacle by 51.4% of Indigenous exporters, compared to 31.6% of all Canadian SME exporters.
While the high prevalence of logistical obstacles could reflect pandemic-related supply chain challenges that were occurring at the time of the survey, logistical obstacles and infrastructure gaps have been well-documented challenges affecting Indigenous populations for many years.Footnote 51Footnote 52
Our national survey asked Indigenous SMEs who had already stopped exporting before the pandemic about obstacles, and a stark 45.0% reported that logistics were a barrier to export. Thus, there is significant evidence that factors unrelated to the pandemic play a key role in driving logistical obstacles to export.
Logistical barriers are particularly relevant for remotely located Indigenous SMEs. Nearly 68% of Indigenous SME exporters located in remote regions reported that logistics were a moderate or major obstacle to exporting, making it their number one challenge. In fact, the percentage of Indigenous SME exporters in remote locations who report this obstacle is 23.6 percentage points higher than that of urban Indigenous exporters (see Figure 13).
The amplified logistical obstacles remote Indigenous exporters face might signify broader challenges in accessing trade infrastructure. Due to the vast distances and intricate geographical terrain, transportation costs tend to soar for remote communities, contributing to the overall complexity of logistics. In some cases, carriers may charge higher prices to ship items outside typical pickup areas.Footnote 53
Figure 13: Moderate and major obstacles to export for Indigenous firms in remote and urban areas
Text version - Figure 13
| Moderate and major obstacles to export | Indigenous exporters in remote areas (%) | Indigenous exporters in urban areas (%) |
|---|---|---|
| Logistical obstacles | 67.5 | 43.9 |
| Border obstacles | 63.5 | 53.7 |
| Impacts of the COVID-19 pandemic | 63.5 | 70.4 |
| Domestic administrative obstacles | 56.4 | 38.3 |
| Lack of financing/cash-flow | 56.3 | 38.5 |
| International administrative obstacles | 40.4 | 33.8 |
| Financial risk | 40.2 | 30.7 |
| Uncertainty how to begin exporting | 40.2 | 28.3 |
| Market knowledge issues | 37.8 | 27.3 |
| Firm location | 37.6 | 28.4 |
| Intellectual property issues | 27.5 | 30.0 |
| Discrimination | 25.0 | 30.7 |
| Uncertainty with patent/trademark | 23.2 | 2.8 |
Source: Canadian Council for Indigenous Business & Global Affairs Canada’s Survey of Indigenous Firms, 2021
Note: Values are from a smaller data set that includes firm location.
Border obstacles
The third most pressing obstacle to exporting for Indigenous SMEs is border obstacles. For some 40.3% of Indigenous SME exporters, border issues, such as tariffs, import quotas, customs duties, or border security, posed a moderate or major obstacle to exporting. Comparatively, border obstacles are also a key challenge to exporting for all Canadian SMEs, albeit to a slightly lesser extent (reported by 31.2% of exporters). Given the closure of borders during the pandemic, it is likely that COVID-19 also exacerbated this challenge. However, 41.6% of Indigenous firms that exported before 2020 also reported that border obstacles are an obstacle to export, which signifies that pre-existing factors are also at play.
Access to finance
Another notable obstacle is access to finance or cash flow, which was reported as a moderate or major obstacle to exporting by 38.9% of Indigenous SME exporters, compared to 20.9% of all Canadian SME exporters.
Empirical studies show that businesses with fewer credit constraints are more likely to export.Footnote 54Footnote 55 Several factors explain the importance of credit access in exporting, such as the initial costs to begin exporting.Footnote 56 These entry costs are incurred before any revenues from exporting are earned, which can pose a barrier for firms (especially smaller ones) that do not have adequate savings to fund entry into new markets.Footnote 57 Furthermore, a study by the Bank of Canada estimates that alleviating credit constraints for exporters could increase aggregate productivity.Footnote 58
Compared to sales in domestic markets, there can be larger delays between production and payment for sales in international markets. When coupled with other risks, such as exchange rate fluctuations and the possibility of non-payment from international sales, financial products such as financing and/or insurance can be essential factors that allow firms to hedge the financial risks and costs associated with exporting.Footnote 59
One First Nations firm owner shared:
“I find it difficult to receive financing to help build my business. With no financing for the business, I’m struggling to be able to hire any employees so that I can produce larger orders and generate more revenue.”
- Firm owner from First Nations Community #1
In the words of this First Nations firm owner, barriers to financing can be a precursor to other obstacles. Without proper funds to ensure competitive wages and hire new employees, labour can limit firm expansion by hindering production, future revenues, and the potential for international growth.
For another First Nations firm owner, barriers to accessing finance boiled down to not being aware of how to access it. They remarked the following:
“I need help gaining knowledge on accessing financial support for my small business.”
- Firm owner from First Nations Community #1
Firms in Indigenous communities are almost twice as likely to report the lack of financing or adequate cash flow as a moderate or major obstacle (59.5% vs. 29.8% of exporters located outside of Indigenous communities). Moreover, these higher odds are statistically significant (see Figure 12). Higher prevalence could again indicate negative repercussions from the Indian Act. See Adàwe for a deeper discussion.
While more work remains to ensure financing challenges for Indigenous firms are better understood and addressed, there are supports available to Indigenous entrepreneurs seeking financing for international expansion. For example, Export Development Canada recognizes that lack of collateral is an issue for many Indigenous businesses and works with banks to provide guarantees on behalf of the businesses to absorb the risk in situations where collateral is lacking or absent.Footnote 60
Intellectual property
As demonstrated in Figure 11, intellectual property (IP) issues are cited as a moderate or major obstacle by 23.6% of Indigenous SME exporters, a rate 3.8 times higher than the national average. The CCIB found that unauthorized use of Traditional Knowledge (TK) and Cultural Expressions (CE) is more widely reported by businesses with clients outside Canada than those with domestic clients (13% vs. 2% with clients only within Canada).Footnote 61
Indigenous IP can encompass a wide range of TK, practices, and cultural wisdom that has been developed and passed down through generations. Even though Indigenous TK far predates the development of Western IP systems, TK has not always been eligible for protection by the current IP system. This is largely because current Western IP systems do not recognize Indigenous TK if it does not fit within the criteria deemed necessary for protection, such as the requirements of originality, identifiable authors for copyright protection, and the need for novelty and inventive steps for patent protection.Footnote 62
While 2.8% of Indigenous SME exporters in urban regions identified uncertainty surrounding patents or trademarks as a moderate or major hurdle to exporting, 23.2% of Indigenous exporters in remote areas reported this challenge, marking an eight-fold difference (Figure 13). This disparity might stem from product differences; however, the survey also found that remote Indigenous SMEs highlighted limited access to business supports as a barrier to firm growth at higher rates than their urban counterparts. Thus, restricted availability or access to business advisory services, which could assist firms in understanding and navigating patent or trademark processes, might contribute to this relationship.
Administrative obstacles
Domestic administrative barriers, which include rules, regulations, and legal requirements, were reported as moderate or major challenges to exporting by 35.8% of Indigenous SME exporters—a much higher figure than the share of Canadian SME exporters (16.2%). Administrative obstacles appear more prevalent among Indigenous SME exporters in remote regions.
Administrative barriers outside of Canada were also mentioned as a challenge to exporting, albeit by a smaller percentage of Indigenous SME exporters (32.2%). A recent trade policy report by the CCIB finds that Indigenous businesses can face numerous regulatory barriers that may hinder international expansion, such as adhering to country-specific technical regulations and standards, acquiring necessary certifications, navigating labelling requirements like country-of-origin labelling, working with numerous authorities like the U.S. Food and Drug Administration, and facing insufficient recognition of Indigenous companies and harvesting rights.Footnote 63
Firm location
Firm location is an export obstacle that also stands out more for remote exporters than urban exporters (Figure 13). This export obstacle holds unique significance as econometric analysis finds that Indigenous SMEs with export experience in remote areas are associated with 4 times higher odds of reporting location as an export obstacle, even when other factors are controlled for.
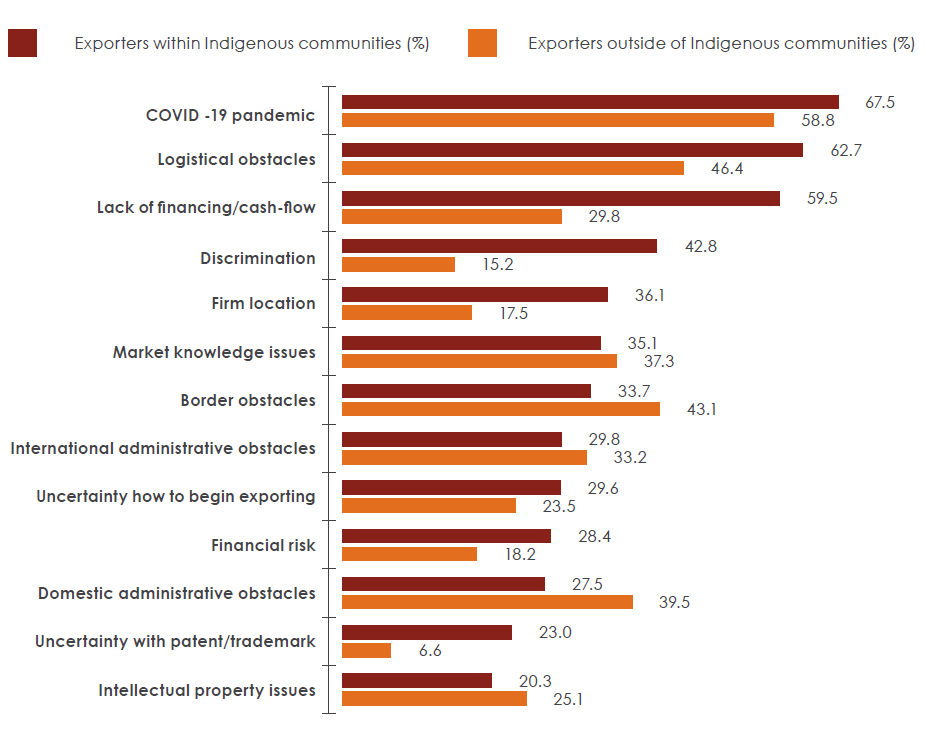
Figure 14: Moderate and major obstacles to export based on firm location within Indigenous communities
Text version - Figure 14
| Moderate and major obstacles to export | Exporters within Indigenous communities (%) | Exporters outside of Indigenous communities (%) |
|---|---|---|
| COVID-19 pandemic | 67.5 | 58.8 |
| Logistical obstacles | 62.7 | 46.4 |
| Lack of financing/cash-flow | 59.5 | 29.8 |
| Discrimination | 42.8 | 15.2 |
| Firm location | 36.1 | 17.5 |
| Market knowledge issues | 35.1 | 37.3 |
| Border obstacles | 33.7 | 43.1 |
| International administrative obstacles | 29.8 | 33.2 |
| Uncertainty how to begin exporting | 29.6 | 23.5 |
| Financial risk | 28.4 | 18.2 |
| Domestic administrative obstacles | 27.5 | 39.5 |
| Uncertainty with patent/trademark | 23.0 | 6.6 |
| Intellectual property issues | 20.3 | 25.1 |
Source: Canadian Council for Indigenous Business & Global Affairs Canada’s Survey of Indigenous Firms, 2021
Differences in shipping costs may present a locational and logistic barrier to exporting for firms in Indigenous communities. A report by the First Nations of Quebec and Labrador Economic Development Commission finds that businesses and members in First Nations communities pay significantly higher shipping costs than the average Canadian due in part to the pricing policies of major shipping companies. One notable example is the urban First Nations community of Wendake. Someone who lives in Wendake may pay 23–49% more to ship a package than someone in Quebec City who wishes to ship the same package across the same distance.Footnote 64
In addition, remote Indigenous communities that may not have access to roads year-round and must rely on transport via water or air may face shipping costs that are sometimes 150% higher.Footnote 65
Discrimination
Indigenous SME exporters located in Indigenous communities are much more likely to report discrimination as a moderate or major barrier to exporting compared to SMEs outside of Indigenous communities. Our econometric analysis estimates that they have 3.2 higher odds of reporting discrimination-related barriers compared to exporters outside of Indigenous communities when other factors are controlled for (Figure 12).
When speaking about partnerships with non-Indigenous firms, one First Nations business owner remarked that “barriers (to exporting) are trusting an Aboriginal business.” One avenue that government institutions may take to encourage further transparency around their partnerships with Indigenous Peoples is to showcase these partnerships more extensively so that they can serve as success stories to guide future engagement.
3.3 Why Indigenous SMEs stop exporting
It is typical for SMEs to enter and exit foreign markets sporadically. A recent study estimates that almost 40% of Canadian SMEs stop exporting after the first year.Footnote 66Footnote 67 Sometimes, these can be for strategic reasons; for instance, a construction firm might use a short-term contract to supply materials to a foreign company, rendering the firm an exporter for that duration.Footnote 68 However, once the contract concludes, the firm stops exporting. This strategic business behaviour may explain the high rate of export exit among Indigenous SMEs in select industries.
In our survey, 47.0% of Indigenous firms with export experience had their export activity interrupted at some point. This trend aligns closely with the experience of the average Canadian exporter.
The industries with the highest share of Indigenous firms that had experienced interruptions in exporting are agriculture, forestry, fishing, and hunting; construction; information and cultural industries; utilities; and other services. On the other hand, manufacturing, finance and insurance, retail trade, and wholesale trade represent industries with a high percentage of Indigenous SME exporters who were less likely to enter and exit export markets.
Figure 15: Reasons Indigenous SMEs stop exporting
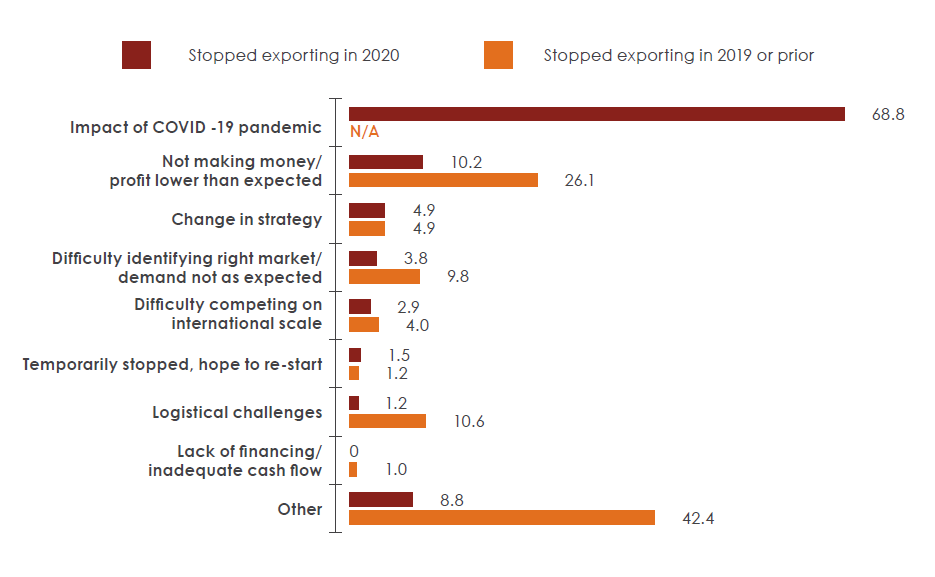
Text version - Figure 15
| Reason to stop | Stopped exporting in 2020 (% of firms) | Stopped exporting in 2019 or prior (% of firms) |
|---|---|---|
| Impact of COVID-19 pandemic | 68.8 | - |
| Not making money/profit lower than expected | 10.2 | 26.1 |
| Change in strategy | 4.9 | 4.9 |
| Difficulty identifying right market/demand not as expected | 3.8 | 9.8 |
| Difficulty competing on international scale | 2.9 | 4.0 |
| Temporarily stopped, hope to re-start | 1.5 | 1.2 |
| Logistical challenges | 1.2 | 10.6 |
| Lack of financing/inadequate cash flow | - | 1.0 |
| Other | 8.8 | 42.4 |
Source: Canadian Council for Indigenous Business & Global Affairs Canada’s Survey of Indigenous Firms, 2021
Note: Respondents could provide multiple reasons for why they stopped exporting.
Reasons why firms stopped exporting in 2020
Unsurprisingly, the pandemic is the prevailing factor for why Indigenous SMEs stopped exporting in 2020: 68.9% of firms who stopped exporting in 2020 selected COVID-19 as the main reason for closing their export operations. This mirrors the experience of many Canadian exporters. By April 2020, the number of exporting enterprises in Canada had declined by 20% compared to February 2020 levels.Footnote 69
Financial reasons were the second most reported reason why firms stopped exporting. While 10.1% of firms who stopped exporting cited lack of profits as their reason, it is plausible that many firms experienced financial issues from pandemic-related difficulties and are captured by the previous category.
For 4.9% of firms that stopped exporting in 2020, the decision to stop reflected a change in strategy. A change in strategy could be indicative of environmental factors (such as stopping exports due to pandemic-related measures), or it could be born out of reasons innate to the firm, such as suitability and interest. Unfortunately, it is not possible to distinguish between these factors from the data alone.
Reasons why firms stopped exporting in 2019 or prior
Financial factors represent the primary reasons for firms who stopped exporting in 2019 or prior. Some 26.0% of these firms reported that they were not making enough money or that their sales were lower than expected.
Logistical challenges also played a key role in why firms stopped exporting in 2019 or earlier, as reported by 10.6% of these firms. This reason reflects challenges related to transportation costs and distances to customers, among others.
Another common reason among firms that stopped exporting is difficulty identifying the right market and lower-than-expected demand. Among firms that ceased exporting in 2019 or earlier, 9.9% cited this, making it the third most reported reason. In contrast, 3.8% of firms that stopped exporting in 2020 mentioned this reason.
The key to understanding why firms stopped exporting due to unexpected issues with demand might lie in their motives for starting to export in the first place. Many of these firms began exporting for financial reasons, with over two-thirds reporting increased sales, profits, or expanding their customer base as the drivers behind starting to export. In contrast, less than one-third of these firms began exporting because they were approached by customers abroad.
Figure 16: Why Indigenous SMEs began exporting (among firms who stopped exporting due to poor overseas demand)
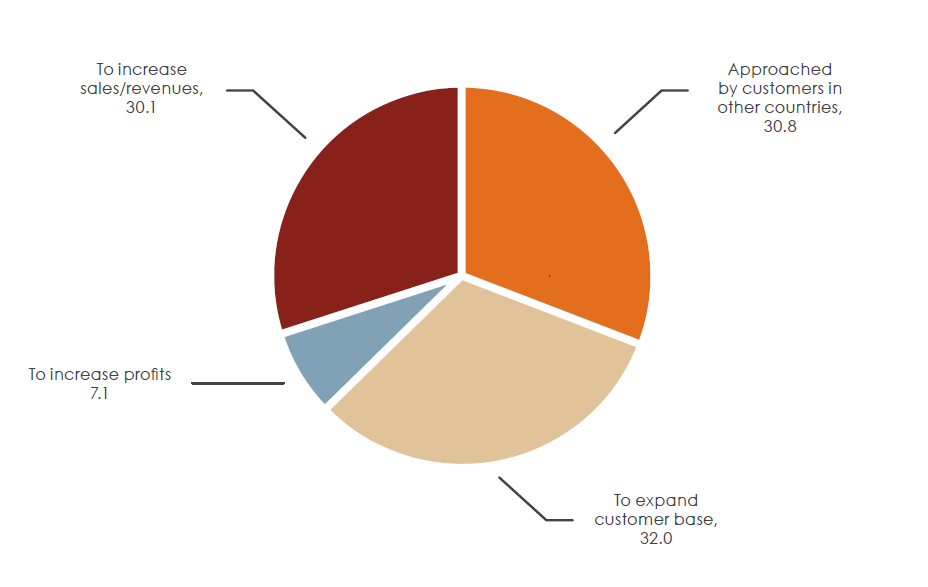
Text version - Figure 16
| Reason | % of Indigenous firms who stopped exporting due to poor overseas demand |
|---|---|
| Approached by customers in other countries | 30.8 |
| To expand customer base | 32.0 |
| To increase profits | 7.1 |
| To increase sales/revenues | 30.1 |
Source: Canadian Council for Indigenous Business & Global Affairs Canada’s Survey of Indigenous Firms, 2021
Note: This chart represents all firms that stopped exporting, including those that stopped in 2020 and those that stopped in 2019 or prior.
Chapter 4: Trade supports and policies to support exporters
Key messages
- We heard from Indigenous SME exporters and those who plan to start exporting about the program supports and trade policy measures they deem most helpful.
- People-to-people ties were named the top export support, with around two-thirds of Indigenous SMEs reporting it as “very helpful.”
- Help with accessing financing and the availability of financing sources are perceived as very useful supports, particularly for businesses in Indigenous communities or remote areas.
- Majority women-owned Indigenous SME exporters reported several export supports as very helpful at higher rates than their men or equally owned counterparts, including mentoring (56.6% vs. 24.3%, respectively); help developing a marketing plan (56.7% vs. 21.0%); or help developing an export plan (53.7% vs. 27.3%).
- In terms of the importance of trade policy measures, simpler customs procedures were the top-ranked measure, with more than half of Indigenous exporters deeming them very helpful.
- Policies that strengthen intellectual property protection for Traditional Knowledge and Cultural Expression are also highly valued, particularly by exporters in Indigenous communities (57.4%), in remote areas (57.5%), and that are women-owned (52.2%).
Figure 17: Heatmap of obstacles to export for various segments of Indigenous SME exporters
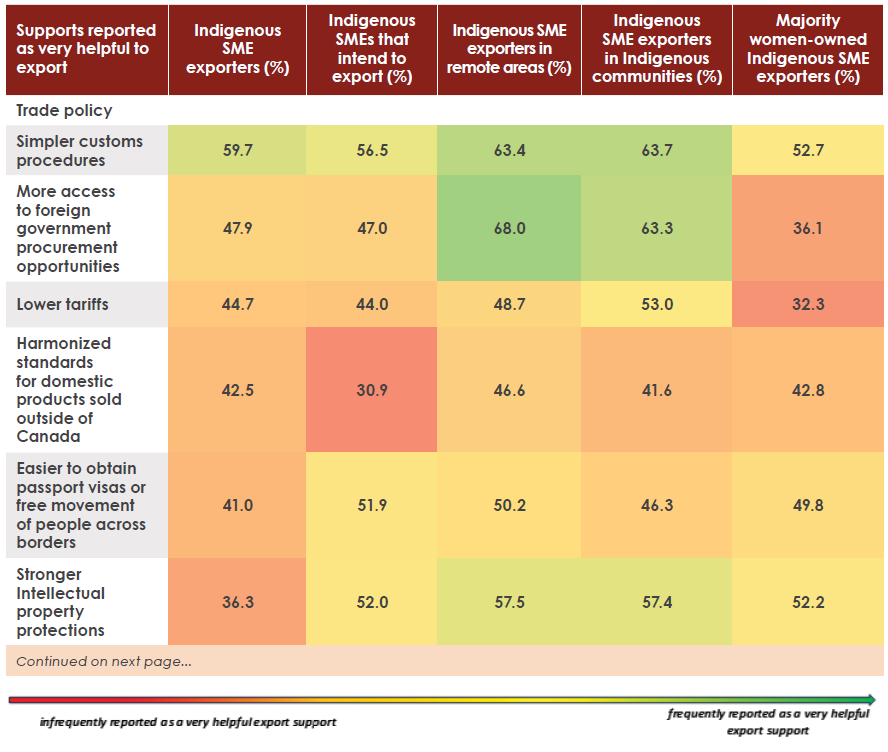
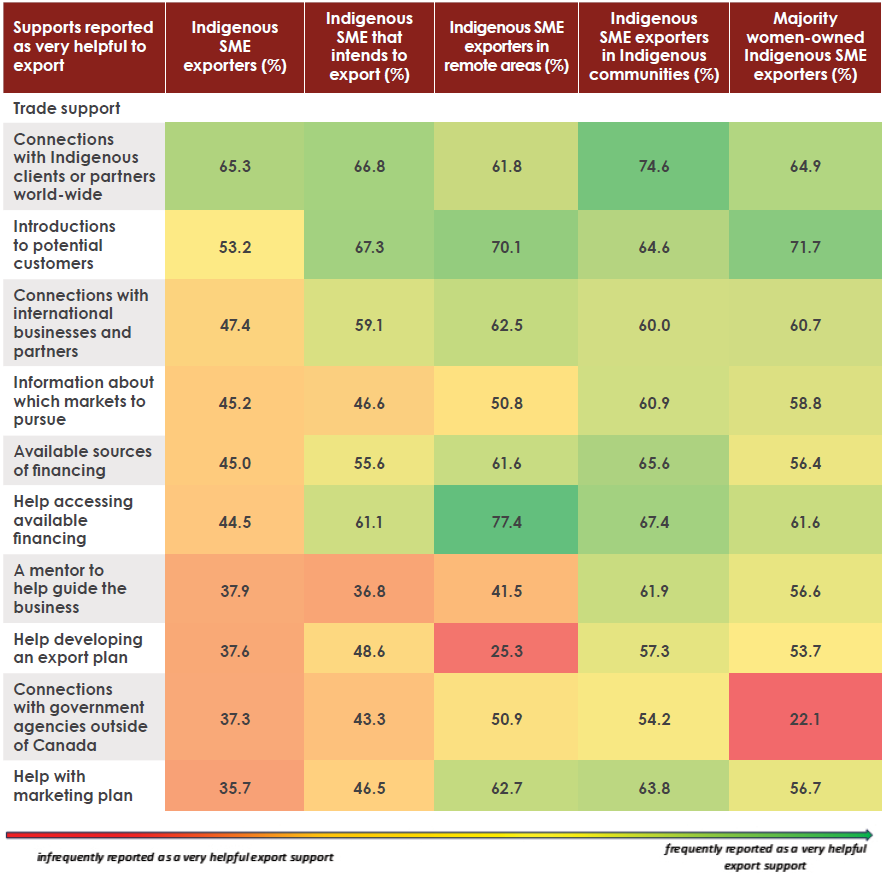
Text version - Figure 17
| Supports reported as very helpful to export | Indigenous SME exporters (%) | Indigenous SMEs that intend to export (%) | Indigenous SME exporters in remote areas (%) | Indigenous SME exporters in Indigenous communities (%) | Majority women-owned Indigenous SME exporters (%) |
|---|---|---|---|---|---|
| Trade policy | |||||
| Simpler customs procedures | 59.7 | 56.5 | 63.4 | 63.7 | 52.7 |
| More access to foreign government procurement opportunities | 47.9 | 47.0 | 68.0 | 63.3 | 36.1 |
| Lower tariffs | 44.7 | 44.0 | 48.7 | 53.0 | 32.3 |
| Harmonized standards for domestic products sold outside of Canada | 42.5 | 30.9 | 46.6 | 41.6 | 42.8 |
| Easier to obtain passport visas or free movement of people across borders | 41.0 | 51.9 | 50.2 | 46.3 | 49.8 |
| Stronger intellectual property protections | 36.3 | 52.0 | 57.5 | 57.4 | 52.2 |
| Trade support | |||||
| Connections with Indigenous clients or partners world-wide | 65.3 | 66.8 | 61.8 | 74.6 | 64.9 |
| Introductions to potential customers | 53.2 | 67.3 | 70.1 | 64.6 | 71.7 |
| Connections with international businesses and partners | 47.4 | 59.1 | 62.5 | 60.0 | 60.7 |
| Information about which markets to pursue | 45.2 | 46.6 | 50.8 | 60.9 | 58.8 |
| Available sources of financing | 45.0 | 55.6 | 61.6 | 65.6 | 56.4 |
| Help accessing available financing | 44.5 | 61.1 | 77.4 | 67.4 | 61.6 |
| A mentor to help guide the business | 37.9 | 36.8 | 41.5 | 61.9 | 56.6 |
| Help developing an export plan | 37.6 | 48.6 | 25.3 | 57.3 | 53.7 |
| Connections with government agencies outside of Canada | 37.3 | 43.3 | 50.9 | 54.2 | 22.1 |
| Help with marketing plan | 35.7 | 46.5 | 62.7 | 63.8 | 56.7 |
Source: Canadian Council for Indigenous Business & Global Affairs Canada’s Survey of Indigenous Firms, 2021
Note: Percentages reflect % of firms (of each segment) that reported the export support as very helpful.
4.1 Trade program supports
People-to-people connections
Current Indigenous exporters and firms intending to export see people-to-people connections as the most helpful exporting support.Footnote 70 In fact, according to these 2 groups, the top 2 “very helpful” supports for exporting are connections to Indigenous clients and introductions to potential customers.
Figure 18: Indigenous SMEs that deem trade support as very helpful to exporting
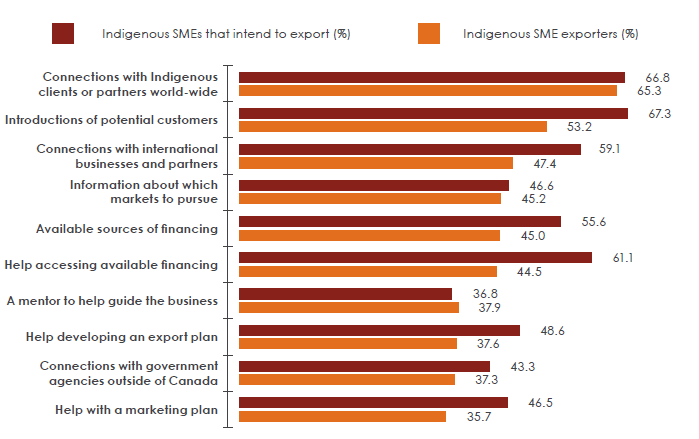
Text version - Figure 18
| Supports to export | Indigenous SMEs that intend to export (%) | Indigenous SME exporters (%) |
|---|---|---|
| Connections with Indigenous clients or partners world-wide | 66.8 | 65.3 |
| Introductions to potential customers | 67.3 | 53.2 |
| Connections with international businesses and partners | 59.1 | 47.4 |
| Information about which markets to pursue | 46.6 | 45.2 |
| Available sources of financing | 55.6 | 45.0 |
| Help accessing available financing | 61.1 | 44.5 |
| A mentor to help guide the business | 36.8 | 37.9 |
| Help developing an export plan | 48.6 | 37.6 |
| Connections with government agencies outside of Canada | 43.3 | 37.3 |
| Help with marketing plan | 46.5 | 35.7 |
Source: Canadian Council for Indigenous Business & Global Affairs Canada’s Survey of Indigenous Firms, 2021
For current exporters, connections with Indigenous clients or partners are deemed “very helpful” by the largest percentage of firms (65.3%). For firms that intend to export, introductions to potential customers are the most helpful support (67.3%), while the preference for Indigenous clients is a close second. Given that nearly one-third of Indigenous SMEs began exporting because clients approached them, there is a proven record for the importance of connections in empowering exporting.
In the words of one firm owner who reported an intention to export:
“More connections with suppliers in our industries, like other Indigenous businesses [would be helpful] so we support them because they are our people.”
- Business owner from the national survey
Connections with international businesses are the third most valued support for exporters, reported by 59.1% of Indigenous firms that intend to export and 47.4% of current exporters.
How geographic and gender factors can influence desired trade supports
The reported helpfulness of export supports varies among different segments of Indigenous SMEs. Characteristics such as geographic location and gender are found to play a role.
Geographic factors
Financing and business support
Indigenous firms located in Indigenous communities and remote regions report financial supports as especially useful. Some 67.4% of SME exporters in Indigenous communities (vs. 34.3% of those outside of Indigenous communities) and 77.4% of SME exporters in remote regions (vs. 47.3% of those in urban areas) reported that help accessing financing would be very useful for exporting. In fact, it was the top-ranked export support for firms in remote areas.
Figure 19: Indigenous SMEs that deem trade support as very helpful to exporting based on remoteness
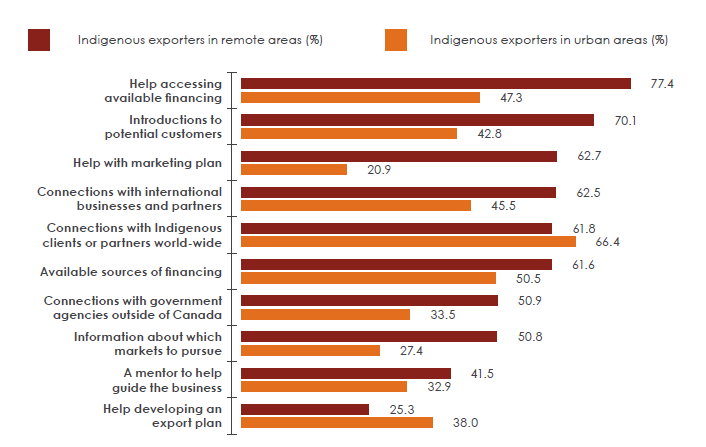
Text version - Figure 19
| Supports to export | Indigenous exporters in remote areas (%) | Indigenous exporters in urban areas (%) |
|---|---|---|
| Help accessing available financing | 77.4 | 47.3 |
| Introductions to potential customers | 70.1 | 42.8 |
| Help with marketing plan | 62.7 | 20.9 |
| Connections with international businesses and partners | 62.5 | 45.4 |
| Connections with Indigenous clients or partners world-wide | 61.8 | 66.4 |
| Available sources of financing | 61.6 | 50.5 |
| Connections with government agencies outside of Canada | 50.9 | 33.5 |
| Information about which markets to pursue | 50.8 | 27.4 |
| A mentor to help guide the business | 41.5 | 32.9 |
| Help developing an export plan | 25.3 | 38.0 |
Source: Canadian Council for Indigenous Business & Global Affairs Canada’s Survey of Indigenous Firms, 2021
While help in accessing financing was one of the top-rated supports, having financing sources available was also important, particularly for those in remote regions (61.6%) compared to urban (50.5%) and those within Indigenous communities (65.6%) compared to those outside (35.8%).
The fact that financing access and availability are highlighted as valuable supports by these firms emphasizes the multifaceted nature of the financial obstacles encountered by exporters in Indigenous communities or remote areas. Thus, supports may address numerous factors like access to financial resources, barriers in eligibility criteria, and awareness of different financial support sources.
An Indigenous exporter’s suggestion in terms of financing is to make “a fund to help Indigenous manufacturers address more financing on reserves.” In the same sentence, the exporter expressed the need for “more secure” loans, as financial institutions “don’t recognize houses and lands on reserves.”Footnote 71
Figure 20: Indigenous exporters that deem trade support as very helpful to exporting based on location in Indigenous community
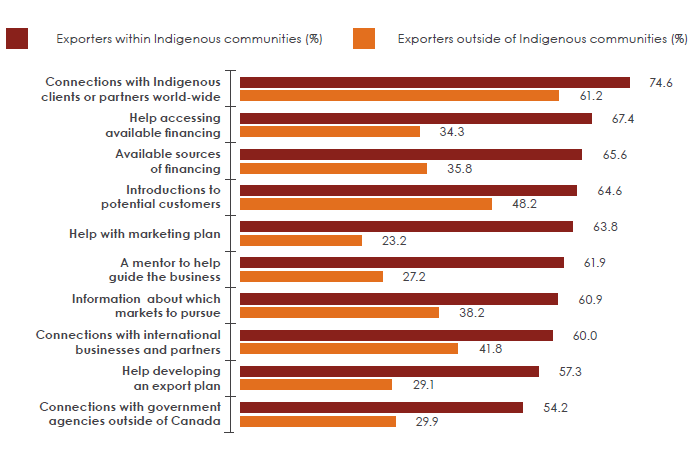
Text version - Figure 20
| Supports to export | Exporters within Indigenous communities (%) | Exporters outside of Indigenous communities (%) |
|---|---|---|
| Connections with Indigenous clients or partners world-wide | 74.6 | 61.2 |
| Help accessing available financing | 67.4 | 34.3 |
| Available sources of financing | 65.6 | 35.8 |
| Introductions to potential customers | 64.6 | 48.2 |
| Help with marketing plan | 63.8 | 23.2 |
| A mentor to help guide the business | 61.9 | 27.2 |
| Information about which markets to pursue | 60.9 | 38.2 |
| Connections with international businesses and partners | 60.0 | 41.8 |
| Help developing an export plan | 57.3 | 29.1 |
| Connections with government agencies outside of Canada | 54.2 | 29.9 |
Source: Canadian Council for Indigenous Business & Global Affairs Canada’s Survey of Indigenous Firms, 2021
Another support highlighted by exporters in Indigenous communities or remote areas is help with a marketing plan (63.8% and 62.7%, respectively). Interestingly, 3 times as many exporters in these geographic regions deem this support highly valuable relative to their counterparts outside of Indigenous communities or in urban areas.
The costs of marketing are also important considerations. For instance, one exporter in an Indigenous community reported that they needed help with “developing a marketing plan and marketing costs.”Footnote 72
In a similar vein, information about potential markets to pursue was reported as very helpful support by more exporters in remote areas (50.8%) than those in urban areas (27.4%). This difference may arise because remote communities tend to be more isolated from broader markets, have less exposure to international demand, and have less access to support and expertise.
Gender of ownership
Connections to clients
Increased opportunities for connections with potential customers were the most coveted support identified for Indigenous women exporters: 71.7% of Indigenous majority women-owned exporters reported this assistance to be highly valuable for their exporting endeavours, compared to 40.9% of majority Indigenous men-owned or equally owned exporters.
Figure 21: Indigenous SMEs that deem trade support as very helpful to exporting based on gender of ownership
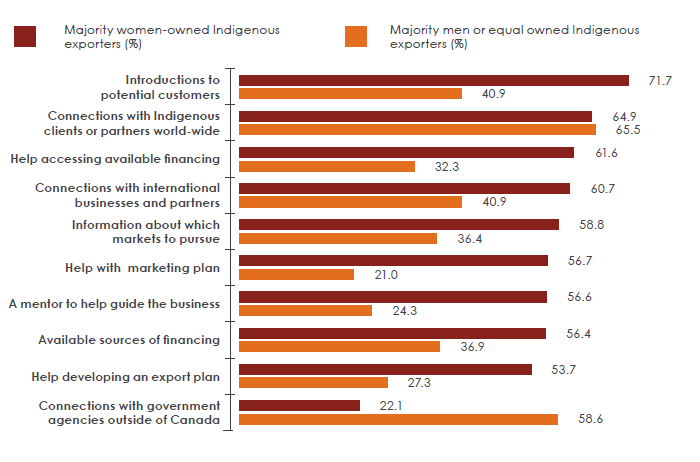
Text version - Figure 21
| Supports to export | Majority women-owned Indigenous exporters (%) | Majority men or equal owned Indigenous exporters (%) |
|---|---|---|
| Introductions to potential customers | 71.7 | 40.9 |
| Connections with Indigenous clients or partners world-wide | 64.9 | 65.5 |
| Help accessing available financing | 61.6 | 32.3 |
| Connections with international businesses and partners | 60.7 | 40.9 |
| Information about which markets to pursue | 58.8 | 36.4 |
| Help with marketing plan | 56.7 | 21.0 |
| A mentor to help guide the business | 56.6 | 24.3 |
| Available sources of financing | 56.4 | 36.9 |
| Help developing an export plan | 53.7 | 27.3 |
| Connections with government agencies outside of Canada | 22.1 | 58.6 |
Source: Canadian Council for Indigenous Business & Global Affairs Canada’s Survey of Indigenous Firms, 2021
Mentorship and business planning
Mentorship and business planning emerged as important forms of support for women-owned exporters. Compared to Indigenous majority men-owned or equally owned firms, Indigenous women exporters place a higher value on help with a marketing plan (56.7%), mentorship (56.6%), and help developing an export plan (53.7%).
Connections to international governments
Conversely, connections with government agencies outside of Canada are a particularly sought-after support among predominantly Indigenous men-owned or equally owned firms. Approximately 58.6% of these firms expressed that such support would be beneficial, ranking it the second-highest priority among this group.
4.2 Trade policy supports
In addition to asking Indigenous SMEs what trade supports would be helpful in exporting, our survey also asked firms to identify which trade policies would improve their ability to export.
Simpler customs procedures
The most useful trade policy identified by Indigenous SME exporters is simpler customs procedures, with 59.7% of current exporting firms naming it a very helpful support (see Figure 22). Similarly, 56.5% of firms that intend to export agreed that easier customs procedures would be very helpful for exporting.
Figure 22: Indigenous SMEs that deem trade policy as very helpful to exporting
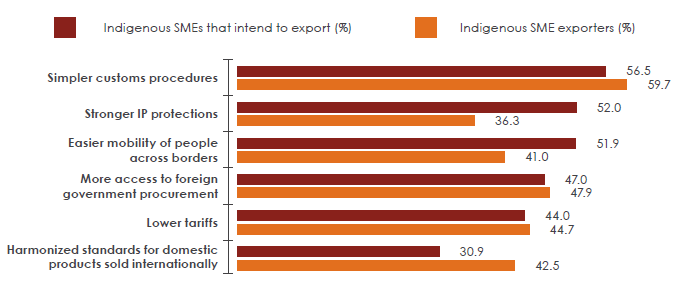
Text version - Figure 22
| Trade policy to support exporting | Indigenous SMEs that intend to export (%) | Indigenous SME exporters (%) |
|---|---|---|
| Simpler customs procedures | 56.5 | 59.7 |
| Stronger intellectual property protections | 52.0 | 36.3 |
| Easier to obtain passport visas or free movement of people across borders | 51.9 | 41.0 |
| More access to foreign government procurement opportunities | 47.0 | 47.9 |
| Lower tariffs | 44.0 | 44.7 |
| Harmonized standards for domestic products sold outside of Canada | 30.9 | 42.5 |
Source: Canadian Council for Indigenous Business & Global Affairs Canada’s Survey of Indigenous Firms, 2021
One Indigenous firm owner remarked “that the ability to do tribe-to-tribe business without barriers like duties, tariffs, and customs” would improve their ability to export.
Foreign government procurement opportunities
Indigenous SME exporters cited access to foreign government procurement opportunities as the next most helpful trade policy (47.9%).
Foreign government procurement markets offer significant opportunities to Canadian exporters: estimates suggest that these markets are worth hundreds of billions of dollars annually.Footnote 73 As such, Canada is committed to improving access to foreign government procurement markets for Canadian suppliers. For example, most of Canada’s free trade agreements contain a chapter on government procurement. Canada is also a party to the World Trade Organization (WTO) Agreement on Government Procurement (GPA), which includes rules governing procurement conduct with the principles of non-discrimination, impartiality, and transparency.Footnote 74
Intellectual property protections
For firms intending to export, stronger IP protections are the second highest ranked (52.0%) policy to support exporting. Indigenous SMEs who intend to export are concentrated in industries where products may contain TK or CE, such as accommodation and food services (17.6%), professional services (17.4%), and arts, entertainment, and recreation (13.2%).
Stronger IP protection was reported useful at higher rates by 3 groups of Indigenous SMEs: (1) exporters in Indigenous communities (57.4%) as opposed to outside of Indigenous communities (26.6%); (2) exporters in remote regions (57.5%) as opposed to those in urban areas (30.8%); and (3) majority-women-owned exporters (52.2%) as opposed to majority men or equal-owned exporters (22.0%).
IP systems have often failed to recognize TK and CE. While more work remains, steps are being taken to improve the protection of Indigenous IP. For instance, the World Intellectual Property Organization (WIPO) is developing international legal instruments for the specific protection of TK.Footnote 75 In May 2024, after 20 years of discussions, the member states of WIPO adopted a new treaty on genetic resources and associated TK, with specific provisions for Indigenous Peoples. Once in force, the treaty introduces disclosure requirements in patent applications when genetic resources and/or associated TK are materially linked to the claimed invention.Footnote 76
Canada is also advancing policies and programs to enhance international trade opportunities for Indigenous businesses with TK. One example of this work is the inclusion of provisions on TK in the intellectual property chapter of the Comprehensive and Progressive Agreement for Trans-Pacific Partnership (CPTPP) free trade agreement.Footnote 77 However, more work remains to ensure these efforts are directed by Indigenous leaders in line with the United Nations Declaration on the Rights of Indigenous Peoples, such as empowering Indigenous communities to determine how their IP is recognized, catalogued, managed, and protected. Supporting Indigenous IP capacity through a “by Indigenous, for Indigenous” approach advances reconciliation by recognizing many articles of the UN Declaration, especially Article 31.Footnote 78
Geographic factors
Exporters in Indigenous communities deemed numerous policies “very helpful” for exporting at higher rates than exporters outside of Indigenous communities. Policies addressing access to foreign federal procurement (22.8 percentage points higher), lower tariffs (11.2 percentage points higher), easier movement of people across borders (7.7 percentage points higher), and simpler customs procedures (5.7 percentage points higher) had notable differences.
Figure 23: Indigenous SMEs that deem trade policy as very helpful to exporting based on location in Indigenous community
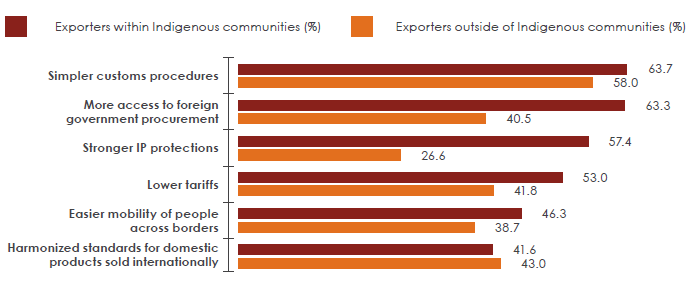
Text version - Figure 23
| Trade policy to support exporting | Exporters within Indigenous communities (%) | Exporters outside of Indigenous communities (%) |
|---|---|---|
| Simpler customs procedures | 63.7 | 58.0 |
| More access to foreign government procurement opportunities | 63.3 | 40.5 |
| Stronger intellectual property protections | 57.4 | 26.6 |
| Lower tariffs | 53.0 | 41.8 |
| Easier to obtain passport visas or free movement of people across borders | 46.3 | 38.7 |
| Harmonized standards for domestic products sold outside of Canada | 41.6 | 43.0 |
Source: Canadian Council for Indigenous Business & Global Affairs Canada’s Survey of Indigenous Firms, 2021
Indigenous firms located in remote areas cited many of the same concerns. Stronger IP protections (26.7 percentage points higher) and access to foreign government procurement (21.3 percentage points higher) showed the biggest differences relative to urban firms (see Figure 24).
Figure 24: Indigenous SMEs that deem trade policy as very helpful to exporting based on remoteness
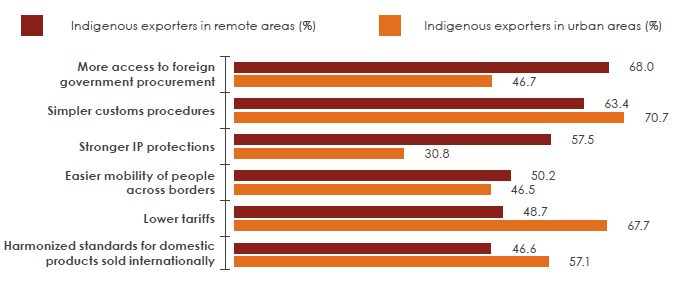
Text version - Figure 24
| Trade policy to support exporting | Indigenous exporters in remote areas (%) | Indigenous exporters in urban areas (%) |
|---|---|---|
| More access to foreign government procurement opportunities | 68.0 | 46.7 |
| Simpler customs procedures | 63.4 | 70.7 |
| Stronger intellectual property protections | 57.5 | 30.8 |
| Easier to obtain passport visas or free movement of people across borders | 50.2 | 46.5 |
| Lower tariffs | 48.7 | 67.7 |
| Harmonized standards for domestic products sold outside of Canada | 46.6 | 57.1 |
Source: Canadian Council for Indigenous Business & Global Affairs Canada’s Survey of Indigenous Firms, 2021
To a lesser extent, the movement of people across borders, such as the ease of obtaining passports and visas, was more important for remote firms than urban firms (3.7 percentage points higher). One Indigenous exporter in a remote region noted that a “streamlining of border crossing” would be helpful in improving their ability to export. Another exporter in a remote region shared that their business would benefit from policies that “enable our workers to work in the United States.”
The United States has recognized provisions that allow Indigenous Peoples to move freely across the Canada-US border, dating back to the Jay Treaty. However, even though the Jay Treaty has been in effect since before the implementation of Section 35 of the Constitution Act, this provision is not binding within Canada.Footnote 79 More research is needed to understand how harmonizing standards among governments can bolster labour and commercial mobility to support participation in export, including the movement of Indigenous employees. This would also help us understand how this ties into the United Nations Declaration on the Rights of Indigenous Peoples and Canada’s efforts to implement its associated UN Declaration Act.
Gender of ownership
For women-owned exporters, stronger IP protections (52.2% vs. 22.0%) and policies that ease people’s mobility (49.8% vs. 37.0%) were reported as being very helpful at higher rates than majority men-owned or equally owned firms. On the other hand, majority men-owned or equally owned firms place a higher value on policies that could increase access to foreign government procurement. For 54.2% of majority men-owned or equally owned exporters, policies related to increased government procurement abroad would be very helpful in exporting.
Figure 25: Indigenous SMEs that deem trade policy as very helpful to exporting based on gender of ownership
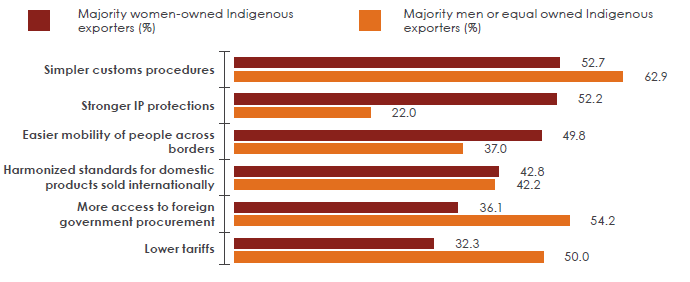
Text version - Figure 25
| Trade policy to support exporting | Majority women-owned Indigenous exporters (%) | Majority men or equal owned Indigenous exporters (%) |
|---|---|---|
| Simpler customs procedures | 52.7 | 62.9 |
| Stronger intellectual property protections | 52.2 | 22.0 |
| Easier to obtain passport visas or free movement of people across borders | 49.8 | 37.0 |
| Harmonized standards for domestic products sold outside of Canada | 42.8 | 42.4 |
| More access to foreign government procurement opportunities | 36.1 | 54.2 |
| Lower tariffs | 32.3 | 50.0 |
Source: Canadian Council for Indigenous Business & Global Affairs Canada’s Survey of Indigenous Firms, 2021
Preferred supports for First Nations, Métis, and Inuit-owned firms that have export experience or intend to export
First Nations SME owners consistently report financing as a barrier to growth at higher rates than the Indigenous SME average. As such, they are also more likely to report that both improved accessibility of financing (+4.3 percentage points) and availability of financing (+2.1 percentage points) would be beneficial for exporting compared to all Indigenous firms who have export experience or intend to export. Connections with international businesses (+5.6 percentage points) are a more valued support for First Nations-owned firms than for the average Indigenous firm. Regarding trade policies, stronger IP protection is also more valued by First Nations firms than for the Indigenous average (+4.4 percentage points).
Métis-owned firms place a larger value on connections with government agencies outside of Canada (+3.7 percentage points) and connections with Indigenous clients worldwide (+3.5 percentage points) than all Indigenous firms with export experience or intent to export. Regarding trade policies, they place unique significance on access to foreign government procurement opportunities (+12.2 percentage points) and simpler customs procedures (+8.4 percentage points). Conversely, stronger IP protection is less of a priority (-13.3 percentage points) for Métis-owned SMEs compared to all Indigenous firms with export experience or who intend to export.
For Inuit firms, help developing a marketing plan (+11.6 percentage points) and availability of financing sources (+3.1 percentage points) are more valued supports than for all Indigenous SMEs. Regarding trade policies, Inuit firms place a higher value on stronger IP protection (+9.9 percentage points) and harmonized standards for domestic products sold outside of Canada (+8.2 percentage points) than the Indigenous average.
Please see Table 2.5A in the appendix for more information on the policies and supports reported as very helpful to exporting by identity of ownership.
Chapter 5: Case Studies in 3 First Nations communities
A key input of this body of research is the perspectives and insights of Indigenous entrepreneurs operating in the community, including First Nations reserves. As identified throughout the report, these businesses face amplified barriers to growth and exporting associated with location, logistics, digital connectivity, and infrastructure. Moreover, these voices are not always well captured in national surveys.
To provide a more fulsome data story and give a voice to the survey findings explored in previous sections, CCIB conducted 64 interviews with local Indigenous business owners to gather additional qualitative data related to the experiences of community-based businesses and economies. These business interviews were supplemented by discussions with 3 economic development officers (EDO) to obtain an overview of the operating environment and potential impacts of trade and export on economic development. It is important to note that these case studies provide insights into the unique conditions of 3 select communities, and findings should not be generalized to the experience of community-based firms more broadly.
To collect this valuable information in a respectful, reciprocal, and sensitive manner to cultural expectations, CCIB dedicated considerable time and effort to identifying and developing relationships with the appropriate community leaders from 3 First Nations. To select the communities, CCIB used publicly available data to examine extensive portions of First Nations reserves in 5 regions of Canada: Central Canada (Ontario and Quebec), the Prairies (Manitoba and Saskatchewan), Western Canada (Alberta and British Columbia), Atlantic Canada (New Brunswick, Nova Scotia, PEI, and Newfoundland and Labrador), and the North (Northwest Territories, Yukon, and Nunavut). CCIB first identified the population of each community, estimated the number of businesses using existing business lists and registries, and considered other factors to understand the average individual and business populations on reserve.Footnote 80
Based on this information, CCIB categorized communities as small, medium, or large relative to the regional average. Our selection aimed to represent both larger and smaller communities and ensure geographic diversity. CCIB then developed a short list of communities and conducted outreach, usually starting with the administrative office or economic development department. As a result of our efforts to cultivate relationships, which took a number of months and, in some cases, up to a year, CCIB was granted permission to access these business communities in 3 of the regions.Footnote 81 In each community, the approval process varied—ranging from band council resolutions to decisions by economic development committees or senior administrators. However, in all cases, a data-sharing agreement was signed after a thorough review by CCIB and the community of interest, ensuring co-ownership of the data.
Community #1 profile
Community description: This First Nation community in Western Canada is approximately 100 kilometres from the nearest population centre and accessible year-round by ferry, train, road, flight, or short drive. Based on CCIB’s desk research and community business lists provided by the EDO, CCIB identified at least 75 active businesses in Community #1. It is important to note that there may be organizations that were not captured in this sample.
Projects and economic opportunities in the community: Year-round wildlife monitoring and natural resources projects like mining, forestry, and hydropower are ongoing or in the planning stages. Many of these projects result in local procurement, opportunities the community’s leadership views as key to growing the local Indigenous economy.
The First Nation has partnered with Indigenous communities in other countries to solidify Nation-to-Nation trade relations. These relationships are founded on a shared economic interest in resource extraction, oil and gas, and liquid natural gas.
Population size: In 2021, the First Nation had a population between 5,000 and 10,000 people, making it a moderately sized Indigenous community within the area.
Industry breakdown: The 43 business owners who participated in interviews represent the following industries.
Figure 26: Community #1 respondents by industry (% share and firm count)
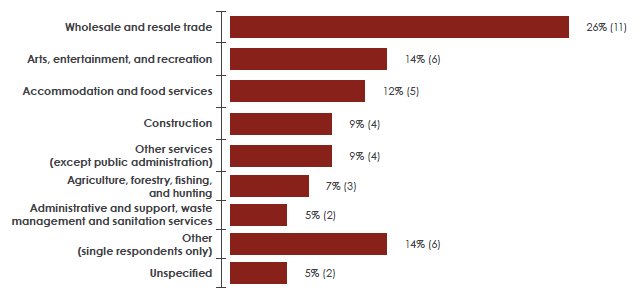
Text version - Figure 26
| Industry | Percentage | Number |
|---|---|---|
| Wholesale and retail trade | 26% | 11 |
| Arts, entertainment, and recreation | 14% | 6 |
| Accommodation and food services | 12% | 5 |
| Construction | 9% | 4 |
| Other services (except public administration) | 9% | 4 |
| Agriculture, forestry, fishing, and hunting | 7% | 3 |
| Administrative and support, waste management and remediation services | 5% | 2 |
| Other (single respondents only) | 14% | 6 |
| Unspecified | 5% | 2 |
Source: Canadian Council for Indigenous Business and Global Affairs Canada’s First Nations Community Interviews (2021).
Note: Other includes professional, scientific, and technical services, management of companies or enterprises, health care and social assistance, transportation and warehousing, manufacturing, and information and cultural industries.
Export activity: Only 5 respondents out of the 43 surveyed said they had exported (now or in the past). Most of the exporters in Community #1 are concentrated in the arts, entertainment, and recreation industries (3 respondents), with 1 respondent also noting retail trade.
The United States was the only destination market cited by exporters (2 of 5 respondents). When it comes to markets of interest for firms who plan to export, 8 of 43 total respondents cite that the United States. Australia, Germany, and France would be desirable export markets in the future.
Most exporting businesses did not start with that specific intention (3 of 5 respondents); however, individuals who began exporting at some point grew their operations on a larger scale. Notably, almost a quarter of businesses from Community #1 (10 respondents) reported some revenue from customers located in other provinces or territories, making them prime candidates to further scale and transition into international markets.
Roughly half of Community #1 businesses have reported online sales (19 of 35 respondents), most of which (11 respondents) have increased because of COVID-19.
Export barriers and enablers: Financial risks like longer payment terms or client non-payment were identified as the most common major or moderate barrier to exporting (8 respondents), followed by remoteness or location and a lack of financing access (6 respondents each), and discrimination (5 respondents).
The majority of businesses (9 respondents) said that connections with Indigenous partners worldwide were the most valuable support (both somewhat and very helpful) for overcoming the hurdles to exporting identified, with introductions to clients coming in a close second (8 respondents). Also frequently cited were enhanced accessibility and availability of financing, market information, connections with international business partners, and assistance in developing an export strategy (each with 7 respondents).
Community #2 Profile
Community description: This First Nations community in the Prairies is approximately 200 kilometres from the nearest large population centre and has year-round road access. Using a similar approach to gathering business contacts from desk research and community-supplied lists, CCIB was able to identify at least 140 businesses in Community #2. Despite this effort, only fifteen businesses participated in the interviews.
Projects and economic opportunities in the community: In addition to many privately owned firms, Community #2 has a community-owned economic development corporation that oversees several subsidiaries providing a range of services, such as information technology, insurance, property management, transportation and logistics, hospitality, human resources and project management, engineering, procurement services, construction, security, janitorial, mining, and environmental monitoring and impact assessment.
The community is involved in certification programs and projects that promote sustainable forestry management. With several mining projects located on or near their traditional lands, the First Nation has entered partnerships with mining companies to develop mineral resources and share in the economic benefits. As another example of their resource-based economy, Community #2 owns and operates a variety of tourism businesses, including a fishing lodge, a wilderness park, and a cultural centre. Retail is another promising local activity, with various businesses owned and operated by the community, including gas stations and a grocery store.
Population size: In 2023, Community #2 had a larger population than the average First Nation in the area, with a substantial on-reserve population ranging from 5,000 to 10,000 people.
Industry breakdown: Below are the industries in which the 15 business respondents from Community #2 are engaged.
Figure 27: Community #2 respondents by industry (% share and firm count)
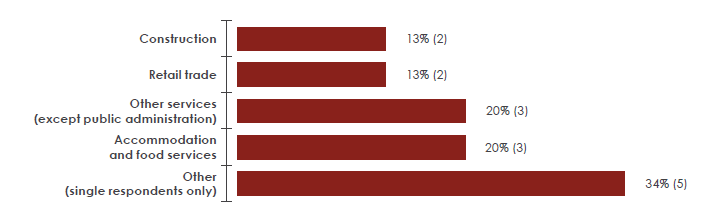
Text version - Figure 27
| Industry | Percentage | Number |
|---|---|---|
| Construction | 13% | 2 |
| Retail trade | 13% | 2 |
| Other services (except public administration) | 20% | 3 |
| Accommodation and food services | 20% | 3 |
| Other (single respondents only) | 34% | 5 |
Note: Other includes agriculture, forestry, fishing, and hunting, transportation and warehousing, educational services, professional, scientific and technical services such as legal, and arts, entertainment and recreation.
Source: Canadian Council for Indigenous Business and Global Affairs Canada’s First Nations Community Interviews (2021).
Export activity: The 3 exporters in Community #2 consist of one firm in retail trade, another in arts, entertainment, and recreation, and the third in other services excluding public administration, which includes repairs, maintenance, personal, and laundry services. Only 1 business provided additional detail on the location of their exports, reporting their primary market as the United States. Other exporters from this First Nation did not export in 2020 since they either started their business or began exporting after 2020; thus, they did not provide their current destination markets.
Regarding intended export markets, 2 entrepreneurs who desire to expand are targeting the United States, while only one indicated other places such as Italy, China, and Switzerland.
None of the businesses we spoke to set out with the specific intention of exporting. However, for some, exporting became valued over time to ensure continued growth and profitability. Most of these businesses’ gross revenues were made locally (11 of 15 respondents), with far fewer reporting sales in other parts of the province (4 respondents), supporting the notion that export obstacles exist within this community or region. One possible contributor to this issue is the limited adoption of online sales among local businesses, with the majority not having online sales (9 respondents do not offer online sales).
Export barriers and enablers: Similar to Community #1, the location or remoteness of the business was the most common moderate or major barrier to exporting, along with administrative obstacles in Canada and the unprecedented COVID-19 pandemic (3 of 15 respondents each).
All 4 respondents intending to export in the future said the following supports would be very helpful in achieving their export goals: help developing export and marketing plans, increasing available financing sources and facilitating access to them, providing market intelligence, and introducing potential customers.
Community #3 profile
Community description: This First Nations community in the Territories is located approximately 50 kilometres from the nearest large population centre and is accessible year-round by road. With cooperation from the EDO, desk research by CCIB revealed at least 65 active businesses in Community #3. Again, we emphasize that not all organizations were captured in this sample.
Projects and economic opportunities in the community: 2 multi-year, construction-related infrastructure projects are underway, including a hospital and the remediation of a decommissioned mining site. The community’s industry participation is heavily influenced by local geology resources, favouring mining, construction, transportation, and tourism activity. The community’s economic development entity controls a diverse portfolio that fulfills business and procurement gaps related to the major industries represented in the region.
Population size: The registered population of this community is less than 5,000 people.
Industry breakdown: Below is a breakdown of the industry representation in the Community #3 survey, which consisted of 8 interviews.
Figure 28: Community #3 respondents by industry (% share and firm count)
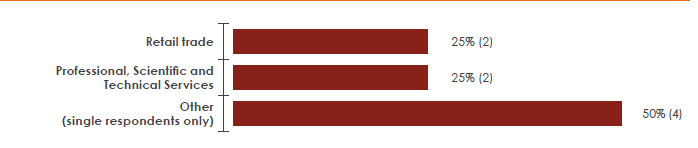
Text version - Figure 28
| Industry | Number | Percentage |
|---|---|---|
| Retail trade | 2 | 25% |
| Professional, scientific, and technical services | 2 | 25% |
| Other (single respondents only) | 4 | 50% |
Note: Other includes transportation and warehousing, health care and social assistance, agriculture, forestry, fishing and hunting, and mining, oil and gas extraction.
Source: Canadian Council for Indigenous Business and Global Affairs Canada’s First Nations Community Interviews (2021).
Export activity: 4 respondents from Community #3 generate sales in other provinces or territories, but only 2 are currently exporting. Both run e-commerce stores in the retail trade industry. Both cited the United States and the European Union as their primary export markets, with plans to expand their efforts in the United States, the United Kingdom, and Mexico. These businesses had differing expectations for exporting, with one having a specific intention to export and the other setting the intention later on; however, due to their online presence, a small fraction of their sales have organically reached international consumers. Most business entrepreneurs from this community focused on serving their local or provincial markets (4 and 5 respondents, respectively).
Export barriers and enablers: The only major barrier reported by the 2 respondents who exported was uncertainty about patenting or trademarking products internationally, but they recognized a host of other moderate hurdles mentioned by the other communities. These various barriers include border regulations, logistical costs, and a lack of market knowledge. The high cost of living, difficulty retaining qualified staff, and inconsistent and unreliable internet connections exacerbated the challenges cited, particularly for small and online businesses.
To overcome these challenges, the exporters in Community #3 stated that assistance with global Indigenous networking, marketing plan development, business mentorship, and other connections to international government agencies and businesses would be the most beneficial to their exporting journey, further emphasizing relationship-building as a cornerstone of Indigenous business.
What we learned
While our community-based research included a relatively small sample of Indigenous businesses participating in export, the similarities with the national findings are apparent. Concerning intended and current export markets, the United States remained the most cited, followed by the European Union, the United Kingdom, and, to a lesser extent, Mexico and China.
The export barriers mentioned by respondents in the community studies mirror trends captured in the national study. Remoteness, logistical issues, discrimination against community-based Indigenous businesses, access to financing, and issues with IP provisions are all cited as major or moderate barriers faced by local businesses that are currently exporting or intend to export.
Many of the supports raised by respondents also reflect those highlighted in the national survey. Introductions to potential overseas clients, connections with international Indigenous partners, mentorship support, and market knowledge are all key resources recognized as somewhat helpful or very helpful in overcoming the barriers involved in exporting. These preferences illustrate the importance that these entrepreneurs place on mentorship and network access to provide learning opportunities and connections to Indigenous economies.
Among Indigenous entrepreneurs in the community, there is a varying level of familiarity with the term “exporting.” At first, many respondents did not consider export sales as distinct from their regular business operations and did not have a defined export plan or intention. Specifically, some Indigenous business owners said they were not exporters. However, upon further inquiry, they revealed past or current exports, including sales to clients in the United States (particularly where the community is close to the border) or global online sales. Sometimes, their exporting activity is infrequent, such as selling artwork several years ago, which contributes to them not viewing themselves as exporters. It is possible that the discussion’s focus on “exporting” may have contributed to fewer people self-identifying as exporters, leading to an underrepresentation in the count. This factor is an important consideration for future study in this area. Future research could explore trade awareness and demystifying exporting (including what counts as exporting and what kind of goods and services are exportable) to enhance access to funding and training programs.
Chapter 6: Conclusion
This multi-year study of Indigenous businesses conducted by Global Affairs Canada and CCIB contributes to understanding the export experiences of Indigenous SMEs. In developing a new data set with a national survey of 2,603 Indigenous-owned firms and conducting case studies and interviews in 3 First Nations communities, this work explores Indigenous entrepreneurs’ growth and export challenges and presents the trade program and policy supports that are valued by these firms.
Findings from Adàwe uncovered a sizable gap in the export propensity of Indigenous SMEs (7.2%) compared to the national average (12.1%). This finding motivated a deeper investigation of the export obstacles standing in the way and what can be done to mitigate them, which is the focus of Atāmitowin.
First, we investigated Indigenous SMEs’ challenges in business expansion, a key indicator for the health and sustainability of a business. We then turned to identifying export obstacles, including how these challenges vary among firm characteristics such as remoteness, location on Indigenous communities, and gender of the owner. We also explored the decisions behind exporting behaviour, such as why Indigenous SMEs start and stop exporting, and the trade policies and supports they find valuable in improving their export experiences.
Throughout the report, we included quotes from our 3 case studies. These firsthand accounts aimed to deepen our understanding of on-the-ground realities. Chapter 5 provides the profiles of each of the 3 communities that participated.
Bringing all this information together, we identified 5 priority areas to consider in supporting Indigenous SMEs on their export journeys:
1. Labour
There is a well-established relationship between skilled labour and firm growth. Yet, over 3 out of 5 Indigenous SMEs reported substantial challenges in finding employees with the requisite skills and qualifications—a figure well above the Canadian SME national average. A significant portion of Indigenous firms citing labour challenges were in services industries such as transportation and warehousing; arts, entertainment and recreation; health care; and accommodation and food services, which may be reflective of the pandemic-related challenges at the time of the survey.
Firms in remote regions can experience heightened difficulties in finding workers with the right skills and qualifications. We heard this sentiment expressed in both the national survey and the community interviews, in which multiple Indigenous business owners expressed difficulty in attracting employees and linked it to challenges associated with remoteness such as their community lacking accommodations.
Indigenous businesses tend to employ Indigenous Peoples at higher rates than other businesses.Footnote 82 This can yield benefits such as shared values, better worker retention, and a recirculation of benefits into the community, especially when hiring people from a local community.Footnote 83 Therefore, skills development and capacity-building are important areas for policy focus—not only for Indigenous individuals wanting high-quality jobs, but also for the growth and sustainability for Indigenous-owned businesses.
2. Finance and capital
Access to finance or capital is crucial for both growth and exporting, for upfront investments, buffers against risks, and supports scalability. Our analysis finds that when it comes to business growth, 45.9% of Indigenous SME exporters report that access to equity or capital is a significant barrier to firm growth. In the realm of export obstacles, 38.9% of Indigenous exporters encounter challenges related to a lack of financing, with a more marked impact on Indigenous SMEs within Indigenous communities (59.5% of firms).
To address these challenges, consideration should be given to the factors driving them (such as understanding impacts on on-reserve firms resulting from the Indian Act) and the availability or effectiveness of support mechanisms to make financing more accessible to Indigenous SMEs.
Our work further finds that Indigenous SMEs strongly support policies related to increasing financing access: for Indigenous exporters in Indigenous communities, help accessing available financing (67.4%) and help with available sources of financing (65.6%) are among the top 3 most helpful supports for exporting. Help accessing available financing is also important for Indigenous firms who intend to export, reported by 61.1% as a very useful export support.
3. Infrastructure
Adequate physical and digital infrastructure can empower participation in global trade. However, more than 1 in 4 Indigenous SMEs report that physical infrastructure is a barrier to growth and nearly 2 in 5 report that reliable digital infrastructure is a barrier to growth.
These challenges are more pronounced for firms in remote and Indigenous communities. Logistical challenges, which are closely tied to infrastructure, are rated as the most pressing export barriers for Indigenous exporters in remote areas (67.5%) and the second-most pressing for Indigenous exporters in Indigenous communities (62.7%).
Additionally, almost half of firms in remote areas or Indigenous communities report reliable digital infrastructure as a challenge to growth. Adàwe found that e-commerce was of great importance to Indigenous SME exporters, associated with 6 times higher odds of exporting. It is, therefore, concerning that Indigenous SMEs report such difficulties in accessing reliable digital infrastructure.
4. Intellectual property
Indigenous exporters report that intellectual property (IP) protection is a barrier to exporting at a 3.8 times higher rate than the average for all Canadian SME exporters. Given the prominence of this obstacle for Indigenous SMEs, it is unsurprising that over half (52.0%) of the Indigenous businesses intending to export cited strengthened IP protection as a very helpful export policy.
The perceived importance of this policy is especially heightened for the following 3 groups:
- exporters in Indigenous communities (57.4%) as opposed to outside of Indigenous communities (26.6%)
- exporters in remote regions (57.5%) as opposed to those in urban areas (30.8%)
- majority-women-owned exporters (52.2%) as opposed to majority-men or equally owned exporters (22.0%)
There has been some very recent progress in this area, with the recent treaty signed by World Intellectual Property Organization member states on genetic resources and associated Traditional Knowledge. However, this is just one component of Indigenous IP, and more work needs to be done. Moreover, Indigenous-owned SMEs, particularly those in Indigenous communities, remote regions, and owned by women, require access to the required supports to adequately protect their IP.
5. People-to-people connections
The top 3 export supports that Indigenous SMEs reported being the most helpful are people-to-people connections, namely connections to Indigenous clients or partners worldwide (65.3% of exporters deem this support to be very useful), introductions to customers (53.2%), and connections with international businesses or partners (47.4%).
Adàwe uncovered outsized commercial links to Australia and New Zealand—countries with large Indigenous populations and whose governments are advancing Indigenous economic and social inclusion policies. Indigenous SME interest in these markets may be connected to their stated preference for Indigenous-to-Indigenous business connections.
Given the strong importance put on these supports—which were ranked even higher than financial supports—programs that support networking opportunities and trade missions for Indigenous entrepreneurs, such as those offered by the Trade Commissioner Service and the Canadian Council for Indigenous Business, can play a key role in empowering export engagement for Indigenous firms.
As highlighted in Adàwe, Indigenous SMEs without current export activities are 4 times more likely to have plans for international expansion compared to the national average. This strong desire to export underscores the importance of addressing the challenges that hinder Indigenous participation in global trade.
Through in-depth analysis, this report delved into the barriers Indigenous-owned SMEs face in growing their businesses, the specific obstacles they encounter in exporting, and the types of trade programs and policy supports they find valuable.
Are you an Indigenous business interested in exporting? Here’s where you can start
The Trade Commissioner Service (TCS) is a valuable resource for firms wanting to build their global network. The TCS is a free service Global Affairs Canada provides that helps Canadian businesses succeed internationally. Through tailored networking events, trade missions, and individualized connections, the TCS is well-positioned to link Indigenous businesses to potential clients and partners worldwide.
Moreover, the TCS also provides support in understanding foreign market regulations and customs procedures, which may be useful to the 45.2% of Indigenous exporters that identified that they would value information about which markets to pursue.
Various supports are also available for Indigenous firms when it comes to access to financing. For instance, Indigenous firms interested in exporting may benefit from the CanExport program, which provides Canadian SMEs with up to $50,000 to help cover travel, marketing, translation, consultancy services, certification, and more costs.
Export Development Canada offers diverse financial instruments tailored to support Indigenous firms, including direct lending loan guarantees, insurance, and other financial products. These solutions aim to address the nuanced financial barriers Indigenous businesses face and empower them to succeed in international trade.
Moreover, the Business Development Bank of Canada (BDC) offers an Indigenous entrepreneurship loan of up to $350,000 for Indigenous firms seeking to grow or scale their business. BDC also works alongside Indigenous organizations, like the National Aboriginal Capital Corporation Association (NACCA) and the CCIB to connect Indigenous firms to partners who can help them scale their business.
Ultimately, we hope these findings empower policymakers and program designers in both government and Indigenous communities to craft solutions that dismantle barriers and enable
Indigenous businesses to fully realize their aspirations in global trade. This, in turn, will contribute to building a more inclusive trade environment, one in which the benefits of trade can flow to Indigenous businesses and communities. Full participation and recognition of Indigenous entrepreneurial strength contribute to the Canadian economy as a whole.
Bibliography
Álvarez, R., & López, R. A. (2016). The Latin American and Caribbean Economic Association. Récupéré sur Access to Credit is Crucial for Exporting: http://vox.lacea.org/?q=review/credit_crucial_exporting
Auditor General of Canada. (2023). Connectivity in Rural and Remote Areas. Récupéré sur Office of the Auditor General of Canada: https://www.oag-bvg.gc.ca/internet/English/parl_oag_202303_02_e_44205.html
Bartik, A. W., Bertrand, M., Cullen, Z., Glaeser, E. L., Luca, M., & Stanton, C. (2020). The impact of COVID-19 on small business outcomes and expectations. New York: PNAS.
Bélanger, B. A. (2019). Indigenous-Owned Exporting Small and Medium Enterprises in Canada. Ottawa: Global Affairs Canada & Canadian Council for Indigenous Business. Récupéré sur Council for Aboriginal Business.
Bergeron, D., Iddon, G., & Broeckx, K. (2021, August 19). FUR TRADE ECONOMICS. Récupéré sur Bank of Canada Museum: https://www.bankofcanadamuseum.ca/2021/08/fur-trade-economics/
Berman, N., & Héricourt , J. (2010). Financial Factors and the Margins of Trade: Evidence from Cross-Country Firm-Level Data. Journal of Development Economics, 206-217.
Bernini, M., Du, J., & Love, J. H. (2016). Explaining intermittent exporting: Exit. London: National Institute of Economic and Social Research.
Bowles, P., Ajit, D., Dempset, K., & Shaw, T. (2011). Urban Aboriginal use of fringe financial institutions: Survey evidence from Prince George, British Columbia. Urban Aboriginal use of fringe financial institutions: Survey evidence from Prince George, British Columbia.
BTY Global. (2023, March 1). Infrastructure Gap in First Nations Communities Now Estimated at $349.2 Billion. Récupéré sur BTY: https://www.bty.com/infrastructure-gap-in-first-nations-communities/
Calof, J. L. (1994). The Relationship between Firm Size and Export Behavior Revisited. Journal of International Business Studies, 367-387.
Canadian Chamber of Commerce. (2024). Canadian Survey on Business Conditions Report. Récupéré sur https://bdl-lde.ca/wp-content/uploads/2024/03/2024_Q1_CSBC_Report.pdf
Canadian Council for Indigenous Business . (2022). Readiness and Resilience: Mapping the Contours of the Indigenous Skills and Employment Ecosystem in Canada. Toronto.
Canadian Council for Indigenous Business & Google Canada. (2022). Digital Directions: Discussion on the findings of Google Canada’s Indigenous-led Business Poll. Récupéré sur Canadian Council for Indigenous Business : https://www.ccab.com/wp-content/uploads/2023/01/digital_directions_english_v03-Final-Edit-1-2.pdf
Canadian Council for Indigenous Business. (2021). Understanding Intellectual Property Awareness & Use by Indigenous Businesses. Récupéré sur 2019 Intellectual Property Survey of Indigenous Businesses : https://www.ccab.com/wp-content/uploads/2021/07/CCAB__english_FINAL_DIGITAL-ERG.pdf
Canadian Council for Indigenous Business. (2022). COVID-19 Indigenous Business Survey:. Toronto: Canadian Council for Indigenous Business.
Canadian Council for Indigenous Business. (2023). Trading Nations: Supporting International Indigenous-to-Indigenous Trade Policy Development . Toronto.
Canadian Council for Indigenous Business and Global Affairs Canada. (2023). Adàwe: Export experiences of Indigenous entrepreneur. Toronto and Ottawa.
Canaj, K., Sood, S., & Johnston, C. (2023, June 22). Analysis on labour challenges in Canada, second quarter of 2023. Récupéré sur Statistics Canada: https://www150.statcan.gc.ca/n1/pub/11-621-m/11-621-m2023009-eng.htm
Chen, H., Engert, W., Huynh, K. P., & O'Habib, D. (2021). An Exploration of First Nations Reserves and Access to Cash. Ottawa: Bank of Canada.
Chernoff, A., & Cheung, C. (2023). An Overview of the Indigenous Economy in Canada. Ottawa: Bank of Canada.
Cheung, C., Fudurich, J., Shah, J., & Suvankulov, F. (2024). Survey of Indigenous Firms:. Ottawa: Bank of Canada.
Department of Justice Canada. (2023, July 20). Implementing the United Nations Declaration on the Rights of Indigenous Peoples Act. Récupéré sur Government of Canada: https://www.justice.gc.ca/eng/declaration/legislation.html
Employment and Social Development Canada . (2022). Canadian Occupational Projection System: Industrial Summaries (2022-2031) . Ottawa : Government of Canada.
Export Development Canada. (2023, July 31). Building trust with Indigenous businesses. Récupéré sur https://www.edc.ca/en/article/building-relationships-with-indigenous-businesses.html
Export Development Canada. (2023, May 26). Inclusive trade. Récupéré sur EDC: https://www.edc.ca/en/about-us/esg/social/inclusive-trade.html
Export Development Canada. (s.d.). 3 common risks to guard against when exporting. Récupéré sur Business Development Bank of Canada: https://www.bdc.ca/en/articles-tools/marketing-sales-export/export/common-risks-guard-against-when-exporting
FedEx. (2023, October 6). 2023 FedEx Rate Changes Overview. Récupéré sur Fedx: https://www.fedex.com/en-ca/rate-changes.html
First Nations Financial Management Board. (2022, November). The RoadMap Project. Récupéré sur Unlocking First Nations Economies: https://fnfmb.com/sites/default/files/2022-11/2022-11-09_roadmap_chapter_4_unlocking_first_nations_economies.pdf
First Nations of Quebec and Labrador Economic Development Commission . (2022, Febriary). Standing Committee on Indigenous and Northern Affairs. Récupéré sur Our Commons: https://www.ourcommons.ca/Content/Committee/441/INAN/Brief/BR11597740/br-external/FirstNationsOfQuebecAndLabradorEconomicDevelopmentCommission-10573918-e.pdf
Girma, S., Greenaway, A., & Kneller, R. (2004). Does Exporting Increase Productivity? A Microeconometric Analysis of Matched Firms. Review of International Economics, 855-866.
Global Affairs Canada. (2023, 12 28). Government Procurement. Récupéré sur Government of Canada: https://www.international.gc.ca/trade-agreements-accords-commerciaux/topics-domaines/gp-mp/index.aspx?lang=eng
Glover, F. (2020, January 15). Fur Trade in Canada. Récupéré sur The Canadian Encyclopedia : https://www.thecanadianencyclopedia.ca/en/article/fur-trade-in-canada-plain-language-summary
Government of Canada. (2020, November 17). International Trade Agreements and Indigenous Peoples: The Canadian Approach. Récupéré sur International trade agreements and Indigenous Peoples: The Canadian approach
Greenaway, D., Guariglia, A., & Kneller , R. (2007). Financial Factors and Exporting Decisions. Journal of International Economics, 377-395.
Hirch, M. (2003). Trading across time and space: Culture along the North American "Grease Trails" from a European perspective. Kamloops, BC: University College of the Caribou.
Huynh, K. P., Petrunia, R. J., Rodrigue, J., & Steingress, W. (2023, February 10). Exporting and Investment. Récupéré sur Bank of Canada: https://www.bankofcanada.ca/wp-content/uploads/2023/02/swp2023-10.pdf
Indigenous Corporate Training Inc. (2012, September 24). Why it makes good business sense to hire aboriginal workers. Récupéré sur https://www.ictinc.ca/blog/why-it-makes-good-business-sense-to-hire-aboriginal-workers
Industry and Inclusion: An Analysis of Indigenous Potential in Federal Supply Chains. (2019). Canadian Council for Indigenous Business. Toronto: Canadian Coun.
Lavesson, N. (2018). How does distance to urban centres influence necessity and opportunity-based firm start-ups? Papers in Regional Science, 1279-1303.
Liu, H. (2021). Economic performance associated with digitalization in Canada over the past two decades. Ottawa: Statistics Canada. Récupéré sur https://epe.lac-bac.gc.ca/100/201/301/weekly_acquisitions_list-ef/2021/21-09/publications.gc.ca/collections/collection_2021/statcan/36-28-0001/CS36-28-0001-2021-2-1-eng.pdf
Mashford-Pringle, A., Skura, C., Yohathasan, T., & Stutz, S. (2021, February). What we heard: Indigenous Peoples and COVID-19: Public Health Agency of Canada’s companion report. Récupéré sur Public Health Agency of Canada: https://www.canada.ca/en/public-health/corporate/publications/chief-public-health-officer-reports-state-public-health-canada/from-risk-resilience-equity-approach-covid-19/indigenous-peoples-covid-19-report.html
Melvin, A. (2023, October 27). Postsecondary educational attainment and labour market outcomes among Indigenous peoples in Canada, findings from the 2021 Census. Récupéré sur Statistics Canada: https://www150.statcan.gc.ca/n1/pub/75-006-x/2023001/article/00012-eng.htm
Metis Nation of Canada. (s.d.). Are you Metis? Récupéré sur MNOC Citizenship criteria:: https://mnoc.ca/english/registry/citizenship/
Mundie, J. (2022, December 30). Inaccessible, unreliable, unaffordable: The struggle to get internet in rural Canada. Récupéré sur National Post : https://nationalpost.com/feature/left-behind-internet-access-rural-canada
National Aboriginal Capital Corporations Association. (2024). About us. Récupéré sur NACCA: https://nacca.ca/about/
Nguyen, N. H., Subhan, F. B., Williams, K., & Chan, C. B. (2020). Barriers and Mitigating Strategies to Healthcare Access in Indigenous Communities of Canada: A Narrative Review. Healthcare.
Office of the Chief Economist, Global Affairs Canada. (2020). Canada's State of Trade - 2020. Récupéré sur https://www.international.gc.ca/gac-amc/publications/economist-economiste/state-of-trade-commerce-international-2020.aspx?lang=eng#30: https://www.international.gc.ca/gac-amc/publications/economist-economiste/state-of-trade-commerce-international-2020.aspx?lang=eng
Office of the Chief Economist, Global Affairs Canada. (2023). Canada's State of Trade: Inclusive Trade . Ottawa: Government of Canada.
Organisation for Economic Cooperation and Development . (2020, January 21). Linking Indigenous Communities with Regional Development in Canada. Récupéré sur OECD Rural Policy Reviews: https://www.oecd-ilibrary.org/urban-rural-and-regional-development/linking-indigenous-communities-with-regional-development-in-canada_fa0f60c6-en
Organisation for Economic Cooperation and Development (OECD) . (2021). OECD SME and Entrepreneurship Outlook 2021. Paris.
Public Services and Procurement Canada. (2019, November 5). Improving Respondent Cooperation for Telephone Surveys. Récupéré sur Government of Canada: https://www.tpsgc-pwgsc.gc.ca/rop-por/rapports-reports/telephone/introduction-eng.html
Remillard, R., & Scholz, M. (2020). Access to capital for Canadian growth-oriented, medium-sized firms. Récupéré sur Government of Canada: https://ised-isde.canada.ca/site/sme-research-statistics/sites/default/files/attachments/2022/2020_AccesstocapitalforCanadiangrowth.pdf
Ryzhkov, A. (2023, September 26). Valuing Indigenous Art Market Businesses . Récupéré sur Fin Models Lab : https://finmodelslab.com/blogs/valuation/indigenous-art-market-valuation
S&P Global. (2022, April 4). Container shipping: Supply chains will remain disrupted well into 2022. Récupéré sur S&P Global Market Intelligence : https://www.spglobal.com/marketintelligence/en/news-insights/research/container-shipping-supply-chains-will-remain-disrupted-well-into-2022
Statistics Canada. (2021). Approved funding or credit due to the COVID-19 pandemic, by business characteristics, first quarter of 2021 (Table: 33-10-0320-01). Récupéré sur https://www150.statcan.gc.ca/t1/tbl1/en/cv.action?pid=3310032001
The Canadian Council for Public-Private Partnerships. (2016). P3's: Bridging the First Nations Infrastructure Gap. Récupéré sur http://www.pppcouncil.ca/web/pdf/first_nations_p3_report.pdf
Tran, T. (2023, February 13). 2020 Canadian export trends by size. Récupéré sur Government of Canada: https://www.international.gc.ca/trade-commerce/economist-economiste/analysis-analyse/trade-exporter-tendances-exportations.aspx?lang=eng
Trovato, F., Pedersen, A.-M., Lang, C., & Price, J. A. (2011, October 31). Economic Conditions of Indigenous Peoples in Canada. Récupéré sur The Canadian Encyclopedia: https://www.thecanadianencyclopedia.ca/en/article/aboriginal-people-economic-conditions
U.S. Department of the Interior. (s.d.). The Indian Arts and Crafts Act of 1990. Récupéré sur https://www.doi.gov/iacb/act
United Nations. (2007). United Nations Declaration on the Rights of Indigenous Peoples . Récupéré sur United Nations For Indigenous Peoples: https://www.un.org/development/desa/indigenouspeoples/wp-content/uploads/sites/19/2018/11/UNDRIP_E_web.pdf
United Nations Conference on Trade and Development . (2020, April 14). Coronavirus deals severe blow to services sectors. Récupéré sur UNCTAD Prosperity for all: https://unctad.org/news/coronavirus-deals-severe-blow-services-sectors
Wagner, J. (2007, January 19). Exports and productivity: a survey of the evidence. Récupéré sur Wiley Online Library : https://onlinelibrary.wiley.com/doi/abs/10.1111/j.1467-9701.2007.00872.x
World Intellectual Property Organization. (2022). Intellectual Property and Traditional Knowledge . Geneva.
World Intellectual Property Organization. (2024, May 24). WIPO Member States Adopt Historic New Treaty on Intellectual Property, Genetic Resources and Associated Traditional Knowledge. Récupéré sur https://www.wipo.int/pressroom/en/articles/2024/article_0007.html
Yesno, R. (2022, October 5). Fake Indigenous art is the tip of the iceberg of cultural appropriation. Récupéré sur CBC: ndigenous communities [are] associated with 1.9 times higher odds of reporting difficulty with accessing financing.
Zoledziowski, A. (2021, July 9). Cost of Getting Food to Remote Indigenous Communities Rose 400% During COVID. Récupéré sur Vice News: https://www.vice.com/en/article/k78nvy/cost-of-getting-food-to-remote-indigenous-communities-rose-400-during-covid Anya Zoledziowski
Appendix: Econometric analysis
Section 1A: Description of econometric model
This section explores the firm characteristics that are associated with barriers to growth and obstacles to exporting. By identifying factors of statistical significance, we discern the relationship between firm characteristics and specific growth and export barriers.
First, we investigate the odds of reporting obstacles to business growth using multiple independent logistic regressions. The model takes the following form:

Text version - Equation 1
Log of the probability that a given growth obstacle (growthobsn) is reported (=1) divided by the probability that it is not reported (1-pr(growthobsn=1) is equal to a constant (beta 0) plus the industry ( beta i Industry) plus SME size (beta j SMEsize) plus location within Indigenous community (beta k Community) plus use of online sales (beta l VirtualSales) plus remoteness (beta m Remoteness) plus if the firm exports (beta o Exporter) plus an error term.
In this model, the dependent variable, growthobsn, is a binary variable that indicates whether a firm reported a specific obstacle to business growth (1) or not (0). We repeat this model for all eleven obstacles to business growth identified in the survey:
- Infrastructure such as electricity, water, and roads
- Reliable internet access, telephone, and other IT technologies
- Labour obstacles, such as attracting employees with the right skills or qualifications
- Access to equity or capital
- Access to financing
- Cost of doing business, such as input costs
- Fluctuations in customer or client demand
- Competition
- Overall economic conditions
- Government policy, rules, and regulations, including tax law
- Access to business advisory support
In a second model, we investigate the odds of reporting export obstacles using multiple independent logistic regressions. The model takes the following form:
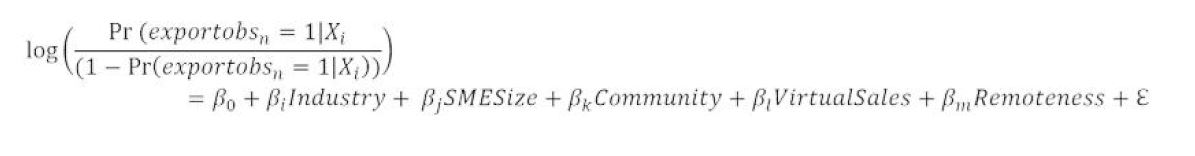
Text version - Equation 2
Log of the probability that a given obstacle to export (exportobsn) is reported (=1) divided by the probability that it is not reported (1-pr(exportobsn=1) is equal to a constant (beta 0) plus the industry (beta i Industry) plus SME size (beta j SMEsize) plus location within Indigenous community (beta k Community) plus use of online sales (beta l VirtualSales) plus remoteness (beta m Remoteness) plus an error term.
In this model, the dependent variable, exportobsn, is a binary variable that indicates whether an exporting firm reports experiencing a moderate or major obstacle to exporting (1) or does not (0). We repeat this model for the following 7 export obstaclesFootnote 84:
- Administrative obstacles in Canada, such as rules, regulations, and legal requirements
- Logistical obstacles such as distance to customers, transportation costs, or brokerage fees
- Lack of financing or inadequate cash flow
- Impacts of the COVID-19 pandemic
- Financial risk such as longer payment terms or risk of non-payment from customers
- Discrimination against Indigenous businesses
- The location or remoteness of the business
Across all models, we include several controls. We control for Industry, which represents a categorical variable for the industry in which the firm operates; SMESize, which represents a categorical variable for the range of employees; Community, which is a binary variable indicating whether the firm is located within an Indigenous community; VirtualSales, which is a binary variable indicating if the firm offers online sales; and Remoteness, which is a categorical variable for the level of remoteness.Footnote 85Footnote 86 In the models on obstacles to business growth, we include an additional variable, Exporter, to capture whether the firm exported in 2020.
Note that the Exporter variable is excluded from the econometric work on obstacles to exporting. We exclude this variable as all the firms that reported export obstacles have exported.
Another notable distinction between the model on obstacles to business growth and the model on obstacles to exporting is the sample size. The first set of regressions on obstacles to business growth includes the entire sample of Indigenous SMEs (both exporters and non-exporters). However, as the second model focuses on obstacles to exporting, the sample size is limited to experienced exporters. To retain a larger sample size, we include SMEs with any exporting experience rather than focusing on current exporters alone.
Tables 1.1A and 1.2A report the results of the statistical analysis for obstacles to growth and exporting, respectively. The results are reported as odds ratios, and standard errors are provided in the parenthesis.
An odds ratio equal to 1 indicates that the characteristic or factor does not change the likelihood of reporting an obstacle, while an odds ratio of less than 1 means that the factor is associated with a lower likelihood of reporting an obstacle, and an odds ratio of more than 1 is associated with a higher likelihood of reporting an obstacle.
In Table 1.1A, column 1 represents the results for the odds that a firm reports infrastructure as a barrier to business growth. Each subsequent column represents the odds of an Indigenous SME experiencing a different barrier to business growth. Alternatively, each row provides insight into the relationship between firm characteristics and a specific barrier to growth.
This format is repeated in Table 1.2A. Namely, column 1 represents the odds that an Indigenous SME reports administrative barriers in Canada as a moderate or major export obstacle. Each subsequent column represents the model for a different barrier to exporting.
For summary statistics on the number of observations by obstacle and firm characteristics, please see Tables 2.1A to 2.3A in the appendix.
Table 1.1A: Results of logistic model on likelihood of reporting obstacles to growth for Indigenous SMEs, reported in odds ratios (where the dependent variable is whether the firm reported a significant obstacle to business growth)
| Obstacle type | Infrastructure | I.T. | Labour | Equity/capital | Finance | Input costs | Demand fluctuations | Competition | Economic conditions | Government regulation | Business support |
|---|---|---|---|---|---|---|---|---|---|---|---|
| (Intercept) | 0.28*** | 0.33*** | 1.36 | 0.74 | 0.63* | 1.27 | 1.29 | 0.48** | 3.14*** | 0.7 | 0.09*** |
| (0.25) | (0.23) | (0.23) | (0.23) | (0.23) | (0.23) | (0.22) | (0.24) | (0.24) | (0.22) | (0.31) | |
| Industry (base: accommodation and food services) | |||||||||||
| Retail trade | 0.51** | 0.66 | 0.56* | 0.54** | 0.58* | 1.01 | 0.71 | 1.87** | 0.91 | 1.12 | 1.42 |
| (0.24) | (0.22) | (0.23) | (0.22) | (0.23) | (0.22) | (0.21) | (0.23) | (0.23) | (0.22) | (0.28) | |
| Administration and provision of goods | 0.65 | 1.29 | 0.6 | 0.97 | 1.16 | 0.9 | 0.6* | 1.02 | 0.68 | 1.35 | 1.48 |
| (0.28) | (0.26) | (0.26) | (0.26) | (0.25) | (0.26) | (0.26) | (0.27) | (0.27) | (0.26) | (0.33) | |
| Resource-based industries | 0.63 | 0.89 | 0.92 | 1.13 | 1.34 | 1.22 | 1.41 | 2.24** | 0.83 | 2.04** | 1.3 |
| (0.26) | (0.25) | (0.26) | (0.24) | (0.24) | (0.24) | (0.24) | (0.25) | (0.25) | (0.24) | (0.32) | |
| Arts, entertainment, and recreation | 0.43* | 0.76 | 0.92 | 0.73 | 0.93 | 1.22 | 0.77 | 0.9 | 1.43 | 0.85 | 1.15 |
| (0.34) | (0.3) | (0.3) | (0.29) | (0.29) | (0.29) | (0.29) | (0.31) | (0.32) | (0.29) | (0.38) | |
| Health care and social assistance | 0.96 | 1.31 | 0.95 | 1.04 | 1.5 | 0.65 | 0.71 | 0.68 | 0.64 | 0.86 | 2.01* |
| (0.29) | (0.28) | (0.3) | (0.28) | (0.28) | (0.28) | (0.28) | (0.32) | (0.29) | (0.28) | (0.34) | |
| Infrastructure and logistics heavy industries | 0.51** | 0.77 | 0.9 | 0.98 | 1 | 1.41 | 0.95 | 2.46*** | 0.9 | 1.55* | 1.37 |
| (0.23) | (0.22) | (0.22) | (0.21) | (0.21) | (0.21) | (0.21) | (0.22) | (0.22) | (0.21) | (0.28) | |
| Management and knowledge-based industries | 0.93 | 1.31 | 0.77 | 1.05 | 1.3 | 0.79 | 0.68 | 1.49 | 0.77 | 1.58* | 1.74 |
| (0.24) | (0.23) | (0.24) | (0.23) | (0.23) | (0.23) | (0.22) | (0.24) | (0.24) | (0.23) | (0.29) | |
| Manufacturing | 0.94 | 0.89 | 0.83 | 0.42* | 0.86 | 0.77 | 1.44 | 1.07 | 1.32 | 1.46 | 1.45 |
| (0.35) | (0.34) | (0.34) | (0.35) | (0.33) | (0.33) | (0.33) | (0.34) | (0.37) | (0.32) | (0.42) | |
| Professional, scientific and technical services | 0.55 | 1.05 | 0.81 | 0.89 | 0.85 | 0.45** | 0.94 | 1.86* | 0.57* | 1.04 | 1.51 |
| (0.31) | (0.27) | (0.28) | (0.27) | (0.27) | (0.27) | (0.26) | (0.27) | (0.28) | (0.26) | (0.34) | |
| Firm size (base: 1-4 employees) | |||||||||||
| 5-19 employees | 1.15 | 0.87 | 1.87*** | 0.95 | 1.03 | 1.27 | 1.12 | 1.13 | 1.02 | 1.21 | 1.27 |
| (0.15) | (0.14) | (0.13) | (0.13) | (0.13) | (0.13) | (0.13) | (0.13) | (0.13) | (0.13) | (0.16) | |
| 20-99 employees | 1.3 | 0.99 | 2.29*** | 0.82 | 0.76 | 1.38* | 1.11 | 1.03 | 1.27 | 1.3 | 0.67 |
| (0.18) | (0.16) | (0.16) | (0.16) | (0.16) | (0.16) | (0.16) | (0.16) | (0.16) | (0.16) | (0.21) | |
| 100-499 employees | 1.33 | 0.68 | 1.86 | 0.67 | 0.61 | 2.18* | 0.76 | 1.44 | 1.27 | 0.96 | 0.67 |
| (0.33) | (0.32) | (0.32) | (0.32) | (0.31) | (0.33) | (0.3) | (0.3) | (0.31) | (0.3) | (0.41) | |
| Other firm characteristics | |||||||||||
| Within Indigenous community | 1.64*** | 1.76*** | 1.11 | 1.18 | 1.28* | 0.71** | 0.8 | 0.86 | 0.63*** | 0.69** | 1.52** |
| (0.13) | (0.12) | (0.12) | (0.12) | (0.12) | (0.12) | (0.11) | (0.12) | (0.12) | (0.12) | (0.15) | |
| Remoteness (base: urban) | |||||||||||
| Semi-connected | 1.03 | 1.08 | 1.15 | 1.03 | 1.01 | 1.2 | 1.08 | 1.01 | 0.81 | 1.1 | 1.26 |
| (0.17) | (0.15) | (0.15) | (0.15) | (0.14) | (0.15) | (0.14) | (0.15) | (0.15) | (0.14) | (0.19) | |
| Remote | 1.44* | 1.68** | 1.12 | 0.89 | 0.95 | 1.05 | 0.92 | 0.68* | 0.67* | 1.14 | 1.48* |
| (0.17) | (0.16) | (0.16) | (0.15) | (0.15) | (0.15) | (0.15) | (0.16) | (0.16) | (0.15) | (0.2) | |
| Virtual sales | 1.14 | 1.2 | 0.74* | 1.17 | 1.1 | 1.06 | 1.32* | 1.11 | 1.14 | 1.23 | 1.65*** |
| (0.14) | (0.13) | (0.13) | (0.13) | (0.13) | (0.13) | (0.13) | (0.13) | (0.13) | (0.13) | (0.15) | |
| Exporter | 0.85 | 1.38 | 1.04 | 1.76* | 1.18 | 1.67* | 0.75 | 0.76 | 0.78 | 1.18 | 1.01 |
| (0.29) | (0.25) | (0.24) | (0.24) | (0.24) | (0.26) | (0.24) | (0.25) | (0.25) | (0.24) | (0.29) | |
| Observations | 1453 | 1453 | 1437 | 1407 | 1417 | 1407 | 1427 | 1434 | 1408 | 1398 | 1411 |
| Significance levels in percentages 0.1% ‘***’ 1% ‘**’ 5% ‘*’ 10% ‘ | |||||||||||
Note: Standards errors are provided in the parentheses
Table 1.2A: Results of logistic model on likelihood of reporting obstacles to exporting for Indigenous SMEs, reported in odds ratios (where the dependent variable is whether the firm reported a moderate or major obstacle to exporting)
| Obstacle type | Administrative (domestic) | Logistical | Lack of financing/cash-flow | Impact of COVID-19 | Financial risk | Discrimination | Location |
|---|---|---|---|---|---|---|---|
| (Intercept) | 0.48 | 0.38 | 0.7 | 3.33 | 0.21* | 0.2* | 0.08** |
| (0.7) | (0.69) | (0.68) | (0.8) | (0.76) | (0.79) | (0.87) | |
| Industry (base: accommodation and food services) | |||||||
| Retail trade | 0.43 | 0.9 | 0.89 | 0.49 | 2.27 | 1.17 | 0.85 |
| (0.75) | (0.74) | (0.74) | (0.84) | (0.81) | (0.85) | (0.93) | |
| Administration and provision of goods | 0.48 | 3.11 | 0.51 | 0.63 | 2.06 | 0.93 | 4.53 |
| (1.08) | (1.06) | (1.09) | (1.14) | (1.11) | (1.31) | (1.12) | |
| Resource-based industries | 0.52 | 1.63 | 0.54 | 0.39 | 1.71 | 0.57 | 1.55 |
| (0.74) | (0.72) | (0.74) | (0.83) | (0.77) | (0.9) | (0.83) | |
| Arts, entertainment, and recreation | 0.29 | 0.78 | 0.81 | 0.73 | 0.67 | 0.42 | 0.99 |
| (0.72) | (0.69) | (0.69) | (0.83) | (0.8) | (0.84) | (0.84) | |
| Health care and social assistance | 0.24 | 0.37 | 0.68 | 0.18 | 0.46 | 0.99 | 0.76 |
| (1.05) | (1.04) | (0.96) | (1.05) | (1.27) | (1.08) | (1.35) | |
| Infrastructure and logistics heavy industries | 0.74 | 0.99 | 1.33 | 1.27 | 3.47 | 0.75 | 0.42 |
| (0.86) | (0.85) | (0.84) | (1.05) | (0.88) | (1.03) | (1.1) | |
| Management and knowledge-based industries | 0.57 | 0.52 | 0.55 | 0.43 | 0.84 | 1.6 | 0.76 |
| (0.84) | (0.85) | (0.83) | (0.95) | (0.93) | (0.9) | (1.03) | |
| Manufacturing | 0.24* | 1.93 | 0.36 | 0.45 | 2.17 | 1.52 | 0.96 |
| (0.7) | (0.67) | (0.68) | (0.77) | (0.73) | (0.75) | (0.81) | |
| Professional, scientific, and technical services | 0.71 | 0.61 | 0.34 | 0.42 | 0.82 | 0.73 | 1.11 |
| (0.77) | (0.79) | (0.82) | (0.85) | (0.91) | (0.93) | (0.96) | |
| Firm size (base: 1-4 employees) | |||||||
| 5-19 employees | 0.86 | 1.01 | 1 | 1.26 | 1.17 | 1.34 | 1.68 |
| (0.38) | (0.37) | (0.37) | (0.38) | (0.4) | (0.42) | (0.48) | |
| 20-99 employees | 1.45 | 1.53 | 0.73 | 1.46 | 1.98 | 0.53 | 4.32** |
| (0.52) | (0.51) | (0.53) | (0.54) | (0.52) | (0.66) | (0.57) | |
| 100-499 employees | 2.13 | 1.23 | 2.77 | 1.69 | 0.81 | 0.4 | 5.72* |
| (0.78) | (0.75) | (0.78) | (0.81) | (0.81) | (1.14) | (0.83) | |
| Other firm characteristics | |||||||
| Within Indigenous community | 1.77 | 2 | 1.89 | 2.77** | 2.31* | 3.22** | 1.51 |
| (0.37) | (0.36) | (0.36) | (0.39) | (0.39) | (0.43) | (0.43) | |
| Remoteness (base: urban) | |||||||
| Semi-connected | 1.12 | 1.05 | 0.85 | 0.58 | 0.83 | 0.82 | 1.17 |
| (0.42) | (0.39) | (0.4) | (0.41) | (0.42) | (0.47) | (0.52) | |
| Remote | 1.59 | 1.54 | 0.86 | 0.45 | 1.02 | 0.82 | 3.96* |
| (0.47) | (0.46) | (0.47) | (0.5) | (0.49) | (0.54) | (0.54) | |
| Virtual sales | 2.51* | 1.72 | 1.4 | 0.89 | 0.91 | 1.21 | 1.25 |
| (0.41) | (0.38) | (0.39) | (0.4) | (0.41) | (0.45) | (0.46) | |
| Observations | 173 | 173 | 173 | 170 | 173 | 170 | 172 |
| Significance levels in percentages 0.1% ‘***’ 1% ‘**’ 5% ‘*’ 10% ‘ | |||||||
Note: Standards errors are provided in the parentheses
Section 2A: Descriptive statistics
Table 2.1A: Indigenous SMEs by obstacles (number of observations and percent)Footnote 87
| Obstacle Type | All | Not an obstacle | Obstacle | ||
|---|---|---|---|---|---|
| Count | Count | % of respondents | Count | % of respondents | |
| Obstacle to business growth | |||||
| Infrastructure | 1533 | 1131 | 73.8 | 402 | 26.2 |
| Reliable IT | 1532 | 982 | 64.1 | 550 | 35.9 |
| Labour | 1515 | 527 | 34.8 | 988 | 65.2 |
| Access to equity/capital | 1479 | 865 | 58.5 | 614 | 41.5 |
| Financing | 1493 | 874 | 58.5 | 619 | 41.5 |
| Costs | 1483 | 615 | 41.5 | 868 | 58.5 |
| Demand fluctuations | 1505 | 711 | 47.2 | 794 | 52.8 |
| Competition | 1511 | 916 | 60.6 | 595 | 39.4 |
| Economic conditions | 1482 | 536 | 36.2 | 946 | 63.8 |
| Government regulations | 1473 | 742 | 50.4 | 731 | 49.6 |
| Business support | 1485 | 1188 | 80.0 | 297 | 20.0 |
| Obstacle to exporting | |||||
| Administrative (domestic) | 183 | 117 | 63.9 | 66 | 36.1 |
| Logistical | 183 | 96 | 52.5 | 87 | 47.5 |
| Financing | 182 | 110 | 60.4 | 72 | 39.6 |
| COVID-19 | 180 | 63 | 35.0 | 117 | 65.0 |
| Financial risk | 182 | 123 | 67.6 | 59 | 32.4 |
| Discrimination | 180 | 139 | 77.2 | 41 | 22.8 |
| Location | 182 | 133 | 73.1 | 49 | 26.9 |
Table 2.2A: Indigenous SMEs by obstacles to growth and firm characteristics (number of observations and percent)Footnote 88
| Firm characteristic | Total | Infrastructure | Reliable I.T. | Labour | ||||||||||
|---|---|---|---|---|---|---|---|---|---|---|---|---|---|---|
| Count | % of total | Not an obstacle | Obstacle | Not an obstacle | Obstacle | Not an obstacle | Obstacle | |||||||
| Count | % of respondents | Count | % of respondents | Count | % of respondents | Count | % of respondents | Count | % of respondents | Count | % of respondents | Count | % of respondents | |
| Industry | 1527 | 1125 | 398 | 977 | 545 | 525 | 980 | |||||||
| Accommodation and food services | 163 | 10.7 | 107 | 65.6 | 56 | 34.4 | 100 | 61.3 | 63 | 38.7 | 51 | 31.7 | 110 | 68.3 |
| Retail trade | 235 | 15.4 | 181 | 77.4 | 53 | 22.6 | 162 | 69.2 | 72 | 30.8 | 96 | 41.9 | 133 | 58.1 |
| Administration and provision of goods | 120 | 7.9 | 88 | 73.9 | 31 | 26.1 | 67 | 56.3 | 52 | 43.7 | 47 | 39.5 | 72 | 60.5 |
| Resource-based industries | 160 | 10.5 | 121 | 75.6 | 39 | 24.4 | 106 | 66.7 | 53 | 33.3 | 46 | 29.1 | 112 | 70.9 |
| Arts, entertainment, and recreation | 86 | 5.6 | 68 | 79.1 | 18 | 20.9 | 57 | 66.3 | 29 | 33.7 | 29 | 34.5 | 55 | 65.5 |
| Health care and social assistance | 99 | 6.5 | 61 | 62.2 | 37 | 37.8 | 52 | 53.1 | 46 | 46.9 | 27 | 27.6 | 71 | 72.4 |
| Infrastructure and logistics heavy industries | 300 | 19.6 | 236 | 78.9 | 63 | 21.1 | 211 | 70.3 | 89 | 29.7 | 95 | 32.1 | 201 | 67.9 |
| Management and knowledge-based industries | 197 | 12.9 | 135 | 68.5 | 62 | 31.5 | 113 | 57.7 | 83 | 42.3 | 71 | 36.4 | 124 | 63.6 |
| Manufacturing | 61 | 4.0 | 44 | 72.1 | 17 | 27.9 | 41 | 67.2 | 20 | 32.8 | 23 | 37.7 | 38 | 62.3 |
| Professional, scientific and technical services | 106 | 6.9 | 84 | 79.2 | 22 | 20.8 | 68 | 64.2 | 38 | 35.8 | 40 | 38.5 | 64 | 61.5 |
| Firm size | 1537 | 1131 | 402 | 982 | 550 | 527 | 988 | |||||||
| 1-4 employees | 467 | 30.4 | 362 | 77.7 | 104 | 22.3 | 296 | 63.7 | 169 | 36.3 | 211 | 46.4 | 244 | 53.6 |
| 5-19 employees | 681 | 44.3 | 499 | 73.5 | 180 | 26.5 | 446 | 65.6 | 234 | 34.4 | 212 | 31.5 | 460 | 68.5 |
| 20-99 employees | 332 | 21.6 | 231 | 69.8 | 100 | 30.2 | 202 | 61.2 | 128 | 38.8 | 87 | 26.2 | 245 | 73.8 |
| 100-499 employees | 57 | 3.7 | 39 | 68.4 | 18 | 31.6 | 38 | 66.7 | 19 | 33.3 | 17 | 30.4 | 39 | 69.6 |
| Location within Indigenous community | 1527 | 1124 | 399 | 977 | 545 | 525 | 980 | |||||||
| Within Indigenous community | 662 | 43.4 | 526 | 79.5 | 136 | 20.5 | 473 | 71.8 | 186 | 28.2 | 240 | 37.0 | 409 | 63.0 |
| Outside Indigenous community | 865 | 56.6 | 598 | 69.5 | 263 | 30.5 | 504 | 58.4 | 359 | 41.6 | 285 | 33.3 | 571 | 66.7 |
| Remoteness | 1526 | 1124 | 398 | 979 | 542 | 523 | 981 | |||||||
| Urban | 345 | 22.6 | 268 | 77.7 | 77 | 22.3 | 239 | 69.5 | 105 | 30.5 | 126 | 37.1 | 214 | 62.9 |
| Semi-connected | 619 | 40.6 | 474 | 76.9 | 142 | 23.1 | 423 | 68.6 | 194 | 31.4 | 210 | 34.5 | 398 | 65.5 |
| Remote | 562 | 36.8 | 382 | 68.1 | 179 | 31.9 | 317 | 56.6 | 243 | 43.4 | 187 | 33.6 | 369 | 66.4 |
| Virtual sales | 1486 | 1101 | 381 | 960 | 522 | 510 | 956 | |||||||
| Offers virtual sales | 1058 | 71.2 | 788 | 74.6 | 269 | 25.4 | 696 | 66.0 | 359 | 34.0 | 335 | 32.1 | 710 | 67.9 |
| No virtual sales | 428 | 28.8 | 313 | 73.6 | 112 | 26.4 | 264 | 61.8 | 163 | 38.2 | 175 | 41.6 | 246 | 58.4 |
| Exporter | 1537 | 1131 | 402 | 982 | 550 | 527 | 988 | |||||||
| Not exporter | 1436 | 93.4 | 1052 | 73.5 | 380 | 26.5 | 918 | 64.2 | 513 | 35.8 | 485 | 34.3 | 930 | 65.7 |
| Yes exporter | 101 | 6.6 | 79 | 78.2 | 22 | 21.8 | 64 | 63.4 | 37 | 36.6 | 42 | 42.0 | 58 | 58.0 |
Table 2.2A (continued): Indigenous SMEs by obstacles to growth and firm characteristics (number of observations and percentFootnote 89)
| Firm characteristic | Access to equity/capital | Financing | Costs | Demand fluctuations | ||||||||||||
|---|---|---|---|---|---|---|---|---|---|---|---|---|---|---|---|---|
| Not an obstacle | Obstacle | Not an obstacle | Obstacle | Not an obstacle | Obstacle | Not an obstacle | Obstacle | |||||||||
| Count | % of respondents | Count | % of respondents | Count | % of respondents | Count | % of respondents | Count | % of respondents | Count | % of respondents | Count | % of respondents | Count | % of respondents | |
| Industry | 859 | 611 | 870 | 614 | 610 | 864 | 706 | 789 | ||||||||
| Accommodation and food services | 86 | 56.2 | 67 | 43.8 | 92 | 59.0 | 64 | 41.0 | 66 | 42.3 | 90 | 57.7 | 68 | 43.0 | 90 | 57.0 |
| Retail trade | 154 | 68.4 | 71 | 31.6 | 156 | 70.0 | 67 | 30.0 | 93 | 41.2 | 133 | 58.8 | 122 | 52.8 | 109 | 47.2 |
| Administration and provision of goods | 66 | 56.9 | 50 | 43.1 | 67 | 56.3 | 52 | 43.7 | 51 | 44.0 | 65 | 56.0 | 66 | 56.4 | 51 | 43.6 |
| Resource-based industries | 85 | 54.1 | 72 | 45.9 | 85 | 54.1 | 72 | 45.9 | 53 | 33.8 | 104 | 66.2 | 59 | 37.1 | 100 | 62.9 |
| Arts, entertainment, and recreation | 50 | 60.2 | 33 | 39.8 | 51 | 60.0 | 34 | 40.0 | 32 | 38.1 | 52 | 61.9 | 40 | 48.8 | 42 | 51.2 |
| Health care and social assistance | 51 | 54.8 | 42 | 45.2 | 47 | 49.0 | 49 | 51.0 | 47 | 51.6 | 44 | 48.4 | 50 | 53.2 | 44 | 46.8 |
| Infrastructure and logistics heavy industries | 164 | 56.7 | 125 | 43.3 | 171 | 58.6 | 121 | 41.4 | 97 | 32.8 | 199 | 67.2 | 132 | 44.7 | 163 | 55.3 |
| Management and knowledge-based industries | 103 | 54.2 | 87 | 45.8 | 101 | 52.6 | 91 | 47.4 | 85 | 45.9 | 100 | 54.1 | 100 | 52.1 | 92 | 47.9 |
| Manufacturing | 41 | 68.3 | 19 | 31.7 | 36 | 60.0 | 24 | 40.0 | 24 | 40.7 | 35 | 59.3 | 21 | 34.4 | 40 | 65.6 |
| Professional, scientific, and technical services | 59 | 56.7 | 45 | 43.3 | 64 | 61.5 | 40 | 38.5 | 62 | 59.6 | 42 | 40.4 | 48 | 45.3 | 58 | 54.7 |
| Firm size | 865 | 614 | 874 | 614 | 615 | 868 | 711 | 794 | ||||||||
| 1-4 employees | 253 | 56.1 | 198 | 43.9 | 264 | 57.1 | 198 | 42.9 | 207 | 45.9 | 244 | 54.1 | 216 | 47.5 | 239 | 52.5 |
| 5-19 employees | 383 | 58.1 | 276 | 41.9 | 372 | 57.4 | 276 | 42.6 | 266 | 40.4 | 393 | 59.6 | 310 | 46.3 | 360 | 53.7 |
| 20-99 employees | 194 | 61.4 | 122 | 38.6 | 201 | 62.2 | 122 | 37.8 | 125 | 39.3 | 193 | 60.7 | 153 | 47.4 | 170 | 52.6 |
| 100-499 employees | 35 | 66.0 | 18 | 34.0 | 37 | 67.3 | 18 | 32.7 | 17 | 30.9 | 38 | 69.1 | 32 | 56.1 | 25 | 43.9 |
| Location within Indigenous community | 857 | 612 | 868 | 615 | 609 | 864 | 707 | 788 | ||||||||
| Within Indigenous community | 371 | 58.3 | 265 | 41.7 | 389 | 60.2 | 257 | 39.8 | 236 | 36.6 | 408 | 63.4 | 281 | 43.0 | 373 | 57.0 |
| Outside Indigenous community | 486 | 58.3 | 347 | 41.7 | 479 | 57.2 | 358 | 42.8 | 373 | 45.0 | 456 | 55.0 | 426 | 50.7 | 415 | 49.3 |
| Remoteness | 858 | 611 | 866 | 616 | 609 | 864 | 704 | 790 | ||||||||
| Urban | 192 | 57.8 | 140 | 42.2 | 196 | 58.3 | 140 | 41.7 | 144 | 43.6 | 186 | 56.4 | 158 | 46.5 | 182 | 53.5 |
| Semi-connected | 339 | 56.8 | 258 | 43.2 | 346 | 57.9 | 252 | 42.1 | 230 | 38.5 | 368 | 61.5 | 272 | 44.8 | 335 | 55.2 |
| Remote | 327 | 60.6 | 213 | 39.4 | 324 | 59.1 | 224 | 40.9 | 235 | 43.1 | 310 | 56.9 | 274 | 50.1 | 273 | 49.9 |
| Virtual sales | 850 | 585 | 852 | 594 | 596 | 838 | 690 | 766 | ||||||||
| Offers virtual sales | 616 | 60.2 | 407 | 39.8 | 607 | 59.1 | 420 | 40.9 | 427 | 41.9 | 591 | 58.1 | 505 | 48.8 | 530 | 51.2 |
| No virtual sales | 234 | 56.8 | 178 | 43.2 | 245 | 58.5 | 174 | 41.5 | 169 | 40.6 | 247 | 59.4 | 185 | 43.9 | 236 | 56.1 |
| Exporter | 865 | 614 | 874 | 619 | 615 | 868 | 711 | 794 | ||||||||
| Not exporter | 816 | 59.1 | 565 | 40.9 | 817 | 58.6 | 577 | 41.4 | 583 | 42.0 | 804 | 58.0 | 665 | 47.3 | 740 | 52.7 |
| Yes exporter | 49 | 50.0 | 49 | 50.0 | 57 | 57.6 | 42 | 42.4 | 32 | 33.3 | 64 | 66.7 | 46 | 46.0 | 54 | 54.0 |
Table 2.2A (continued): Indigenous SMEs by obstacles to growth and firm characteristics (number of observations and percentFootnote 90)
| Firm characteristic | Competition | Economic conditions | Government regulation | Business support | ||||||||||||
|---|---|---|---|---|---|---|---|---|---|---|---|---|---|---|---|---|
| Not an obstacle | Obstacle | Not an obstacle | Obstacle | Not an obstacle | Obstacle | Not an obstacle | Obstacle | |||||||||
| Count | % of respondents | Count | % of respondents | Count | % of respondents | Count | % of respondents | Count | % of respondents | Count | % of respondents | Count | % of respondents | Count | % of respondents | |
| Industry | 911 | 590 | 532 | 941 | 734 | 729 | 1182 | 296 | ||||||||
| Accommodation and food services | 113 | 70.6 | 47 | 29.4 | 52 | 34.0 | 101 | 66.0 | 87 | 56.1 | 68 | 43.9 | 130 | 83.3 | 26 | 16.7 |
| Retail trade | 132 | 57.1 | 99 | 42.9 | 85 | 37.6 | 141 | 62.4 | 122 | 54.7 | 101 | 45.3 | 179 | 78.2 | 50 | 21.8 |
| Administration and provision of goods | 85 | 71.4 | 34 | 28.6 | 49 | 41.5 | 69 | 58.5 | 56 | 48.7 | 59 | 51.3 | 95 | 80.5 | 23 | 19.5 |
| Resource-based industries | 81 | 51.9 | 75 | 48.1 | 56 | 35.9 | 100 | 64.1 | 60 | 38.7 | 95 | 61.3 | 130 | 82.8 | 27 | 17.2 |
| Arts, entertainment, and recreation | 63 | 73.3 | 23 | 26.7 | 22 | 26.2 | 62 | 73.8 | 51 | 61.4 | 32 | 38.6 | 67 | 80.7 | 16 | 19.3 |
| Health care and social assistance | 73 | 78.5 | 20 | 21.5 | 39 | 41.9 | 54 | 58.1 | 58 | 63.0 | 34 | 37.0 | 72 | 75.8 | 23 | 24.2 |
| Infrastructure and logistics heavy industries | 147 | 49.7 | 149 | 50.3 | 98 | 33.8 | 192 | 66.2 | 132 | 46.2 | 154 | 53.8 | 231 | 81.1 | 54 | 18.9 |
| Management and knowledge-based industries | 118 | 61.1 | 75 | 38.9 | 71 | 37.4 | 119 | 62.6 | 85 | 45.2 | 103 | 54.8 | 146 | 77.2 | 43 | 22.8 |
| Manufacturing | 42 | 68.9 | 19 | 31.1 | 15 | 25.0 | 45 | 75.0 | 26 | 43.3 | 34 | 56.7 | 48 | 80.0 | 12 | 20.0 |
| Professional, scientific and technical services | 57 | 53.8 | 49 | 46.2 | 45 | 43.7 | 58 | 56.3 | 57 | 53.8 | 49 | 46.2 | 84 | 79.2 | 22 | 20.8 |
| Firm size | 916 | 595 | 536 | 946 | 742 | 731 | 1188 | 297 | ||||||||
| 1-4 employees | 286 | 62.3 | 173 | 37.7 | 165 | 36.7 | 285 | 63.3 | 236 | 52.9 | 210 | 47.1 | 361 | 80.4 | 88 | 19.6 |
| 5-19 employees | 392 | 58.6 | 277 | 41.4 | 243 | 37.1 | 412 | 62.9 | 320 | 48.9 | 334 | 51.1 | 506 | 76.8 | 153 | 23.2 |
| 20-99 employees | 206 | 63.0 | 121 | 37.0 | 107 | 33.4 | 213 | 66.6 | 155 | 48.9 | 162 | 51.1 | 273 | 85.0 | 48 | 15.0 |
| 100-499 employees | 32 | 57.1 | 24 | 42.9 | 21 | 36.8 | 36 | 63.2 | 31 | 55.4 | 25 | 44.6 | 48 | 85.7 | 8 | 14.3 |
| Location within Indigenous community | 908 | 593 | 533 | 940 | 738 | 725 | 1181 | 295 | ||||||||
| Within Indigenous community | 365 | 56.2 | 285 | 43.8 | 191 | 29.9 | 448 | 70.1 | 283 | 44.1 | 359 | 55.9 | 529 | 83.0 | 108 | 17.0 |
| Outside Indigenous community | 543 | 63.8 | 308 | 36.2 | 342 | 41.0 | 492 | 59.0 | 455 | 55.4 | 366 | 44.6 | 652 | 77.7 | 187 | 22.3 |
| Remoteness | 906 | 594 | 533 | 939 | 733 | 730 | 1180 | 295 | ||||||||
| Urban | 195 | 57.4 | 145 | 42.6 | 103 | 30.7 | 233 | 69.3 | 172 | 50.9 | 166 | 49.1 | 273 | 83.7 | 53 | 16.3 |
| Semi-connected | 339 | 55.9 | 267 | 44.1 | 207 | 35.0 | 385 | 65.0 | 288 | 48.5 | 306 | 51.5 | 485 | 80.6 | 117 | 19.4 |
| Remote | 372 | 67.1 | 182 | 32.9 | 223 | 41.0 | 321 | 59.0 | 273 | 51.4 | 258 | 48.6 | 422 | 77.1 | 125 | 22.9 |
| Virtual sales | 884 | 766 | 518 | 916 | 718 | 708 | 1151 | 285 | ||||||||
| Offers virtual sales | 626 | 54.2 | 530 | 45.8 | 383 | 37.4 | 642 | 62.6 | 522 | 51.3 | 496 | 48.7 | 837 | 82.1 | 182 | 17.9 |
| No virtual sales | 258 | 52.2 | 236 | 47.8 | 135 | 33.0 | 274 | 67.0 | 196 | 48.0 | 212 | 52.0 | 314 | 75.3 | 103 | 24.7 |
| Exporter | 916 | 794 | 536 | 946 | 742 | 731 | 1188 | 297 | ||||||||
| Not exporter | 850 | 53.5 | 740 | 46.5 | 504 | 36.4 | 879 | 63.6 | 697 | 50.7 | 678 | 49.3 | 1110 | 80.1 | 276 | 19.9 |
| Yes exporter | 66 | 55.0 | 54 | 45.0 | 32 | 32.3 | 67 | 67.7 | 45 | 45.9 | 53 | 54.1 | 78 | 78.8 | 21 | 21.2 |
Table 2.3A: Indigenous SMEs by obstacles to exporting and firm characteristics (number of observations and percent)Footnote 91 continued
| Firm characteristic | Total | Administrative (domestic) | Logistical | Financing | COVID-19 | |||||||||||||
|---|---|---|---|---|---|---|---|---|---|---|---|---|---|---|---|---|---|---|
| Not an obstacle | Obstacle | Not an obstacle | Obstacle | Not an obstacle | Obstacle | Not an obstacle | Obstacle | |||||||||||
| Count | % of respondents | Count | % of respondents | Count | % of respondents | Count | % of respondents | Count | % of respondents | Count | % of respondents | Count | % of respondents | Count | % of respondents | Count | % of respondents | |
| Industry | 1527 | 115 | 66 | 94 | 87 | 109 | 72 | 62 | 116 | |||||||||
| Accommodation and food services | 163 | 10.7 | 6 | 42.9 | 8 | 57.1 | 7 | 50.0 | 7 | 50.0 | 7 | 50.0 | 7 | 50.0 | 3 | 21.4 | 11 | 78.6 |
| Retail trade | 235 | 15.4 | 13 | 59.1 | 9 | 40.9 | 12 | 54.5 | 10 | 45.5 | 11 | 50.0 | 11 | 50.0 | 9 | 40.9 | 13 | 59.1 |
| Administration and provision of goods | 120 | 7.9 | 5 | 71.4 | 2 | 28.6 | 2 | 28.6 | 5 | 71.4 | 4 | 57.1 | 3 | 42.9 | 2 | 28.6 | 5 | 71.4 |
| Resource-based industries | 160 | 10.5 | 13 | 61.9 | 8 | 38.1 | 9 | 42.9 | 12 | 57.1 | 14 | 66.7 | 7 | 33.3 | 8 | 40.0 | 12 | 60.0 |
| Arts, entertainment, and recreation | 86 | 5.6 | 19 | 63.3 | 11 | 36.7 | 17 | 56.7 | 13 | 43.3 | 15 | 50.0 | 15 | 50.0 | 8 | 26.7 | 22 | 73.3 |
| Health care and social assistance | 99 | 6.5 | 5 | 71.4 | 2 | 28.6 | 5 | 71.4 | 2 | 28.6 | 4 | 57.1 | 3 | 42.9 | 4 | 57.1 | 3 | 42.9 |
| Infrastructure and logistics heavy industries | 300 | 19.6 | 7 | 58.3 | 5 | 41.7 | 6 | 50.0 | 6 | 50.0 | 6 | 50.0 | 6 | 50.0 | 2 | 16.7 | 10 | 83.3 |
| Management and knowledge-based industries | 197 | 12.9 | 7 | 58.3 | 5 | 41.7 | 8 | 66.7 | 4 | 33.3 | 8 | 66.7 | 4 | 33.3 | 4 | 40.0 | 6 | 60.0 |
| Manufacturing | 61 | 4.0 | 28 | 75.7 | 9 | 24.3 | 14 | 37.8 | 23 | 62.2 | 26 | 70.3 | 11 | 29.7 | 14 | 37.8 | 23 | 62.2 |
| Professional, scientific and technical services | 106 | 6.9 | 12 | 63.2 | 7 | 36.8 | 14 | 73.7 | 5 | 26.3 | 14 | 73.7 | 5 | 26.3 | 8 | 42.1 | 11 | 57.9 |
| Firm size | 1537 | 117 | 66 | 96 | 87 | 110 | 72 | 63 | 117 | |||||||||
| 1-4 employees | 467 | 30.4 | 48 | 63.2 | 28 | 36.8 | 42 | 55.3 | 34 | 44.7 | 45 | 59.2 | 31 | 40.8 | 29 | 38.7 | 46 | 61.3 |
| 5-19 employees | 681 | 44.3 | 46 | 68.7 | 21 | 31.3 | 36 | 53.7 | 31 | 46.3 | 41 | 61.2 | 26 | 38.8 | 22 | 33.3 | 44 | 66.7 |
| 20-99 employees | 332 | 21.6 | 17 | 58.6 | 12 | 41.4 | 13 | 44.8 | 16 | 55.2 | 20 | 69.0 | 9 | 31.0 | 9 | 32.1 | 19 | 67.9 |
| 100-499 employees | 57 | 3.7 | 6 | 54.5 | 5 | 45.5 | 5 | 45.5 | 6 | 54.5 | 4 | 40.0 | 6 | 60.0 | 3 | 27.3 | 8 | 72.7 |
| Location within Indigenous community | 1527 | 116 | 66 | 96 | 86 | 110 | 71 | 63 | 116 | |||||||||
| Within Indigenous community | 662 | 43.4 | 75 | 70.1 | 32 | 29.9 | 64 | 59.8 | 43 | 40.2 | 73 | 68.2 | 34 | 31.8 | 45 | 42.9 | 60 | 57.1 |
| Outside Indigenous community | 865 | 56.6 | 41 | 54.7 | 34 | 45.3 | 32 | 42.7 | 43 | 57.3 | 37 | 50.0 | 37 | 50.0 | 18 | 24.3 | 56 | 75.7 |
| Remoteness | 1526 | 115 | 66 | 95 | 86 | 109 | 180 | 71 | 120 | 62 | 116 | |||||||
| Urban | 345 | 22.6 | 44 | 72.1 | 17 | 27.9 | 36 | 59.0 | 25 | 41.0 | 38 | 63.3 | 22 | 36.7 | 18 | 29.5 | 43 | 70.5 |
| Semi-connected | 619 | 40.6 | 47 | 65.3 | 25 | 34.7 | 39 | 54.2 | 33 | 45.8 | 45 | 62.5 | 27 | 37.5 | 29 | 41.4 | 41 | 58.6 |
| Remote | 562 | 36.8 | 24 | 50.0 | 24 | 50.0 | 20 | 41.7 | 28 | 58.3 | 26 | 54.2 | 22 | 45.8 | 15 | 31.9 | 32 | 68.1 |
| Virtual sales | 1486 | 112 | 64 | 92 | 84 | 108 | 68 | 63 | 110 | |||||||||
| Offers virtual sales | 1058 | 71.2 | 51 | 71.8 | 20 | 28.2 | 41 | 57.7 | 30 | 42.3 | 47 | 66.2 | 24 | 33.8 | 23 | 33.8 | 45 | 66.2 |
| No virtual sales | 428 | 28.8 | 61 | 58.1 | 44 | 41.9 | 51 | 48.6 | 54 | 51.4 | 61 | 58.1 | 44 | 41.9 | 40 | 38.1 | 65 | 61.9 |
Table 2.3A: Indigenous SMEs by obstacles to exporting and firm characteristics (number of observations and percent)Footnote 92
| Firm characteristic | Financial risk | Discrimination | Location | |||||||||
|---|---|---|---|---|---|---|---|---|---|---|---|---|
| Not an obstacle | Obstacle | Not an obstacle | Obstacle | Not an obstacle | Obstacle | |||||||
| Count | % of respondents | Count | % of respondents | Count | % of respondents | Count | % of respondents | Count | % of respondents | Count | % of respondents | |
| Industry | 122 | 58 | 137 | 41 | 132 | 48 | ||||||
| Accommodation and food services | 10 | 71.4 | 4 | 28.6 | 10 | 71.4 | 4 | 28.6 | 10 | 71.4 | 4 | 28.6 |
| Retail trade | 14 | 63.6 | 8 | 36.4 | 14 | 70.0 | 6 | 30.0 | 18 | 81.8 | 4 | 18.2 |
| Administration and provision of goods | 4 | 57.1 | 3 | 42.9 | 6 | 85.7 | 1 | 14.3 | 3 | 42.9 | 4 | 57.1 |
| Resource-based industries | 13 | 61.9 | 8 | 38.1 | 18 | 85.7 | 3 | 14.3 | 13 | 61.9 | 8 | 38.1 |
| Arts, entertainment, and recreation | 23 | 79.3 | 6 | 20.7 | 25 | 83.3 | 5 | 16.7 | 21 | 70.0 | 9 | 30.0 |
| Health care and social assistance | 6 | 85.7 | 1 | 14.3 | 5 | 71.4 | 2 | 28.6 | 5 | 83.3 | 1 | 16.7 |
| Infrastructure and logistics heavy industries | 6 | 50.0 | 6 | 50.0 | 10 | 83.3 | 2 | 16.7 | 9 | 75.0 | 3 | 25.0 |
| Management and knowledge-based industries | 9 | 75.0 | 3 | 25.0 | 8 | 66.7 | 4 | 33.3 | 9 | 75.0 | 3 | 25.0 |
| Manufacturing | 22 | 59.5 | 15 | 40.5 | 25 | 69.4 | 11 | 30.6 | 29 | 78.4 | 8 | 21.6 |
| Professional, scientific, and technical services | 15 | 78.9 | 4 | 21.1 | 16 | 84.2 | 3 | 15.8 | 15 | 78.9 | 4 | 21.1 |
| Firm size | 63 | 117 | 139 | 41 | 133 | 49 | ||||||
| 1-4 employees | 29 | 38.7 | 46 | 61.3 | 57 | 75.0 | 19 | 25.0 | 64 | 84.2 | 12 | 15.8 |
| 5-19 employees | 22 | 33.3 | 44 | 66.7 | 47 | 73.4 | 17 | 26.6 | 48 | 73.8 | 17 | 26.2 |
| 20-99 employees | 9 | 32.1 | 19 | 67.9 | 25 | 86.2 | 4 | 13.8 | 17 | 56.7 | 13 | 43.3 |
| 100-499 employees | 3 | 27.3 | 8 | 72.7 | 10 | 90.9 | 1 | 9.1 | 4 | 36.4 | 7 | 63.6 |
| Location within Indigenous community | 123 | 58 | 138 | 41 | 132 | 49 | ||||||
| Within Indigenous community | 80 | 74.8 | 27 | 25.2 | 87 | 83.7 | 17 | 16.3 | 83 | 78.3 | 23 | 21.7 |
| Outside Indigenous community | 43 | 58.1 | 31 | 41.9 | 51 | 68.0 | 24 | 32.0 | 49 | 65.3 | 26 | 34.7 |
| Remoteness | 122 | 58 | 137 | 41 | 132 | 48 | ||||||
| Urban | 41 | 67.2 | 20 | 32.8 | 46 | 76.7 | 14 | 23.3 | 49 | 81.7 | 11 | 18.3 |
| Semi-connected | 51 | 70.8 | 21 | 29.2 | 55 | 78.6 | 15 | 21.4 | 58 | 81.7 | 13 | 18.3 |
| Remote | 30 | 63.8 | 17 | 36.2 | 36 | 75.0 | 12 | 25.0 | 25 | 51.0 | 24 | 49.0 |
| Virtual sales | 121 | 55 | 133 | 40 | 132 | 43 | ||||||
| Offers virtual sales | 47 | 66.2 | 24 | 33.8 | 58 | 81.7 | 13 | 18.3 | 53 | 74.6 | 18 | 25.4 |
| No virtual sales | 74 | 70.5 | 31 | 29.5 | 75 | 73.5 | 27 | 26.5 | 79 | 76.0 | 25 | 24.0 |
Table 2.4A: Obstacles to business growth by identity of ownership
| Obstacles to firm growth | First Nations-owned SMEs (%) | Métis-owned SMEs (%) | Inuit-owned SMEs (%) |
|---|---|---|---|
| Access to financing | 41.6 | 35.5 | 33.7 |
| Access to equity or capital | 42.8 | 36.4 | 29.6 |
| Attracting employees with the right skills or qualifications | 62.0 | 60.3 | 64.3 |
| Competition | 34.9 | 41.3 | 23.9 |
| Fluctuations in customer or client demand | 47.7 | 55.1 | 40.1 |
| Access to business advisory support | 21.0 | 16.5 | 21.3 |
| Cost of doing business, such as input costs | 49.6 | 62.9 | 44.0 |
| Overall economic conditions | 60.8 | 69.9 | 51.4 |
| Government policy, rules, and regulations including tax law | 44.6 | 60.5 | 41.4 |
| Reliable Internet access, telephone, and other IT technologies | 36.8 | 34.2 | 58.2 |
| Other infrastructure such as electricity, water, and roads | 26.8 | 18.0 | 40.5 |
Source: Canadian Council for Indigenous Business & Global Affairs Canada’s Survey of Indigenous Firms, 2021
Table 2.5A Trade policies and supports that are deemed very useful to exporting by identity of ownership (among firms with export experience or who indicate intention to export)
| Trade policies and supports that are deemed very helpful to exporting | First Nations-owned SMEs | Métis-owned SMEs | Inuit-owned SMEs (%) |
|---|---|---|---|
| Trade policies | |||
| Stronger intellectual property protections for Traditional Knowledge or cultural expressions such as artwork and stories | 47.8 | 30.1 | 53.3 |
| Simpler customs procedures | 52.3 | 63.1 | 42.6 |
| Easier to obtain passport visas or free movement of people across borders | 45.6 | 47.1 | 41.2 |
| Harmonized standards for domestic products sold outside of Canada | 30.1 | 33.2 | 39.7 |
| Lower tariffs | 40.5 | 42.8 | 29.8 |
| More access to foreign government procurement opportunities | 37.7 | 54.7 | 35.7 |
| Trade supports | |||
| Help developing an export plan | 47.1 | 42.1 | 8.9 |
| Help developing a marketing plan | 42.0 | 33.6 | 52.0 |
| Available sources of financing | 50.5 | 42.8 | 51.5 |
| Help accessing available financing | 57.0 | 41.9 | 54.9 |
| Information about which markets to pursue | 42.9 | 43.4 | 29.7 |
| Introductions to potential customers | 64.3 | 55.0 | 43.1 |
| Connections with Indigenous clients or partners worldwide | 64.4 | 66.5 | 35.6 |
| Connections with international businesses and partners | 56.2 | 40.3 | 39.6 |
| Connections with government agencies outside of Canada | 37.6 | 42.5 | 33.9 |
| A mentor to help guide the business | 40.1 | 30.2 | 29.0 |
Source: Canadian Council for Indigenous Business & Global Affairs Canada’s Survey of Indigenous Firms, 2021
- Date modified: