
See an updated report here: Adàwe: export experiences of Indigenous entrepreneurs
Indigenous-Owned Exporting Small and Medium Enterprises in Canada
June 2019
Table of Contents
Acknowledgments
The Office of the Chief Economist of Global Affairs Canada (OCE-GAC) and the Canadian Council for Aboriginal Business (CCAB) express their deep appreciation and gratitude to those involved in the development of this report.
The production of this report was coordinated by lead author Audrey Ann Bélanger Baur, Economist, Inclusive Trade Research Lead, Office of the Chief Economist, Global Affairs Canada. The author wishes to thank Brittney Sault, Project Manager, CCAB, and Max Skudra, Research Director and Government Relations, CCAB for their ongoing support and collaboration to bring this project to term. The CCAB has collaborated closely with Dr. Ken Coates, Research Chair in Regional Innovation at the Johnson-Shoyama Graduate School of Public Policy, University of Saskatchewan Campus, to identify case studies and support the qualitative analysis of the report. Many thanks to all colleagues within the Office of the Chief Economist in providing a helping hand reviewing the report, notably, Chuang (Kevin) Jiang, Junior Economist, OCE-GAC who vetted all the statistics of the report. Thank you to the participants of the inter-departmental presentation on 14 March 2019 for their feedback. Finally, a special mention is given for the assistance of the Centre for Special Business Projects and Economic Analysis Divisions of Statistics Canada in computing special statistics from the Survey on Financing and Growth of SMEs and reviewing the appendix.
Graphic design and layout were developed by Design de Plume.
All errors and omissions are the author’s.
Please cite this publication as:
Bélanger Baur, A., 2019, Indigenous-Owned Exporting Small and Medium Enterprises in Canada, Global Affairs Canada & Canadian Council for Aboriginal Business.
This work is published under the joint responsibility of Global Affairs Canada and the Canadian Council for Aboriginal Business. The opinions expressed and arguments employed thus do not necessarily reflect the official views of the Government of Canada.
Executive Summary
This report reviews of the characteristics of Indigenous small and medium enterprises (SMEs) involved in international trade, and identifies opportunities for enhanced federal policy and program design to support Indigenous business performance in international markets. Exporting is one of the main characteristics used to evaluate performance since businesses are confronted with numerous challenges when attempting to enter foreign markets. For Indigenous firms operating in a small open economy like Canada, internationalization can be an important strategy for business growth and success. This report is motivated by this growth strategy, to which many government departments contribute, as well as the participation and inclusion in international trade of all Canadian businesses for sustainable growth.Footnote 1 The Office of the Chief Economist of Global Affairs Canada (OCE-GAC) partnered with the Canadian Council for Aboriginal Business (CCAB) and used the unique data they collected, i.e. the survey results of on-reserve and off-reserve Indigenous entrepreneurs, for analysis.
The CCAB research defines the Indigenous economy in Canada through a register of 10,000 Indigenous businesses. This study is built on evidence from a sample of 1,101 Indigenous entrepreneurs, including nearly 650 Indigenous SMEs.
The main findings of this report, based on the data, are that:
- Approximately 24.4 percent of Indigenous SMEs export;
- Over 1 in 5 Indigenous SMEs export to the U.S. and over 1 in 7 sell to non-U.S. overseas markets;
- Higher education attainment by firm leaders is associated with a higher tendency to export;
- Indigenous SME owners with, on average, at least five years of managing experience are more likely to access international markets;
- Exporting Indigenous SMEs report financing and connectivity (internet and infrastructure related) as important obstacles to growth at a higher rate compared to non-exporting Indigenous SMEs; and
- The use of social media tools by Indigenous SME owners appears to be one of the main factors supporting their internationalization efforts.
The data also suggests that many Indigenous SME owners have found creative ways to overcome obstacles imposed by location disadvantages. Most significantly, this project underscores how sophisticated and engaged the Indigenous business community is nationally and in the global economy.
Introduction
The livelihoods, economic conditions and contributions to the Canadian gross domestic product (GDP) of Indigenous Peoples have attracted increasing research interest in Canada over the past decade. Nationally, there is considerable evidence that the success of small and medium enterprises (SMEs) is a key component to support sustainable economic growth and trade diversification, both in terms of products and geography. At present, relatively little is known about Indigenous individuals and the businesses they manage. Although a number of case studies of Indigenous businesses have recently been published, there is much work still to be done to build a data driven picture of the Indigenous economy. This publication of Indigenous-owned SMEs, notably concerning their export activity and exporter characteristics, uses original and as comparable as possible national statistics. The findings will support the development of enhanced public policy and federal program innovation to encourage Indigenous trade and related small business initiatives.
For many years, Indigenous business development focused on local opportunities: retail stores, gas stations, hotels, tourist services, construction companies and community-oriented businesses. In recent years, Indigenous businesses expanded into mining operations, transportation companies, airlines, professional services, casinos, major destination hotels, residential real estate developments, cannabis production and many other ventures. But as Canadian businesses as a whole appreciate, this country provides a comparatively constrained platform for commercial development. Connecting to other markets, primarily in the United States of America but increasingly Europe and Asia as well, expands the opportunities for business growth. Indigenous companies have taken important but often preliminary steps into these promising fields.
The size and diversity of Indigenous business in Canada is much larger than is generally understood, with current operations accounting for billions of dollars in annual operations, with thousands of employees and one of the highest growth rates in the country.Footnote 2 The economic literature identifies exporting firms as more successful than non-exporting ones. In general, they are more productive, with higher revenues and larger investments in research and development (R&D). Exporting firms also tend to pay higher wages. Although generally small in terms of the number of employees, Indigenous-owned SMEs export at a very high rate according to the CCAB data. In fact, Indigenous engagement in exporting is about twice as high according to this survey than previously estimated by Statistics Canada.Footnote 3 Despite facing additional challenges to achieve business growth, including geographic remoteness, discrimination and constraints on financing, a significant number of Indigenous SME owners have a found ways to circumvent obstacles, such as by using social media tools, in order to reach larger markets.
This collaborative project between Global Affairs Canada and the Canadian Council of Aboriginal Business represents a first and major step toward the co-development of effective international business promotion policies. It provides a data-driven review of current Indigenous SME activities, combining standard Statistics Canada data and the results of a CCAB national survey of Indigenous businesses. The report explains the current status of Indigenous SME engagement in international business, documenting their unexpectedly high level of participation and preparedness for working outside of Canada’s boundary. It explores, further, the degree to which standard international trade theory explains Indigenous business activities and shines light on the unique nature of Indigenous commercial involvement.
I. Data and Definitions
To ensure the data and findings presented in this report are as comparable as possible with other statistical sources, the key terms used throughout the report are defined as follows:
- A self-employed Indigenous individual, also referred to as an Indigenous entrepreneur in this report, is a self-employed Indigenous person who organizes and operates a business or businesses, and for whom the revenues of that business are his or her main source of income;
- A small and medium enterprise (SME) is a business which has between one and 499 paid employees, and at least $25,000 in revenues annually;Footnote 4
- An Indigenous business owner is an employer and is defined as an Indigenous entrepreneur that owns an SME;
- An Indigenous business is defined as an SME which has at least 51 percent Indigenous (First Nations, Métis, Inuit, and mixed identities) ownership;
- An exporting SME or exporter is a business that sells goods or services, or both, outside of Canada or to foreigners; and finally
- The export propensity is the share (as a percentage) of businesses that export.
According to the General Agreement on Trade in Services (GATS), a business may supply services to foreigners through four different modes of supply, notably through cross-border exports (the most common method of supply – mode 1), consumption abroad (e.g. tourists or patients purchasing goods of services abroad – mode 2), a commercial presence abroadFootnote 5 (such as a locally-established affiliate or subsidiary of a foreign-owned company – mode 3), and the presence of company representatives abroad supplying services in a foreign country (e.g. a consultant or employee of a service provider like a construction company – mode 4).Footnote 6 The data collected was obtained through a special survey conducted by the CCAB and does not provide specific information on these various modes of supply. Nonetheless, they may help explain certain patterns noticed in the data.
The survey data were collected by the CCAB through phone interviews with 1,101 Indigenous businesses, including nearly 650 SMEs. The research spans four broad dimensions: the industry characteristics, owners’ characteristics, the factors leading to their successes, and their main challenges. In previous CCAB reports, the data were calibrated according to Indigenous identity (First Nation, Métis, and Inuit), and the business structure (incorporated, not incorporated, no employee or with employees) of self-employed Indigenous Peoples. For the purpose of this report, and serving as a robustness test, the data were calibrated differently based on entrepreneurs’ Indigenous identity, their industry of operation, and their geographic location. Although calibrating the business sample with the Indigenous self-employed population could lead to certain irregularities, it appeared to be the best solution currently available given the general lack of high quality data on Indigenous Peoples and their businesses. Following the calibration, the sample was restricted to SMEs using the previously mentioned definition provided by Statistics Canada to ensure results could be compared to other Canadian statistics as much as possible.
The CCAB data capture the Indigenous economy in Canada through a register of 10,000 Indigenous businesses. This specific study is built on evidence from a sample of 1,101 Indigenous entrepreneurs, including nearly 650 Indigenous SMEs, with approximately one third of these located on reserve. As an Indigenous-owned non-governmental organization (NGO), the CCAB is trusted by Indigenous business owners and thus would receive high quality responses in its surveys, even by those located on reserve. This is the main factor differentiating the data collected by the CCAB from other sources providing survey estimates on the share of Indigenous exporters. Indeed, according to Statistics Canada’s Survey on Financing and Growth of Small and Medium Enterprises,Footnote 7 0.9 percent of exporting SMEs were Indigenous in 2014, i.e. 12.0 percent of Indigenous SMEs exported, compared to 24.4 percent based on the Canadian Council for Aboriginal Business (CCAB) data. The national average that same year stood at 11.8 percent of all Canadian SMEs.Footnote 8 The most recent data from Statistics Canada states that in 2017, Indigenous SMEs represented 1.4 percent of all SMEs and that 7.9 percent of these exported, compared to 11.7 percent for the general population of Canadian SMEs.Footnote 9 However, Industry Canada estimated based on Statistics Canada’s Aboriginal Entrepreneurs Survey that 13.2 percent of Indigenous SMEs exported in the early 2000s.Footnote 10 More recently, Indigenous and Northern Affairs Canada reported that 13.7 percent of Indigenous businesses registered with the federal Aboriginal Business Directory exported in 2018.Footnote 11 The variability in findings between the CCAB and Statistics Canada may be due to a poor understanding of Canadian Indigenous Peoples (First Nations, Métis and Inuit) businesses, their structures, specific challenges and comparative advantages. Indeed, the majority of Indigenous businesses do not or have never participated in a business survey, especially if they are located on reserve.Footnote 12
Other sources of data referred to in this report include the Census of Population and the 2011 National Household Survey (NHS), which was designed to complement the data collected in the short-form census by providing demographic, social and economic characteristics about people in Canada.
II. Sustainable Development Goals
Supporting the economic development of Indigenous Peoples will help improve social outcomes and challenges faced by Indigenous communities in Canada. Enhanced economic independence and success, through stronger business performance and participation in international trade, has the potential to improve the living standards of Indigenous Peoples.
The United Nations Sustainable Development Goals (SDGs) are a set of goals, targets and indicators, adopted by all Member States to support and guide the development agenda from 2015 to 2030. The SDGs encompass the social, environmental and economic dimensions of society and seek to improve the lives of all with no one left behind.Footnote 13
The main goals this research contributes to are:
Goal 8 – Decent work and economic growth as Indigenous-owned businesses are an intrinsic part of, and fundamental to, Indigenous communities’ prosperity and agency;
Goal 10 – Reduced inequalities as increased knowledge on the business needs and challenges faced by Indigenous business owners will inform programs designed to support their initiatives; and
Goal 17 – Partnerships for the Goals as a better understanding of Indigenous business structures and comparative advantages will help break down barriers between Indigenous Peoples, non-Indigenous Canadians, businesses and governments.
The secondary goals this research contributes to are:
- Goal 1 – No poverty;
- Goal 3 – Good health and well-being;
- Goal 4 – Quality Education; and
- Goal 11 – Sustainable Cities and Communities.

Business and economic development are associated with reduced poverty, increased well-being and ability to succeed in school. This research supports the independent development of Indigenous communities in a manner that respects their values and traditions. Importantly, the CCAB’s data supplements the generally insufficient and fragmented data and information available on Indigenous Peoples in Canada.
The Indigenous Economy and Business Activity
Indigenous Peoples are the youngest and fastest growing Canadian demographic. According to the 2016 Census, the median age of Indigenous persons was 29 years in contrast to 41 years for non-Indigenous Canadians. Between 2006 and 2016, Canada’s Indigenous population grew by 42.7 percent, whereas the rest of the Canadian population grew by 9.0 percent over the same period.Footnote 14 As such, it is crucial to increase our understanding of Indigenous Peoples and the economy in which they operate.
In 2015, Indigenous persons earned less than other Canadians on average. According to one Statistics Canada analysis, this would mainly be due to comparatively lower levels of education attainment which makes them less likely to be employed in high-wage "knowledge occupations".Footnote 15 Moreover, the employment rate of Indigenous persons off-reserve in the core working ages (generally between 65.0 and 70.0 percent) is also significantly lower than that of non-Indigenous persons between 25 and 54 years of age (over 80.0 percent), which may further explain the earnings gap. It is also estimated that the economic downturn in 2008-2009 affected Indigenous Peoples and the labour market re-integration of Indigenous persons living off-reserve more severely than non-Indigenous people.Footnote 16 Finally, the gap between First Nations on-reserve and the rest of the Canadian population in terms of a series of economic indicators widened over the period of 2006 and 2011.Footnote 17 Although employment recovered to pre-recession levels by 2014 for Indigenous persons living off-reserve, the memory of this period could influence the answers of respondents in 2015.
In contrast to this bleak representation of the Indigenous economy, many recent reportsFootnote 18 refer to the under-utilized economic potential of Indigenous Peoples and support the hypothesis that Canada is not accurately measuring their economic contributions. It is also believed that Indigenous businesses do not have access to all the business services that could support their development, thus leaving a source of untapped potential. Notwithstanding these data sources, the portrait of the Indigenous economy is likely incomplete. Many of Statistics Canada’s analyses have limited insight or data from Indigenous persons on-reserve. The CCAB dataset helps to scope out a more complete picture of Indigenous business activities in Canada.
Historically, according to the Métis historian Dr. David T. McNab, “[t]rade and the art and the science of trading has always been a significant legacy bequeathed by Indigenous people […]”and these diversified cultures and economies persist today. “It is in this way that the Indigenous gift of trade and trading remains to this day as integral to, and inseparable from, Indigenous sovereignty.”Footnote 19 There are more than 630 First Nations communities representing over 50 distinct language and cultural groups across Canada.Footnote 20 These communities and Indigenous persons have distinct experiences shaped by their economic and business endeavours, various remote locations and history.
The following sections review facts regarding the performance of Indigenous entrepreneurs and SMEs in Canada to provide context for the upcoming analysis.
I. Indigenous Entrepreneurs
Entrepreneurs are all self-employed individuals organizing and operating a business. Statistics Canada defines self-employed persons as persons aged 15 years and over with or without an incorporated business with paid or without paid help, as well as unpaid family workers.Footnote 21 Generally speaking, entrepreneurs live from the revenues of their business, such that unpaid self-employed individuals and employees with a business with lower revenues than their employee salary would be excluded from the definition of entrepreneur.Footnote 22 In 2016, Indigenous Peoples represented 4.9 percent of the Canadian population. Indigenous entrepreneurs accounted for 2.5 percent of all Canadian entrepreneurs, up from 2.2 percent in 2011.Footnote 23
According to the 2016 Census conducted by Statistics Canada, 54,255 Indigenous individuals were self-employed,Footnote 24 an increase of 25.3 percent compared to 2011, when 43,305 Indigenous individuals were self-employed.Footnote 25 The 2011 NHS and 2016 Census provide information concerning the distribution of Indigenous entrepreneurs across industries (Figure 1):
Figure 1 – Distribution of Indigenous Entrepreneurs by Industry, 2011-2016

Figure 1 - Text version
Figure 1 – Distribution of Indigenous Entrepreneurs by Industry, 2011 – 2016
| Industry | 2016 | 2011 |
|---|---|---|
| Public administration | 0 | 180 |
| Utilities | 25 | 35 |
| Management of companies and enterprise | 40 | 25 |
| Finance and insurance | 715 | 485 |
| Mining, quarrying and oil and gas extraction | 795 | 430 |
| Information and cultural industries | 925 | 655 |
| Wholesale trade | 940 | 750 |
| Education services | 1,090 | 545 |
| Real estate and rental and leasing | 1,165 | 960 |
| Accommodation and food services | 1,580 | 1,165 |
| Manufacturing | 1,640 | 1,285 |
| Transportation and warehousing | 2,275 | 2,200 |
| Arts, entertainment and recreation | 2,280 | 1,675 |
| Retail trade | 3,810 | 2,630 |
| Agriculture, forestry, fishing and hunting | 3,990 | 3,275 |
| Administrative and support, waste management, remediation services | 4,015 | 2,985 |
| Health care and social assistance | 4,905 | 3,170 |
| Other services (except public administration) | 5,380 | 3,625 |
| Professional, scientific and technical services | 5,505 | 4,345 |
| Construction | 9,115 | 7,270 |
Source: Office of the Chief Economist, Global Affairs Canada using data obtained from the Conference Board of Canada in the report Aboriginal Entrepreneurship in Canada; and Statistics Canada’s Census 2016.
Note: The data labels represent identify the number of self-employed Indigenous entrepreneurs in 2016.
Source: Office of the Chief Economist, Global Affairs Canada using data obtained from the Conference Board of Canada in the report Aboriginal Entrepreneurship in Canada; and Statistics Canada’s Census 2016.
All industries, except public administration and utilities, were marked by an increase in the number of Indigenous entrepreneurs between 2011 and 2016. Indigenous entrepreneurs are overrepresented relative to all Canadians in construction and underrepresented in professional, scientific, and technical services, education, health and social industries. Over 19.3 percent of Indigenous entrepreneurs operate in the construction industry.Footnote 26
Based on the 2016 Census, over half of Indigenous entrepreneurs operate a business in an industry with export potential,Footnote 27 such as agriculture, forestry, fishing, hunting and trapping; tourism and recreation; fabricated metal and machinery; clothing and textile; and oil and gas production.Footnote 28 Moreover, according to benchmark data from the 2016 Census and Statistics Canada’s Business Register, 9.8 percent of Indigenous businesses are located in the top 15 high export-intensive industriesFootnote 29 . The Conference Board of Canada has found that 15.5 percent of Inuit entrepreneurs, 10.4 percent of Métis entrepreneurs, and 9.1 percent of First Nations entrepreneurs operate in high export-intensive industries compared to 10.2 of non-Indigenous entrepreneurs. When restricting the industries further to export-oriented industriesFootnote 30 , Indigenous entrepreneurs continue to be overrepresented compared to their non-Indigenous counterparts: 3.6 percent of Inuit entrepreneurs, 2.2 percent of Métis entrepreneurs, and 2.1 percent of First Nations entrepreneurs, compared to 2.0 percent for non-Indigenous entrepreneurs.Footnote 31
According to Statistics Canada data, manufacturing is the dominant export-intensive industry in terms of employment of non-Indigenous Canadians, while Indigenous employees are mainly found in the agriculture, forestry, fishing, hunting and trapping export-intensive industry, except for Inuit who are concentrated in mining and quarrying. Table 1 highlights the tendency of Indigenous Peoples to work as entrepreneurs rather than as employees in export-intensive industries when compared to their Canadian counterparts:
Table 1 – Proportion of employees and entrepreneurs in Export-Intensive and High Export-Intensive Industries, 2016
| High Export-Intensive (%) | Top High Export-Intensive Industry | Export-Intensive (%) | ||
|---|---|---|---|---|
| First Nations | Employed | 7.3 | Agriculture, fishing, hunting & trapping | 58.2 |
| Entrepreneur | 9.1 | 51.4 | ||
| Inuit | Employed | 6.0 | Mining and Quarrying | 50.1 |
| Entrepreneur | 15.5 | 57.5 | ||
| Metis | Employed | 8.7 | Agriculture, fishing, hunting & trapping | 57.3 |
| Entrepreneur | 10.4 | 49.7 | ||
| Non-Indigenous | Employed | 9.3 | Fabricated metal and machinery | 59.1 |
| Entrepreneur | 10.2 | Agriculture, fishing, hunting & trapping | 50.6 | |
Note: Fabricated metal and machinery is a subcategory of the manufacturing industry.
Source: Office of the Chief Economist, Global Affairs Canada, using data obtained from Fiser, A., What are the business characteristics of Indigenous exporters in Canada?, Conference Board of Canada, 2018, Working Paper.
The composition of employees and entrepreneurs in export-intensive and high export-intensive industries is most similar between Métis and non-Indigenous persons. From 1996 to 2016, Métis contributed the most to Indigenous self-employment growth. They are mainly located in the Western provinces (60 percent) and Ontario (19 percent), and are the most urbanized group of Indigenous Peoples (61 percent). Moreover, Métis entrepreneurs are more likely to have higher education (32 percent) than their Indigenous counterparts (24 percent for First Nations and 18 percent for Inuit). They are also slightly younger than the average Canadian entrepreneur with 44.5 percent under 45 years of age compared to 36.3 percent for non-Indigenous entrepreneurs.Footnote 32
II. Indigenous-owned SMEs
Indigenous-owned SMEs or Indigenous SMEs are defined as firms with at least 51 percent Indigenous ownership with paid employees (but no more than 499 employees) and at least $25,000 in gross revenues.Footnote 33 According to Statistics Canada’s Aboriginal Entrepreneurs Survey, 34.8 percent of Indigenous entrepreneurs employed at least one full-time employee in 2002.Had all of these entrepreneurs also had sufficiently high revenues to be considered an SME, we would have counted nearly 9,500 SMEs in 2002. Assuming a proportional increase in SMEs with the Indigenous entrepreneurial population, there would be over 18,000 Indigenous SMEs in 2016.Footnote 34 While these numbers are likely inflated, it provides a basis of comparison for the CCAB data. Indeed, following the calibration of data, the weighted count of Indigenous SMEs is estimated around 13,770 businesses with approximately 3,360 exporters.
Figure 2 – Population of Indigenous Self-Employed, Entrepreneurs and SME owners in Canada, 1996-2016
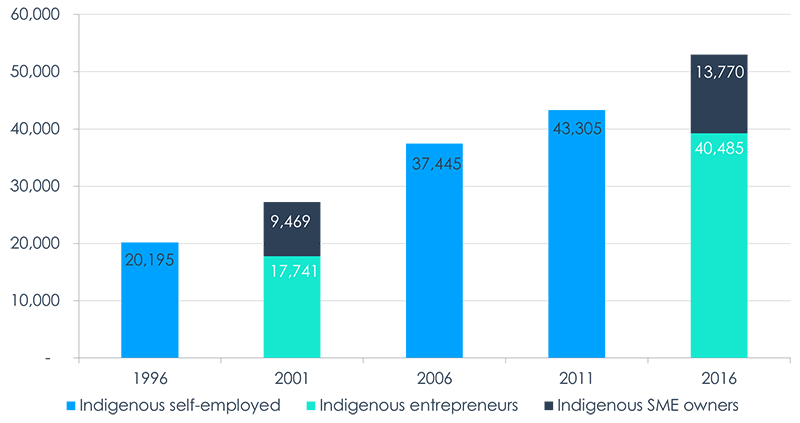
Figure 2 – Text version
Figure 2 – Population of Indigenous Self-Employed, Entrepreneurs and SME owners in Canada, 1996 – 2016
| Year | Indigenous self-employed | Indigenous entrepreneurs | Indigenous SME owners |
|---|---|---|---|
| 1996 | 20,195 | Non-available | Not Available |
| 2001 | Not Available | 17,741 | 9,469 |
| 2006 | 37,445 | Not Available | Not Available |
| 2011 | 43,305 | Not Available | Not Available |
| 2016 | Not Available | 39,230 | 13,770 |
Source: Office of the Chief Economist, Global Affairs Canada using data obtained from Statistics Canada, 1996, 2001, and 2016Census,2002 Aboriginal Entrepreneurship Survey, and 2006 Census and 2011 National Household Survey (NHS) Special Tabulations prepared by Statistics Canada for the Canadian Council for Aboriginal Business based on experienced self-employed labour population.
Note: Entrepreneurs and SME owners available for 2001 And 2016 only. Entrepreneurs and SME owners are the sub-categories of self-employment based on the survey designs.
Source: Office of the Chief Economist, Global Affairs Canada using data obtained from Statistics Canada, 1996, 2001, and 2016Census,2002 Aboriginal Entrepreneurship Survey, and 2006 Census and 2011 National Household Survey (NHS) Special Tabulations prepared by Statistics Canada for the Canadian Council for Aboriginal Business based on experienced self-employed labour population.
Based on the data, Indigenous SME owners tend to be young with just over half (50.9 percent) having managed their business for less than 15 years. Approximately, 34.3 percent have 1 to 4 employees (micro-sized). Most (46.0 percent) have 5 to 19 employees (tiny-sized). An additional 15.9 percent have 20 to 99 employees (small-sized), and the remainder (3.8 percent) have between 100 and 499 employees (medium-sized). In the sample, half of Indigenous SMEs reported revenues between $50,000 and $1 million, and nearly one third reported earning between $1 million and $5 million in 2014.
While the literature on Indigenous SMEs is lacking, a recent TD Economics analysis estimated Indigenous SMEs (excluding economic development corporations) earned at least $927 million in 2016.Footnote 35
III. Successes and Challenges
Less than a decade ago, studies of Indigenous business operations focused on a small number of successful companies and communities, several high-profile cooperatives, vital specialized operations like Inuit art sales, and the lengthy list of impediments to Indigenous commercial engagement. Today, Indigenous peoples have a clear role in resource development through hundreds of impact and benefit agreements, major land claims settlements, the introduction of resource revenue sharing, and a general expansion of Indigenous own-source (community-controlled and non-government funds) revenues. Indigenous business activities are expanding rapidly. Indigenous economic development corporations now have billions of dollars in investable assets; small Indigenous businesses are growing, both in numbers and profitability.Footnote 36
Indigenous SMEs differ from non-Indigenous SMEs in certain aspects, including a diversity of business structures that are both commercially viable and culturally affirming. As Carol-Anne Hilton, founder of the Indigenomics Institute explains, Indigenous businesses operate on markedly different cultural principles than most Canadian businesses.Footnote 37 Specifically, Indigenous business structures have developed in response to the idea that "a focus on individual achievement and the drive for individual acquisition of wealth can contradict the ethos of collective benefit and hence entrepreneurial endeavour."Footnote 38
A number of sources identified barriers to business growth affecting Indigenous entrepreneurs and SMEs: attracting employees with the right skills and qualifications, access to equity or capital, government policy, rules and regulations, access to financing, input costs, infrastructure needs.Footnote 39 CCAB has also regularly been told that access to business networks and a lack of mentorship opportunities hold back Indigenous business growth. Indeed, access to equity and capital can be a challenge for Indigenous businesses for several reasons, including the possible physical distance to financial institutions, but also the inability of Indigenous entrepreneurs to use their properties on reserve land as collateral for a loan (under Section 89 of the Indian Act). Access to business networks is eased through provincial and federal governments’ business services. For example, there exist six regional development agencies across Canada with funding programs for businesses and innovators to stimulate regional economic development. Businesses located in remote areas may not have easy access to these programs, although Indigenous businesses do benefit from the support of a number of Indigenous business networks, such as the Canadian Council for Aboriginal Business.
A recognized and important barrier to business growth for Indigenous businesses, especially those located outside of urban centers, is the lack of appropriate and reliable infrastructure, including reliable internet, besides transportation, such as roads and airports, as well as electricity and clean water. Moreover, these infrastructure issues are exacerbated by climate change; certain winter ice roads for trucks can only be used for shorter periods of time each year. Finally, given the aforementioned challenges, specialized and skilled employees are harder to find in remote areas where their financial prospects would generally be, based on historical data, less favourable than for workers closer to the main population.
Social barriers are also considered to be important impediments to business growth for Indigenous persons. For example, lower levels of education attainment and training generally negatively affect an individual's prospects at succeeding in business. Moreover, cases of racial discrimination and a negative perception of Indigenous persons in Canada may prevent Indigenous entrepreneurs from achieving the same level of success as non-Indigenous counterparts in a similar situation. Additionally, an Indigenous person in business would likely have to work in either English or French and thus not in their native language, yet another barrier to growth for Indigenous business people seeking to reach prospective clients. Indeed, 14.5 percent of Indigenous Peoples reported an Indigenous mother tongue in 2011.Footnote 40
Indigenous Exporting SMEs
The Indigenous population is the fastest growing sub-population of Canada. Indigenous people contribute an estimated $30 billion to the national economy annually.Footnote 41 ,Footnote 42 However, data on Indigenous Peoples and their economy is fragmented rendering the development of evidence-supported policies difficult. Moreover, Indigenous-owned SMEs (henceforth Indigenous SMEs) are often assumed to be less successful than their non-Indigenous counterparts; an assumption based in the socio-economic realities of Indigenous persons living in remote areas with access to fewer resources and services. According to the Australian Indigenous Chamber of Commerce, [t]he problem for remote Indigenous communities isn’t remoteness. It’s lack of economic participation by the people who live in them. Social breakdown is inevitable when families don’t participate in the real economy for generations, whether their community has 300 or 3 million people.Footnote 43
Throughout this chapter, analyses are presented within the framework of the modern trade theory, which focuses on both the value of goods and services traded, and the number of firms participating in trade. It assumes that the average production cost decreases with increased output and that firms within an industry differ in terms of their productivity: firms are heterogeneous. Moreover, all businesses are subject to fixed costs and specific investments, such as marketing and distribution, in order to access international markets.Footnote 44 The data suggest that a large proportion of Indigenous SMEs export, whether or not they are highly productive.Footnote 45 Indeed, the findings presented in this report point towards a strong Indigenous business economy, with the median SME in the sample earning between $500,000 and $1 million, and with most businesses reaching large markets. As such, Indigenous business experiences may differ substantially from that of other Canadian businesses. For example, Indigenous export-oriented regions and industries may differ from typical Canadian ones. The following sections provide descriptive analyses of various characteristics of Indigenous SMEs, contextualized with case studies, to identify patterns useful for policy-making and for future research.
I. Destination markets
This section provides an overview of the sales destinations of Indigenous SMEs as well as the decomposition of exports by destination markets. The first notable finding, one that motivated this research, is that a high percentage of Indigenous SMEs sell products and services internationally (24.4 percent), compared to Canadian SMEsFootnote 46 (11.8 percent) and SMEs in other developed economies.Footnote 47
Figure 3 presents the propensity of destination market sales of Indigenous SMEs:
Figure 3 – Destination Markets of Indigenous SMEs’ Sales, 2014
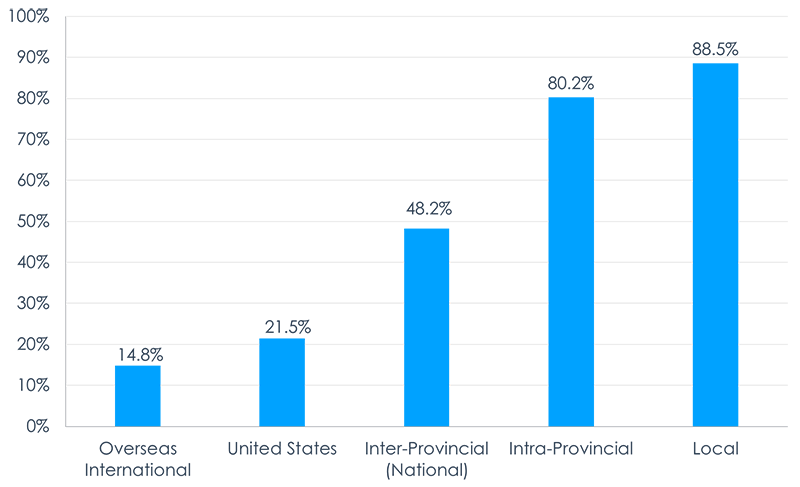
Figure 3 – Text version
Figure 3 – Destination Markets of Indigenous SMEs’ Sales, 2014
| Overseas International | United States | Inter-Provincial (National) | Intra-Provincial | Local | |
|---|---|---|---|---|---|
| Clients | 14.8% | 21.5% | 48.2% | 80.2% | 88.5% |
Source: Office of the Chief Economist, Global Affairs Canada using data obtained from the Canadian Council for Aboriginal Business.
Note: Categories are not mutually exclusive. Respondents could select all that applied, such that a business located in New Brunswick that sold exclusively to its community in the province, clients in Nova Scotia and Maine (U.S.A.) would identify the categories local, inter-provincial (national) and United States.
Source: Office of the Chief Economist, Global Affairs Canada using data obtained from the Canadian Council for Aboriginal Business.
Indigenous SMEs, based on these results, demonstrate a strong ability to access broader markets than non-Indigenous Canadian SMEs. Given the fact that Indigenous communities are typically no larger than 1,000 individuals, it is suspected that Indigenous business strategies may, of necessity, include reaching non-local markets at an early stage.Footnote 48 The additional costs associated with selling throughout the province and nationally are relatively small compared to that of selling to other nearby communities and cities.Footnote 49 As such, Indigenous-owned SMEs, notably First Nations businesses, once operating, would benefit from productivity gains through economies of scale and product specialization as they are forced at an early stage to gain in efficiency and overcome challenges related to remoteness, logistics and connectivity.Footnote 50
Indigenous SMEs’ international activities are much broader than typically assumed. Figure 4 presents the breakdown of exporters by international markets (United States and overseas international exports) of the overall export propensity of 24.4 percent to all international markets:
Figure 4 – Breakdown of Exporters by Export Destination Markets, 2014
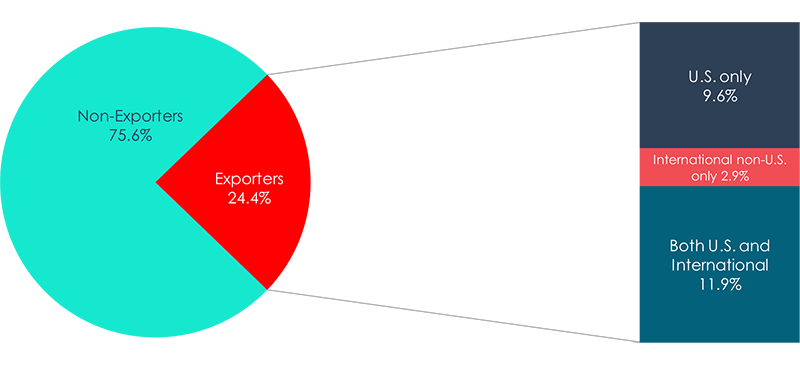
Figure 4 – Text version
Figure 4 – Breakdown of Exporters by Export Destination Markets 2014
| Non-Exporters | 75.6% |
| U.S. only | 9.6% |
| International only | 2.9% |
| Both U.S. and International | 11.9% |
Source: Office of the Chief Economist, Global Affairs Canada using data obtained from the Canadian Council for Aboriginal Business.
Source: Office of the Chief Economist, Global Affairs Canada using data obtained from the Canadian Council for Aboriginal Business.
The most popular destination market of Indigenous exporters, similarly to non-Indigenous Canadian exporters, is the United States. Approximately, 21.5 percent of Indigenous SMEs sell goods or services to our southern neighbour. Less than half of these businesses sell exclusively to the United States, and the other 55.3 percent sell to both the United States and other international markets. The engagement with American markets may reflect, in part, the fact that many First Nations communities are located near the United States-Canada border. For certain communities, exporting to the United States may be easier than selling nationally because of their geographical proximity to the border. However, no evidence was found to signal that Indigenous SMEs that export to the United States are significantly closer to the border than their non-exporting counterparts and non-Indigenous Canadian exporting SMEs. The Indigenous pattern is not much different than that of non-Indigenous businesses, which have long cultivated commercial relations with the familiar and accessible United States market through a common language, similar time zones, and most particularly a shared free trade agreement.
A small proportion of Indigenous SMEs, 2.9 percent, sell internationally without also exporting to the United States. A substantial number of these Indigenous firms are already active in international business, with clear plans to expand their operations. Early in 2019, the Asia Pacific Foundation (APF) hosted a meeting of Indigenous economic development corporations with potential interest in expanding to Asia. The APF discovered that many of the firms were already active in the region or were exploring opportunities for commercial engagement to attract Asian investment and were determined to expand their reach.Footnote 51 From fish sales in the Atlantic to adventure tourism in the Far North, Inuit art retailing, joint ventures with foreign-owned resource companies, environmental services and many other commercial activities, Indigenous business are forging a substantial international presence, with about 14.8 percent reaching international overseas markets.
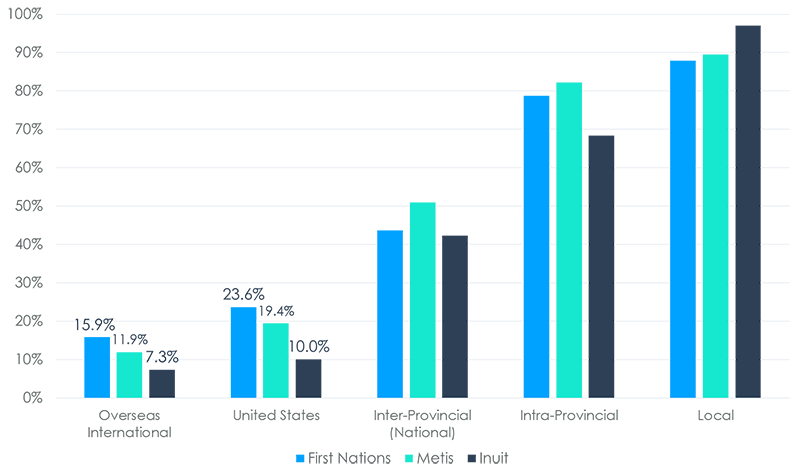
In both categories—U.S. exports and overseas international exports—First Nation SMEs have the highest proportion of internationalization of Indigenous SMEs, closely followed by Métis and finally Inuit SME owners, as can be seen in Figure 5:
Figure 5 – Destination Markets of Indigenous SMEs’ Sales by Indigenous Identity, 2014
Text version
Figure 5 – Destination Markets of Indigenous SMEs’ Sales by Indigenous Identity, 2014
| Markets | First Nations | Metis | Inuit |
|---|---|---|---|
| Overseas International | 15.9% | 11.9% | 7.3% |
| United States | 23.6% | 19.4% | 10.0% |
| Inter-Provincial (National) | 43.7% | 51.0% | 42.4% |
| Intra-Provincial | 78.8% | 82.2% | 68.4% |
| Local | 87.9% | 89.5% | 97.1% |
Source: Office of the Chief Economist, Global Affairs Canada using data obtained from the Canadian Council for Aboriginal Business.
Source: Office of the Chief Economist, Global Affairs Canada using data obtained from the Canadian Council for Aboriginal Business.
Based on the data, First Nation SMEs appear to rely more on their capacity to reach markets outside of Canada than other Indigenous SMEs, whereas Inuit SMEs are understandably more locally active, due largely to their remote location. For example, certain Inuit communities may be completely cut-off from access to resources from the rest of Canada for months at a time. In the case of the Inuit, the long-term success of Arctic Cooperatives and the foundational importance of Inuit artistic industries account for a substantial portion of their international business presence. Nonetheless, all Indigenous SMEs reach foreign markets at a relatively high rate, especially the United States' markets.
II. Business Characteristics
The following sections review selected business characteristics of exporting and non-exporting Indigenous-owned SMEs, including enterprise size, industry of operation, geographical location, and the age of the business.
A. Enterprise Size
This section provides an overview of the export propensity of Indigenous SMEs by business size and Indigenous identity. The export propensity, i.e. the percentage of firms that export, generally increases with business size. This correlation is consistent with the Melitz Model in international trade theory, which states that a firm must meet a certain threshold of productivity to operate and then a higher threshold of productivity to have the ability to export. These thresholds of productivity are derived from the estimated costs and efficiency requirements to operate, and then to overcome challenges related to exporting activities. This model highlights firm decision-making based on productivity heterogeneity.Footnote 52 Understanding the basis for firm decision-making is essential to design business trade policies and agreements which will support Indigenous SMEs’ growth and success.
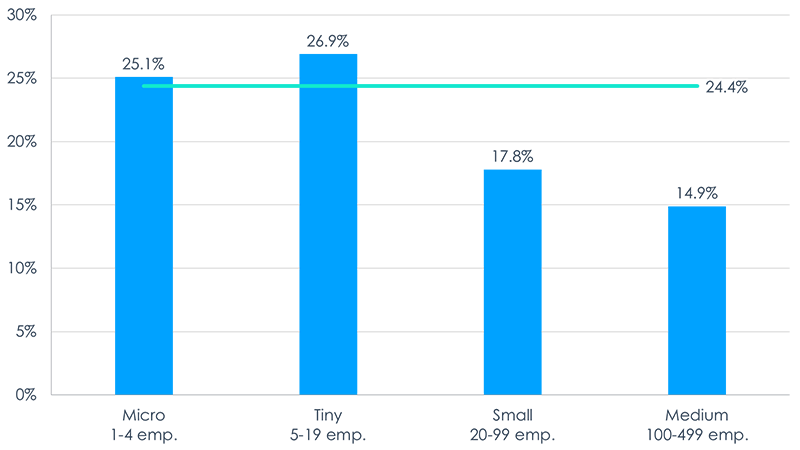
Following the calibration of the sample to the characteristics of self-employed Indigenous persons, the export propensity of Indigenous SMEs by enterprise size is presented in Figure 6:
Figure 6–Export Propensity by Enterprise Size, 2014
Text version
Figure 6 – Export Propensity by Enterprise Size, 2014
| Micro 1-4 emp. | Tiny 5-19 emp. | Small 20-99 emp. | Medium 100-499 emp. | Total | |
| Propensity | 25.1% | 26.9% | 17.8% | 14.9% | 24.4% |
Source: Office of the Chief Economist, Global Affairs Canada using data obtained from the Canadian Council for Aboriginal Business.
Note: The horizontal line represents the Indigenous SME average.
Source: Office of the Chief Economist, Global Affairs Canada using data obtained from the Canadian Council for Aboriginal Business.
Unlike the general Canadian SME population and contrary to economic theory,Footnote 53 which has increasing export propensity with increasing business size by employee count, Indigenous SMEs, based on the CCAB’s 2015 survey, appear to have overall decreasing export propensities with increasing business size.
The lower export propensities of small and medium enterprises (20 to 499 employees) are correlated with their industries of operation, notably construction and natural resource extraction, which are industries less prone to exporting.Footnote 54 Conversely, the high export propensities of micro and tiny enterprises (1 to 19 employees), notably of First Nations on reserve, may be explained by the relatively small local markets where they operate such that growth potential is limited without market expansion. The hypothesis is that business owners would include selling to foreign markets (including the United States) early on in their business strategy compared to non-Indigenous business owners. Moreover, given the nature of certain Indigenous products and business structures, there is a belief that Indigenous artists actively promote the sale of their products collaborating to sell as a group to specific foreign markets through wholesalers.Footnote 55 The global sales of Inuit art—a $64 million industry in 2015Footnote 56 —exemplify this effort. Additionally, it is of growing importance in Asia, where Indigenous-government efforts to promote Canadian cultural industries appear to be bearing fruit. The growing success of Indigenous artists, production personnel, legal and other professionals has likely contributed substantially to this activity, as has the juxtaposition of American travel in Indigenous territories and on-line shopping, which allows firms to engage commercially with current and former visitors.
B. Industry of Operation
This section provides an in-depth analysis of the industries in which Indigenous SMEs operate. According to Statistics Canada, Indigenous entrepreneurs are mainly concentrated in professional, scientific and technical services as well as construction. The following table provides the distribution of exporters and non-exporters per North American Industry Classification System (NAICS) category identifiedFootnote 57 and the propensity to export calculated based on the survey results.
Table 2 - Distribution of Indigenous SMEs by Industry and Export Status, 2014
| Exporters | Non-Exporters | Export Propensity | |
|---|---|---|---|
| 11 – Agriculture, forestry, fishing and hunting | 3.5% | 3.5% | 24.3% |
| 21 – Mining and Oil and Gas Extraction | 5.6% | 8.1% | 18.2% |
| 23 – Construction | 3.9% | 36.0% | 3.4% |
| 31-33 – Manufacturing | 14.4% | 4.6% | 50.1% |
| 41 – Wholesale Trade | 2.4% | 2.3% | 25.5% |
| 44 – Retail Trade | 17.2% | 12.1% | 31.4% |
| 48 – Transportation and Warehousing | 6.7% | 8.5% | 20.3% |
| 51 – Information and Cultural Industries (e.g. publishing, broadcasting, Internet) | 2.6% | 2.1% | 28.4% |
| 53 – Real Estate and Rental and Leasing | 4.3% | 1.4% | 49.2% |
| 54 – Professional, Scientific and Technical Services (e.g. legal, accounting, advertising, consulting) *excluding general consulting | 13.5% | 9.1% | 32.4% |
| 56 – Administrative and Support, Waste Management and Remediation Services | 0.0% | 1.3% | 0.0% |
| 71 – Arts, Entertainment and Recreation | 5.8% | 0.8% | 69.0% |
| 72 – Accommodation and Food Services | 7.6% | 1.8% | 57.8% |
| 81 – Other Services | 8.5% | 8.1% | 25.2% |
| 98 – Consulting (general) | 4.0% | 0.3% | 83.8% |
| Total | 100.0% | 100.0% | 24.4% |
Note: Consulting (general), identified as NAICS 98 should be rolled into NAICS 54, in which case
the export propensity would be 37.7 percent.
Source: Office of the Chief Economist, Global Affairs Canada using data obtained from the
Canadian Council for Aboriginal Business.
An export-intensive industry, as defined by the Conference Board of Canada, is an industry in which exports comprise at least 40 percent of revenues, such as manufacturing; and agriculture, fishing, hunting and trapping. Similarly, an export-oriented industry is an industry in which 50 percent or more of the business’ revenues is derived from exports, such as mining and quarrying; manufacturing; and oils and gas extraction.Footnote 58 The CCAB data does not include information on revenues generated from exports, but a comparison can be drawn using the export propensities from Table 2.Footnote 59
Numerous industries have high export propensities, notably:
- Arts, entertainment and recreation (NAICS 71) with an export propensity of 69.0 percent;
- Accommodation and food services (NAICS 72) with an export propensity of 57.8 percent;
- Manufacturing (NAICS 31-33) with an export propensity of 50.1 percent;
- Real estate and rental and leasing (NAICS 53) with an export propensity of 49.2 percent; and
- Professional, scientific and technical services, including general consulting (NAICS 54 and 98): 37.7 percent.
In the Indigenous Business Directory, the largest proportion (32.8 percent) of Indigenous exporters operates in the professional, scientific and technical services industry, the industry with the fifth highest export propensity.Footnote 60 According to the CCAB data, 17.5 percent of exporters operate in the professional, scientific and technical services industry (NAICS 54, including NAICS 98).Footnote 61 The following two industries with the next highest proportion of exporters are retail trade (NAICS 44) with 17.2 percent of exporters and manufacturing (NAICS 31-33) with 14.4 percent of exporters. Retail trade is not typically an industry with a high proportion of exporters, and hence the low export propensity. However, several Indigenous organizations, including the CCAB, have identified that the uniqueness of Indigenous arts and crafts products has a substantial international appeal. Moreover, on reserve and off reserve analysis of the distribution of exporters, presented in Figure 7, provides additional information to explain the high export propensity of retail trade SMEs.
Figure 7 – Distribution Indigenous Exporters Living On and Off Reserve
by Industry, 2014

Figure 7 – Text version
Figure 7 – Distribution Indigenous Exporters Living On and Off Reserve by Industry (%), 2014
| Industry | Exporters On-Reserve | Exporters Off-Reserve |
|---|---|---|
| Agriculture, Forestry, Fishing, and Hunting | 4.5% | 2.7% |
| Mining and Oil and Gas Extraction | 2.0% | 7.9% |
| Construction | 5.4% | 3.2% |
| Manufacturing | 16.3% | 14.8% |
| Wholesale Trade | 2.5% | 2.7% |
| Retail Trade | 27.2% | 13.2% |
| Transportation and Warehousing | 1.7% | 11.8% |
| Information and Cultural Industries | 4.0% | 3.5% |
| Real Estate and Rental and Leasing | 13.3% | 5.0% |
| Professional, Scientific and Technical Services | 5.2% | 11.0% |
| Administration and Support | 0.0 % | 0.00% |
| Arts, Entertainment and Recreation | 5.2% | 6.9% |
| Accommodation and Food Services | 3.5% | 4.6% |
| Other Services | 10.9% | 8.0% |
| Consulting (general) | 3.4% | 4.9% |
Source: Office of the Chief Economist, Global Affairs Canada using data obtained from the Canadian Council for Aboriginal Business.
Source: Office of the Chief Economist, Global Affairs Canada using data obtained from the Canadian Council for Aboriginal Business.
Most retail trade (NAICS 44) exporters are First Nation businesses located on reserve. A higher share of exporters in manufacturing (NAICS 31-33) are also located on reserve, similarly to exporters in “other services” (NAICS 81); and agriculture, forestry, fishing and hunting industry (NAICS 11). However, a higher share of the mining and oil and gas extraction SMEs are located off reserve. Although Indigenous reserves might have the resources to prosper in mining and natural resource extraction, the reality is that only a small number of reserves have resource operations in proximity to the communities. Many Indigenous peoples and companies working with the mining sector, for example, work at a distance, with major operations based in regional centres. In the past, the large upfront investments necessary to enter the mining business would act as a barrier to entry for many prospective Indigenous business owners on reserve since they have no land ownership rights under the Indian Act to use as collateral. The emergence of Aboriginal Economic Development CorporationsFootnote 62 and more favourable attitudes in the banking sector have addressed some of the capital flow issues. Moreover, producers of commodities must act as price takers and if Indigenous producers cannot reach certain productivity gains because of lack of infrastructure and remoteness, they may not enter that specific industry, or, at least, entry levels may be lower.
Figure 8 presents the industry of operation of Indigenous SMEs by Indigenous identity.
Figure 8 – Distribution of Indigenous SMEs by Industry and Indigenous Identity, 2014

Figure 8 – Text version
Figure 8 –Distribution of Indigenous SMEs by Industry and Indigenous Identity (%), 2014
| Industry | First Nations | Metis | Inuit |
|---|---|---|---|
| Agriculture, Forestry, Fishing and Hunting | 4.4% | 2.1% | 5.8% |
| Mining, Oil & Gas Extraction | 4.5% | 11.0% | 6.1% |
| Construction | 26.1% | 31.6% | 32.9% |
| Manufacturing | 6.3% | 8.2% | 5.6% |
| Wholesale Trade | 1.1% | 3.7% | 0.0% |
| Retail Trade | 18.0% | 9.3% | 7.5% |
| Transportation and Warehousing | 9.6% | 5.7% | 14.4% |
| Information and cultural industries | 2.7% | 1.8% | 3.9% |
| Real estate and rental and leasing | 1.7% | 2.5% | 6.1% |
| Professional, scientific and technical services | 10.1% | 9.7% | 5.7% |
| Administration and Support | 1.2% | 0.9% | 2.0% |
| Arts, entertainment and recreation | 3.1% | 1.3% | 0.2% |
| Accommodation and food services | 2.7% | 2.1% | 1.0% |
| Other Services | 7.5% | 8.7% | 8.8% |
| Consulting (general) | 1.0% | 1.4% | 0.0% |
Source: Office of the Chief Economist, Global Affairs Canada using data obtained from the Canadian Council for Aboriginal Business.
Source: Office of the Chief Economist, Global Affairs Canada using data obtained from the Canadian Council for Aboriginal Business.
First Nation SME owners have a higher share of firms in the retail trade industry. First Nation SMEs and Métis SMEs also compose approximately 90.0 percent of Indigenous SMEs in professional, scientific and technical services. Métis also compose the most prominent group of businesses owners operating in the mining and oil and gas extraction industry (just under 70 percent) as well as wholesale trade industry (nearly 80 percent).
All Indigenous identities have a significant proportion of businesses in the construction industry, with a portion of this work in recent years associated with government-funded housing and related projects on reserves and in remote communities. Inuit SMEs operate in the transportation and warehousing industry (NAICS 48) at a proportionally significantly higher rate than their counterparts.
C. Geography
This section presents a geographical analysis of Indigenous SMEs. In Canada, a strong positive correlation exists between the industry of operation of a business and its geographical location, largely due to variations in the availability, abundance and types of resources across Canada. In 2016, a large proportion of Indigenous Peoples were located in Ontario (22.4 percent), British Columbia (16.2 percent) and Alberta (15.5 percent).Footnote 63 Based on the 2016 Census of Statistics Canada, 23.1 percent of Indigenous entrepreneurs were found in Ontario, followed by 20.6 percent in British Columbia.Footnote 64
Figure 9 presents the distribution of Indigenous exporters across Canada based on respondents’ self-reported exporting activity. Nearly one third are concentrated in Ontario (31.5 percent), over a fifth are located in British Columbia (22.8 percent), approximately one eight are in Quebec (12.5 percent) and Alberta (12.3 percent) respectively, and the remainder are distributed across the Atlantic provinces (7.9 percent), Saskatchewan (6.1 percent), Manitoba (4.9 percent) and the Territories (1.8 percent).
Figure 9 – Distribution of Indigenous Exporters, 2014
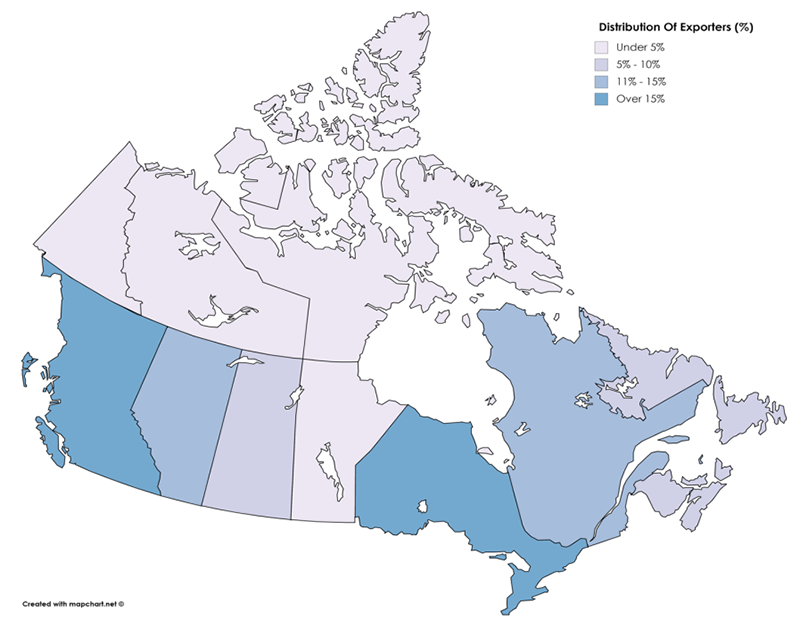
Figure 9 – Text version
Figure 9 - Distribution of Indigenous Exporters, 2014
| Province / Region | Distribution of Exporters |
|---|---|
| British Columbia | 22.8% |
| Alberta | 12.3% |
| Saskatchewan | 6.2% |
| Manitoba | 4.9% |
| Ontario | 31.5% |
| Quebec | 12.5% |
| Atlantic Provinces | 7.9% |
| Territories | 1.8% |
Source: Office of the Chief Economist, Global Affairs Canada using data obtained from the Canadian Council for Aboriginal Business.
Source: Office of the Chief Economist, Global Affairs Canada using data obtained from the Canadian Council for Aboriginal Business.
According to the data, provinces with the largest proportion of exporters also have amongst the highest export propensities as illustrated in Figure 10:
Figure 10 – Export Propensity of Indigenous SMEs by Canadian Province and Region, 2014
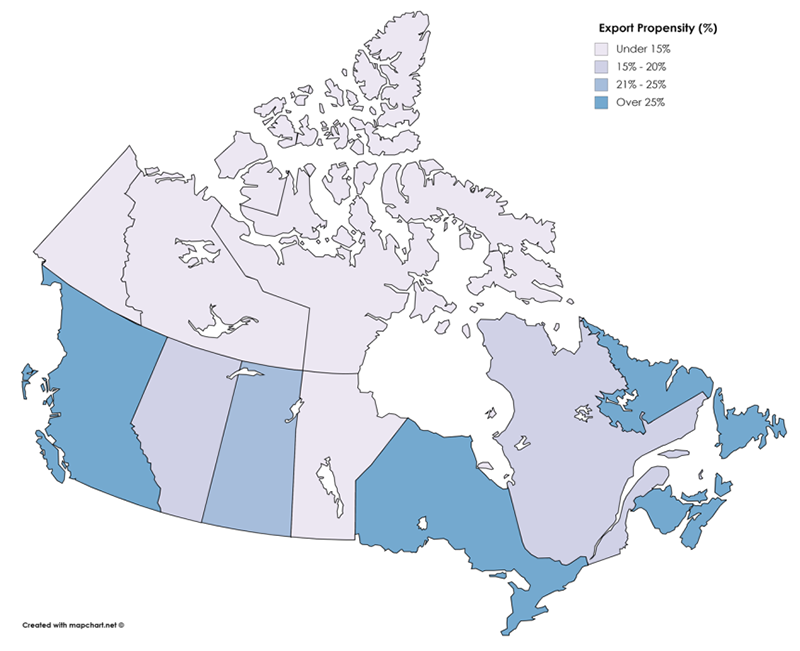
Figure 10 – Text version
Figure 10 - Export Propensity of Indigenous SMEs by province/territory, 2014
| Province / Region | Export Propensity |
|---|---|
| Territories | 12.4% |
| British Columbia | 31.8% |
| Alberta | 15.1% |
| Saskatchewan | 22.8% |
| Manitoba | 10.0% |
| Ontario | 41.3% |
| Quebec | 19.6% |
| Atlantic Provinces | 31.1% |
Source: Office of the Chief Economist, Global Affairs Canada using data obtained from the Canadian Council for Aboriginal Business.
Source: Office of the Chief Economist, Global Affairs Canada using data obtained from the Canadian Council for Aboriginal Business.
The export propensity by province and territory presents the provincesFootnote 65 in which there is a greater proportion of exporters among the provincial or territorial SME population. It is expected that the geographical export propensities are strongly correlated with the presence of export-oriented industries as well as the Indigenous identity of the owner (refer to sections ii.b and iii.a), notably the number of on reserve First Nation communities, which are found to export at an above-average rate. Nonetheless, Indigenous SMEs in the Atlantic Provinces exhibit the third highest export propensity (31.1 percent) although they hold the smallest proportion of Indigenous entrepreneurs of all the provinces (6.9 percent), a reflection of their growing presence in the international fishing industry.
Table 3 presents the five main industries in which Indigenous SMEs operate by geographic region:
Table 3 – Export Propensity and Five Main Industries by Canadian Province and Region, 2014
| Region | Export Propensity | Five Main Industries |
|---|---|---|
| Ontario | 41.3 % | Retail trade; Professional, scientific and technical services; Construction; Other services; Manufacturing |
| British Columbia | 31.8 % | Construction; Transportation and warehousing; Professional, scientific and technical services; Manufacturing; Other services |
| Atlantic Provinces | 31.1 % | Retail trade; Construction; Accommodation and food services; Other services; Professional, scientific and technical services |
| Saskatchewan | 22.9 % | Construction; Retail trade; Manufacturing; Professional, scientific and technical services; Transportation and warehousing |
| Quebec | 19.6 % | Construction; Retail trade; Transportation and warehousing; Professional, scientific and technical services; Agriculture, forestry, fishing and hunting; |
| Alberta | 15.1 % | Mining and oil and gas extraction; Construction; Other services; Professional, scientific and technical services; Transportation and warehousing |
| Territories | 12.4 % | Construction; Transportation and warehousing; Professional, scientific and technical services; Manufacturing; Other services |
| Manitoba | 10.0 % | Construction; Manufacturing; Retail trade; Professional, scientific and technical services; Transportation and warehousing |
Source: Office of the Chief Economist, Global Affairs Canada using data obtained from the Canadian Council for Aboriginal Business.
Indigenous SMEs located in Ontario have the highest propensity with over 4 in 10 businesses exporting. Indeed, three of the five main industries in which Indigenous SMEs operate in Ontario have export propensities above 30.0 percent (refer to Table 2). In general, the average export propensity of a province is highly correlated with its main industries, as well as the main destination market of exporters. In each province, over 90.0 percent of exporters reach the United States, except for British Columbia (83.4 percent) and Quebec (58.8 percent). Understandably, Indigenous exporters from British Columbia have direct ocean access to Asia through two of Canada’s largest ports, which may explain the lower rate of exporters to the United States. As for Quebec, in the lead in terms of geographic diversificationFootnote 66 of exports, the province enjoys direct sea access to over 100 countries through one of Canada’s largest container ports and cruise ship destination.Footnote 67 The province of Quebec may also have a lower export propensity towards the United States because of the French language.
Manitoba has the lowest export propensity of all provinces and Territories even though four of its main five industries have on average 1 in 4 businesses exporting. However, according to the data, around 60.0 percent of SMEs in Manitoba are categorized in the construction industry, thus substantially bringing down the province’s proportion of exporters. Omitting NAICS 23 (construction industry) from the sample, Manitoba would have an export propensity of 25.2 percent.
D. Age of Business
There is no agreement among scholars as to the impact of the age of a business on its growth and potential to export. Nonetheless, since an owner’s managerial experience is positively correlated with exporting activities, one could expect to find a similar positive correlation. The overall trend depicted in Figure 11 illustrates that with time, Indigenous SMEs appear to gain the experience that is useful to export:
Figure 11 – Distribution of Exporting and Non-Exporting Indigenous SMEs
by Business Age, 2014

Figure 11 - Text version
Figure 11 - Distribution of Indigenous Exporters and Non-Exporters by Business Age Group
| Number of years | Export | Do not export |
|---|---|---|
| 1-5 years | 3.0% | 6.4% |
| 6-10 years | 20.3% | 23.5% |
| 11-15 years | 21.3% | 22.8% |
| 16-20 years | 13.7% | 14.3% |
| 21-25 years | 11.2% | 12.3% |
| 26-30 years | 12.3% | 8.1% |
| 31-35 years | 4.5% | 3.9% |
| 36-40 years | 2.6% | 3.7% |
| 41-45 years | 3.3% | 1.9% |
| 46-50 years | 1.6% | 0.4% |
| 51-55 years | 1.9% | 1.6% |
| 56-60 years | 0.7% | 0.0% |
| 60+ years | 3.6% | 1.2% |
Source: Office of the Chief Economist, Global Affairs Canada using data obtained from the Canadian Council for Aboriginal Business.
Source: Office of the Chief Economist, Global Affairs Canada using data obtained from the Canadian Council for Aboriginal Business.
The distributions depict that among younger businesses, a greater proportion of Indigenous-owned SMEs do not export compared to businesses with at least 25 years of experience. Indeed, around 10 years, fewer businesses export, while a small spike is noticeable for exporters around 30 years. Based on the data, this relationship shifts slightly over time, but the overall trend remains.
Generally, the age of business is also positively correlated with business size which is an important determinant of exporting for SMEs. However, as previously mentioned, Indigenous-owned exporters appear to have a negative correlation with business size. As such, it is likely that Indigenous SMEs lack the ability to increase in employment size due to specific barriers to growth or they can gain in productivity over time without necessarily growing in size in order to export. This could be a business strategy which circumvents hiring difficulties in specific industries.
III. Owner’s Characteristics
These sections review selected business owner characteristics of exporting and non-exporting Indigenous owned SMEs, including Indigenous identity, educational attainment, managerial experience, and the use of a business plan.
A. Indigenous Identity
The high export propensity of micro and tiny enterprises is highly correlated with the Indigenous identity of the business owners. First Nations ownership significantly increases the average export propensity of Indigenous SMEs, as demonstrated in Figure 12:
Figure 12 – Export Propensity by Indigenous Identity, 2014
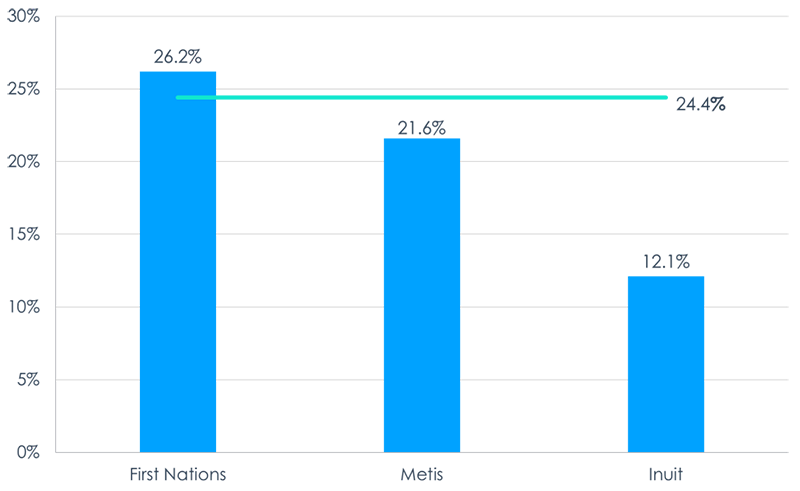
Figure 12 – Text version
Figure 12 – Export Propensity of Indigenous SMEs by Indigenous Identity
| First Nations | Metis | Inuit | |
|---|---|---|---|
| Exported | 26.2% | 21.6% | 12.1% |
| Average all Indigenous SMEs | 24.4% | 24.4% | 24.4% |
Source: Office of the Chief Economist, Global Affairs Canada using data obtained from the Canadian Council for Aboriginal Business.
Note: The horizontal line represents the Indigenous SME average.
Source: Office of the Chief Economist, Global Affairs Canada using data obtained from the Canadian Council for Aboriginal Business.
Indigenous Peoples cannot be considered as one homogeneous group for the purpose of policy-making. First Nations SMEs represent 50.4 percent of Indigenous exporters, Métis 42.3 percent, Inuit 1.3 percent, and mixed identities 5.9 percent of exporters. Indigenous SMEs located on reserve export at a rate of 26.7 percent according to the data, whereas Indigenous SMEs located off reserve export at a rate of 22.0 percent, which is closer to the rate of export of Métis SMEs.
There are several possible explanations for these patterns. First Nations-owned SMEs are active in artistic and cultural retail sales and appear to be growing this aspect of business operations. As discussed for smaller SMEs, First Nation businesses may have an export-oriented strategy early on in their development in order to access markets with growth potential, which is limited in their home communities. This may be particularly true for businesses supplying goods or services of little consumer interest in their local community. In other words, limited First Nations' economies force many Indigenous SMEs, from the outset, to focus on external opportunities.
B. Level of Education
This section provides an overview of Indigenous SME owners’ level of education, which is known to have a strong impact on the performance and internationalization of SMEs. According to a recent study the positive correlation between the education level of business owners and their business exporting activities has long been documented.Footnote 68
Figure 13 indicates that Indigenous SMEs in Canada follow national and international trends in this matter, except for a slight difference for owners that have completed at most their elementary education.
Figure 13 - Owners' Level Education of Exporting and Non-Exporting Indigenous SMEs, 2014

Figure 13 - Text version
Figure 13 – Indigenous SME Owners’ Level of Education by Export Status, 2014
| Level of Education | Exporters | Non-Exporters |
|---|---|---|
| Elementary | 3.8% | 3.1% |
| High School | 26.5% | 35.7% |
| Community college, vocational, trade school or CEGEP | 28.5% | 34.9% |
| University | 25.3% | 17.7% |
| Post graduate/professional school | 15.1% | 8.2% |
Source: Office of the Chief Economist, Global Affairs Canada using data obtained from the Canadian Council for Aboriginal Business.
Note: Each category includes business owners with partial and full completion of the level of education.
Source: Office of the Chief Economist, Global Affairs Canada using data obtained from the Canadian Council for Aboriginal Business.
A positive correlation exists between the level of education attained and the export performance of businesses. That is, when an owner has a higher level of education, his or her business is more likely to export. They are more likely to have the human capital needed to surmount the additional obstacles involved with exporting. Indigenous SMEs are similar to non-Indigenous SMEs in this respect with a greater proportion exporting when the business owner has completed at least some university. Nonetheless, nearly one third of Indigenous SME exporters hold no more than a high school diploma.
C. Owner’s Managerial Experience
This section presents the findings on Indigenous SME owners’ management experience which generally signals an owner’s skills and knowledge. An owner with more managerial experience could have an enhanced understanding of growth strategies and foreign markets leading to a higher likelihood of exporting. Owner’s management experience is measured as the number of years the Indigenous SME owner has been a business owner. This trait is positively correlated with export propensity as can be seen in Figure 14. The outer ring represents the distribution, in years of experience, of non-exporting Indigenous SMEs, and in the inner ring, the distribution of Indigenous SME exporters.
Figure 14 – Indigenous Owner’s Managerial Experience by Export Status, 2014
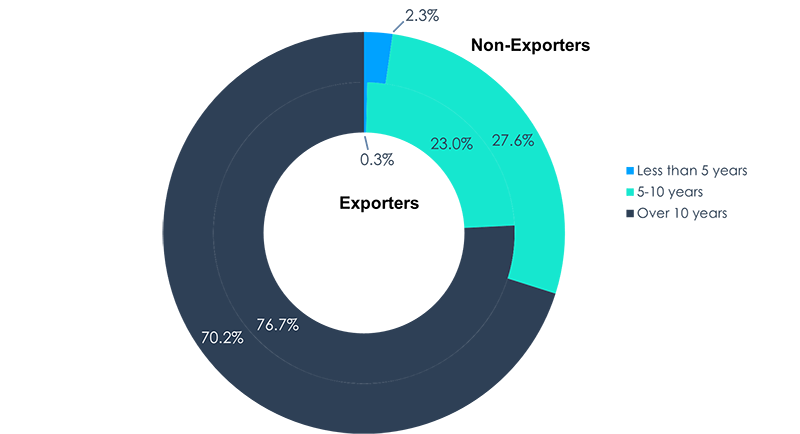
Figure 14 –Text version
Figure 14 Indigenous SME Owners’ Managerial Experience by Export Status, 2014
| Number of years | Exporters | Non-Exporters |
|---|---|---|
| Less than 5 years | 0.3% | 2.3% |
| 5-10 years | 23.0% | 27.6% |
| Over 10 years | 76.7% | 70.2% |
Source: Office of the Chief Economist, Global Affairs Canada using data obtained from the Canadian Council for Aboriginal Business.
Source: Office of the Chief Economist, Global Affairs Canada using data obtained from the Canadian Council for Aboriginal Business.
Indigenous SMEs whose owner has over 10 years of management experience are more likely to export; business owners with less than five years of experience are much less likely to export. While many Indigenous SMEs may have a geographic competitive advantage in reaching foreign markets such as the United States, this finding supports that, like education, additional experience may produce a stronger understanding of growth opportunities, of which exporting would be an option. Lastly, this evidence suggests that Indigenous SMEs are likely not “born-global”.
D. Business Plan
The use of a business plan is also positively correlated with the growth and potential to export of a business. A formal business plan is a useful tool for business owners as it provides direction with defined objectives and helps evaluate progress over a long period of time. However, as seen in Table 4, less than 40 percent of Indigenous SMEs have a written business plan.Footnote 69
Table 4 - Proportion of SMEs with and without a Business Plan by Export Status, 2014
| Exporter | Non-Exporters | All SMEs | |
|---|---|---|---|
| Written business plan | 43.8% | 36.2% | 38.0% |
| No business plan | 56.2% | 63.8% | 62.0% |
| Total | 100.0% | 100.0% | 100.0% |
Source: Office of the Chief Economist, Global Affairs Canada using data obtained from the Canadian Council for Aboriginal Business.
In line with entrepreneurship theory, Indigenous SMEs with a written business plan are somewhat more likely to export than those without a business plan. Moreover, having a business plan is often a requirement to obtain financing from a financial institution or business support from a government program. Figure 15 presents the distributions of exporters and non-exporters with a business plan and the frequency with which they refer to their business plan to monitor how well they are meeting their commercial objectives.
Figure 15 – Frequency of Use of a Business Plan by Export Status, 2014

Figure 15 – Text version
Figure 15 – Indigenous SME Owners’ Frequency Use of a Business Plan by Export Status, 2014
| Frequency | Exporters | Non-Exporters |
|---|---|---|
| Weekly | 9.2% | 5.7% |
| Monthly | 28.6% | 26.2% |
| Quarterly | 25.6% | 34.9% |
| Annually | 17.8% | 22.0% |
| Less often than annually | 18.8% | 10.4% |
Source: Office of the Chief Economist, Global Affairs Canada using data obtained from the Canadian Council for Aboriginal Business.
Source: Office of the Chief Economist, Global Affairs Canada using data obtained from the Canadian Council for Aboriginal Business.
Exporters tend to consult their business plan at a higher frequency than non-exporters, especially those referring to the plans on a weekly and monthly basis. However, a higher proportion of exporters do not consult their business plan at least annually compared to non-exporters. This finding differs from general entrepreneurship theory and points again towards a systematic difference in business operation between Indigenous and non-Indigenous business owners. One could suppose that some Indigenous business owners mainly have their business plan to meet certain requirements, such as a financial application.
Nearly half (45.9 percent) of the business owners that do not have a business plan believe they do not need one or that it is not important to have a business plan. A total of 16.0 percent of business owners do not have a business plan because they claim they are too busy to write one. Another 9.9 percent did not provide a reason for not having one. Finally, 5.3 percent of Indigenous business owners reported having had a business plan in the past, but do not anymore.
IV. Obstacles to Growth
This section reviews the obstacles to growth of Indigenous owned SMEs based on the data of the CCAB 2015 survey. Obstacles to growth are presented by export status as well as by destination market and Indigenous identity. Indigenous businesses in Canada reported facing barriers to growth, including access to investment capital, business and professional capacity, the locational disadvantage of working on-reserve, high community demands on Indigenous business leaders, small local market size, and a series of infrastructure disadvantages. The infrastructure disadvantages encompass localized Indigenous poverty, high costs of transportation, weak or non-existent Internet, inconsistent and expensive electrical supplies, poor levels of education and training among the local population.Footnote 70 Indigenous entrepreneurship is believed to have a holistic approach where community support. local job creation, and Indigenous socio-cultural development are important business considerations.Footnote 71 Although this may not be the case for all Indigenous businesses, a number of initiatives are known to continuously operate at a loss or at a minimal financial return because the alternative would be to not have access to essential services. This is true for many community-owned or cooperative retail operations, service ventures including casinos, and local construction operations. For example, in the Albertan oil sands, businesses such as the Tuccaro Group of companies and the Bouchier Group have achieved success by supporting regional energy development. Similarly, the Aboriginal Economic Development Corporations: Fort Mackay Group of companies and ACDEN are important drivers of economic development for their communities.
Figure 16 presents the obstacles to growth rated important and highly important by Indigenous SMES separated by export status.
Figure 16 – Reported Important and Highly Important Obstacles to Growth by Export Status, 2014

Figure 16 – Text version
Figure 16 – Reported Important & Highly Important Obstacles to Growth, 2014
| Obstacles | Exporters | Non-Exporters |
|---|---|---|
| Access to financing | 39.0% | 30.7% |
| Access to equity or capital | 42.6% | 32.4% |
| Attracting employees with the right skills or qualifications | 40.8% | 38.4% |
| Access to support for employee training and skills development | 20.5% | 23.0% |
| Retaining valued employees | 34.2% | 31.0% |
| Competition | 18.7% | 36.9% |
| Cost of doing business | 32.4% | 34.8% |
| Overall economic conditions | 34.2% | 42.0% |
| Government policy, rules and regulation | 33.5% | 32.9% |
| Reliable Internet, telephone and other IT technologies | 27.7% | 22.9% |
| Other infrastructure such as electricity, water and roads | 25.0% | 22.1% |
Source: Office of the Chief Economist, Global Affairs Canada using data obtained from the Canadian Council for Aboriginal Business.
Source: Office of the Chief Economist, Global Affairs Canada using data obtained from the Canadian Council for Aboriginal Business.
Based on the results; access to financing, equity or capital are more often reported as important or highly important obstacles to growth for exporting Indigenous SMEs. Access to financing and equity or capital is also known to be particularly difficult for individuals living on reserve since their property cannot be used as collateral for loans. Moreover, access to financing is one of the most recognized barriers to exporting for SMEs, Indigenous and non-Indigenous alike. Indigenous exporting SMEs also report at a higher rate as important and highly important than their non-exporting counterparts such obstacles to growth such as reliable internet, telephone and other information (IT) technologies, and other infrastructure such as electricity, water and roads. This may be the case since exporters, as they reach clients located further away, increasingly rely on modes of communications and transportation for their businesses, than those who serve local clients.
In line with entrepreneurial and economic theory, exporting Indigenous SMEs appear to be more competitive than their non-exporting counterparts as they report that competition and the overall economic conditions are important or highly important obstacle to growth at lower frequencies than Indigenous SMEs serving domestic markets.
Figure 17 presents the same obstacles to growth by destination market:
Figure 17– Reported Important and Highly Important Obstacles to Growth by Sales’ Destination, 2014

Figure 17– Text version
Figure 17 - Obstacles to Growth by Destination Market
| Obstacles | United States | International | Canada | Provincial | Local |
|---|---|---|---|---|---|
| Access to financing | 41.1% | 44.0% | 35.9% | 34.0% | 32.2% |
| Access to equity or capital | 44.9% | 41.7% | 37.7% | 36.6% | 34.0% |
| Attracting employees with the right skills or qualifications | 43.8% | 42.1% | 42.8% | 40.7% | 40.5% |
| Access to support for employee training and skills development | 20.5% | 20.9% | 25.4% | 23.7% | 21.9% |
| Retaining valued employees | 35.9% | 36.8% | 32.4% | 31.4% | 31.9% |
| Competition | 17.2% | 20.9% | 31.9% | 30.7% | 30.8% |
| Cost of doing business | 36.7% | 35.7% | 36.0% | 35.2% | 34.3% |
| Overall economic conditions | 35.7% | 34.0% | 42.0% | 40.0% | 39.8% |
| Government policy, rules and regulation | 34.9% | 31.0% | 37.9% | 34.1% | 32.5% |
| Reliable Internet, telephone and other IT technologies | 27.4% | 32.6% | 27.9% | 23.6% | 24.5% |
| Other infrastructure such as electricity, water and roads | 25.1% | 29.1% | 24.5% | 22.3% | 22.9% |
Source: Office of the Chief Economist, Global Affairs Canada using data obtained from the Canadian Council for Aboriginal Business.
Source: Office of the Chief Economist, Global Affairs Canada using data obtained from the Canadian Council for Aboriginal Business.
Indigenous SMEs with exports to countries other than the U.S. report reliable internet, telephone and other IT technologies and other infrastructure such as electricity, water and roads as important or highly important obstacles to growth at a higher rate than their counterparts. One possible explanation for this is that a fair share of Indigenous SMEs exports to the United States may be carried out through consumption abroad, i.e. Americans travelling to Canada or the presence of an Indigenous Canadian in the United States. Proximity would reduce the reliance of these SMEs on reliable internet and other IT infrastructure.
Access to financing is an important determinant of growth potential for a business as the firm must overcome initial fixed costs to start a business or to expand operations whether nationally or internationally. Unlike other Indigenous persons and Canadians, most First Nations are subject to land management rules under the Indian Act rendering them "capital poor." The Indian Act, which governs most First Nations communities, defines primary property rights for First Nations in such a way that it either prevents the use of land as collateral against a loan or creates uncertainty, thus impeding economic activity developments:
- Customary or traditional rights provide the band chief and council with authority over reserve lands in full, such that a band member never has true and complete security of tenure as there is always a possibility of eviction (Section 60(1) and (2)); and
- Certificates of possession are the legal proof that a property on reserve is in the possession of a band member. These can only be exchanged between band members and are protected against seizure. As such their use for collateral is limited (Section 40).
Finally, exporting Indigenous SMEs reported less problems with accessing support for employee training, but have more difficulty with retaining valued employees than their non-exporting counterparts. Overall, Canadian exporting SMEs similarly report employee retention as an issue of greater importance than non-exporting SMEs. Additional specific challenges of Indigenous SMEs, according to reports from CCAB members, include intellectual property (I.P.) issues. IP issues are an important concern internationally. Since 1995, 153 countries have signed the Trade-Related Aspects of Intellectual Property Rights (TRIPS) of the World Trade Organization (WTO). Nonetheless, the speed at which new technologies emerge makes intellectual property issues a difficult field to navigate for many, including Indigenous SMEs. While I.P. issues were not included in the 2015 National Aboriginal Business Survey, additional information will be sought in a future iteration. Particularly, Indigenous SMEs are seeking to protect their cultural art patterns from low cost foreign replication.
V. Internet and Social Media
Remoteness is an important characteristic of many Indigenous communities and settlements. This isolation affects individuals’ access to services, such as Internet, electricity and banking services, as well as their transportation opportunities. Some communities may be physically accessible only three weeks in an entire year. Moreover, climate change exacerbates these issues in the North by thawing the permafrost and melting ice highways sooner, thus shortening the length of time road travel is accessible and safe. That said, based on the 2015 survey, access to internet does not significantly vary across SMEs based on their destination markets (whether they export, sell locally or nationally). As shown in Figure 18, Indigenous SMEs reported having fairly high levels of access to the internet, between 88.8 percent and 94.3 percent.
Figure 18 – Access to Internet based on the Sales’ Destinations, 2014
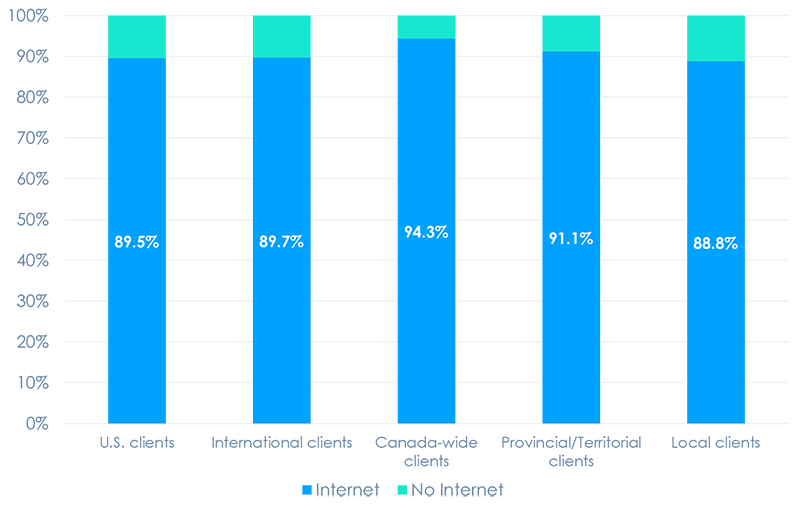
Figure 18 – Text version
Figure 18 – Indigenous SME’s Access to Internet based on the Sales’ Destinations, 2014
| Sales’ Destination | Internet | No Internet |
|---|---|---|
| U.S. clients | 89.5% | 10.5% |
| International clients | 89.7% | 10.4% |
| Canada-wide clients | 94.3% | 5.7% |
| Provincial/Territorial clients | 91.1% | 8.9% |
| Local clients | 88.8% | 11.2% |
Source: Office of the Chief Economist using data obtained from the Canadian Council for Aboriginal Business.
Source: Office of the Chief Economist using data obtained from the Canadian Council for Aboriginal Business.
As such, there does not appear to be a correlation between connectivity and destination markets. This could be due to survey design, but it is also possible that having access to internet is a very broad concept, which covers access to high speed internet as much as dial-up. Moreover, Indigenous business owners may collectively strategically sell to a foreign market, which would explain the lack of connectivity of certain exporters. This is the case, for example, with Inuit carvers and print-makers, who rarely work directly with consumers or even overseas clients, but rather through secondary art dealers.Footnote 72
New communication technologies nonetheless feature prominently in Indigenous SME operations. Approximately 54.0 percent of Indigenous SMEs use a form of social media and the online presence of Indigenous SMEs appears to have some explanatory power over their export activity as illustrated by Figure 19:
Figure 19 – Distribution of Exporting and Non-Exporting Indigenous SMEs according to the number of social media tools used, 2014

Figure 19 – Text version
Figure 19 – Distribution of Exporting and Non-Exporting Indigenous SMEs according to the number of social media tools used, 2014
| Number of social media tools used | Exporters | Non-Exporters |
|---|---|---|
| 0 | 30.6% | 51.0% |
| 1 | 28.4% | 23.8% |
| 2 | 20.0% | 12.6% |
| 3 | 13.4% | 8.3% |
| 4 | 5.5% | 2.5% |
| 5 | 0.7% | 1.1% |
| 6+ | 1.4% | 0.7% |
Source: Office of the Chief Economist using data obtained from the Canadian Council for Aboriginal Business.
Source: Office of the Chief Economist using data obtained from the Canadian Council for Aboriginal Business.
The data from the survey shows that over half of Indigenous non-exporters do not use any social media, whereas nearly 7 in 10 exporters have an online presence. Indigenous SMEs which use between one and six social media tools (including Facebook, X (Twitter), emails, newsletters, etc.) are more likely to export. The gap between exporters and non-exporters increases when using two social media tools rather than one, but the marginal gain seems to decrease with each subsequent new social media tool. Social media, of course, is proving to be extremely important in international business development, allowing businesses to communicate effectively with commercial partners, marketing associates, and consumers inside the country and internationally.
Conclusion
This report attempts to shed light on the performance of Indigenous-owned SMEs using data collected by the Canadian Council for Aboriginal Business and to examine the evidence surrounding Indigenous exporters. It is a first assessment of its kind to explore the development and expansion of Indigenous SMEs into the global trading system. The long term goal of this work is to establish evidence-based knowledge on Indigenous business owners and communities in order to support their efforts to build and manage wealth, and to have full agency in their commercial and professional activities. Exporting activities can be used to evaluate commercial performance since a business faces new challenges when attempting to enter foreign markets. As such, it is a valuable barometer of the viability, aspirations and commercial creativity of Indigenous SMEs in Canada.
Many Indigenous SMEs, once established and operating, have proven to reach high levels of success despite the additional obstacles they initially face compared to non-Indigenous businesses. Almost a quarter of Indigenous SMEs engage in export trade. International business competition increases the productivity threshold necessary for operation, thus eliminating less productive firms and only enabling the most productive ones to succeed and operate. Indigenous SMEs moreover export at a high rate to both the United States (1 in 5 businesses) and to non-U.S. overseas markets (1 in 7 businesses). Higher educational attainment is associated with a higher likelihood to export. However, having a written business plan does not appear to conclusively make an Indigenous SME more likely to export. The use of social media tools by Indigenous SME owners appears to be an important tool to promote their internationalization and ability to overcome business difficulties associated with remoteness.
Firm-level export decisions of Indigenous SMEs reflect the unique operational challenges and opportunities they face. The accomplishments and challenges of Indigenous SMEs as they reach into international markets point to the need for distinct Indigenous business solutions, policy initiatives, and government support. To fully address the vital question of how best to support Indigenous SMEs, which could not yet be addressed with the information available, a new iteration of the National Aboriginal Business Survey will be conducted throughout the summer and fall of 2019.
Appendix
Most data available to discuss the economic performance and business contribution of Indigenous Peoples in Canada has focused on self-employment statistics available from the Census and other population surveys.Footnote 73 The difficulty in using these sources stems from different definitions used to identify a specific type of employment. A self-employed person working for themselves may or may not have employees, but only the former case is considered to be a small and medium enterprise (SME) owner in Canada.Footnote 74 Linkages are not always that simple to perform to differentiate between the two types across databases. Thus, self-employment data concerning Indigenous Peoples and Canadian statistics on SMEs are not directly comparable. Without a new database of Indigenous SMEs or the identification of Indigenous-owned businesses in Statistics Canada’s Business Register, drawing a sample (let alone a representative sample) of Indigenous-owned SMEs is extremely challenging. This unfortunately impacts the coherence and comparability of the data. Nonetheless, the CCAB surveyed Indigenous businesses and built an insightful dataset of 1,101 Indigenous entrepreneurs, including nearly 650 Indigenous SMEs.
The errors associated with the estimates therefore include three parts:
- Survey estimates are subject to sampling error. The standard error (S.E.) which is used to compute confidence intervals is a guide to the potential size of the sampling error associated with given estimates;
- Survey estimates may also include non-sampling error. Non-sampling errors are not related to sampling and may occur for many reasons, including population coverage errors (e.g. unable to locate or out of scope), differences in the interpretation of questions, incorrect information from respondents, and mistakes in recording, coding and processing data;Footnote 75 and
- Finally, the estimates presented in this report are furthermore affected by a margin of error derived from the lack of SME population parameters, and thus a calibration with the self-employed population parameters was made.
The margin of error derived from a survey depends on a number of factors, including the percentage of units not belonging to the target population; the percentage of units missing from the target population; the coverage of the data; the absence of values for key variable; missing values in the source; and the total percentage of empty cells. All of these quality indicators relate to the response rate, which was calculated at 45.1 percent.Footnote 76 The nonresponse bias of 54.9 percent was adjusted for by weighting the respondents’ answers to the greater population attributes to increase accuracy in the estimates.Footnote 77 As such, the data was calibrated according to selected population parameters of self-employed Indigenous individuals. An additional benefit of the calibration is that it also corrects for sampling frame errors and forces estimates to be consistent with external measures.Footnote 78 The calibration command used in STATA to conduct the quantitative analysis uses a linear estimator.
Table A.1 presents the standard error and confidence intervals of the survey estimates presented in the report.
Table A.1 – Estimates’ Standard Errors and Confidence Intervals
Figure 3 – Destination markets of Indigenous SMEs’ Sales, 2014
| Variable | Statistics (%) | Standard Error (%) | 95% Confidence Interval | |
|---|---|---|---|---|
| Overseas International | 14.8 | 1.719 | 11.7 | 18.5 |
| United States | 21.5 | 1.906 | 17.9 | 25.4 |
| Inter-Provincial (National) | 48.2 | 2.385 | 43.5 | 52.8 |
| Intra-Provincial | 80.2 | 1.864 | 76.2 | 83.8 |
| Local | 88.5 | 1.464 | 85.2 | 91.0 |
Figure 4 – Breakdown of Exporters by Export Destination Markets, 2014
| Variable | Statistics (%) | Standard Error (%) | 95% Confidence Interval | |
|---|---|---|---|---|
| Non-Exporters | 75.6 | 2.018 | 71.4 | 79.3 |
| Exporters | 24.4 | 2.018 | 20.6 | 28.5 |
| Exporters to the U.S. only | 9.6 | 1.297 | 7.2 | 12.4 |
| Exporters to International non-U.S. only | 2.9 | 0.870 | 1.5 | 5.1 |
| Exporters to both U.S. and international overseas markets | 11.9 | 1.544 | 9.2 | 15.3 |
Figure 5 – Destination Markets of Indigenous SMEs’ Sales by Indigenous Identity, 2014
| Variable | Statistics (%) | Standard Error (%) | 95% Confidence Interval | ||
|---|---|---|---|---|---|
| Overseas International | First Nations | 15.9 | 2.045 | 12.3 | 20.3 |
| Métis | 11.9 | 2.297 | 8.1 | 17.2 | |
| Inuit | 7.3 | 3.306 | 2.8 | 17.3 | |
| United States | First Nations | 23.6 | 2.415 | 19.2 | 28.7 |
| Métis | 19.4 | 2.824 | 14.4 | 25.5 | |
| Inuit | 10.0 | 4.280 | 4.1 | 22.3 | |
| Inter-Provincial (National) | First Nations | 43.7 | 2.928 | 38.0 | 49.5 |
| Métis | 51.0 | 3.821 | 43.5 | 58.4 | |
| Inuit | 42.4 | 7.544 | 28.3 | 57.6 | |
| Intra-Provincial | First Nations | 78.8 | 2.511 | 73.3 | 83.2 |
| Métis | 82.2 | 2.892 | 75.7 | 87.2 | |
| Inuit | 68.4 | 7.349 | 52.2 | 81.0 | |
| Local | First Nations | 87.9 | 1.921 | 83.5 | 91.1 |
| Métis | 89.5 | 2.135 | 84.5 | 93.0 | |
| Inuit | 97.1 | 2.058 | 88.6 | 99.3 | |
Figure 6 – Export Propensity by Enterprise Size, 2014
| Variable | Statistics (%) | Standard Error (%) | 95% Confidence Interval | |
|---|---|---|---|---|
| Micro (1-4 employees) | 25.1 | 3.442 | 18.9 | 32.4 |
| Tiny (5-19 emp.) | 26.9 | 3.154 | 21.1 | 33.4 |
| Small (20-99 emp.) | 17.8 | 4.23 | 10.8 | 27.7 |
| Medium (100-499 emp.) | 14.9 | 7.706 | 4.75 | 38.0 |
Figure 10 – Export Propensity by Indigenous SMEs by Canadian Province and Region, 2014
| Variable | Statistics (%) | Standard Error (%) | 95% Confidence Interval | |
|---|---|---|---|---|
| Atlantic Provinces | 31.1 | 11.31 | 13.4 | 56.6 |
| Quebec | 19.6 | 5.164 | 11.2 | 31.8 |
| Ontario | 41.3 | 4.58 | 32.6 | 50.5 |
| Manitoba | 10.0 | 3.441 | 4.91 | 19.2 |
| Saskatchewan | 22.9 | 7.616 | 11.0 | 41.3 |
| Alberta | 15.1 | 3.936 | 8.77 | 24.6 |
| British Columbia | 31.8 | 5.38 | 22.2 | 43.3 |
| Territories | 12.4 | 5.673 | 4.72 | 28.6 |
Figure 12 – Export Propensity by Indigenous Identity, 2014
| Variable | Statistics (%) | Standard Error (%) | 95% Confidence Interval | |
|---|---|---|---|---|
| First Nations | 26.2 | 2.520 | 21.5 | 31.4 |
| Métis | 21.6 | 2.950 | 16.3 | 27.9 |
| Inuit | 12.1 | 4.655 | 5.39 | 24.8 |
Figure 13 – Owner’s Level of Education of Exporting and Non-Exporting SMEs, 2014
| Variable | Statistics (%) | Standard Error (%) | 95% Confidence Interval | ||
|---|---|---|---|---|---|
| Exporters | Elementary | 3.8 | 1.543 | 1.6 | 8.3 |
| High School | 26.5 | 4.109 | 19.2 | 35.3 | |
| College | 28.5 | 4.537 | 20.4 | 38.2 | |
| University | 25.3 | 3.862 | 18.4 | 33.6 | |
| Post Graduate | 15.1 | 3.519 | 9.3 | 23.3 | |
| Non-Exporters | Elementary | 3.1 | 0.8893 | 1.7 | 5.42 |
| High School | 35.7 | 2.702 | 30.6 | 41.2 | |
| College | 34.9 | 2.636 | 29.9 | 40.2 | |
| University | 17.7 | 2.025 | 14.1 | 22.0 | |
| Post Graduate | 8.2 | 1.415 | 5.7 | 11.4 | |
Figure 14 – Indigenous Owner’s Managerial Experience by Export Status, 2014
| Variable | Statistics (%) | Standard Error (%) | 95% Confidence Interval | ||
|---|---|---|---|---|---|
| Exporters | Less than 5 years | 0.3 | 0.294 | 0.1 | 1.9 |
| 5-10 years | 23.0 | 3.94 | 16.2 | 31.6 | |
| Over 10 years | 76.7 | 3.946 | 68.0 | 83.5 | |
| Non-Exporters | Less than 5 years | 2.3 | 0.7706 | 1.1 | 4.4 |
| 5-10 years | 27.6 | 2.474 | 22.9 | 32.6 | |
| Over 10 years | 70.2 | 2.525 | 64.9 | 74.8 | |
Table 4 – Proportion of SMEs with and without a Business Plan by Export Status, 2014
| Variable | Statistics (%) | Standard Error (%) | 95% Confidence Interval | ||
|---|---|---|---|---|---|
| Written business plan | Exporters | 43.8 | 4.485 | 35.2 | 52.7 |
| Non-Exporters | 56.2 | 4.485 | 47.2 | 64.7 | |
| Total | 38.0 | 2.281 | 33.6 | 42.5 | |
| Exporters | 36.2 | 2.642 | 31.2 | 41.5 | |
| No business Plan | Non-Exporters | 63.8 | 2.642 | 58.4 | 68.7 |
| Total | 62.0 | 2.281 | 57.4 | 66.3 | |
Figure 15 – Frequency of Use of a Business Plan by Export Status, 2014
| Variable | Statistics (%) | Standard Error (%) | 95% Confidence Interval | ||
|---|---|---|---|---|---|
| Exporters | Weekly | 9.2 | 4.322 | 3.4 | 22.1 |
| Monthly | 28.6 | 6.244 | 17.8 | 42.3 | |
| Quarterly | 25.6 | 5.703 | 15.9 | 38.4 | |
| Annually | 17.8 | 4.859 | 10.0 | 29.5 | |
| Less than annually | 18.8 | 5.186 | 10.5 | 31.3 | |
| Non-Exporters | Weekly | 5.7 | 2.011 | 2.8 | 11.2 |
| Monthly | 26.2 | 3.989 | 19.1 | 34.8 | |
| Quarterly | 34.9 | 4.397 | 26.8 | 44.0 | |
| Annually | 22.0 | 3.72 | 15.5 | 30.1 | |
| Less than annually | 10.4 | 2.582 | 6.2 | 16.6 | |
Figure 16 – Reported Important and Highly Important Obstacles to Growth by Export Status, 2014
| Variable | Statistics (%) | Standard Error (%) | 95% Confidence Interval | ||
|---|---|---|---|---|---|
| Exporters | Access to financing | 39.0 | 4.783 | 30.0 | 48.6 |
| Access to equity or capital | 42.6 | 4.758 | 33.5 | 52.1 | |
| Attracting employees | 40.8 | 4.766 | 31.8 | 50.4 | |
| Access to support for employee training | 20.5 | 4.26 | 13.3 | 30.1 | |
| Retaining valued employees | 34.2 | 4.721 | 25.5 | 44.0 | |
| Competition | 18.7 | 3.419 | 12.8 | 26.4 | |
| Cost of doing business | 32.4 | 4.561 | 24.1 | 41.9 | |
| Economic condition | 34.2 | 4.666 | 25.6 | 43.9 | |
| Gov. policy, rules, etc. | 33.5 | 4.347 | 25.4 | 42.5 | |
| Reliable internet | 27.7 | 4.693 | 19.4 | 37.8 | |
| Other infrastructure | 25.0 | 4.586 | 17.0 | 35.0 | |
| Non-Exporters | Access to financing | 30.7 | 2.565 | 25.8 | 35.9 |
| Access to equity or capital | 32.4 | 2.64 | 27.3 | 37.7 | |
| Attracting employees | 38.4 | 2.671 | 33.3 | 43.7 | |
| Access to support for employee training | 23.0 | 2.347 | 18.7 | 27.9 | |
| Retaining valued employees | 31.0 | 2.544 | 26.2 | 36.2 | |
| Competition | 36.9 | 2.642 | 31.9 | 42.2 | |
| Cost of doing business | 34.8 | 2.665 | 29.7 | 40.1 | |
| Economic condition | 42.0 | 2.74 | 36.6 | 47.4 | |
| Gov. policy, rules, etc. | 32.92 | 2.647 | 27.9 | 38.3 | |
| Reliable internet | 22.9 | 2.294 | 18.7 | 27.7 | |
| Other infrastructure | 22.06 | 2.339 | 17.8 | 27.0 | |
Figure 17 – Reported Important and Highly Important Obstacles to Growth by Sales’ Destination, 2014
| Variable | Statistics (%) | Standard Error (%) | 95% Confidence Interval | ||
|---|---|---|---|---|---|
| United States | Attracting employees | 43.8 | 5.045 | 34.1 | 53.8 |
| Access to support for employee training | 20.5 | 4.618 | 12.8 | 31.0 | |
| Retaining valued employees | 35.9 | 5.027 | 26.6 | 46.2 | |
| Competition | 17.2 | 3.361 | 11.5 | 24.8 | |
| Cost of doing business | 36.7 | 4.943 | 27.5 | 46.8 | |
| Economic condition | 35.7 | 4.958 | 26.6 | 45.9 | |
| Gov. policy, rules, etc. | 34.9 | 4.634 | 26.3 | 44.4 | |
| Reliable internet | 27.4 | 5.018 | 18.6 | 38.2 | |
| Other infrastructure | 25.1 | 4.927 | 16.6 | 35.9 | |
| Overseas International | Access to financing | 44.0 | 6.441 | 31.9 | 56.9 |
| Access to equity or capital | 41.7 | 6.36 | 29.8 | 54.5 | |
| Attracting employees | 42.1 | 6.421 | 30.1 | 55.0 | |
| Access to support for employee training | 20.9 | 6.089 | 11.2 | 35.4 | |
| Retaining valued employees | 36.8 | 6.453 | 25.1 | 50.1 | |
| Competition | 20.9 | 4.65 | 13.1 | 31.5 | |
| Cost of doing business | 35.7 | 6.282 | 24.4 | 48.8 | |
| Economic condition | 34.0 | 6.392 | 22.6 | 47.5 | |
| Gov. policy, rules, etc. | 31.0 | 5.664 | 20.9 | 43.1 | |
| Reliable internet | 32.6 | 6.59 | 21.0 | 46.7 | |
| Other infrastructure | 29.1 | 6.537 | 17.9 | 43.4 | |
| Inter-Provincial (Canada) | Access to financing | 35.9 | 3.373 | 29.5 | 42.7 |
| Access to equity or capital | 37.7 | 3.388 | 31.2 | 44.5 | |
| Attracting employees | 42.8 | 3.418 | 36.2 | 49.6 | |
| Access to support for employee training | 25.4 | 3.225 | 19.6 | 32.2 | |
| Retaining valued employees | 32.4 | 3.324 | 26.2 | 39.2 | |
| Competition | 31.9 | 3.154 | 25.9 | 38.3 | |
| Cost of doing business | 36.0 | 3.383 | 29.6 | 42.8 | |
| Economic condition | 42.0 | 3.425 | 35.4 | 48.8 | |
| Gov. policy, rules, etc. | 37.9 | 3.342 | 31.5 | 44.6 | |
| Reliable internet | 27.9 | 3.226 | 21.9 | 34.6 | |
| Other infrastructure | 24.5 | 3.188 | 18.8 | 31.3 | |
| Intra-Provincial | Access to financing | 34.0 | 2.596 | 29.0 | 39.2 |
| Access to equity or capital | 36.6 | 2.66 | 31.5 | 41.9 | |
| Attracting employees | 40.7 | 2.646 | 35.6 | 45.9 | |
| Access to support for employee training | 23.7 | 2.381 | 19.3 | 28.7 | |
| Retaining valued employees | 31.4 | 2.535 | 26.6 | 36.6 | |
| Competition | 30.7 | 2.425 | 26.1 | 35.6 | |
| Cost of doing business | 35.23 | 2.615 | 30.3 | 40.5 | |
| Economic condition | 40.0 | 2.664 | 34.9 | 45.3 | |
| Gov. policy, rules, etc. | 34.1 | 2.558 | 29.2 | 39.2 | |
| Reliable internet | 23.6 | 2.347 | 19.3 | 28.5 | |
| Other infrastructure | 22.3 | 2.363 | 18.0 | 27.2 | |
| Local | Access to financing | 32.2 | 2.435 | 27.6 | 37.2 |
| Access to equity or capital | 34.0 | 2.472 | 29.3 | 38.9 | |
| Attracting employees | 40.5 | 2.512 | 35.7 | 45.5 | |
| Access to support for employee training | 21.9 | 2.169 | 17.9 | 26.4 | |
| Retaining valued employees | 31.9 | 2.405 | 27.3 | 36.7 | |
| Competition | 30.8 | 2.31 | 26.4 | 35.5 | |
| Cost of doing business | 34.3 | 2.453 | 29.6 | 39.2 | |
| Economic condition | 39.8 | 2.521 | 34.9 | 44.8 | |
| Gov. policy, rules, etc. | 32.5 | 2.407 | 27.9 | 37.4 | |
| Reliable internet | 24.5 | 2.248 | 20.3 | 29.1 | |
| Other infrastructure | 22.9 | 2.234 | 18.8 | 27.6 | |
Figure 18 – Access to Internet based on the Sales’ Destinations, 2014
| Variable | Statistics (%) | Standard Error (%) | 95% Confidence Interval | |
|---|---|---|---|---|
| U.S. clients | 89.5 | 4.183 | 77.9 | 95.3 |
| Overseas International clients | 89.7 | 5.705 | 71.9 | 96.7 |
| Inter-provincial clients | 94.3 | 2.104 | 88.4 | 97.2 |
| Intra-provincial clients | 91.1 | 1.774 | 86.9 | 94.0 |
| Local clients | 88.8 | 1.787 | 84.7 | 91.8 |
Figure 19 – Distribution of Exporting and Non-Exporting Indigenous SMEs according to the number of social media tools used, 2014
| Variable | Statistics (%) | Standard Error (%) | 95% Confidence Interval | ||
|---|---|---|---|---|---|
| Exporters | 0 social media tool | 30.6 | 4.71 | 22.2 | 40.6 |
| 1 social media tool | 28.4 | 4.171 | 20.9 | 37.2 | |
| 2 social media tools | 20.0 | 3.67 | 13.6 | 28.1 | |
| 3 social media tools | 13.4 | 2.921 | 8.6 | 20.2 | |
| 4 social media tools | 5.5 | 1.915 | 2.7 | 10.7 | |
| 5 social media tools | 0.7 | 0.5153 | 0.1 | 2.9 | |
| 6 social media tools | 1.4 | 0.8486 | 0.4 | 4.5 | |
| Non-Exporters | 0 social media tool | 51.0 | 2.76 | 45.5 | 56.3 |
| 1 social media tool | 23.8 | 2.321 | 19.5 | 28.6 | |
| 2 social media tools | 12.6 | 1.807 | 9.44 | 16.5 | |
| 3 social media tools | 8.3 | 1.521 | 5.8 | 11.8 | |
| 4 social media tools | 2.5 | 0.7348 | 1.4 | 4.4 | |
| 5 social media tools | 1.1 | 0.5479 | 0.3 | 2.9 | |
| 6 social media tools | 0.7 | 0.4008 | 0.2 | 2.1 | |
Note: Shortened titles are used to conserve space.
Source: Office of the Chief Economist, Global Affairs Canada using data obtained from the Canadian Council for Aboriginal Business.
The standard error and the confidence intervals are complementary measures of the accuracy of the estimates. For example, based on the data, it was calculated that 24.4 percent of Indigenous SMEs are exporters, but the range in which we are confident the estimate would fall 95 times out of 100, following statistical processes, is 20.6 percent and 28.5 percent. That said, the estimate, even when considering the lower bound of the confidence interval, is substantially higher than the estimate of exporters of the general Canadian population of SMEs (11.8 percent) in 2014, and higher than other estimations previously calculated for Indigenous businesses, which range from 7.9 percentFootnote 79 (2017) to 13.7 percentFootnote 80 (2018). The standard error can be used to calculate a data quality indicator. In the case of the export propensity of Indigenous SMEs, the standard error represents 2.0 percent. The quality rating of that estimate would therefore be “excellent” according to Statistics Canada’s standards.Footnote 81
References
Asia Pacific Foundation and Creative Fire.“Indigenous-Asia Pacific Business Relations Roundtable.” Last Modified February 13, 2019. https://creative-fire.com/asia-pacific-roundtable/.
Association of Canadian Port Authorities.“Industry Information – CPA Facts.”Accessed 20 March, 2019.http://www.acpa-ports.net/industry/cpafacts.html.
Australian Indigenous Chamber of Commerce. “It’s the economy, stupid.” Last Modified March 15, 2018. http://www.indigenouschamber.org.au/its-the-economy-stupid/.
Baldwin, J.R. and Yan, B., “Empirical Evidence from Canadian Firm-level Data on the Relationship Between Trade and Productivity Performance.” Economic Analysis Research Paper Series, Statistics Canada Cat. No. 11F0027M, no. 97 (2015).https://www150.statcan.gc.ca/n1/en/pub/11f0027m/11f0027m2015097-eng.pdf?st=_u2YIb_r.
Bordt, M., Earl, L., Lonmo, C. and Joseph, R. “Working Paper: Characteristics of Firms that Grow from Small to Medium Size: Growth Factors-Interviews and Measurability.” Statistics Canada Cat. 88F0006XIE, No. 021 (December, 2004). https://www150.statcan.gc.ca/n1/en/pub/88f0006x/88f0006x2004021-eng.pdf?st=YfuIdUy7.
Canadian Arctic Producers (Arctic Co-operatives Ltd.).“About us.” http://www.canadianarcticproducers.com/About-Us.aspx.
Canadian Chamber of Commerce.“Ready for Business: Canada’s Indigenous and Non-Indigenous Businesses as Equal Partners.” Last Modified December 2010. http://www.chamber.ca/download.aspx?t=0&pid=0ef20db5-cbe7-e211-aaf9-000c29c04ade.
Canadian Council for Aboriginal Business.”Promise and Prosperity: The 2016 Aboriginal Business Survey.” https://www.ccab.com/wp-content/uploads/2016/10/CCAB-PP-Report-V2-SQ-Pages.pdf.
The Canadian Encyclopedia.“Reserves.” Last Modified July 12, 2018. Accessed 18 January 2019.https://www.thecanadianencyclopedia.ca/en/article/aboriginal-reserves.
Crown-Indigenous Relations and Northern Affairs Canada.“Aboriginal Business Directory.”Accessed February 2019.http://www.ic.gc.ca/app/ccc/srch/cccSrch.do?lang=eng&prtl=1.
Crown-Indigenous Relations and Northern Affairs Canada (CIRNAC).“Impact of the Inuit Arts economy.” Last Modified July 12, 2017. Accessed 4 June 2019.https://www.rcaanc-cirnac.gc.ca/eng/1499360279403/1534786167549.
Crown-Indigenous Relations and Northern Affairs Canada (CIRNAC).“Indigenous peoples and communities.”Last modified December 4, 2017.Accessed 4 June 2019.https://www.rcaanc-cirnac.gc.ca/eng/1100100013785/1529102490303.
David T. McNab. “Sovereignty, Treaties and Trade in the Bkejwanong Territory.” Journal of Indigenous Economic Development 3, no. 2, (2003).
Fiscal Realities Economists. “Reconciliation: Growing Canada’s Economy by $27.7 Billion.” National Aboriginal Economic Development Board. Last Modified November 2016. http://www.naedb-cndea.com/reports/naedb_report_reconciliation_27_7_billion.pdf.
Fiser, A., Conference Board of Canada. “Research Module 1 – Aboriginal Entrepreneurship in Canada.” Last Modified 14 February, 2017. https://nacca.ca/wp-content/uploads/2017/04/Research-Module-1_NACCA-BDC_Feb14_2017.pdf.
Fiser, A., Conference Board of Canada.” What are the business characteristics of Indigenous exporters in Canada?” 15 April, 2018, Working Paper.
Group ATN Consulting Inc. “Promoting Indigenous Economic Performance and Business Partnerships.”Last modified June 2016.https://www.apcfnc.ca/images/uploads/FINAL_WEBSITE_VERSION_1_14_Billion_Strong_June_1_2016.pdf.
Gulati, S., and Burelton, D. “The Long and Winding Road Towards Indigenous Economic Prosperity.” Special Report: TD Economics. Last Modified June 10, 2015. https://www.ccab.com/wp-content/uploads/2016/11/TD-AboriginalEconomicProsperity.pdf.
Indigenous Corporate Training.“11 Challenges for Indigenous Businesses.” Last Modified May 15, 2017. https://www.ictinc.ca/blog/11-challenges-for-indigenous-businesses.
Indigenomics Institute. “Indigenomics.” http://indigenomicsinstitute.com/indigenomics/.
Industry Canada, Aboriginal Business Canada. “Aboriginal Entrepreneurs Survey, 2002.” http://publications.gc.ca/collections/collection_2016/isde-ised/Iu4-195-2005-eng.pdf.
Lapham, Beverly. “International Trade with Firm Heterogeneity: Theoretical Developments and Policy Implications.” The Art of the State Volume VI: Redesigning Canadian Trade Policies for New Global Realities. Institute for Research on Public Policy, 2017. http://irpp.org/wp-content/uploads/2015/05/AOTS6-lapham.pdf.
Leung, D., Meh, C. and Terajima, Y. “Firm Size and Productivity.”Working Paper, Bank of Canada. Last Modified November 2008. https://www.bankofcanada.ca/wp-content/uploads/2010/02/wp08-45.pdf.
Louie, Clarence. “Economic Development for Indigenous People Still Not on Track.”National Indigenous Economic Development Board. Last Modified June 18, 2015. http://www.naedb-cndea.com/en/editorial/.
Moyser, Melissa. “Indigenous People Living Off-Reserve and the Labour Market: Estimates from the Labour Force Survey, 2007-2015.” Statistics Canada Cat. No. 71-588-X (2017).https://www150.statcan.gc.ca/n1/en/pub/71-588-x/71-588-x2017001-eng.pdf?st=G2tjO2qz.
Parliament of Australia. “Indigenous business strengths and competitive advantage: The challenges of a small business.” 2008. https://www.ecotourism.org.au/assets/Resources-Hub-Indigenous-Tourism/Indigenous-business-strengths-and-competitive-advantage.pdf.
Pickernell, D. et al. “Determinants of SME Exporting: Insights and Implications.”The International Journal of Entrepreneurship and Innovation 17, no. 1(2016).https://journals.sagepub.com/doi/10.5367/ijei.2016.0208.
Pinto L.E. & Blue, L.E..“Pushing the entrepreneurial prodigy: Canadian Indigenous entrepreneurship education initiatives.”Critical Studies in Education 57, no. 3 (2016): 358-375. https://www.tandfonline.com/doi/abs/10.1080/17508487.2015.1096291.
PwC, PwC's Indigenous Consulting. “The contribution of the Indigenous business sector to Australia's economy.” Last Modified April 2018. https://www.pwc.com.au/indigenous-consulting/assets/the-contribution-of-the-indigenous-business-sector-apr18.pdf.
Southern Chiefs’ Organization Inc. “Indigenous Contributions to Manitoba Economy.” http://scoinc.mb.ca/wp-content/uploads/2019/01/Indigenous-Economy-Report.pdf.
Statistics Canada. “2011 National Household Survey: Aboriginal Peoples in Canada: First Nations People, Métis and Inuit.” Statistics Catalogue No. 11-001-X, May 8, 2013. https://www150.statcan.gc.ca/n1/en/daily-quotidien/130508/dq130508a-eng.pdf?st=P0vPMHA_.
Statistics Canada.“2016 Census of Population.”Statistics Canada Catalogue no. 98-400-X2016359.Last Modified February 20, 2019. https://www12.statcan.gc.ca/census-recensement/2016/dp-pd/dt-td/Rp-eng.cfm?LANG=E&APATH=3&DETAIL=0&DIM=0&FL=A&FREE=0&GC=0&GID=0&GK=0&GRP=1&PID=112128&PRID=10&PTYPE=109445&S=0&SHOWALL=0&SUB=0&
Temporal=2017&THEME=124&VID=0&VNAMEE=&VNAMEF=
Statistics Canada.“Aboriginal Languages in Canada.”Statistics Canada Cat. No. 98-314-X2011003, October 2012. https://www12.statcan.gc.ca/census-recensement/2011/as-sa/98-314-x/98-314-x2011003_3-eng.pdf.
Statistics Canada, “Aboriginal peoples and language”, Statistics Canada Cat.No. 99-011-X2011003, NHS in Brief 2011.https://www12.statcan.gc.ca/nhs-enm/2011/as-sa/99-011-x/99-011-x2011003_1-eng.pdf
Statistics Canada. “Aboriginal peoples in Canada: Key results from the 2016 Census.” Statistics Canada Cat. No. 11-001-X, October 25, 2017. https://www150.statcan.gc.ca/n1/en/daily-quotidien/171025/dq171025a-eng.pdf?st=XIHuG31-
Statistics Canada.“Aboriginal Population Profile.2016 Census.”Statistics Canada Catalogue no. 98-510-X2016001. Ottawa. Released July 18, 2018.http://www12.statcan.gc.ca/census-recensement/2016/dp-pd/abpopprof/index.cfm?Lang=E.
Statistics Canada.“National Household Survey (NHS) Aboriginal Population Profile.”2011 National Household Survey.Statistics Canada Catalogue no. 99-011-X2011007. Ottawa. Released November 13, 2013.http://www12.statcan.gc.ca/nhs-enm/2011/dp-pd/aprof/index.cfm?Lang=E.
Statistics Canada.“National Household Survey (NHS) Profile.”2011 National Household Survey.Statistics Canada Catalogue no. 99-004-XWE. Ottawa. Released September 11, 2013.http://www12.statcan.gc.ca/nhs-enm/2011/dp-pd/prof/index.cfm?Lang=E.
Statistics Canada. “Population by age groups, sex and Aboriginal identity groups, 2006 counts for both sexes, for Canada, provinces and territories.” Last Modified October 6, 2010. https://www12.statcan.gc.ca/census-recensement/2006/dp-pd/hlt/97-558/pages/page.cfm?Lang=E&Geo=PR&Code=01&Table=2&Data=Count&Sex=1&Abor=1&StartRec=1&Sort=2&Display=Page.
Statistics Canada.“Survey on Financing and Growth of SMEs, 2014.” Last Modified November 27, 2015. https://www.ic.gc.ca/eic/site/061.nsf/eng/02997.html.
Statistics Canada.“Survey on Financing and Growth of SMEs, 2017.” Last Modified March 21, 2019. https://www.ic.gc.ca/eic/site/061.nsf/eng/03087.html.
Statistics Canada, “Survey on Financing and Growth of Small and Medium Enterprises”, Last Modified January 23, 2018. http://www23.statcan.gc.ca/imdb/p2SV.pl?Function=getSurvey&SDDS=2941
TD Economics: Special Report. “Estimating the Size of the Aboriginal Market in Canada.” Last Modified June 17, 2011. https://www.td.com/document/PDF/economics/special/sg0611_aboriginal.pdf.
United Nations Sustainable Development.“About the Sustainable Development Goals.” https://www.un.org/sustainabledevelopment/sustainable-development-goals/.
United Nations Trade Statistics.“Modes of Supply.” https://unstats.un.org/unsd/tradekb/Knowledgebase/50665/Modes-of-Supply.
World Trade Organization (WTO).“Basic Purpose and Concepts.”GATS Training Module: Chapter 1. https://www.wto.org/english/tratop_e/serv_e/cbt_course_e/c1s3p1_e.htm.
- Date modified: