
The growth of supply chain trade within the Comprehensive and Progressive Agreement for Trans-Pacific Partnership (CPTPP)
Summary
- This report examines the development of supply chain trade following the implementation of the Comprehensive and Progressive Agreement for Trans-Pacific Partnership (CPTPP or the Agreement) as required under CPTPP Competitiveness and Business Facilitation Chapter (Article 22.3.5).
- The report finds that the Agreement helped boost both overall trade and supply chain trade between CPTPP members.
- Overall, the CPTPP helped expand trade between members, with intra-CPTPP trade increasing 5.5% from 2018 to 2021.
- Trade between members where CPTPP created a “new” FTA relationship (i.e countries that did not have an existing FTA before CPTPP) saw even stronger growth, increasing 13.2% between 2018 and 2021; and
- Trade between “new” FTA relationships grew fastest for products that saw CPTPP tariff reductions, with trade in such products increasing 16.8% over the same period.
- This report uses trade in specified processed intermediate goods (SIGs) from the Broad Economic Categories (BEC) created by the United Nations as the preferred measure for supply chain trade. The report finds that the CPTPP is helping to facilitate and strengthen supply chains within the region, in particular it finds that:
- Intra – CPTPP supply chain trade growth was the highest where the impact of CPTPP on trade was expected to be strongest (reference Table 2 for expected impact), that is in the cases where a new FTA relationship were created and for products that benefited from CPTPP tariff reductions;
- This strong supply chain trade performance additionally holds true when looking at specific product groups such as transport equipment, and construction and housing materials. These two product groups represent intra-CPTPP’s largest supply chain trade in terms of value in 2021.
- These results must be interpreted with a note of caution given the impact of the global pandemic on economic performance and trade over the period examined.
Introduction
This report examines the development of supply chain trade following the implementation of the Comprehensive and Progressive Agreement for Trans-Pacific Partnership (CPTPP or the Agreement). This was required under the CPTPP Competitiveness and Business Facilitation Chapter (Article 22.3.5): “the Committee shall commence a review of the extent to which this Agreement has facilitated the development, strengthening and operation of supply chains in the free trade area during the fourth year after the date of entry into force of this Agreement”.
The CPTPP is a mega regional trade agreement that involves 12 countries spanning the entire Asia-Pacific region and beyond. It includes Australia, Brunei, Canada, Chile, Japan, Malaysia, Mexico, New Zealand, Peru, Singapore and Vietnam and the United KingdomFootnote 1. Now in force for all 11 original members, the Agreement forms an economically significant regional trading bloc that accounts for approximately one-eighth of global GDP.
The first section of this study reviews overall intra-CPTPP trade trend between 2018 and 2021. Intra-CPTPP trade is divided into “new” vs. “existing”, based on whether or not the trading partners had a free trade agreement prior to CPTPP. The second section introduces Broad Economic Categories into the analyses to measure supply chain trade. The third section introduces CPTPP tariff preference margins into the analyses.
It is important to note that, while this report finds a positive impact of CPTPP on intra-CPTPP trade and supply chain trade, the report covers data between 2018 and 2021, where COVID-19 has adversely affected most of the sectors in global and regional supply chain with varying impacts and thus be interpreted with a note of caution.
Overall trade
There are 12 members in the CPTPP, but the Agreement did not enter into force at the same time for all members. On December 30, 2018, the Agreement first entered into force for Australia, Canada, Japan, Mexico, New Zealand and Singapore. Entry into force for Vietnam followed on January 14, 2019. The CPTPP has been in force for Peru since September 19, 2021, for Malaysia since November 29, 2022, for Chile since February 21, 2023 and for Brunei since July 12, 2023. The CPTPP has not yet entered into force for the U.K. For the purpose of this report, “intra-CPTPP trade” refers to trade among Australia, Canada, Japan, Mexico, New Zealand, Singapore and Vietnam, as sufficient time had not yet passed at the time of writing from the entry into force of the agreement to analyze the impact of CPTPP for Peru, Malaysia, Chile, Brunei, and the U.K.
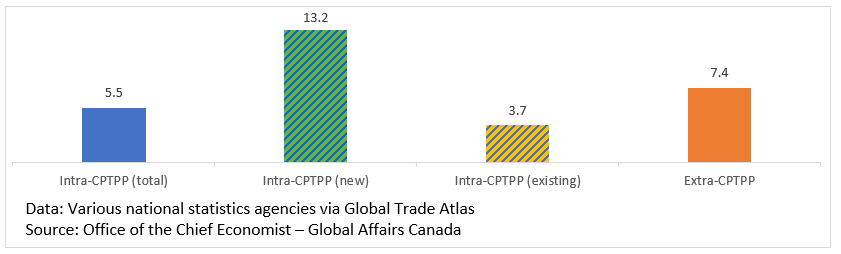
As of 2021, the latest year for which data is available at the time this analysis was conducted, total intra-CPTPPFootnote 2 trade reached $US308.9 billionFootnote 3, an increase of 5.5% from 2018, the year prior to the Agreement entering force. In comparison, extra-CPTPPFootnote 4 trade grew 7.4% over the same period. However, many ratified CPTPP Parties already had existing free trade agreements (FTAs) with each other, which means that the impact of CPTPP would likely be less in the cases of pre-existing FTA relationships. Of the 21 trading relationships among ratified CPTPP Parties, 10 can be classified as “new” FTA relationships (see Table 1).
Table 1: Ratified CPTPP members’ trading relationship, by whether CPTPP created a new FTA relationship or there was already an existing FTA relationship
| Partner (Exporter) | ||||||||
|---|---|---|---|---|---|---|---|---|
| Australia | Canada | Japan | Mexico | New Zealand | Singapore | Vietnam | ||
| Reporter (Importer) | Australia | New | Existing | New | Existing | Existing | Existing | |
| Canada | New | New | Existing | New | New | New | ||
| Japan | Existing | New | Existing | New | Existing | Existing | ||
| Mexico | New | Existing | Existing | New | New | New | ||
| New Zealand | Existing | New | New | New | Existing | Existing | ||
| Singapore | Existing | New | Existing | New | Existing | Existing | ||
| Vietnam | Existing | New | Existing | New | Existing | Existing | ||
Separating intra-CPTPP trade into “new” and “existing” FTA relationships shows the benefit of CPTPP. In 2021, “new” intra-CPTPP trade reached $US61.6 billion, which was an increase of 13.2% from 2018. “Existing” intra-CPTPP trade, on the other hand, had an increase of 3.7% over the same period to reach $US247.2 billion (See Figure 1 and Table 3 in Annex 2).
Figure 1: Intra- and extra-CPTPP trade growth (%) between 2018 and 2021
Text version - Figure 1
| Intra-CPTPP (total) | Intra-CPTPP (new) | Intra-CPTPP (existing) | Extra-CPTPP | |
|---|---|---|---|---|
| Intra- and extra-CPTPP trade growth (%) between 2018 and 2021 | 5.5 | 13.2 | 3.7 | 7.4 |
Measuring supply chain trade with Broad Economic Categories (BEC)
Using the Broad Economic Categories (BEC), developed by the United Nations, merchandise trade can be disaggregated into three large groups; goods for final consumption, capital products, and intermediates. Final consumption products are products used by households for personal consumption and not in the production process. Capital products are fixed assets that are used repeatedly in the production process over several periods to produce other products. Intermediate products are inputs that are used by producers to make final consumption products. It is this category of intermediate products which we use to define “supply chain trade”. Trade statistics on intermediate goods reflect the exchange of parts, components, and accessories taking place within supply chains (World Trade Organization, n.d.). Intermediate goods are frequently used as a proxy for supply chain trade; see for example, (OECD, 2013; Nicita et al. 2013).
However, not all intermediate products are the same. There are primary intermediate products, which are products of primary sectors of the economy (i.e. farming, forestry, fishing and the extractive industries). Primary intermediates also include products from the primary sectors that only went through minor changes in the manufacturing process. Processed intermediate goods, on the other hand, owe much of their value to the processing or manufacturing industries. Processed intermediate goods can be further divided into generic processed intermediate goods (GIGs) and specified processed intermediate goods (SIGs). GIGs are homogeneous goods, which are traded on an organized exchange, or referenced priced goods with published prices. SIGs are differentiated goods without published prices. SIGs often require an explicit coordination between the industries producing and consuming them. While GIGs trade is often arms length in nature, SIGs trade requires an explicit coordination between the parties involved and fits with the narrow conceptualization of Global Value Chains where firms exchange highly specific (customized) inputs through an explicit coordination (see Annex 1 for more details). SIGs was recently used as a proxy for supply chain trade by Statistics Canada (2022). As an example, GIGs would include products such as pneumatic tires, semi-finished products of alloy steel, and wire of stainless steel, while SIGs would include products such as parts and accessories of bodies for motor vehicles, engines, parts of turbo-jets or turbo-propellers, and parts for motor vehicles.
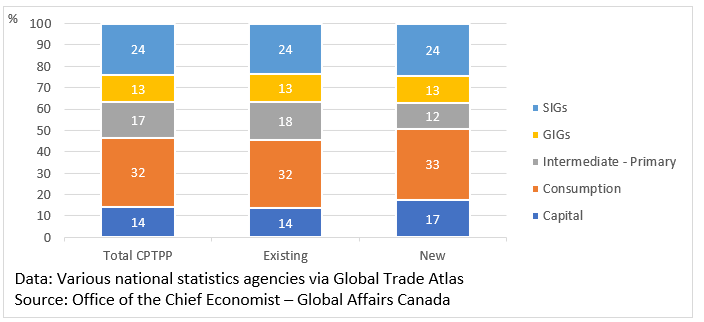
Whether the intra-CPTPP trading relationship is “new” or “existing”, consumption goods account for the largest share of intra-CPTPP goods trade at approximately one-third, followed by SIGs at almost one-quarter. The composition of BEC categories is similar between “existing” and “new” intra-CPTPP trade. (See Figure 2)
Figure 2: Composition (% share) of intra-CPTPP trade in 2021, by BEC
Text version - Figure 2
| Composition (% share) of intra-CPTPP trade in 2021, by BEC | Total CPTPP | Existing | New |
|---|---|---|---|
| Capital | 14 | 14 | 17 |
| Consumption | 32 | 32 | 33 |
| Intermediate - Primary | 17 | 18 | 12 |
| GIGs | 13 | 13 | 13 |
| SIGs | 24 | 24 | 24 |
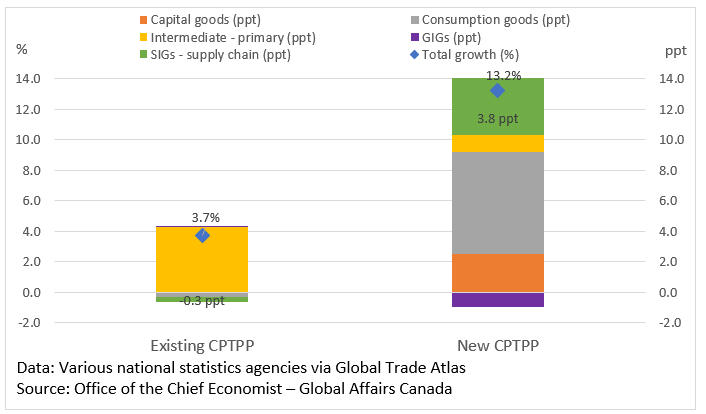
The type of goods driving intra-CPTPP trade growth are different for “new” and “existing” FTA relationships. Between 2018 and 2021, “existing” intra-CPTPP trade increased 3.7% but this was almost entirely driven by primary intermediates which contributed 4.3 percentage points to growth. All other types of goods (consumption, capital, GIGs, SIGs) contributed close to zero or negatively to “existing” intra-CPTPP trade growth. In contrast, the contribution to growth of “new” intra-CPTPP trade (+13.2%) is more diversified, with the largest contributor being consumption goods which contributed 6.7 percentage points to the growth. In second place is SIGs (or supply chain trade) which grew 16.1% (Figure 3) between 2018 and 2021 to contribute 3.8 percentage points to growth (Figure 4). Capital goods grew 14.8% which is a 2.5 percentage points contribution and primary intermediates grew 9.0% which is a 1.1 percentage points contribution. (See Figure 3, Figure 4 and Table 3 in Annex 2)
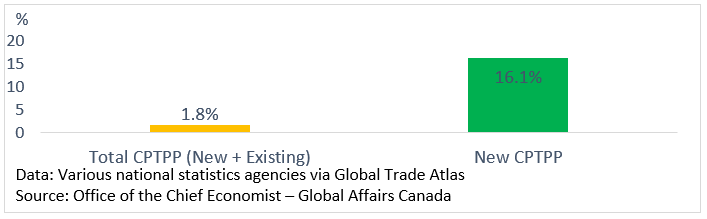
To summarise from a supply chain trade perspective, SIGs trade improved by 16.1% between 2018 and 2021 among “new” FTA relationship within CPTPP, compared to a 1.8% increase in total intra-CPTPP supply chain trade. It is even more notable the strong growth in supply chain trade among “new” CPTPP FTA relationships given that this period includes the impact of the global pandemic suggesting the contribution of CPTPP to increased resiliency of supply chains in the region. (See Figure 3, Figure 4 and Table 3 in Annex 2)
Figure 3: Intra-CPTPP supply Chain Trade Growth between 2018 and 2021 (%)
Text version - Figure 3
| Intra-CPTPP supply Chain Trade Growth between 2018 and 2021 (%) | |
|---|---|
| Total CPTPP (New + Existing) | 1.8 |
| New CPTPP | 16.1 |
Figure 4: Trade growth (%) and contribution (percentage points) to the growth, by “new” vs “existing” FTA relationship within CPTPP and by BEC
Text version - Figure 4
| Trade growth (%) and contribution (percentage points) to the growth, by “new” vs “existing” FTA relationship within CPTPP and by BEC | Existing CPTPP | New CPTPP |
|---|---|---|
| Total growth (%) | 3.7 | 13.2 |
| Capital goods (ppt) | -0.1 | 2.5 |
| Consumption goods (ppt) | -0.2 | 6.7 |
| Intermediate - primary (ppt) | 4.3 | 1.1 |
| GIGs (ppt) | 0.0 | -1.0 |
| SIGs - supply chain (ppt) | -0.3 | 3.8 |
Introducing tariff preference margins
For World Trade Organization (WTO) members, the rate of duties that countries impose on imports from other WTO members is called the Most-Favoured-Nation (MFN) tariff rates. Free trade agreements, like the CPTPP reduce tariff rates to a level lower than MFN rates for many products and often completely eliminate tariffs for most products. The preference margin is the difference between the CPTPP preferential tariff rate and the MFN tariff rate. In this report, “affected by CPTPP” are products where the CPTPP preferential tariff rate is lower than the MFN tariff rate. “MFN duty free” are products where the MFN rate is already zero percent, which means FTAs would not be expected to have a direct effect on these products. Lastly, there are products “unaffected by CPTPP”, which are products where the MFN rate is greater than zero but is not different from the CPTPP rate. However, “unaffected by CPTPP” products are small in number and trade values, representing less than $US 1 billion for both “new” and “existing” FTA relationships within CPTPP and is therefore generally excluded from the analyses below.
Due to the availability of tariff data, the composition of “new” and “existing” FTA relationship is slightly different in this section. As of time of writing, tariff rate data for Mexico and Vietnam were not available and therefore imports from these countries were excluded from the analyses in this section.
Combining tariff preference margins with “new” and “existing” FTA relationship, and holding other economic conditions equal, the expected impact on intra-CPTPP trade is as follows:
Table 2: Expected impact of CPTPP on intra-trade based on FTA relationship and tariff preference margins
| FTA relationship status | |||
|---|---|---|---|
| “New” FTA relationship | “Existing” FTA relationship | ||
| Tariff Preference Margins | Affected by CPTPP products | Strong impact on trade is expected due to both reduced tariffs and other trade facilitating measures of a new FTA relationship. | Impact from tariffs is expected to be less significant since most products already have low tariffs from other FTAs and therefore only a small number and value of products benefit where CPTPP tariffs are lower than other FTAs’ tariffs. Likewise, other trade facilitating measures from the CPTPP can have an impact if they are stronger than other trade facilitating measures of other FTAs. |
| MFN duty free products | Modest impact is expected here since most products already have a tariff rate of zero, however this may still benefit from other trade facilitating measures of a new FTA relationship. | Impact from tariffs is expected to be close to zero since all products already have zero tariffs. Furthermore, other trade facilitating measures from the CPTPP can have an impact if they are stronger than other trade facilitating measures of other FTAs | |
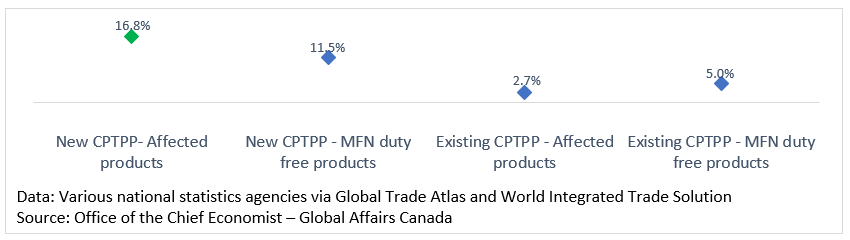
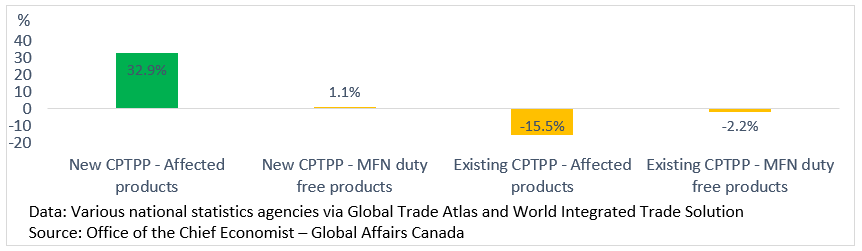
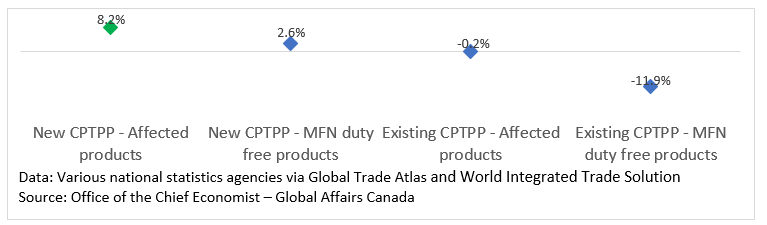
As one might expect, trade grew fastest where a “new” FTA relationship came into existence and for those products which experienced tariff rate reductions courtesy of the CPTPP. This was especially the case for supply chain trade. “Affected” products trade in “new” FTA relationships grew the fastest (+16.8%, Figure 5) between 2018 and 2021 to reach $US16.4 billion (Table 4 in Annex 2), and within this intersection of FTA relationship and tariff preference margins, supply chain trade (SIGs trade) grew 32.9% over the same period (Figure 6).
The results here show that intra-CPTPP supply chain trade performed the best where the expected impact of CPTPP on trade was the strongest, which is in the intersection of “new” FTA relationships and “affected” by CPTPP products. It is important to note that these results are for a period impacted by the global pandemic, in particular widespread supply chain disruptions, and thus should be interpreted with caution.
Figure 5: Intra- CPTPP trade growth between 2018 and 2021 (%), by the intersection of FTA relationship and tariff preference margins
Text version - Figure 5
| New CPTPP- Affected products | New CPTPP - MFN duty free products | Existing CPTPP - Affected products | Existing CPTPP - MFN duty free products | |
|---|---|---|---|---|
| Intra- CPTPP trade growth between 2018 and 2021 (%), by the intersection of FTA relationship and tariff preference margins | 16.8 | 11.5 | 2.7 | 5.0 |
Figure 6: Intra-CPTPP supply Chain Trade Growth between 2018 and 2021 (%)
Text version - Figure 6
| Intra-CPTPP supply Chain Trade Growth between 2018 and 2021 (%) | |
|---|---|
| New CPTPP - Affected products | 32.9 |
| New CPTPP - MFN duty free products | 1.1 |
| Existing CPTPP - Affected products | -15.5 |
| Existing CPTPP - MFN duty free products | -2.2 |
CPTPP’s trade in transport equipment product group
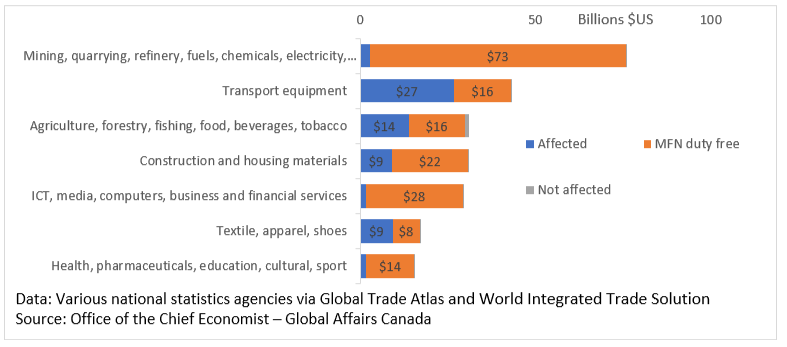
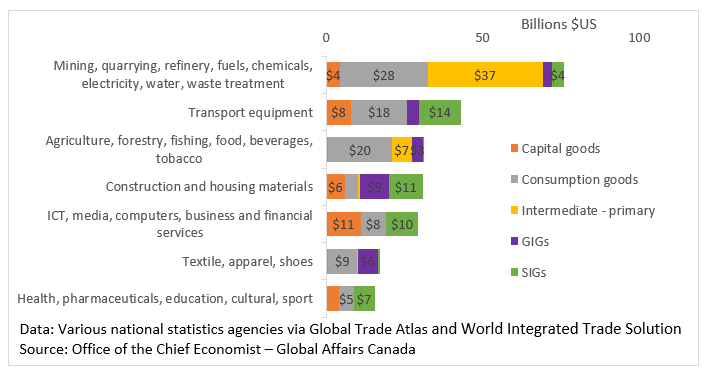
In addition to categorizing traded products into consumption, intermediates and capital goods, BEC also divides products into eight broad categories of products (see Annex 1 for more details). Transport equipmentFootnote 5 is the second largest product groupFootnote 6 within intra-CPTPP trade, reaching $US43.1 billion in 2021, of which $US26.6 billion was products “affected” by CPTPP tariff reductions, making transport equipment the largest product group to be “affected” by CPTPP (Figure 7). Of the $US43.1 billion, $US13.7 billion was supply chain trade (SIGs), also making transport equipment product group the largest category of supply chain trade within CPTPP. (Figure 10)
Figure 7: Intra-CPTPP trade in 2021, by tariff preference margins and BEC’s broad categories of products
Text version - Figure 7
| Intra-CPTPP trade in 2021, by tariff preference margins and BEC’s broad categories of products ($US billion) | Affected | MFN duty free | Not affected |
|---|---|---|---|
| Health, pharmaceuticals, education, cultural, sport | 1.7 | 13.7 | 0.0 |
| Textile, apparel, shoes | 9.2 | 7.7 | 0.1 |
| ICT, media, computers, business and financial services | 1.6 | 27.7 | 0.0 |
| Construction and housing materials | 9.0 | 21.7 | 0.0 |
| Agriculture, forestry, fishing, food, beverages, tobacco | 13.8 | 16.1 | 1.1 |
| Transport equipment | 26.6 | 16.5 | 0.0 |
| Mining, quarrying, refinery, fuels, chemicals, electricity, water, waste treatment | 2.7 | 73.1 | 0.0 |
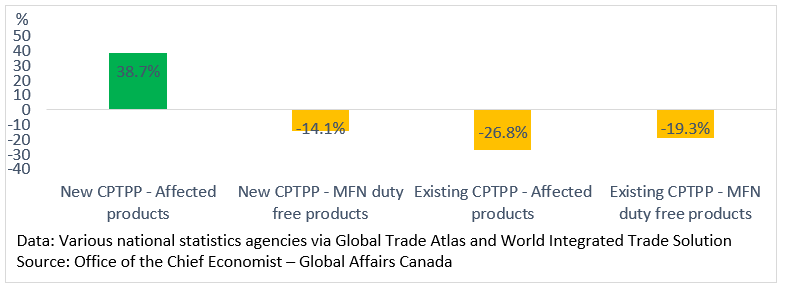
Similar to total intra-CPTPP trade, intra-CPTPP trade in the transport equipment product group grew the fastest where the impact of CPTPP on trade was expected to be the strongest, which is within the intersection of “new” FTA relationship and “affected” by CPTPP products. In this intersection, intra-CPTPP trade of transport equipment product group grew by 8.2% between 2018 and 2021 (Figure 9), outpacing the growth of transport equipment product group in other intersections. Supply chain trade of transport equipment product group performed well within this intersection of “new” FTA relationship and “affected” by CPTPP products, growing 38.7% over the same period (Figure 8).Once again, despite this strong correlation between supply chain trade performance and CPTPP’s expected impact, its difficult to conclude causation since there are other economic factors that are not accounted for.
Figure 8: Intra-CPTPP supply Chain Trade Growth between 2018 and 2021 (%) – Transportation equipment product group
Text version - Figure 8
| Intra-CPTPP supply Chain Trade Growth between 2018 and 2021 (%) – Transportation equipment product group | |
|---|---|
| New CPTPP - Affected products | 38.7 |
| New CPTPP - MFN duty free products | -14.1 |
| Existing CPTPP - Affected products | -26.8 |
| Existing CPTPP - MFN duty free products | -19.3 |
Figure 9: Intra- CPTPP trade growth between 2018 and 2021 (%), by the intersection of FTA relationship and tariff preference margins – Transport equipment product group
Text version - Figure 9
| New CPTPP - Affected products | New CPTPP - MFN duty free products | Existing CPTPP - Affected products | Existing CPTPP - MFN duty free products | |
|---|---|---|---|---|
| Intra- CPTPP trade growth between 2018 and 2021 (%), by the intersection of FTA relationship and tariff preference margins – Transport equipment product group | 8.2 | 2.6 | -0.2 | -11.9 |
Construction and housing materialsFootnote 7 product group
Construction and housing materials is the fourthFootnote 8 largest product group within intra-CPTPP trade, accounting for $US30.8 billion in 2021, of which $US10.6 billion was supply chain trade (SIGs), making it the second largest supply chain trade within intra-CPTPP trade after the transport equipment product group. (See Figure 10)
Figure 10: Intra-CPTPP trade in 2021, by end use categories and BEC’s broad categories of products
Text version - Figure 10
| Intra-CPTPP trade in 2021, by end use categories and BEC’s broad categories of products ($US billion) | Capital goods | Consumption goods | Intermediate - primary | GIGs | SIGs |
|---|---|---|---|---|---|
| Health, pharmaceuticals, education, cultural, sport | 4.1 | 4.7 | 0.0 | 0.0 | 6.6 |
| Textile, apparel, shoes | 0.4 | 9.5 | 0.1 | 6.5 | 0.6 |
| ICT, media, computers, business and financial services | 11.1 | 7.9 | 0.0 | 0.2 | 10.1 |
| Construction and housing materials | 5.9 | 4.2 | 0.7 | 9.3 | 10.6 |
| Agriculture, forestry, fishing, food, beverages, tobacco | 0.6 | 20.2 | 6.5 | 3.5 | 0.1 |
| Transport equipment | 7.9 | 18.0 | 0.0 | 3.6 | 13.7 |
| Mining, quarrying, refinery, fuels, chemicals, electricity, water, waste treatment | 4.5 | 27.9 | 36.8 | 3.0 | 3.7 |
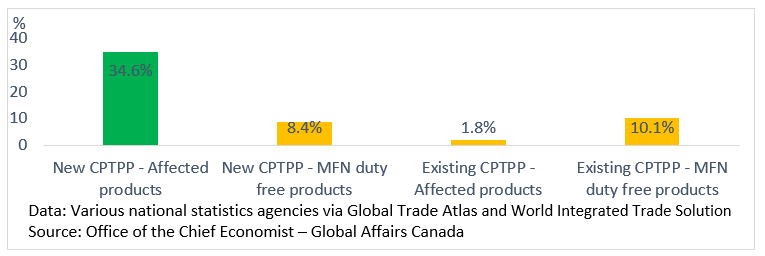
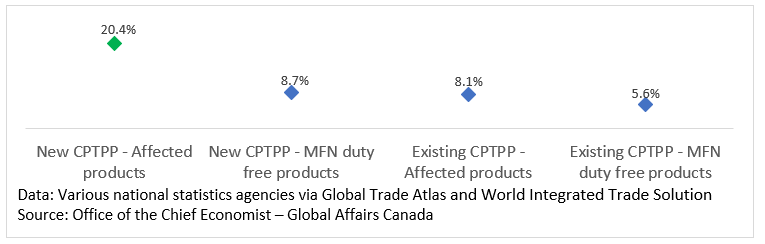
Once again, intra-CPTPP trade of construction and housing materials product group grew the fastest where the impact of CPTPP on trade was expected to be the strongest, which is within the intersection of “new” FTA relationship and “affected” by CPTPP products. In this intersection, intra-CPTPP trade of construction and housing materials product group grew 20.4% between 2018 and 2021 (Figure 12). As for supply chain trade, SIGs trade of construction and housing materials product group performed well in the intersection of “new” FTA relationship and “affected” by CPTPP products, growing 34.6% over the same period (See Figure 11).The results from the trade of construction and housing material product group provide further evidence of the correlation between supply chain trade growth and CPTPP’s expected performance, however once again, one cannot infer causation since other economic factors, such as the Covid-19 pandemic, may also have had an impact.
Figure 11: Intra-CPTPP supply Chain Trade Growth between 2018 and 2021 (%) – Construction and housing materials product group
Text version - Figure 11
| Intra-CPTPP supply Chain Trade Growth between 2018 and 2021 (%) – Construction and housing materials product group | |
|---|---|
| New CPTPP - Affected products | 34.6 |
| New CPTPP - MFN duty free products | 8.4 |
| Existing CPTPP - Affected products | 1.8 |
| Existing CPTPP - MFN duty free products | 10.1 |
Figure 12: Intra- CPTPP trade growth between 2018 and 2021 (%), by the intersection of FTA relationship and tariff preference margins – Construction and housing materials product group
Text version - Figure 12
| New CPTPP - Affected products | New CPTPP - MFN duty free products | Existing CPTPP - Affected products | Existing CPTPP - MFN duty free products | |
|---|---|---|---|---|
| Intra- CPTPP trade growth between 2018 and 2021 (%), by the intersection of FTA relationship and tariff preference margins – Construction and housing materials product group | 20.4 | 8.7 | 8.1 | 5.6 |
Conclusion
This report shows that intra-CPTPP trade and supply chain trade performed well where the impact of CPTPP on trade was expected to be the strongest; which is where a new free trade relation was created and for products benefited from CPTPP tariff reductions. For instance, the two largest product groups for intra-CPTPP supply chain trade were transportation equipment and construction and housing materials, and these products showed strong performance between 2018 and 2021.
Overall intra-CPTPP trade grew 5.5% between 2018 and 2021, but in the case where a new free trade relation was created and for products benefiting from CPTPP tariff reductions, intra-CPTPP trade grew 16.8%, outpacing overall intra-CPTPP trade growth as well as extra-CPTPP trade growth. From a supply chain perspective, where products benefited from a “new” FTA relationship and from tariff reductions, supply chain trade grew 32.9% between 2018 and 2021.
This study finds a strong relationship between CPTPP and strengthened supply chain trade performance. One can potentially interpret these results as even more significant in that they occurred despite the economic disruptions caused by a global pandemic. However, it’s too early to identify the impacts robustly or to draw clear policy implications, given the limited timeframe under study, the significant disruptions caused by COVID-19, and that some members had yet to implement the agreement at the time of writing. Nonetheless, the CPTPP Competitiveness and Business Facilitation Committee remains committed to undertaking future reviews, as required under Article 22.3.5, and to continuing efforts to improve understanding of the development and operation of CPTPP supply chain, with the waning of the pandemic’s impact, the further ratifications of CPTPP partners, and improvement of data availability.
Bibliography
Nicita, A., Ognivtsev, V., & Shirotori, M. (2013). Global Supply Chains: Trade and Economic Policies for Developing Countries. UNCTAD, Policy Issues in International Trade and Commodities, Study Series No. 55.
OECD (2013). Trade in Intermediate Goods and International Supply Chains in CEFTA. CEFTA Issues paper 6.
Statistics Canada (2022). Measuring exposure and disruptions caused by the COVID-19 pandemic to global value chains: An analysis based on imported specified intermediate goods in Canada. Latest Developments in the Canadian Economic Accounts, Catalogue no. 13-605-X.
United Nations (2016). Classification by Broad Economic Categories Rev.5: Defined in terms of the Harmonized Commodity Description and Coding System (2012) and the Central Product Classification, 2.1. Department of Economic and Social Affairs Statistics Division, Statistical Papers, Series M, No. 53, Rev. 5
World Trade Organization (n.d.). Trade in Value Added and Global Value Chains: Country profiles explanatory notes.
Annex 1: Broad Economic Categories
According to the United Nations (2016), the classification of international products by Broad Economic Categories (BEC) is to provide a set of broad product categories for the analysis of trade statistics.
In 2016, the fifth revision of BEC (BEC Rev.5) was considered and endorsed for international use. BEC Rev.5 categorized international products using 6 dimension (see Figure below).
Figure 13: Fifth revision of Broad Economic Categories by the United Nation
Source: United Nation (2016)
The United Nation (2016) categorized products by six dimensions. In the first dimension, Broad Economic Categories, products are classified using International Standard Industrial Classification (ISIC). ISIC reflects the economic structure of societies and is based on the type of production carried out by economic units, where these units can be grouped to form industries. The first dimension can be thought of as a correspondence between economic sectors (ISIC) and the goods and services (BEC) they typically produce. The second level is the product dimension which divides products into goods and services.
The end-use dimension is the third dimension where products are divided into three types of end-use: 1) intermediate consumption; 2) gross fixed capital formation; and 3) final consumption. Intermediate consumption are products used up in the course of production within the accounting period. Gross fixed capital formation are products used repeatedly or continuously in production over several accounting periods; they can be thought of as fixed assets used in the production process. Final consumption are products used by individual households or the community to satisfy their individual or collective needs or wants.
In the first 3 dimensions, all products are categorized. In another word, they were all given a category within the dimension. However, in the next 3 dimensions (4, 5, and 6), some products are not applicable to these dimensions and are not categorized.
In dimension 4, the processing dimension, products are divided into 2 categories: (1) primary and (2) processed. This dimension only applies to goods (dimension 2) and only to intermediate and final consumption (dimension 3). Primary goods are those which characteristically are products of primary sectors of the economy (i.e. farming, forestry, fishing and the extractive industries). Primary intermediates also includes goods from the manufacturing sector where products underwent only a minor change. For example: cotton changes physically when ginned, but most of the value of ginned cotton derives from the agriculture sector, it is still classified as a primary good. Processed goods, on the other hand, owe much of their value to the processing or manufacturing industries. In general, if an intermediate or final consumption good is not defined as a primary good, then it is classified as processed good.
In dimension 5, the specification dimension, products are classified as either generic or specified. This dimension is only applicable to intermediate consumption services, processed intermediate consumption goods, and gross fixed capital formation goods. Generic intermediate goods are homogeneous goods, which are traded on an organized exchange, or referenced priced goods with published prices. Specific intermediate goods are differentiated goods without published prices. Generic intermediate goods are more indicative of arm’s length trade as they lie further upstream in the value added chain and have a wider applicability across industries, while specific intermediate goods are more indicative of an explicitly coordinated trade.
The durability dimension is dimension 6, where goods are divided into non-durable and durable goods. This dimension is only applicable to final consumption goods. A consumer durable is a good that may be used for purposes of consumption repeatedly or continuously over a period of at least a year. A non-durable good would be a single use good.
In this report, the dimensions we are most interested in are 3, 4, and 5. Trade statistics on intermediate goods reflect the exchanges of parts, components, and accessories taking place within supply chains (World Trade Organization, n.d.). Reports in the past have mentioned the use of intermediate goods as proxy for measuring supply chain trade (OECD, 2013; Nicita et al. 2013). However, according to the United Nations (2016), some researchers have found the definition of intermediates in the previous revision of BEC (BEC Rev. 4) too broad for examining global value chain participation, even when divided into primary vs. processed intermediates. It was found that the processed intermediate goods category contained many generic products with published reference prices (e.g. cotton bales, linseed oil) or commonly sold at auction, in addition to differentiated and complex intermediate products intended for use in specific industries and for specific final goods (e.g. auto parts made for a specific brand or model). The “specific” processed intermediate goods category was created for BEC Rev. 5 to better identify global value chain trade.
“Specific” processed intermediate goods (SIGs), as opposed to “generic” processed intermediate goods (GIGs) which are homogenous in nature, are associated with differentiated goods and require an explicit coordination between the industries producing and consuming them. While GIGs trade are often arm’s length in nature, SIGs trade often requires an explicit coordination between the parties involved. SIGs trade fits with the narrow conceptualization of Global Value Chains where firms exchange highly specific (customized) inputs through an explicit coordination. Using SIGs as a proxy for supply chain trade was recently used by Statistics Canada (2022).
Annex 2: Results
Table 3: Intra-CPTPP trade, by FTA relationship and BEC categories
| 2021 Trade value, $US billion | % growth from 2018 | |
|---|---|---|
| Total intra-CPTPP | 308.9 | 5.5 |
| Capital goods | 44.2 | 2.8 |
| Consumption goods | 100.2 | 3.2 |
| Primary Intermediates | 51.0 | 27.1 |
| Generic processed intermediates (GIGs) | 39.7 | -1.1 |
| Specific processed intermediates (SIGs) | 73.7 | 1.8 |
| Intra-CPTPP – “existing” FTA relationships | 247.2 | 3.7 |
| Capital goods | 33.4 | -0.5 |
| Consumption goods | 79.6 | -0.7 |
| Primary Intermediates | 43.7 | 30.8 |
| Generic processed intermediates (GIGs) | 31.9 | 0.2 |
| Specific processed intermediates (SIGs) | 58.6 | -1.3 |
| Intra-CPTPP – “new” FTA relationships | 61.6 | 13.2 |
| Capital goods | 10.8 | 14.8 |
| Consumption goods | 20.6 | 21.4 |
| Primary Intermediates | 7.3 | 9.0 |
| Generic processed intermediates (GIGs) | 7.8 | -6.4 |
| Specific processed intermediates (SIGs) | 15.0 | 16.1 |
| Data: Global Trade Atlas Source: Office of the Chief Economist, Global Affairs Canada | ||
Table 4: Intra-CPTPP trade, by FTA relationship and BEC categories and tariff preferences
| 2021 Trade value, $US billion | % growth from 2018 | |
|---|---|---|
| Intra-CPTPP – “existing” FTA relationships | 191.0 | 4.5 |
| Affected by CPTPP | 48.3 | 2.7 |
| Capital goods | 7.3 | 9.5 |
| Consumption goods | 30.3 | 4.6 |
| Primary Intermediates | 0.5 | 84.9 |
| Generic processed intermediates (GIGs) | 4.2 | 4.8 |
| Specific processed intermediates (SIGs) | 6.0 | -15.5 |
| MFN duty free | 141.8 | 5.0 |
| Capital goods | 18.4 | 5.8 |
| Consumption goods | 43.2 | -1.3 |
| Primary Intermediates | 36.4 | 23.4 |
| Generic processed intermediates (GIGs) | 14.8 | 0.1 |
| Specific processed intermediates (SIGs) | 28.8 | -2.2 |
| Intra-CPTPP – “new” FTA relationships | 51.7 | 12.5 |
| Affected by CPTPP | 16.4 | 16.8 |
| Capital goods | 1.1 | 20.2 |
| Consumption goods | 10.9 | 15.0 |
| Primary Intermediates | 0.0 | 150.0 |
| Generic processed intermediates (GIGs) | 2.2 | 10.1 |
| Specific processed intermediates (SIGs) | 2.2 | 32.9 |
| MFN duty free | 35.0 | 11.5 |
| Capital goods | 7.8 | 15.8 |
| Consumption goods | 7.4 | 38.5 |
| Primary Intermediates | 7.2 | 18.5 |
| Generic processed intermediates (GIGs) | 4.2 | -15.3 |
| Specific processed intermediates (SIGs) | 8.3 | 1.1 |
| Data: Global Trade Atlas Source: Office of the Chief Economist, Global Affairs Canada | ||
Table 5: Intra-CPTPP trade of transport equipment product group, by FTA relationship and BEC categories and tariff preferences
| 2021 Trade value, $US billion | % growth from 2018 | |
|---|---|---|
| Intra-CPTPP – “existing” FTA relationships | 31.1 | -4.6 |
| Affected by CPTPP | 20.3 | -0.2 |
| Capital goods | 5.8 | 8.8 |
| Consumption goods | 11.0 | 4.6 |
| Primary Intermediates | N/A | N/A |
| Generic processed intermediates (GIGs) | 0.9 | -6.5 |
| Specific processed intermediates (SIGs) | 2.5 | -26.8 |
| MFN duty free | 10.8 | -11.9 |
| Capital goods | 0.8 | 13.8 |
| Consumption goods | 1.1 | -7.8 |
| Primary Intermediates | 0.0 | -82.4 |
| Generic processed intermediates (GIGs) | 1.6 | 20.5 |
| Specific processed intermediates (SIGs) | 7.3 | -19.3 |
| Intra-CPTPP – “new” FTA relationships | 12.0 | 5.5 |
| Affected by CPTPP | 6.4 | 8.2 |
| Capital goods | 0.5 | 30.1 |
| Consumption goods | 4.0 | -3.4 |
| Primary Intermediates | N/A | N/A |
| Generic processed intermediates (GIGs) | 0.4 | 28.4 |
| Specific processed intermediates (SIGs) | 1.5 | 38.7 |
| MFN duty free | 5.7 | 2.6 |
| Capital goods | 0.8 | 6.6 |
| Consumption goods | 1.9 | 18.5 |
| Primary Intermediates | 0.0 | -85.6 |
| Generic processed intermediates (GIGs) | 0.6 | 43.5 |
| Specific processed intermediates (SIGs) | 2.4 | -14.1 |
| Data: Global Trade Atlas Source: Office of the Chief Economist, Global Affairs Canada | ||
Table 6: Intra-CPTPP trade of construction and housing materials product group, by FTA relationship and BEC categories and tariff preferences
| 2021 Trade value, $US billion | % growth from 2018 | |
|---|---|---|
| Intra-CPTPP – “existing” FTA relationships | 23.2 | 6.3 |
| Affected by CPTPP | 6.3 | 8.1 |
| Capital goods | 0.8 | 9.0 |
| Consumption goods | 1.7 | 15.5 |
| Primary Intermediates | 0.0 | 35.9 |
| Generic processed intermediates (GIGs) | 1.8 | 8.5 |
| Specific processed intermediates (SIGs) | 2.0 | 1.8 |
| MFN duty free | 16.9 | 5.6 |
| Capital goods | 3.2 | 7.1 |
| Consumption goods | 1.6 | 2.6 |
| Primary Intermediates | 0.5 | 16.1 |
| Generic processed intermediates (GIGs) | 4.5 | -1.5 |
| Specific processed intermediates (SIGs) | 7.0 | 10.1 |
| Intra-CPTPP – “new” FTA relationships | 7.6 | 12.6 |
| Affected by CPTPP | 2.7 | 20.4 |
| Capital goods | 0.3 | 23.0 |
| Consumption goods | 0.7 | 52.9 |
| Primary Intermediates | 0.0 | -1.2 |
| Generic processed intermediates (GIGs) | 1.3 | 4.3 |
| Specific processed intermediates (SIGs) | 0.4 | 34.6 |
| MFN duty free | 4.8 | 8.7 |
| Capital goods | 1.7 | 59.5 |
| Consumption goods | 0.3 | 80.9 |
| Primary Intermediates | 0.2 | 42.2 |
| Generic processed intermediates (GIGs) | 1.5 | -24.4 |
| Specific processed intermediates (SIGs) | 1.2 | 8.4 |
| Data: Global Trade Atlas Source: Office of the Chief Economist, Global Affairs Canada | ||
Annex 3: Case Studies
Case Studies provided by Japan
Case study 1: Various government supports have helped a Japanese SME enjoy the business opportunity CPTPP created between new FTA partners (Japan-Canada)
- At CBF Committee workshop in September 2020, a Japanese researcher presented an analysis on how the government can promote the utilization of CPTPP.
- Based on the analysis and voices from business sectors, the GOJ took various initiatives to promote utilization of CPTPP by SMEs, including support for origin procedures.
- As a result, a family-run SME of Japan which specializes in manufacturing traditional clasps is able to enjoy the preferential tariff rate and increased its exports.
In September 2020, CBF Committee Workshop was organized under Canada’s initiatives, where Professor Urata from Japan presented his research, which asked two main questions of firms in Japan: 1) Why do some firms not use the benefits provided by free trade agreements (FTA) when they export? and 2) What government policies can promote the use of FTAs by businesses?
Some general reasons for not using FTAs in exports include: 1) it is not requested by the importers, 2) the general tariff rates for products are low enough already which does not justify the extra work to benefit from the further reduced tariff rate, 3) export value and/or volume is too low, 4) it costs too much to utilize the rules of origin (ROO), and 5) lack of knowledge about the benefits resulting from the FTAs.
Professor Urata also highlighted the fact that SMEs are less likely to use FTAs than large firms. The lack of knowledge about FTAs and the cost of using FTAs, in particular as it relates to obtaining a certificate of origin (CO), were often reported as reasons for SMEs’ lack of FTA usage.
Firms’ requests to governments regarding FTAs include: more seminar information about how to use the existing FTAs, the digitalization of COs, and the simplification of information searches about FTAs. These requests are what Professor Urata outlined as policy recommendations.
In response to the voices from business sectors and recommendation from the academia, Japanese government has actively promoted utilization of CPTPP by SMEs who are not very familiar with EPAs (economic partnership agreements) including CPTPP. Here are some actions that Japanese government has taken.
- Organized Seminars
METI and JETRO as well as MOFA organized seminars and workshops targeting companies including SMEs, supporting organizations, financial institutions, and industry associations.
- Published Casebooks
- Published Manuals https://www.jetro.go.jp/ext_images/theme/wto-fta/tpp/TPP11_kaisetsu.pdf
- Established EPA Consultation Desk https://www.jetro.go.jp/services/advice/epa.html
- Provided Databases
- A database to search tariff rates including FTAs. https://www.jetro.go.jp/theme/export/tariff/
- A database to search list of FTAs in the world. https://www.jetro.go.jp/theme/wto-fta/ftalist/
- Offered E-learning Materials https://www.jetro.go.jp/theme/wto-fta/epa.html
- Created Support tools for paper works such as the declaration of origin form etc. https://www.jetro.go.jp/news/releases/2021/910f90326e73fea7.html
As a result of the efforts explained in the above, exports of Japanese traditional products to Canada by a Japanese SME has successfully started.
This family-run SME specializes in manufacturing traditional clasps called Kohaze which is used for Tabi (traditional Japanese socks). The company utilized various supports of government and participated in overseas events hosted by government to promote SMEs exports. Upon entry into force of CPTPP, with coordination with Canadian importers and with supports from JETRO, this company was able to prepare the declaration of origin as the exporter/the importer and has enjoyed increase of exports under preferential tariff treatment of CPTPP.
Case study 2: Japan’s Automotive and parts
- Utilizing CPTPP for exports to a new FTA partner such as Canada.
- For exports to countries with existing EPAs, there were cases of switching to CPTPP due to its flexible PSR.
Automotive manufactures are utilizing CPTPP for export to Canada, which is a new EPA/FTA relationship with Japan. The impact of tariff reductions for business users is significant, as tariffs on passenger cars (base rate of 6.1%) were eliminated in 2022, the fifth year of entry into force of CPTPP.
For passenger cars, there were several cases in which exporters switched the Japan-Mexico Economic Partnership Agreement (JMEPA) to CPTPP. Under JMEPA, the Product-Specific Rules of Origin (PSR) for passenger cars were difficult to use as two rules (the Change in Tariff Classification (CTC) and the Regional Value Content (RVC) of not less than 65 percent) must be satisfied, while under CPTPP, only one rule (the RVC was 55 percent or 45 percent depending on the method of calculation) needs to be satisfied. This is an example of a product that had a difficulty in satisfying the PSR under the existing EPAs because of a strict PSR, but the same product can satisfy the PSR under CPTPP, and enjoy preferential tariff treatment.
Japan has existing EPA/FTA relationship with the CPTPP Parties either through bilateral or plurilateral EPAs, except with Canada and New Zealand when CPTPP took effect. However, some companies chose to utilize or switch to CPTPP, as its PSR is easier to be satisfied, or its tariffs are more favorable than existing EPAs.
For example, for exports to Viet Nam, companies can use four EPAs – Japan-Vietnam EPA, AJCEP, CPTPP and RCEP - but some companies have started to use CPTPP because only CPTPP provides the tariff reduction for passenger cars with a cylinder capacity exceeding 3,000cc.
As for UK’s accession to CPTPP, some companies are considering switching to CPTPP at a time when the tariff rate under CPTPP becomes competitive compared to that of Japan-UK CEPA, since the PSR for passenger cars under CPTPP is more user-friendly than that of Japan-UK CEPA.
In addition to the cases of finished cars, there are cases where automotive parts such as transmissions are exported to Mexico utilizing CPTPP, which is a good example of CPTPP contributing to strengthening the supply chain.
In this way, in addition to exports to a new EPA/FTA relationship for Japan, such as Canada, various cases are found in which companies seeks to maximize the benefits of EPA/FTA by switching from existing EPAs to CPTPP.
Case study 3: Japan’s Steel
- In exporting certain steel products to Mexico, companies are utilizing CPTPP, whose PSRs are more flexible than the existing bilateral EPA.
- The steel products destined for Mexico are processed in that country into automobile motors and other products, and exported to third countries such as the US, contributing to strengthening the supply chain.
There are cases where companies switched the Japan-Mexico Economic Partnership Agreement (JMEPA) to CPTPP for exports to Mexico because the Product-Specific Rules of Origin (PSR) was more flexible under CPTPP than under JMEPA. Steel products (Chapter 72) were difficult to satisfy the PSR of JMEPA because its PSR requires the Change in Tariff Classification (CTC) at the two-digit level of the HS code (Change of Chapter: CC), and alloys and scrap as raw materials are also classified in the same Chapter 72 as final products. On the other hand, companies started utilizing CPTPP because the PSR of CPTPP for the same products requires CTC at the four-digit of the HS code (Change of Heading: CTH), and if produced in Japan, they are qualified as originating goods under CPTPP.
In terms of supply chain development, the steel products exported to Mexico from Japan are processed in Mexico into automobile motors and transformers, and then exported to the third countries such as the US, which is a good example of CPTPP having contributed to strengthening the supply chain.
- Date modified: