
Statistical Report on International Assistance 2022-2023
ISSN 2293-4642
Table of contents
- Introduction
- About this report
- Scope of international assistance statistics
- Canada’s international assistance by department or source
- Canada uses a whole-of-government approach
- Geographic distribution of Canada’s international assistance
- Responding quickly and effectively to international humanitarian crises
- Total official support for sustainable development
- Statistical tables
- Section D: Canadian international assistance by recipient
- Appendices
Introduction
About this report
In accordance with the Official Development Assistance Accountability Act (ODAAA, or the Act), the Minister of International Development is required to issue the following key reports on behalf of the Government of Canada within 1 year of the end of each fiscal year:
- Report to Parliament on the Government of Canada’s International Assistance, which is a narrative and descriptive overview of Canada’s development funding, and is tabled in Parliament
- Statistical Report on International Assistance (this report)
The Statistical Report on International Assistance is produced annually to further enhance the efficiency and accountability of Canada’s international assistance. This report covers the reporting period from April 1, 2022, to March 31, 2023 (fiscal year 2022 to 2023). It complements the Report to Parliament on the Government of Canada’s International Assistance 2022 to 2023. As 1 of the 2 annual reports legislated by the ODAAA, the report provides a single source for statistics on international assistance expenditures, including official development assistance (ODA) and other official assistance, for Canada as a whole.
Understanding this report
This report is presented on an expenditures basis and uses international standards that facilitate historical comparisons of Canada’s ODA as well as comparisons with reports from other international assistance donors. Expenditures are counted when the payment is recorded in the accounting systems, with the understanding that organizations receiving Canadian funding would use it over the length of the project. Repayments of loans previously extended to developing countries are shown for information purposes (see Appendix 1). Certain costs (e.g. refugee resettlement costs) are calculated based on agreed-upon international standards. Such standards are regularly revised in forums such as the Development Assistance Committee of the Organisation for Economic Co-operation and Development (OECD-DAC).
Transparency and accountability
The Government of Canada is committed to ensuring that information on its international assistance funding is open and transparent.
Reports are prepared in accordance with the ODAAA to further enhance the efficiency and accountability of Canada’s international assistance. Data is available on the Open Government Portal and the DevData dashboard.
In addition, Global Affairs Canada provides detailed information on its international assistance projects on the Project Browser. This information is also published daily in accordance with the standard of the International Aid Transparency Initiative (IATI), of which Canada is a member.
Department of Finance Canada and the International Development Research Centre also publish data in accordance with the IATI standard.
Scope of international assistance statistics
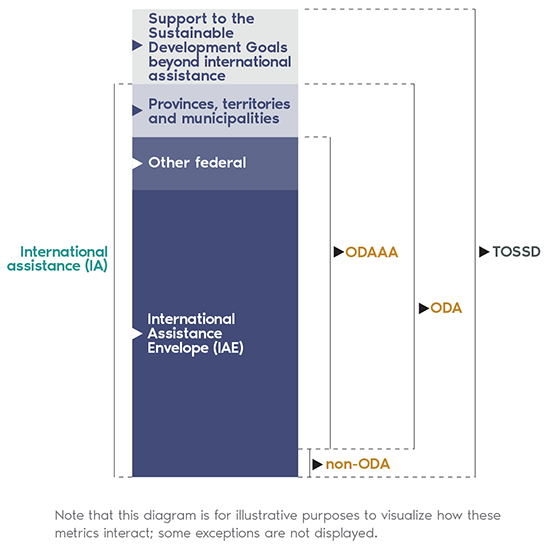
Total official support for sustainable development (TOSSD) encompasses all officially supported resource flows to promote sustainable development in developing countries and to support development enablers and address global challenges at regional or global levels. As such, it includes almost all reported ODA. TOSSD also includes private resources mobilized by the public sector (e.g. through public-private partnerships).
International assistance (IA) includes all financial resources and activities provided by Canadian governments (federal, provincial, territorial or municipal) to support economic, environmental, social and political development in other (primarily developing) countries.
Text version
Total official support for sustainable development (TOSSD) includes international assistance and support to the sustainable development goals beyond international assistance.
International assistance (IA) includes funding from the international assistance envelope (IAE) and ODA from other federal sources, provinces, territories and municipalities.
Official development assistance (ODA) includes ODA as per the Official Development Assistance Accountability Act and eligible funding from other federal department, provinces, territories and municipalities.
The Official Development Assistance Accountability Act (ODAAA) includes most funding from the international assistance envelope and eligible funding from other federal sources.
Non-ODA eligible activities funded by the international assistance envelope may be reported as TOSSD.
The international assistance envelope (IAE) is a dedicated, whole-of-government pool of resources that funds the majority of Canada’s international assistance. Most of the activities funded by the IAE qualify as official development assistance (ODA) and comply with the requirements of Canada’s Official Development Assistance Accountability Act.
Non-ODA eligible activities funded by the international assistance envelope include, for example, security, conflict prevention, stabilization or peacebuilding initiatives that do not meet ODA eligibility due to country eligibility or activity type.
Official development assistance (ODA) represents the vast majority of Canada’s international assistance. Canada accepts 2 definitions of ODA:
- ODA, as defined by the Development Assistance Committee of the Organisation for Economic Co-operation and Development (OECD-DAC), is defined as assistance that flows to countries and territories on the DAC list of ODA recipients and to multilateral institutions. Funding must be provided by official agencies, including state and local governments, or by their executive agencies. Each transaction must be administered with the promotion of the economic development and welfare of developing countries as its main objective and/or is concessional in character.
- Canada’s ODA definition under the ODAAA is compatible with the OECD-DAC definition above but must also meet the 3 criteria set out in subsection 4.1 of the Act, which are: a) contribute to poverty reduction; b) take into account the perspectives of the poor; and c) be consistent with international human rights standards. International assistance to alleviate the effects of a disaster or other emergencies is also counted as ODA under the Act.
Canada’s international assistance by department or source
Figures in millions of Canadian dollars.
| Department/Source | International assistance | of which | ||
|---|---|---|---|---|
| Programs funded by the IAE | ODA: ODAAA | ODA: OECD-DAC* | ||
| Departments reporting under the ODAAA | ||||
| Global Affairs Canada | 6,978.22 | 6,927.44 | 6,708.38 | 6,708.38 |
| Department of Finance Canada** | 6,360.15 | 5,860.15 | 2,906.07 | 2,906.07 |
| Immigration, Refugees and Citizenship Canada*** | 1,705.33 | 1.84 | 1,705.33 | 1,705.33 |
| Public Health Agency of Canada | 181.09 | - | 181.09 | 181.09 |
| International Development Research Centre | 180.04 | 180.04 | 180.04 | 180.04 |
| Environment and Climate Change Canada | 52.02 | 40.85 | 52.02 | 52.02 |
| Royal Canadian Mounted Police | 15.48 | 15.48 | 14.57 | 14.57 |
| Canadian Institutes of Health Research | 14.51 | - | 14.51 | 14.51 |
| Department of National Defence | 8.47 | - | 8.47 | 8.47 |
| Employment and Social Development Canada - Labour Program | 6.86 | - | 6.86 | 6.86 |
| Canada Revenue Agency | 6.20 | 4.01 | 6.20 | 6.20 |
| Natural Resources Canada | 4.75 | 4.60 | 4.75 | 4.75 |
| Innovation, Science and Economic Development Canada | 0.94 | - | 0.94 | 0.94 |
| Parks Canada | 0.78 | - | 0.78 | 0.78 |
| Canada Post - Universal Postal Union | 0.44 | - | 0.44 | 0.44 |
| Statistics Canada | 0.16 | - | 0.16 | 0.16 |
| Canadian Space Agency | 0.11 | - | 0.11 | 0.11 |
| Canadian Intellectual Property Office | 0.03 | - | 0.03 | 0.03 |
| Canadian Museum of Nature | 0.01 | - | 0.01 | 0.01 |
| Public Service Commission of Canada | 0.01 | - | 0.01 | 0.01 |
| Transport Canada**** | 0.00 | - | 0.00 | 0.00 |
| Services received without charge by Global Affairs Canada | 25.23 | 10.70 | 25.23 | 25.23 |
| Subtotal - Departments reporting under the ODAAA | 15,540.82 | 13,045.12 | 11,815.99 | 11,815.99 |
| % of international assistance | 84% | 76% | 76% | |
| Other departments, sources | ||||
| Cost of refugees in Canada (1st year) - provinces and territories | 461.03 | - | - | 461.03 |
| Provinces, territories and municipalities | 48.03 | - | - | 48.03 |
| Subtotal - Other departments, sources | 509.06 | - | - | 509.06 |
| Total | 16,049.89 | 13,045.12 | 11,815.99 | 12,325.05 |
| % of total international assistance | 81% | 74% | 77% | |
* The “ODA: OECD-DAC” figures in this table are presented on a fiscal-year basis, in Canadian dollars, to allow for comparing and contrasting of reporting under the ODAAA versus the ODA reported to the OECD-DAC. When Canada reports to the OECD-DAC, figures are reported on a calendar-year basis in U.S. dollars. Their depiction in this table is for illustrative purposes only. Only the grant equivalent of repayable instruments is reported as ODA under the ODAAA and OECD-DAC; reflows on repayable contributions and loans are disclosed in Table A as information items only. ** In 2022-2023, the Department of Finance Canada provided $4.85 billion in the form of loans to help meet Ukraine’s urgent balance of payments needs and support its macroeconomic stability. Only the grant equivalent of these loans is reported as ODA under the ODAAA and OECD. *** Includes costs of refugees in Canada (first year) and other projects. As per the OECD-DAC guidelines, the first year of federal and provincial support to refugees is reportable as ODA. The exceptional increase in fiscal year 2022-2023 is the result of higher numbers of resettled refugee arrivals and asylum seekers, and the establishment of the Canada-Ukraine authorization for emergency travel. **** Figures in this table are represented in millions of Canadian dollars; Transport Canada’s 2022-2023 contributions totaled $4,000. | ||||
Canada uses a whole-of-government approach
Text version
| Department | Total |
|---|---|
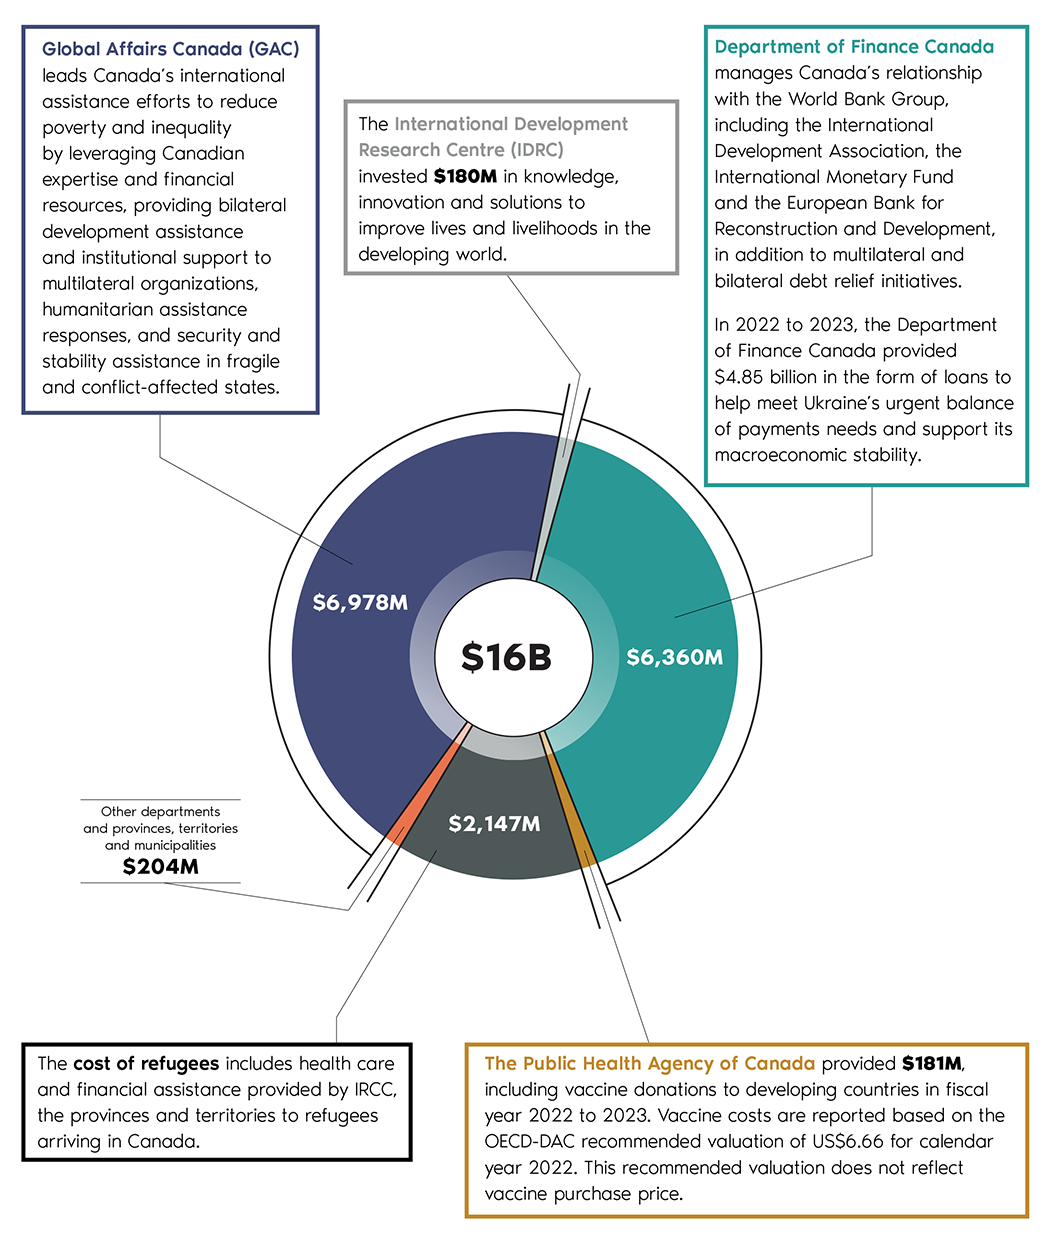
| Global Affairs Canada | $6,978M |
| Department of Finance Canada | $6,360M |
| International Development Research Centre | $180M |
| Cost of refugees in Canada: IRCC and provinces | $2,147M |
| Public Health Agency of Canada | $181M |
| Other departments and provinces, territories and municipalities | $204M |
| Total | $16B |
| Department | Total |
|---|---|
Global Affairs Canada (GAC) leads Canada’s international assistance efforts to reduce poverty and inequality by leveraging Canadian expertise and financial resources, providing bilateral development assistance and institutional support to multilateral organizations, humanitarian assistance responses, and security and stability assistance in fragile and conflict-affected states. | $6,978M |
Department of Finance Canada manages Canada’s relationship with the World Bank Group, including the International Development Association, the International Monetary Fund and the European Bank for Reconstruction and Development, in addition to multilateral and bilateral debt relief initiatives. | $6,360M |
The International Development Research Centre (IDRC) invested $180M in knowledge, innovation and solutions to improve lives and livelihoods in the developing world. | $180M |
The cost of refugees includes health care and financial assistance provided by IRCC, the provinces and territories to refugees arriving in Canada. | $2,147M |
The Public Health Agency of Canada provided $181M, including vaccine donations to developing countries in fiscal year 2022 to 2023. Vaccine costs are reported based on the OECD-DAC recommended valuation of US$6.66 for calendar year 2022. This recommended valuation does not reflect vaccine purchase price. | $181M |
Other departments and provinces, territories and municipalities | $204M |
Total (in center) | $16B |
Geographic distribution of Canada’s international assistance
Text version
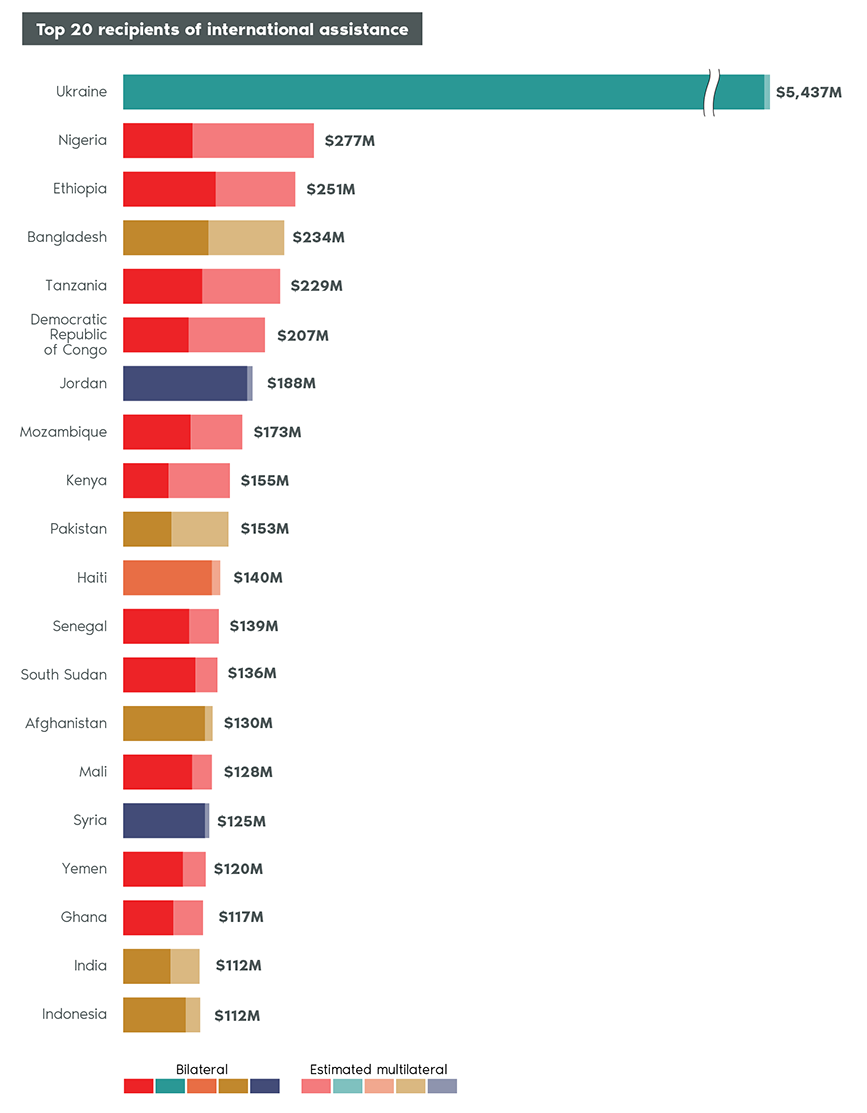
Top 20 recipients of international assistance
| Country | Bilat | Multi | Total |
|---|---|---|---|
| Ukraine | $5,400M | $37M | $5,437M |
| Nigeria | $101M | $176M | $277M |
| Ethiopia | $131M | $119M | $251M |
| Bangladesh | $124M | $110M | $234M |
| Tanzania | $115M | $113M | $229M |
| Democratic Republic of Congo | $95M | $111M | $207M |
| Jordan | $180M | $8M | $188M |
| Mozambique | $98M | $75M | $173M |
| Kenya | $66M | $89M | $155M |
| Pakistan | $70M | $83M | $153M |
| Haiti | $129M | $12M | $140M |
| Senegal | $96M | $43M | $139M |
| South Sudan | $105M | $32M | $136M |
| Afghanistan | $119M | $11M | $130M |
| Mali | $100M | $29M | $128M |
| Syria | $119M | $6M | $125M |
| Yemen | $87M | $33M | $120M |
| Ghana | $73M | $43M | $117M |
| India | $69M | $42M | $112M |
| Indonesia | $91M | $21M | $112M |
*These costs are global in nature and cannot be assigned by country or sector. Consult Table D1 for more details
Text version
| Continent Totals + Bi/Multi Split (Circles) | ||
|---|---|---|
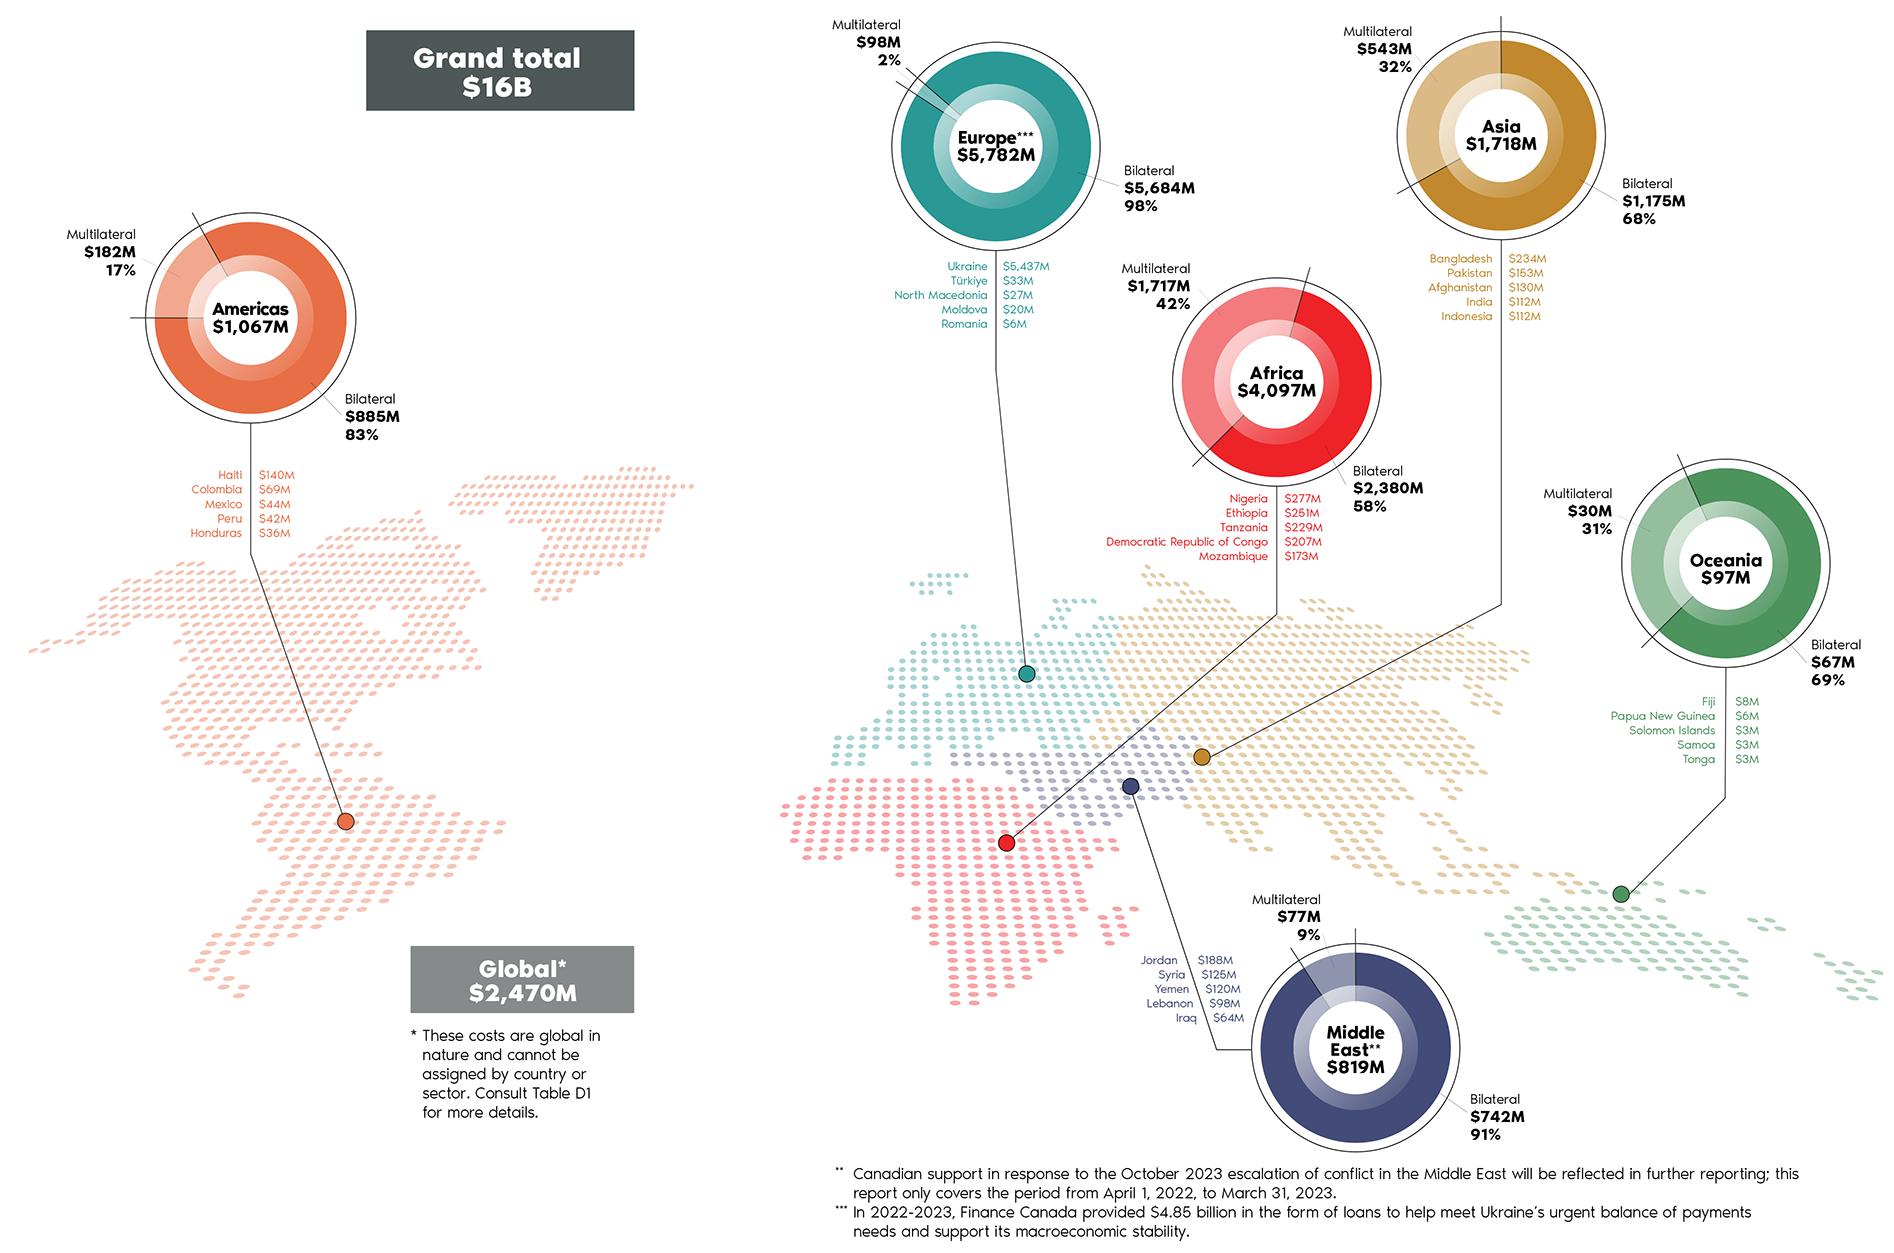
| Africa | $4,097M | |
| Bilateral | $2,380M | 58% |
| Multilateral | $1,717M | 42% |
| Americas | $1,067M | |
| Bilateral | $885M | 83% |
| Multilateral | $182M | 17% |
| Asia | $1,718M | |
| Bilateral | $1,175M | 68% |
| Multilateral | $543M | 32% |
| Europe | $5,782M | |
| Bilateral | $5,684M | 98% |
| Multilateral | $98M | 2% |
| Middle East | $819M | |
| Bilateral | $742M | 91% |
| Multilateral | $77M | 9% |
| Oceania | $97M | |
| Bilateral | $67M | 69% |
| Multilateral | $30M | 31% |
| Global | $2,470M | |
| Continent Top 5 (Under Circles) | |
|---|---|
| Africa | |
| Nigeria | $277M |
| Ethiopia | $251M |
| Tanzania | $229M |
| Democratic Republic of Congo | $207M |
| Mozambique | $173M |
| Americas | |
| Haiti | $140M |
| Colombia | $69M |
| Mexico | $44M |
| Peru | $42M |
| Honduras | $36M |
| Asia | |
| Bangladesh | $234M |
| Pakistan | $153M |
| Afghanistan | $130M |
| India | $112M |
| Indonesia | $112M |
| Europe | |
| Ukraine | $5,437M |
| Türkiye | $33M |
| North Macedonia | $27M |
| Moldova | $20M |
| Romania | $6M |
| Middle East | |
| Jordan | $188M |
| Syria | $125M |
| Yemen | $120M |
| Lebanon | $98M |
| Iraq | $64M |
| Oceania | |
| Fiji | $8M |
| Papua New Guinea | $6M |
| Solomon Islands | $3M |
| Samoa | $3M |
| Tonga | $3M |
** Canadian support in response to the October 2023 escalation of conflict in the Middle East will be reflected in further reporting; this report only covers the period from April 1, 2022, to March 31, 2023.
*** In 2022-2023, Finance Canada provided $4.85 billion in the form of loans to help meet Ukraine’s urgent balance of payments needs and support its macroeconomic stability.
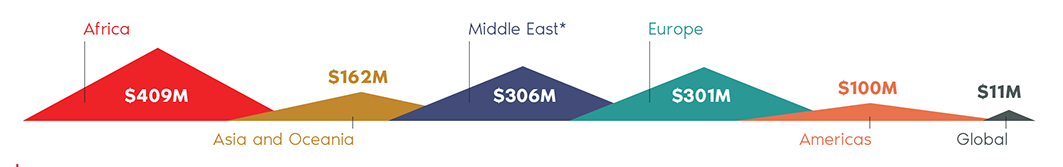
Responding quickly and effectively to international humanitarian crises
Text version
| Continent | Total |
|---|---|
| Africa | $409M |
| Asia and Oceania | $162M |
| Middle East | $306M |
| Europe | $301M |
| Americas | $100M |
| Global | $11M |
The figures above represent total humanitarian assistance by region, including bilateral and imputed multilateral assistance. Canadian assistance is provided through experienced humanitarian organizations and not through governments.
Text version
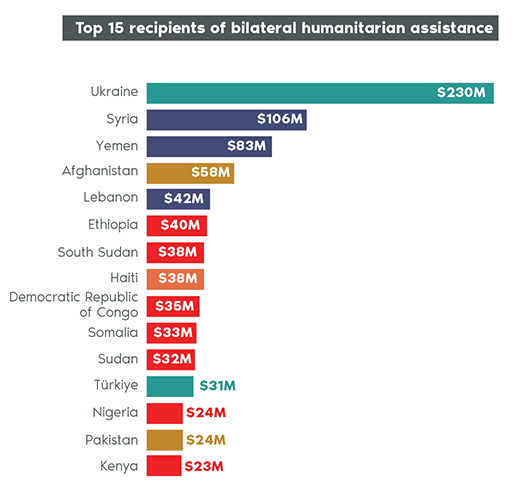
Top 15 recipients of bilateral humanitarian assistance
| Recipient | Total |
|---|---|
| Ukraine | $230M |
| Syria | $106M |
| Yemen | $83M |
| Afghanistan | $58M |
| Lebanon | $42M |
| Ethiopia | $40M |
| South Sudan | $38M |
| Haiti | $38M |
| Democratic Republic of Congo | $35M |
| Somalia | $33M |
| Sudan | $32M |
| Türkiye | $31M |
| Nigeria | $24M |
| Pakistan | $24M |
| Kenya | $23M |
Ukraine: Humanitarian needs in Ukraine continue to be significant, with an estimated 17.6 million people (over 30% of the population) requiring humanitarian assistance as of March 2023. Canada is supporting humanitarian partners in responding to essential needs such as shelter, water, sanitation, food and urgent health care, such as sexual and reproductive health, as well as protection needs amid growing risks of sexual exploitation and abuse, gender-based violence and human trafficking.
Syria: Humanitarian needs in Syria were the highest since the Syrian conflict began in 2011. The 15 million people deemed in need of humanitarian assistance as of March 2023 were also considered food insecure. The humanitarian crisis continued to be driven by worsening socio-economic conditions, ongoing conflict, significant protracted displacement, disease outbreaks and natural disasters. The February 2023 earthquakes drove millions more people into humanitarian need and exacerbated protection risks of vulnerable people. Canada supported a multi-sectoral response across Syria , with a particular focus on emergency health, including sexual and reproductive health rights services, protection, and nutrition and food security.
Yemen: High levels of humanitarian needs in Yemen continued to be driven by conflict, economic deterioration, weakened infrastructure, a fuel crisis, disease outbreaks and natural disasters. Food insecurity remained widespread, and child malnutrition rates continue to be among the highest globally. More than 21 million people were in need of humanitarian assistance as of March 2023, the majority of whom required health and protection assistance. Canada supported life-saving humanitarian interventions targeting health, food security and protection, and water, sanitation and hygiene.
* Canadian support in response to the October 2023 escalation of conflict in the Middle East will be reflected in further reporting; this report only covers the period from April 1, 2022, to March 31, 2023.
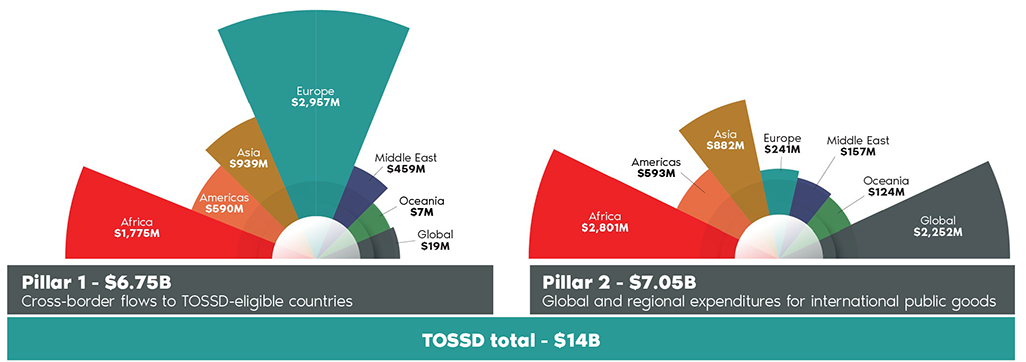
Total official support for sustainable development
Total official support for sustainable development (TOSSD) encompasses all officially supported resource flows to promote sustainable development in developing countries, support developing enablers and address global challenges. TOSSD is tracked on a calendar-year basis; figures on this page represent expenditures in the 2022 calendar year.
Text version
| TOSSD total: | $14B |
| Amounts mobilized: | $55M |
| TOSSD by pillar | ||
|---|---|---|
| Continent | Pillar 1 | Pillar 2 |
| Africa | $1,775M | $2,801M |
| Americas | $590M | $593M |
| Asia | $939M | $882M |
| Europe | $2,957M | $241M |
| Middle East | $459M | $157M |
| Oceania | $7M | $124M |
| Global | $19M | $2,252M |
| Total | $6.75B | $7.05B |
In 2022, Canada mobilized an additional $55M-worth of private investment in support of the Sustainable Development Goals.
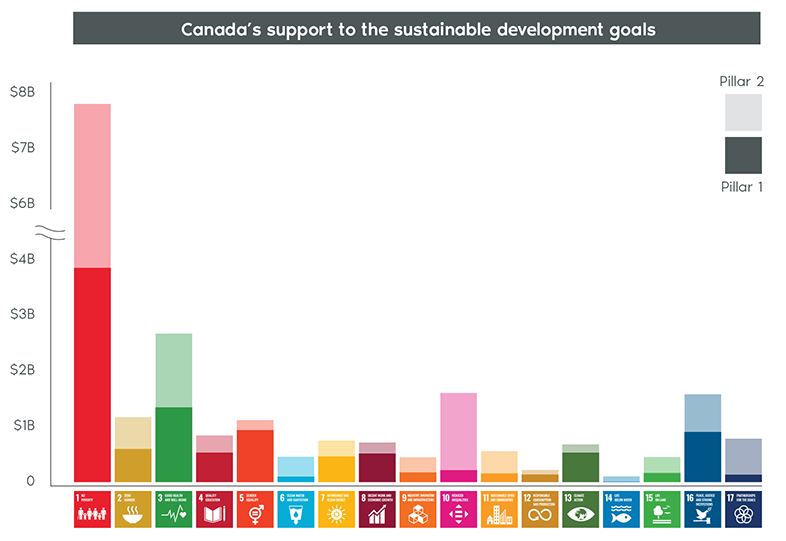
The 2030 Agenda for Sustainable Development is a shared global vision for a better world that leaves no one behind. Its 17 Sustainable Development Goals (SDGs), which are interrelated and mutually reinforcing, articulate a roadmap towards greater inclusion, peace and prosperity, balanced between the 3 dimensions of sustainable development: social, economic and environmental and grounded in human rights principles. Canada demonstrates leadership, at home and abroad, in shaping a sustainable and resilient future for all.
Text version
Canada’s support to the Sustainable Development Goals
| SDGs (Bar Chart) | ||
|---|---|---|
| SDG | Pillar 1 | Pillar 2 |
| SDG 1 | 3,862 | 3,782 |
| SDG 2 | 599 | 573 |
| SDG 3 | 1,349 | 1,326 |
| SDG 4 | 533 | 309 |
| SDG 5 | 937 | 181 |
| SDG 6 | 100 | 360 |
| SDG 7 | 465 | 284 |
| SDG 8 | 515 | 199 |
| SDG 9 | 176 | 274 |
| SDG 10 | 218 | 1,391 |
| SDG 11 | 158 | 403 |
| SDG 12 | 139 | 81 |
| SDG 13 | 533 | 148 |
| SDG 14 | 9 | 97 |
| SDG 15 | 167 | 286 |
| SDG 16 | 906 | 678 |
| SDG 17 | 136 | 649 |
Statistical tables
Section A: Canadian international assistance
A: International assistance by government source and channel
This table includes ODA and other official assistance expenditures in millions of Canadian dollars.
| 2020-2021 | 2021-2022 | 2022-2023 | ||||
|---|---|---|---|---|---|---|
| Total | Bilateral | Multilateral | of which ODAAA | |||
| Programs funded by the international assistance envelope | 7,660.85 | 7,207.60 | 13,045.12 | 10,341.88 | 2,703.23 | 9,738.32 |
| Global Affairs Canada | 6,954.15 | 5,909.08 | 6,927.44 | 5,619.84 | 1,307.60 | 6,657.60 |
| Geographic programs | 1,568.94 | 1,314.03 | 1,475.58 | 1,428.88 | 46.70 | 1,472.04 |
| of which the Canada Fund for Local Initiatives | 32.98 | 23.59 | 26.33 | 26.33 | - | 26.33 |
| Partnerships for Development Innovation | 510.13 | 275.36 | 333.11 | 333.11 | - | 333.07 |
| Global Issues and Development | 4,154.42 | 3,656.33 | 4,397.55 | 3,158.89 | 1,238.66 | 4,251.91 |
| Global initiatives | 3,843.91 | 3,260.58 | 3,918.28 | 3,158.89 | 759.39 | 3,772.64 |
| Payments to international financial institutions | 310.51 | 395.75 | 479.27 | - | 479.27 | 479.27 |
| International Security and Political Affairs | 378.39 | 307.31 | 348.04 | 326.29 | 21.75 | 227.42 |
| Anti-Crime Capacity Building Program | 13.06 | 15.50 | 15.83 | 15.83 | - | 0.61 |
| Counter-Terrorism Capacity Building Program | 17.85 | 26.85 | 29.73 | 29.73 | - | 4.37 |
| Non-Proliferation and Security Threat Reduction | 167.20 | 83.94 | 87.61 | 87.61 | - | 30.80 |
| Peace and Stabilization Operations Program | 140.64 | 138.90 | 175.81 | 175.81 | - | 158.02 |
| International Security Policy | 22.83 | 20.75 | 16.50 | - | 16.50 | 16.39 |
| Office of Human Rights, Freedoms and Inclusions | 16.81 | 21.37 | 18.07 | 12.82 | 5.25 | 17.23 |
| Other programs | 4.50 | 4.50 | - | - | ||
| International Business Development, Investment and Innovation | 1.85 | 4.17 | 4.56 | 4.56 | - | 4.56 |
| Strategic Policy | 6.46 | 6.35 | 9.17 | 8.69 | 0.48 | 9.17 |
| Other programs | 0.12 | 0.02 | 0.12 | 0.10 | 0.02 | 0.12 |
| Operations and management | 265.31 | 275.47 | 291.23 | 291.23 | - | 291.23 |
| Services rendered abroad | 68.54 | 70.04 | 68.07 | 68.07 | - | 68.07 |
| Memo: Reflows from repayable contributions and loans (1) | -71.16 | -170.98 | -74.46 | -48.47 | -25.99 | |
| Department of Finance Canada (2) | 511.50 | 1,107.87 | 5,860.15 | 4,465.00 | 1,395.15 | 2,824.11 |
| Ukraine loan | 4,350.00 | 4,350.00 | - | 1,530.57 | ||
| International Development Association (IDA) | 423.24 | 423.24 | 911.44 | - | 911.44 | 911.44 |
| IDA - Concessional Partner Loan borrowing program | - | 360.65 | 386.75 | - | 386.75 | 170.14 |
| World Bank - Ukraine Relief, Recovery, Reconstruction and Reform Trust Fund | - | - | 115.00 | 115.00 | - | 115.00 |
| International Monetary Fund - Resilience and Sustainability Trust | - | 40.14 | - | 40.14 | 40.14 | |
| IDA - Multilateral Debt Relief Initiative | 34.09 | 32.53 | 32.20 | - | 32.20 | 32.20 |
| African Development Fund - Multilateral Debt Relief Initiative | 3.80 | 20.60 | 24.62 | - | 24.62 | 24.62 |
| International Finance Corporation | - | 220.84 | - | - | - | - |
| International Monetary Fund - Poverty Reduction and Growth Trust | - | 50.00 | - | - | - | - |
| Asian Infrastructure Investment Bank (AIIB) (3) | 50.37 | - | - | - | - | - |
| International Development Research Centre | 152.74 | 141.34 | 180.04 | 180.04 | - | 180.04 |
| Royal Canadian Mounted Police | 14.14 | 20.23 | 15.48 | 15.48 | - | 14.57 |
| Services received without charge from Public Services and Procurement Canada (4) | 11.28 | 10.55 | 10.70 | 10.70 | - | 10.70 |
| Environment and Climate Change Canada | 9.46 | 11.92 | 40.85 | 40.37 | 0.48 | 40.85 |
| Canada Revenue Agency | 5.25 | 5.18 | 4.01 | 4.01 | - | 4.01 |
| Natural Resources Canada | 2.32 | 1.42 | 4.60 | 4.60 | - | 4.60 |
| Immigration, Refugees and Citizenship Canada | - | - | 1.84 | 1.84 | - | 1.84 |
| Other government sources | 768.92 | 1,190.82 | 3,004.77 | 2,932.84 | 71.93 | 2,077.66 |
| Global Affairs Canada | 16.12 | 44.95 | 50.78 | 6.03 | 44.75 | 50.78 |
| International Youth Internship Program | 0.56 | 2.40 | 3.42 | 3.42 | - | 3.42 |
| International Scholarships Program | 1.05 | 1.96 | 2.51 | 2.51 | - | 2.51 |
| Other programs | 14.51 | 40.59 | 44.84 | 0.09 | 44.75 | 44.84 |
| ODA-eligible imputed costs | 594.92 | 921.75 | 2,161.31 | 2,161.31 | - | 1,700.28 |
| Cost of refugees in Canada (1st year) - IRCC (5) | 351.25 | 447.76 | 1,685.75 | 1,685.75 | - | 1,685.75 |
| Cost of refugees in Canada (1st year) - provinces and territories | 229.88 | 459.54 | 461.03 | 461.03 | - | - |
| Imputed foreign student subsidies | - | - | - | - | - | - |
| Services received without charge by Global Affairs Canada (4) | 13.79 | 14.45 | 14.53 | 14.53 | - | 14.53 |
| Provinces, territories and municipalities | 32.96 | 56.54 | 48.03 | 31.40 | 16.63 | - |
| Quebec | 28.32 | 42.57 | 35.40 | 18.77 | 16.63 | - |
| Alberta | - | 11.00 | 10.00 | 10.00 | - | - |
| Manitoba | 1.20 | 1.20 | 1.08 | 1.08 | - | - |
| British Columbia | - | 1.00 | 1.00 | 1.00 | - | - |
| Nova Scotia | 1.00 | - | 0.25 | 0.25 | - | - |
| Federation of Canadian Municipalities | 0.38 | 0.20 | 0.24 | 0.24 | - | - |
| New Brunswick | 0.05 | 0.04 | 0.06 | 0.06 | - | - |
| Ontario | 2.00 | 0.30 | - | - | - | - |
| Yukon | - | 0.10 | - | - | - | - |
| Northwest Territories | - | 0.05 | - | - | - | - |
| Prince Edward Island | - | 0.05 | - | - | - | - |
| Nunavut | - | 0.03 | - | - | - | - |
| Others | - | - | - | - | ||
| Other federal departments | 124.93 | 167.58 | 744.65 | 734.11 | 10.54 | 326.61 |
| Department of Finance Canada | - | - | 500.00 | 500.00 | - | 81.96 |
| Public Health Agency of Canada (6) | - | 130.03 | 181.09 | 181.09 | - | 181.09 |
| Immigration, Refugees and Citizenship Canada (7) | 3.24 | 9.69 | 17.74 | 15.08 | 2.66 | 17.74 |
| Canadian Institutes of Health Research | - | - | 14.51 | 14.51 | - | 14.51 |
| Department of National Defence (8) | 7.02 | 6.01 | 8.47 | 8.47 | - | 8.47 |
| Environment and Climate Change Canada | 7.70 | 6.48 | 11.17 | 4.53 | 6.64 | 11.17 |
| Employment and Social Development Canada - Labour Program | 1.75 | 6.78 | 6.86 | 6.86 | - | 6.86 |
| Canada Revenue Agency | 2.03 | 1.89 | 2.19 | 2.19 | - | 2.19 |
| Innovation, Science and Economic Development Canada | 0.90 | 0.92 | 0.94 | 0.09 | 0.85 | 0.94 |
| Parks Canada | 0.83 | 5.20 | 0.78 | 0.78 | - | 0.78 |
| Canada Post - Universal Postal Union | 0.55 | 0.32 | 0.44 | 0.04 | 0.40 | 0.44 |
| Statistics Canada | 0.13 | 0.17 | 0.16 | 0.16 | - | 0.16 |
| Natural Resources Canada | - | - | 0.15 | 0.15 | - | 0.15 |
| Canadian Space Agency | 0.09 | 0.05 | 0.11 | 0.11 | - | 0.11 |
| Canadian Intellectual Property Office | 0.06 | 0.03 | 0.03 | 0.03 | - | 0.03 |
| Public Service Commission of Canada | - | - | 0.01 | 0.01 | - | 0.01 |
| Canadian Museum of Nature | 0.02 | 0.02 | 0.01 | 0.01 | - | 0.01 |
| Transport Canada | 0.00 | 0.00 | 0.00 | - | 0.00 | |
| FinDev Canada | 100.00 | - | - | - | - | - |
| Other federal departments | 0.61 | - | - | - | - | - |
| Memo: Loan repayments to EDC (not included in total) (1) | -16.60 | -18.78 | -16.43 | -16.43 | - | |
| Total | 8,429.78 | 8,398.42 | 16,049.89 | 13,274.73 | 2,775.16 | 11,815.99 |
(1) The Statistical Report is prepared on an expenditures basis, and repayments of loans and repayable contributions are not subtracted from totals. These transactions are presented for informational purposes only; more details are available in Appendix 1. (2) This excludes Finance Canada’s $50-million guarantee for the European Bank for Reconstruction and Development’s €300-million credit facility with Naftogaz to help compensate for the loss of natural gas production due to Russia’s invasion of Ukraine. (3) On June 14, 2023, the Government of Canada halted all government-led activity at the Asian Infrastructure Investment Bank (AIIB). (4) These items refer to services provided to Global Affairs Canada without charge: accommodation provided by Public Services and Procurement Canada; contributions covering employers’ share of employees’ insurance premiums and expenditures paid for by the Treasury Board of Canada Secretariat; legal services provided by Department of Justice Canada; and workers’ compensation benefits provided by Employment and Social Development Canada. (5) Costs covered by Immigration, Refugees and Citizenship Canada (IRCC). The increase in fiscal year 2022 to 2023 is the result of higher numbers of resettled refugee arrivals and asylum seekers, and the establishment of the Canada-Ukraine authorization for emergency travel. (6) This includes Can$120 million for bilateral vaccine donations (valued at US$6.66 per dose as per the OECD-DAC recommendation) and the provision of supplies to developing countries. (7) In addition to refugee support reported above, IRCC provides international assistance through various partners and initiatives. (8) Since the last publication, the Department of National Defence’s international assistance in 2021 to 2022 has been revised to take into consideration amounts returned from a mission. | ||||||
Section B: Canadian international assistance by sector category
Canadian international assistance by sector
Figures in millions of Canadian dollars.
| Sector | Total | Global Affairs Canada | Other government sources | ||||
|---|---|---|---|---|---|---|---|
| Bilateral | Multilateral | Total | Bilateral | Multilateral | Total | ||
| Education | 680.50 | 498.12 | 36.72 | 534.84 | 10.00 | 135.65 | 145.65 |
| Health | 1,783.40 | 1,102.44 | 301.62 | 1,404.06 | 206.40 | 172.94 | 379.35 |
| Population policies/programs and reproductive health | 473.52 | 286.48 | 173.09 | 459.58 | 5.83 | 8.12 | 13.94 |
| Water and sanitation | 157.87 | 64.97 | 27.47 | 92.44 | 0.31 | 65.11 | 65.43 |
| Government and civil society | 729.67 | 439.86 | 46.77 | 486.64 | 44.03 | 199.00 | 243.03 |
| Conflict prevention and resolution, peace and security | 335.56 | 274.79 | 32.04 | 306.83 | 18.21 | 10.52 | 28.73 |
| Other social infrastructure and services | 252.50 | 51.45 | 43.89 | 95.34 | 15.36 | 141.81 | 157.16 |
| Transport and storage | 136.35 | 0.10 | 74.21 | 74.31 | 0.00 | 62.04 | 62.05 |
| Communications | 42.86 | 6.66 | 4.49 | 11.15 | 1.18 | 30.52 | 31.71 |
| Energy generation, distribution and efficiency | 785.67 | 563.54 | 65.67 | 629.20 | 17.12 | 139.35 | 156.47 |
| Banking and financial services | 176.90 | 102.68 | 21.63 | 124.31 | 0.29 | 52.30 | 52.59 |
| Business and other services | 60.86 | 39.67 | 3.30 | 42.97 | 3.28 | 14.62 | 17.89 |
| Agriculture, forestry and fishing | 624.61 | 400.51 | 112.47 | 512.98 | 12.85 | 98.78 | 111.62 |
| Industry | 86.67 | 29.26 | 33.59 | 62.85 | 1.21 | 22.61 | 23.82 |
| Trade policy and regulations | 36.20 | 10.79 | 2.95 | 13.74 | 0.83 | 21.63 | 22.46 |
| General environmental protection | 249.37 | 113.43 | 84.23 | 197.65 | 32.86 | 18.86 | 51.72 |
| Multisector | 462.40 | 143.63 | 120.40 | 264.03 | 87.36 | 111.01 | 198.37 |
| Humanitarian assistance | 1,288.59 | 1,114.55 | 91.38 | 1,205.93 | 11.89 | 70.76 | 82.65 |
| Other aid expenditures | 7,686.39 | 382.93 | 76.45 | 459.37 | 7,179.84 | 47.17 | 7,227.01 |
| Total - International assistance | 16,049.89 | 5,625.87 | 1,352.35 | 6,978.22 | 7,648.86 | 1,422.80 | 9,071.67 |
| Figures in millions of Canadian dollars | |||||||
Canadian international assistance by sector category*
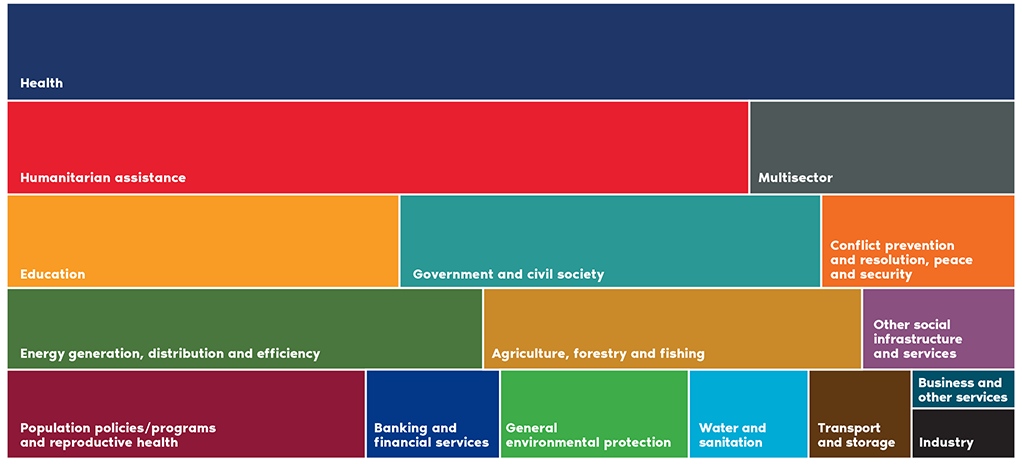
Text version
| Sector | Total |
|---|---|
| Education | 680 |
| Health | 1,783 |
| Population policies/programs and reproductive health | 474 |
| Water and sanitation | 158 |
| Government and civil society | 730 |
| Conflict prevention and resolution, peace and security | 336 |
| Other social infrastructure and services | 253 |
| Transport and storage | 136 |
| Energy generation, distribution and efficiency | 786 |
| Banking and financial services | 177 |
| Business and other services | 61 |
| Agriculture, forestry and fishing | 625 |
| Industry | 87 |
| General environmental protection | 249 |
| Multisector | 462 |
| Humanitarian assistance | 1,289 |
* For the purpose of this visual, costs incurred in Canada (administrative, refugee and development awareness costs) and aid not allocated by sector are excluded.
B1: International assistance by sector
This table includes ODA and other official assistance expenditures in millions of Canadian dollars.
| Sector | Total | Global Affairs Canada | Total | Other government sources | ||||||||||||||
|---|---|---|---|---|---|---|---|---|---|---|---|---|---|---|---|---|---|---|
| Bilateral | Multilateral | Finance Canada | International Development Research Centre | Provinces, territories and municipalities | Others (2) | Total | ||||||||||||
| Geographic programs | Partnerships for Development Innovation | Global Issues and Development | International Security and Political Affairs | Others (1) | Total - Bilateral | United Nations agency, fund or commission | Regional development banks | Other multilateral institutions | Total - Multilateral | |||||||||
| Education | 680.50 | 201.29 | 42.00 | 247.37 | 0.38 | 7.08 | 498.12 | 27.03 | 6.03 | 3.67 | 36.72 | 534.84 | 135.65 | 9.64 | 0.37 | - | 145.65 | |
| 11110 | Education policy and administrative management | 197.14 | 21.35 | 2.78 | 136.53 | - | - | 160.66 | 2.19 | 2.37 | - | 4.56 | 165.21 | 24.62 | 7.31 | - | - | 31.93 |
| 11120 | Education facilities and training | 37.11 | 20.42 | 1.86 | 0.10 | - | - | 22.38 | 0.43 | 0.00 | 0.52 | 0.95 | 23.33 | 13.77 | - | 0.01 | - | 13.78 |
| 11130 | Teacher training | 60.24 | 19.03 | 3.00 | 24.05 | - | - | 46.08 | 0.06 | 0.00 | 0.52 | 0.58 | 46.66 | 13.40 | 0.18 | - | - | 13.58 |
| 11182 | Educational research | 4.66 | 0.69 | 0.18 | 0.81 | - | - | 1.69 | 1.43 | - | - | 1.43 | 3.12 | 0.52 | 1.03 | - | - | 1.54 |
| 11220 | Primary education | 145.57 | 38.51 | 3.74 | 57.30 | - | - | 99.55 | 19.88 | 0.11 | - | 19.99 | 119.54 | 25.98 | - | 0.05 | - | 26.02 |
| 11230 | Basic life skills for youth and adults | 10.65 | 5.64 | 1.94 | 0.55 | 0.16 | - | 8.30 | 0.01 | - | 0.91 | 0.92 | 9.22 | 1.26 | - | 0.16 | - | 1.42 |
| 11231 | Basic life skills for youth | 15.93 | 9.28 | 5.27 | - | - | - | 14.55 | 1.08 | - | 0.13 | 1.21 | 15.76 | 0.17 | - | - | - | 0.17 |
| 11232 | Primary education equivalent for adults | 0.93 | 0.78 | - | 0.15 | - | - | 0.93 | - | - | - | - | 0.93 | - | - | - | - | - |
| 11240 | Early childhood education | 18.01 | 0.38 | 6.13 | 2.05 | - | - | 8.56 | 0.33 | 0.00 | - | 0.33 | 8.89 | 8.92 | 0.20 | - | - | 9.11 |
| 11250 | School feeding | 13.73 | 11.84 | 0.06 | 1.60 | - | - | 13.50 | 0.03 | - | - | 0.03 | 13.53 | - | 0.13 | 0.07 | - | 0.20 |
| 11260 | Lower secondary education | 5.08 | 4.76 | 0.31 | - | - | - | 5.07 | 0.00 | - | - | 0.00 | 5.08 | - | - | - | - | - |
| 11320 | Secondary education | 60.14 | 6.56 | 8.09 | 23.20 | - | - | 37.85 | - | 0.24 | - | 0.24 | 38.09 | 22.06 | - | - | - | 22.06 |
| 11321 | Lower secondary education | 1.72 | 1.72 | - | - | - | - | 1.72 | - | - | - | - | 1.72 | - | - | - | - | - |
| 11322 | Upper secondary education | 2.65 | 2.42 | 0.23 | - | - | - | 2.65 | - | - | - | - | 2.65 | - | - | - | - | - |
| 11330 | Vocational training | 69.84 | 47.95 | 4.71 | 0.95 | 0.22 | - | 53.83 | 0.16 | 2.93 | 0.81 | 3.90 | 57.72 | 12.04 | - | 0.07 | - | 12.12 |
| 11420 | Higher education | 28.70 | 4.50 | 3.45 | 0.07 | - | 7.08 | 15.10 | 0.00 | 0.37 | 0.78 | 1.15 | 16.25 | 11.66 | 0.79 | - | - | 12.45 |
| 11430 | Advanced technical and managerial training | 8.41 | 5.45 | 0.25 | - | - | - | 5.71 | 1.43 | 0.00 | - | 1.43 | 7.14 | 1.26 | - | 0.00 | - | 1.27 |
| Health | 1,783.40 | 213.73 | 36.42 | 852.16 | 0.12 | - | 1,102.44 | 36.52 | 16.31 | 248.79 | 301.62 | 1,404.06 | 172.94 | 24.78 | 0.54 | 181.09 | 379.35 | |
| 12110 | Health policy and administrative management | 150.87 | 15.35 | 3.01 | 28.00 | 0.04 | - | 46.39 | 22.39 | 5.80 | 21.61 | 49.79 | 96.19 | 43.62 | 11.05 | 0.02 | - | 54.69 |
| 12181 | Medical education/training | 3.72 | 0.85 | 0.80 | - | 0.04 | - | 1.70 | - | 0.00 | - | 0.00 | 1.70 | 1.82 | 0.20 | - | - | 2.02 |
| 12182 | Medical research | 5.59 | 0.06 | 0.80 | 1.42 | - | - | 2.29 | 0.95 | - | - | 0.95 | 3.24 | 0.04 | 2.06 | 0.25 | - | 2.35 |
| 12191 | Medical services | 49.87 | 1.35 | 1.16 | - | - | - | 2.51 | - | 0.01 | - | 0.01 | 2.52 | 47.15 | - | 0.20 | - | 47.35 |
| 12196 | Health statistics and data (1) | 6.96 | 6.48 | 0.48 | - | - | - | 6.96 | - | - | - | - | 6.96 | - | - | - | - | - |
| 12220 | Basic health care | 109.58 | 65.74 | 15.34 | 3.75 | - | - | 84.83 | 6.76 | 0.40 | - | 7.16 | 91.99 | 17.53 | - | 0.07 | - | 17.60 |
| 12230 | Basic health infrastructure | 90.63 | 8.63 | 0.05 | 10.00 | - | - | 18.68 | 0.06 | 0.00 | - | 0.06 | 18.74 | 10.86 | 0.20 | - | 60.83 | 71.89 |
| 12240 | Basic nutrition | 99.20 | 27.78 | 2.20 | 57.71 | - | - | 87.69 | 2.12 | 0.39 | - | 2.51 | 90.19 | 8.62 | 0.39 | - | - | 9.00 |
| 12250 | Infectious disease control | 214.64 | 12.90 | 4.45 | 83.08 | - | - | 100.42 | 1.36 | 2.58 | 75.00 | 78.94 | 179.37 | 28.17 | 7.11 | - | - | 35.28 |
| 12261 | Health education | 23.31 | 10.60 | 1.46 | 2.45 | - | - | 14.50 | 0.03 | - | - | 0.03 | 14.54 | 8.61 | 0.16 | - | - | 8.77 |
| 12262 | Malaria control | 104.76 | 2.29 | - | - | - | - | 2.29 | 0.01 | - | 101.01 | 101.02 | 103.31 | 1.45 | 0.01 | - | - | 1.46 |
| 12263 | Tuberculosis control | 51.97 | - | - | - | - | - | - | 0.30 | - | 51.17 | 51.47 | 51.47 | 0.50 | - | - | - | 0.50 |
| 12264 | COVID-19 control | 814.95 | 42.31 | 0.54 | 642.00 | - | - | 684.85 | 0.53 | 7.13 | - | 7.66 | 692.52 | - | 2.18 | - | 120.25 | 122.44 |
| 12281 | Health personnel development | 35.95 | 12.57 | 1.77 | 16.00 | 0.04 | - | 30.38 | 0.99 | - | - | 0.99 | 31.38 | 4.57 | - | - | - | 4.57 |
| 12310 | Noncommunicable diseases control, general | 4.07 | 4.00 | - | - | - | - | 4.00 | 0.07 | 0.00 | - | 0.07 | 4.07 | - | - | - | - | - |
| 12320 | Tobacco use control | 0.20 | - | - | - | - | - | - | - | - | - | - | - | - | 0.20 | - | - | 0.20 |
| 12340 | Promotion of mental health and well-being | 5.26 | 0.85 | 4.35 | - | - | - | 5.19 | 0.07 | 0.00 | - | 0.07 | 5.26 | - | - | - | - | - |
| 12350 | Other prevention and treatment of noncommunicable diseases | 9.38 | - | - | 7.75 | - | - | 7.75 | 0.81 | - | - | 0.81 | 8.56 | 0.00 | 0.82 | - | - | 0.82 |
| 12382 | Research for prevention and control of noncommunicable diseases | 2.47 | 2.00 | - | - | - | - | 2.00 | 0.07 | - | 0.00 | 0.07 | 2.07 | - | 0.40 | - | - | 0.40 |
| Population policies/programs and reproductive health | 473.52 | 177.60 | 65.80 | 43.09 | - | - | 286.48 | 12.91 | 0.06 | 160.12 | 173.09 | 459.58 | 8.12 | 5.69 | 0.13 | - | 13.94 | |
| 13010 | Population policy and administrative management | 22.28 | 7.67 | 1.62 | - | - | - | 9.29 | 10.00 | - | - | 10.00 | 19.28 | 1.16 | 1.84 | - | - | 3.00 |
| 13011 | Sexual and reproductive rights (1) | 62.13 | 42.76 | 19.12 | 0.25 | - | - | 62.13 | - | - | - | - | 62.13 | - | - | - | - | - |
| 13012 | Comprehensive sexuality education (1) | 14.10 | 8.46 | 5.64 | - | - | - | 14.10 | - | - | - | - | 14.10 | - | - | - | - | - |
| 13020 | Reproductive health care | 104.45 | 52.60 | 22.11 | 18.49 | - | - | 93.20 | 1.87 | 0.06 | - | 1.93 | 95.14 | 5.42 | 3.75 | 0.13 | - | 9.31 |
| 13021 | Safe abortion services and post-abortion care (1) | 6.15 | 2.67 | 3.48 | - | - | - | 6.15 | - | - | - | - | 6.15 | - | - | - | - | - |
| 13030 | Family planning | 58.12 | 34.95 | 5.89 | 16.27 | - | - | 57.10 | 0.31 | - | - | 0.31 | 57.41 | 0.61 | 0.10 | - | - | 0.71 |
| 13040 | STD control including HIV/AIDS | 174.53 | 4.14 | 1.74 | 8.08 | - | - | 13.95 | 0.32 | - | 160.12 | 160.43 | 174.39 | 0.14 | - | - | - | 0.14 |
| 13081 | Personnel development for population and reproductive health | 28.09 | 20.85 | 6.04 | - | - | - | 26.89 | 0.42 | - | - | 0.42 | 27.31 | 0.78 | - | - | - | 0.78 |
| 13096 | Population statistics and data | 3.66 | 3.50 | 0.16 | - | - | - | 3.66 | - | - | - | - | 3.66 | - | - | - | - | - |
| Water and sanitation | 157.87 | 11.75 | 5.56 | 47.66 | - | - | 64.97 | 5.19 | 17.62 | 4.67 | 27.47 | 92.44 | 63.28 | 0.10 | 2.04 | - | 65.43 | |
| 14010 | Water sector policy and administrative management | 25.73 | 0.64 | - | - | - | - | 0.64 | 1.56 | 0.10 | 1.04 | 2.69 | 3.34 | 21.63 | 0.09 | 0.68 | - | 22.39 |
| 14015 | Water resources conservation (including data collection) | 6.26 | 0.47 | 0.20 | - | - | - | 0.67 | 0.66 | 0.34 | 0.89 | 1.89 | 2.56 | 3.35 | - | 0.35 | - | 3.70 |
| 14020 | Water supply and sanitation - large systems | 22.51 | - | - | - | - | - | - | 1.68 | 15.00 | 0.67 | 17.35 | 17.35 | 5.15 | - | - | - | 5.15 |
| 14021 | Water supply - large systems | 39.79 | 0.80 | - | 25.00 | - | - | 25.80 | - | 0.35 | 0.04 | 0.40 | 26.20 | 13.59 | - | - | - | 13.59 |
| 14022 | Sanitation - large systems | 12.91 | 0.25 | - | - | - | - | 0.25 | 0.28 | 0.65 | - | 0.92 | 1.18 | 11.73 | - | - | - | 11.73 |
| 14030 | Basic drinking water supply and basic sanitation | 0.79 | - | - | - | - | - | - | 0.00 | - | - | 0.00 | 0.00 | 0.41 | - | 0.37 | - | 0.79 |
| 14031 | Basic drinking water supply | 5.36 | 2.05 | 0.10 | - | - | - | 2.15 | 0.20 | 0.80 | 0.36 | 1.37 | 3.52 | 1.84 | - | - | - | 1.84 |
| 14032 | Basic sanitation | 11.86 | 4.44 | 5.02 | - | - | - | 9.45 | 0.12 | 0.19 | 0.03 | 0.35 | 9.80 | 2.06 | - | - | - | 2.06 |
| 14040 | River basins development | 2.79 | - | - | - | - | - | - | 0.00 | 0.00 | 0.46 | 0.46 | 0.46 | 1.69 | - | 0.64 | - | 2.33 |
| 14050 | Waste management/disposal | 27.14 | 1.86 | 0.06 | 21.93 | - | - | 23.85 | 0.10 | 0.19 | 1.16 | 1.44 | 25.30 | 1.83 | 0.01 | - | - | 1.85 |
| 14081 | Education and training in water supply and sanitation | 2.73 | 1.23 | 0.17 | 0.73 | - | - | 2.13 | 0.60 | - | - | 0.60 | 2.73 | - | - | - | - | - |
| Government and civil society | 729.67 | 275.69 | 82.69 | 20.25 | 59.65 | 1.58 | 439.86 | 30.89 | 11.12 | 4.77 | 46.77 | 486.64 | 196.34 | 18.78 | 0.84 | 27.07 | 243.03 | |
| 15110 | Public sector policy and administrative management | 96.73 | 8.84 | 0.48 | 0.53 | 4.45 | 0.63 | 14.93 | 6.56 | 4.52 | 0.91 | 11.99 | 26.92 | 65.82 | 3.72 | 0.24 | 0.04 | 69.82 |
| 15111 | Public finance management | 52.82 | 7.18 | 1.25 | 0.30 | - | - | 8.74 | 0.06 | 4.10 | - | 4.17 | 12.90 | 39.08 | 0.83 | - | - | 39.91 |
| 15112 | Decentralization and support to subnational governments | 50.43 | 5.53 | 1.70 | 0.28 | - | - | 7.50 | 0.57 | 0.62 | - | 1.20 | 8.69 | 41.74 | - | - | - | 41.74 |
| 15113 | Anti-corruption organizations and institutions | 7.45 | 2.19 | 0.71 | - | 1.03 | - | 3.94 | 0.39 | 0.05 | - | 0.44 | 4.38 | 2.90 | 0.08 | - | 0.09 | 3.08 |
| 15114 | Domestic revenue mobilization | 41.11 | 0.43 | - | 0.23 | - | - | 0.66 | 0.01 | 1.14 | - | 1.15 | 1.80 | 33.20 | - | - | 6.10 | 39.31 |
| 15116 | Tax collection | 0.18 | - | 0.18 | - | - | - | 0.18 | - | - | - | - | 0.18 | - | - | - | - | - |
| 15117 | Budget planning | 1.68 | 0.76 | 0.18 | 0.68 | - | 0.06 | 1.68 | - | - | - | - | 1.68 | - | - | - | - | - |
| 15118 | National audit | 1.43 | - | 0.18 | 1.25 | - | - | 1.43 | - | - | - | - | 1.43 | - | - | - | - | - |
| 15119 | Debt and aid management | 0.94 | - | - | 0.88 | - | 0.06 | 0.94 | - | - | - | - | 0.94 | - | - | - | - | - |
| 15121 | Foreign affairs | 0.57 | - | - | - | - | - | - | - | - | 0.57 | 0.57 | 0.57 | - | - | - | - | - |
| 15123 | Administration of developing countries’ foreign aid | 0.06 | - | - | 0.06 | - | - | 0.06 | - | - | - | - | 0.06 | - | - | - | - | - |
| 15124 | General personnel services | 0.15 | - | 0.15 | - | - | - | 0.15 | - | - | - | - | 0.15 | - | - | - | - | - |
| 15125 | Central procurement | 3.60 | 0.19 | - | - | - | - | 0.19 | - | 0.01 | - | 0.01 | 0.20 | 3.26 | 0.14 | - | - | 3.40 |
| 15126 | Other general public services | 2.81 | 2.81 | - | - | - | - | 2.81 | - | - | - | - | 2.81 | - | - | - | - | - |
| 15127 | National monitoring and evaluation | 1.04 | 0.16 | 0.05 | 0.04 | - | - | 0.24 | 0.80 | - | - | 0.80 | 1.04 | - | - | - | - | - |
| 15128 | Local government finance | 0.11 | 0.11 | - | - | - | - | 0.11 | - | - | - | - | 0.11 | - | - | - | - | - |
| 15130 | Legal and judicial development | 21.96 | 11.00 | 0.56 | 0.23 | 1.59 | - | 13.37 | 3.22 | 0.09 | 1.03 | 4.33 | 17.71 | 1.77 | 2.49 | - | - | 4.25 |
| 15131 | Justice, law and order policy, planning and administration | 6.74 | 4.86 | - | - | 1.81 | 0.07 | 6.74 | - | - | - | - | 6.74 | - | - | - | - | - |
| 15132 | Police | 9.77 | 4.12 | 0.05 | - | 5.59 | - | 9.77 | - | - | - | - | 9.77 | - | - | - | - | - |
| 15134 | Judicial affairs | 0.70 | - | 0.57 | - | - | - | 0.57 | - | - | 0.13 | 0.13 | 0.70 | - | - | - | - | - |
| 15135 | Ombudsman | 0.18 | - | 0.18 | - | - | - | 0.18 | - | - | - | - | 0.18 | - | - | - | - | - |
| 15136 | Immigration | 0.70 | 0.70 | - | - | - | - | 0.70 | - | - | - | - | 0.70 | - | - | - | - | - |
| 15137 | Prisons | 0.65 | 0.61 | - | - | 0.04 | - | 0.65 | - | - | - | - | 0.65 | - | - | - | - | - |
| 15142 | Macroeconomic policy | 4.20 | 0.14 | - | - | - | - | 0.14 | 0.71 | 0.44 | - | 1.15 | 1.28 | 0.01 | 2.90 | - | - | 2.91 |
| 15143 | Meteorological services | 0.28 | - | - | - | - | - | - | 0.28 | - | - | 0.28 | 0.28 | - | - | - | - | - |
| 15144 | National standards development | 0.39 | - | - | - | 0.39 | - | 0.39 | - | - | - | - | 0.39 | - | - | - | - | - |
| 15150 | Democratic participation and civil society | 49.11 | 23.03 | 18.99 | 0.13 | 4.75 | 0.13 | 47.02 | 0.19 | - | 0.60 | 0.79 | 47.81 | 0.35 | 0.79 | 0.16 | - | 1.30 |
| 15151 | Elections | 9.55 | 6.20 | 0.18 | - | 1.21 | - | 7.60 | 1.60 | - | 0.35 | 1.96 | 9.55 | - | - | - | - | - |
| 15152 | Legislatures and political parties | 4.07 | 3.17 | 0.72 | - | 0.00 | - | 3.89 | 0.18 | - | - | 0.18 | 4.07 | - | - | - | - | - |
| 15153 | Media and free flow of information | 7.07 | 3.22 | 1.31 | - | 1.65 | - | 6.18 | 0.02 | - | 0.29 | 0.31 | 6.49 | - | 0.58 | - | - | 0.58 |
| 15155 | Tax policy and administration support | 0.33 | 0.33 | - | - | - | - | 0.33 | - | - | - | - | 0.33 | - | - | - | - | - |
| 15156 | Other non-tax revenue mobilization | 0.08 | 0.08 | - | - | - | - | 0.08 | - | - | - | - | 0.08 | - | - | - | - | - |
| 15160 | Human rights | 58.09 | 18.65 | 12.75 | 0.97 | 17.44 | - | 49.80 | 5.95 | 0.00 | 0.89 | 6.83 | 56.63 | - | 1.29 | 0.16 | - | 1.46 |
| 151601 | Transitional justice | 3.52 | 0.79 | - | - | 2.73 | - | 3.52 | - | - | - | - | 3.52 | - | - | - | - | - |
| 151602 | International criminal justice | 2.57 | - | - | - | 2.57 | - | 2.57 | - | - | - | - | 2.57 | - | - | - | - | - |
| 15170 | Women’s equality organizations and institutions | 18.11 | 0.72 | 1.77 | - | - | - | 2.48 | 8.24 | 0.15 | - | 8.39 | 10.88 | 4.12 | 1.64 | 0.22 | 1.25 | 7.24 |
| 15171 | Women’s rights organizations and movements (1) | 93.46 | 64.17 | 19.30 | 1.99 | 7.92 | 0.07 | 93.46 | - | - | - | - | 93.46 | - | - | - | - | - |
| 15172 | Public-sector capacity for gender equality (1) | 28.69 | 24.46 | 2.35 | 0.45 | 1.42 | - | 28.69 | - | - | - | - | 28.69 | - | - | - | - | - |
| 15173 | Data and evidence for gender equality (1) | 11.45 | 4.73 | 4.47 | 0.92 | 0.77 | 0.56 | 11.45 | - | - | - | - | 11.45 | - | - | - | - | - |
| 15178 | Female genital mutilation/cutting (1) | 2.95 | 0.31 | 0.14 | 2.50 | - | - | 2.95 | - | - | - | - | 2.95 | - | - | - | - | - |
| 15179 | Child, early and forced marriage (1) | 11.20 | 4.47 | 1.22 | 5.50 | - | - | 11.20 | - | - | - | - | 11.20 | - | - | - | - | - |
| 15180 | Ending violence against women and girls | 83.43 | 59.75 | 12.89 | 2.71 | 2.32 | - | 77.67 | 1.80 | - | - | 1.80 | 79.46 | 2.43 | 1.51 | 0.02 | - | 3.97 |
| 15185 | Local government administration | 2.54 | 1.08 | 0.38 | 0.13 | 0.95 | - | 2.54 | - | - | - | - | 2.54 | - | - | - | - | - |
| 15190 | Facilitation of orderly, safe, regular and responsible migration and mobility | 33.38 | 9.87 | - | - | 0.94 | - | 10.81 | 0.31 | 0.00 | - | 0.31 | 11.12 | 1.66 | 0.98 | 0.04 | 19.58 | 22.26 |
| 15196 | Government and civil society statistics and data | 3.40 | 1.00 | 0.00 | 0.51 | 0.07 | - | 1.58 | - | - | - | - | 1.58 | - | 1.81 | - | - | 1.81 |
| Conflict prevention and resolution, peace and security | 335.56 | 11.70 | 0.16 | 0.01 | 262.91 | 0.00 | 274.79 | 29.68 | 0.01 | 2.34 | 32.04 | 306.83 | 10.52 | 0.15 | - | 18.06 | 28.73 | |
| 15210 | Security system management and reform | 24.10 | 0.13 | - | 0.01 | 10.38 | - | 10.52 | 0.20 | 0.01 | 2.02 | 2.24 | 12.76 | 1.75 | - | - | 9.59 | 11.33 |
| 15220 | Civilian peacebuilding, conflict prevention and resolution | 112.93 | 9.77 | 0.16 | - | 92.43 | 0.00 | 102.36 | 1.56 | - | 0.32 | 1.88 | 104.24 | 8.54 | 0.15 | - | - | 8.69 |
| 15230 | Participation in international peacekeeping operations | 48.42 | 0.17 | - | - | 12.85 | - | 13.02 | 26.78 | - | - | 26.78 | 39.80 | 0.15 | - | - | 8.47 | 8.62 |
| 15240 | Reintegration and control of small arms and light weapons | 1.40 | 0.06 | - | - | 1.24 | - | 1.30 | 0.02 | - | - | 0.02 | 1.32 | 0.08 | - | - | - | 0.08 |
| 15250 | Removal of land mines and explosive remnants of war | 45.26 | 0.58 | - | - | 44.68 | - | 45.25 | 0.00 | - | - | 0.00 | 45.26 | - | - | - | - | - |
| 15261 | Child soldiers (prevention and demobilization) | 1.75 | 0.10 | - | - | 1.62 | - | 1.72 | 0.03 | - | - | 0.03 | 1.75 | 0.00 | - | - | - | 0.00 |
| 1513010 | Fight against transnational organized crime | 5.38 | - | - | - | 5.38 | - | 5.38 | - | - | - | - | 5.38 | - | - | - | - | - |
| 1513020 | Countering violent extremism | 19.11 | - | - | - | 19.11 | - | 19.11 | - | - | - | - | 19.11 | - | - | - | - | - |
| 1513030 | Cybercrime | 3.74 | - | - | - | 3.74 | - | 3.74 | - | - | - | - | 3.74 | - | - | - | - | - |
| 15297 | Combatting the financing of terrorism (1) | 1.26 | - | - | - | 1.26 | - | 1.26 | - | - | - | - | 1.26 | - | - | - | - | - |
| 1520020 | Preventing violent extremism | 10.24 | 0.90 | - | - | 9.34 | - | 10.24 | - | - | - | - | 10.24 | - | - | - | - | - |
| 1520010 | Disarmament of weapons of mass destruction (WMD) | 61.98 | - | - | - | 60.89 | - | 60.89 | 1.09 | - | - | 1.09 | 61.98 | - | - | - | - | - |
| Other social infrastructure and services | 252.50 | 42.99 | 3.40 | 2.33 | 2.72 | - | 51.45 | 24.39 | 12.21 | 7.29 | 43.89 | 95.34 | 141.81 | 7.95 | 0.39 | 7.02 | 157.16 | |
| 16010 | Social and welfare services | 141.72 | 3.67 | 0.14 | - | - | - | 3.81 | 3.05 | 3.58 | 0.61 | 7.24 | 11.05 | 127.02 | 3.59 | 0.05 | - | 130.67 |
| 16011 | Social protection and welfare services policy, planning and administration | 9.08 | 9.08 | - | - | - | - | 9.08 | - | - | - | - | 9.08 | - | - | - | - | - |
| 16015 | Social services (incl. youth development, women and children) | 7.45 | 6.55 | - | 0.90 | - | - | 7.45 | - | - | - | - | 7.45 | - | - | - | - | - |
| 16020 | Employment policy and administrative management | 24.94 | 10.37 | 2.25 | - | - | - | 12.62 | 3.76 | 0.01 | 0.03 | 3.79 | 16.42 | 5.65 | 2.56 | 0.31 | - | 8.52 |
| 16030 | Housing policy and administrative management | 1.63 | - | - | - | - | - | - | - | 0.29 | - | 0.29 | 0.29 | 1.34 | - | - | - | 1.34 |
| 16040 | Low-cost housing | 1.95 | 0.00 | 0.32 | - | - | - | 0.32 | - | 0.07 | 1.47 | 1.53 | 1.85 | 0.10 | - | - | - | 0.10 |
| 16050 | Multisector aid for basic social services | 31.50 | 7.89 | 0.54 | - | - | - | 8.43 | 5.65 | 8.12 | 4.25 | 18.02 | 26.45 | 4.98 | 0.07 | - | - | 5.05 |
| 16061 | Culture and recreation | 0.51 | 0.13 | - | - | - | - | 0.13 | 0.00 | 0.02 | 0.16 | 0.18 | 0.30 | 0.21 | - | - | - | 0.21 |
| 16062 | Statistical capacity building | 9.52 | 2.38 | 0.10 | 1.00 | - | - | 3.48 | 1.55 | 0.12 | - | 1.67 | 5.15 | 2.51 | 1.69 | - | 0.16 | 4.37 |
| 16063 | Narcotics control | 2.72 | - | - | - | 2.72 | - | 2.72 | - | - | - | - | 2.72 | - | - | - | - | - |
| 16064 | Social mitigation of HIV/AIDS | 5.20 | 0.00 | - | 0.16 | - | - | 0.16 | 5.04 | - | - | 5.04 | 5.20 | - | - | - | - | - |
| 16066 | Culture | 2.34 | 0.10 | - | - | - | - | 0.10 | 1.43 | - | 0.78 | 2.21 | 2.31 | - | - | 0.03 | - | 0.03 |
| 16070 | Labour rights | 11.29 | 1.71 | 0.06 | - | - | - | 1.76 | 2.67 | - | - | 2.67 | 4.43 | - | - | - | 6.86 | 6.86 |
| 16080 | Social dialogue | 2.68 | 1.12 | - | 0.27 | - | - | 1.40 | 1.25 | - | - | 1.25 | 2.65 | - | 0.04 | - | - | 0.04 |
| Transport and storage | 136.35 | 0.09 | - | - | 0.01 | - | 0.10 | 0.22 | 73.53 | 0.45 | 74.21 | 74.31 | 62.04 | - | - | 0.00 | 62.05 | |
| 21010 | Transport policy and administrative management | 18.87 | - | - | - | - | - | - | 0.01 | 12.05 | 0.42 | 12.48 | 12.48 | 6.38 | - | - | 0.00 | 6.38 |
| 21020 | Road transport | 105.62 | - | - | - | - | - | - | 0.20 | 57.77 | 0.04 | 58.01 | 58.01 | 47.61 | - | - | - | 47.61 |
| 21030 | Rail transport | 2.03 | - | - | - | - | - | - | - | 1.35 | 0.00 | 1.36 | 1.36 | 0.67 | - | - | - | 0.67 |
| 21040 | Water transport | 6.57 | - | - | - | - | - | - | 0.00 | 0.15 | 0.00 | 0.15 | 0.15 | 6.42 | - | - | - | 6.42 |
| 21050 | Air transport | 3.00 | - | - | - | 0.01 | - | 0.01 | - | 2.07 | 0.00 | 2.07 | 2.08 | 0.92 | - | - | - | 0.92 |
| 21061 | Storage | 0.17 | - | - | - | - | - | - | - | 0.13 | 0.00 | 0.13 | 0.13 | 0.04 | - | - | - | 0.04 |
| 21081 | Education and training in transport and storage | 0.09 | 0.09 | - | - | - | - | 0.09 | - | - | - | - | 0.09 | - | - | - | - | - |
| Communications | 42.86 | 3.38 | 2.27 | 0.54 | 0.48 | - | 6.66 | 0.39 | 3.73 | 0.37 | 4.49 | 11.15 | 29.67 | 1.02 | 0.07 | 0.94 | 31.71 | |
| 22010 | Communications policy and administrative management | 8.33 | 0.02 | - | - | - | - | 0.02 | 0.06 | 0.02 | 0.02 | 0.10 | 0.11 | 7.87 | 0.33 | 0.02 | - | 8.22 |
| 22011 | Communications policy, planning and administration | 0.56 | - | 0.08 | - | 0.48 | - | 0.56 | - | - | - | - | 0.56 | - | - | - | - | - |
| 22020 | Telecommunications | 11.22 | - | - | - | - | - | - | - | 3.69 | - | 3.69 | 3.69 | 6.59 | - | - | 0.94 | 7.53 |
| 22030 | Radio/television/print media | 0.62 | 0.62 | - | - | - | - | 0.62 | 0.00 | - | - | 0.00 | 0.62 | - | - | - | - | - |
| 22040 | Information and communication technology (ICT) | 22.13 | 2.74 | 2.19 | 0.54 | - | - | 5.47 | 0.33 | 0.02 | 0.35 | 0.69 | 6.16 | 15.22 | 0.69 | 0.06 | - | 15.96 |
| Energy generation, distribution and efficiency | 785.67 | 10.52 | 0.52 | 552.49 | - | - | 563.54 | 3.48 | 46.88 | 15.31 | 65.67 | 629.20 | 139.35 | 0.29 | 0.10 | 16.73 | 156.47 | |
| 23110 | Energy policy and administrative management | 111.55 | 0.47 | - | 33.40 | - | - | 33.87 | 0.82 | 35.81 | 6.93 | 43.55 | 77.42 | 30.10 | 0.29 | - | 3.73 | 34.13 |
| 23111 | Energy sector policy, planning and administration | 14.65 | 0.27 | 0.18 | 3.04 | - | - | 3.50 | - | - | 0.16 | 0.16 | 3.65 | - | - | - | 11.00 | 11.00 |
| 23112 | Energy regulation | 1.40 | - | - | 1.40 | - | - | 1.40 | - | - | - | - | 1.40 | - | - | - | - | - |
| 23181 | Energy education/training | 2.58 | 1.16 | - | 1.40 | - | - | 2.56 | - | - | - | - | 2.56 | 0.02 | - | - | - | 0.02 |
| 23182 | Energy research | 1.40 | - | - | 1.40 | - | - | 1.40 | - | - | - | - | 1.40 | - | - | - | - | - |
| 23183 | Energy conservation and demand-side efficiency | 5.73 | 2.21 | - | 0.23 | - | - | 2.44 | - | 0.35 | 1.50 | 1.85 | 4.29 | 1.44 | - | - | - | 1.44 |
| 23210 | Energy generation, renewable sources - multiple technologies | 477.49 | 0.94 | 0.27 | 466.62 | - | - | 467.83 | 0.59 | 0.00 | 5.55 | 6.15 | 473.98 | 1.41 | - | 0.10 | 2.00 | 3.51 |
| 23220 | Hydroelectric power plants | 15.16 | 0.01 | - | 1.40 | - | - | 1.41 | - | 7.36 | - | 7.36 | 8.77 | 6.39 | - | - | - | 6.39 |
| 23230 | Solar energy | 51.08 | 4.11 | - | 37.30 | - | - | 41.41 | 0.39 | 0.14 | 0.05 | 0.58 | 41.99 | 9.09 | - | - | - | 9.09 |
| 23231 | Solar energy for isolated grids and standalone systems | 8.98 | 0.52 | - | 6.30 | - | - | 6.82 | 0.06 | 0.00 | - | 0.06 | 6.88 | 2.10 | - | - | - | 2.10 |
| 23232 | Solar energy - thermal applications | 0.01 | - | - | - | - | - | - | 0.01 | - | - | 0.01 | 0.01 | - | - | - | - | - |
| 23240 | Wind energy | 0.85 | - | - | - | - | - | - | 0.00 | 0.09 | 0.04 | 0.14 | 0.14 | 0.71 | - | - | - | 0.71 |
| 23260 | Geothermal energy | 0.88 | - | - | - | - | - | - | - | 0.12 | - | 0.12 | 0.12 | 0.76 | - | - | - | 0.76 |
| 23270 | Biofuel-fired power plants | 0.21 | - | 0.07 | - | - | - | 0.07 | - | 0.07 | - | 0.07 | 0.14 | 0.07 | - | - | - | 0.07 |
| 23310 | Energy generation, non-renewable sources – unspecified | 0.39 | - | - | - | - | - | - | - | 0.31 | - | 0.31 | 0.31 | 0.08 | - | - | - | 0.08 |
| 23330 | Oil-fired electric power plants | 0.46 | - | - | - | - | - | - | - | - | - | - | - | 0.46 | - | - | - | 0.46 |
| 23340 | Natural gas-fired electric power plants | 1.48 | - | - | - | - | - | - | - | - | - | - | - | 1.48 | - | - | - | 1.48 |
| 23510 | Nuclear energy electric power plants | 1.29 | - | - | - | - | - | - | 1.29 | - | - | 1.29 | 1.29 | - | - | - | - | - |
| 23620 | District heating and cooling | 0.09 | - | - | - | - | - | - | - | 0.09 | - | 0.09 | 0.09 | - | - | - | - | - |
| 23630 | Electric power transmission and distribution (centralized grids) | 80.75 | 0.83 | - | - | - | - | 0.83 | 0.30 | 2.21 | 1.07 | 3.57 | 4.40 | 76.35 | - | - | - | 76.35 |
| 23631 | Electric power transmission and distribution (isolated mini grids) | 9.09 | - | - | - | - | - | - | 0.02 | 0.19 | - | 0.21 | 0.21 | 8.88 | - | - | - | 8.88 |
| 23640 | Gas distribution | 0.13 | - | - | - | - | - | - | - | 0.13 | - | 0.13 | 0.13 | - | - | - | - | - |
| 23642 | Electric mobility infrastructures | 0.02 | - | - | - | - | - | - | - | - | 0.02 | 0.02 | 0.02 | - | - | - | - | - |
| Banking and financial services | 176.90 | 20.15 | 0.95 | 81.52 | 0.05 | - | 102.68 | 2.12 | 19.51 | 0.01 | 21.63 | 124.31 | 52.30 | 0.29 | - | - | 52.59 | |
| 24010 | Financial policy and administrative management | 74.27 | 0.41 | - | 31.08 | - | - | 31.49 | 0.89 | 1.37 | 0.01 | 2.27 | 33.76 | 40.50 | - | - | - | 40.50 |
| 24020 | Monetary institutions | 1.96 | 1.30 | - | 0.60 | - | - | 1.90 | - | 0.05 | - | 0.05 | 1.95 | 0.01 | - | - | - | 0.01 |
| 24030 | Formal sector financial intermediaries | 72.10 | 6.58 | 0.53 | 38.51 | - | - | 45.63 | 0.84 | 16.79 | - | 17.63 | 63.25 | 8.61 | 0.24 | - | - | 8.85 |
| 24040 | Informal/semi-formal financial intermediaries | 20.42 | 4.38 | 0.13 | 11.33 | 0.05 | - | 15.89 | - | 1.30 | - | 1.30 | 17.19 | 3.17 | 0.06 | - | - | 3.23 |
| 24081 | Education/training in banking and financial services | 8.15 | 7.47 | 0.29 | - | - | - | 7.76 | 0.39 | - | - | 0.39 | 8.15 | 0.01 | - | - | - | 0.01 |
| Business and other services | 60.86 | 23.52 | 12.00 | 4.16 | - | - | 39.67 | 1.35 | 1.94 | - | 3.30 | 42.97 | 14.62 | 3.28 | - | - | 17.89 | |
| 25010 | Business support services and institutions | 38.39 | 10.25 | 9.79 | 0.75 | - | - | 20.80 | 1.17 | 0.38 | - | 1.55 | 22.35 | 14.49 | 1.55 | - | - | 16.04 |
| 25020 | Privatization | 0.12 | - | - | - | - | - | - | - | - | - | - | - | 0.12 | - | - | - | 0.12 |
| 25030 | Business development services | 21.23 | 12.86 | 2.20 | 3.40 | - | - | 18.47 | 0.09 | 1.14 | - | 1.23 | 19.70 | 0.00 | 1.52 | - | - | 1.53 |
| 25040 | Responsible business conduct | 1.12 | 0.40 | - | - | - | - | 0.40 | 0.10 | 0.42 | - | 0.52 | 0.92 | - | 0.20 | - | - | 0.20 |
| Agriculture, forestry and fishing | 624.61 | 191.06 | 29.40 | 180.05 | - | - | 400.51 | 18.23 | 44.32 | 49.92 | 112.47 | 512.98 | 96.56 | 8.65 | 3.95 | 2.46 | 111.62 | |
| 31110 | Agricultural policy and administrative management | 74.12 | 7.38 | 0.63 | 4.38 | - | - | 12.39 | 2.31 | 36.39 | 10.58 | 49.28 | 61.67 | 10.53 | 1.91 | 0.02 | - | 12.46 |
| 31120 | Agricultural development | 68.32 | 19.86 | 3.17 | 34.27 | - | - | 57.29 | 1.03 | 0.01 | 1.04 | 2.08 | 59.38 | 6.32 | 1.45 | 1.17 | - | 8.94 |
| 31130 | Agricultural land resources | 14.13 | 6.15 | 0.48 | 1.88 | - | - | 8.51 | 0.79 | 0.08 | 2.22 | 3.09 | 11.60 | 2.03 | 0.14 | 0.36 | - | 2.53 |
| 31140 | Agricultural water resources | 35.39 | 10.11 | 1.01 | 1.40 | - | - | 12.52 | 4.55 | 0.74 | - | 5.29 | 17.81 | 17.07 | 0.51 | - | - | 17.58 |
| 31150 | Agricultural inputs | 59.79 | 55.36 | 0.75 | 1.57 | - | - | 57.67 | 0.11 | 0.02 | - | 0.13 | 57.81 | 1.99 | - | - | - | 1.99 |
| 31161 | Food crop production | 34.31 | 17.93 | 2.66 | 4.38 | - | - | 24.97 | 0.85 | 4.43 | 0.05 | 5.33 | 30.30 | 2.85 | 0.32 | 0.84 | - | 4.01 |
| 31162 | Industrial crops / export crops | 3.92 | 1.26 | 0.02 | 1.40 | - | - | 2.68 | 0.01 | 0.06 | - | 0.06 | 2.74 | 0.89 | - | 0.29 | - | 1.18 |
| 31163 | Livestock | 13.26 | 0.57 | 0.46 | 0.17 | - | - | 1.21 | 1.82 | 0.36 | 0.19 | 2.37 | 3.58 | 9.68 | - | - | - | 9.68 |
| 31164 | Agrarian reform | 0.00 | - | - | - | - | - | - | 0.00 | - | - | 0.00 | 0.00 | - | - | - | - | - |
| 31165 | Agricultural alternative development | 2.80 | - | - | - | - | - | - | 0.30 | - | 2.50 | 2.80 | 2.80 | - | - | - | - | - |
| 31166 | Agricultural extension | 17.67 | 11.17 | 3.11 | - | - | - | 14.28 | 0.04 | 0.00 | - | 0.04 | 14.32 | 3.35 | - | - | - | 3.35 |
| 31181 | Agricultural education/training | 19.12 | 10.07 | 4.02 | 4.07 | - | - | 18.16 | 0.02 | - | 0.20 | 0.22 | 18.38 | 0.39 | 0.03 | 0.32 | - | 0.74 |
| 31182 | Agricultural research | 30.51 | 2.55 | 1.15 | - | - | - | 3.70 | 0.49 | 0.00 | 22.61 | 23.10 | 26.80 | 2.38 | 1.34 | - | - | 3.71 |
| 31191 | Agricultural services | 20.18 | 9.84 | 1.24 | 0.11 | - | - | 11.19 | 0.09 | 0.36 | - | 0.45 | 11.64 | 8.29 | - | 0.24 | - | 8.53 |
| 31192 | Plant and post-harvest protection and pest control | 2.31 | 0.45 | - | - | - | - | 0.45 | 0.60 | 0.01 | 1.02 | 1.63 | 2.08 | 0.12 | 0.11 | - | - | 0.23 |
| 31193 | Agricultural financial services | 131.13 | 8.07 | 0.31 | 117.10 | - | - | 125.48 | 1.21 | 0.00 | - | 1.22 | 126.70 | 3.48 | 0.94 | - | - | 4.43 |
| 31194 | Agricultural co-operatives | 28.32 | 19.84 | 5.94 | - | - | - | 25.78 | 0.70 | - | - | 0.70 | 26.48 | 1.47 | - | 0.37 | - | 1.84 |
| 31195 | Livestock/veterinary services | 6.05 | - | 0.25 | 0.75 | - | - | 1.00 | 0.14 | - | - | 0.14 | 1.14 | 4.62 | 0.28 | - | - | 4.91 |
| 31210 | Forestry policy and administrative management | 25.33 | 1.71 | 0.89 | 3.28 | - | - | 5.88 | 1.44 | 0.00 | 3.23 | 4.67 | 10.56 | 13.30 | 0.28 | - | 1.19 | 14.77 |
| 31220 | Forestry development | 14.88 | 5.09 | 2.11 | 0.11 | - | - | 7.32 | 0.16 | 1.06 | 4.35 | 5.56 | 12.88 | 1.28 | 0.64 | 0.08 | - | 2.00 |
| 31261 | Fuelwood/charcoal | 0.37 | - | - | - | - | - | - | 0.00 | - | 0.15 | 0.15 | 0.15 | 0.22 | - | - | - | 0.22 |
| 31281 | Forestry education/training | 1.40 | 0.71 | 0.05 | - | - | - | 0.76 | 0.00 | - | - | 0.00 | 0.76 | - | - | - | 0.64 | 0.64 |
| 31282 | Forestry research | 0.69 | - | - | - | - | - | - | 0.00 | - | - | 0.00 | 0.00 | 0.05 | - | - | 0.64 | 0.69 |
| 31291 | Forestry services | 0.27 | 0.15 | - | - | - | - | 0.15 | 0.00 | - | 0.12 | 0.12 | 0.27 | - | - | - | - | - |
| 31310 | Fishing policy and administrative management | 6.31 | 0.73 | 0.07 | 0.47 | - | - | 1.27 | 0.69 | 0.00 | 0.59 | 1.28 | 2.55 | 3.76 | -0.00 | - | - | 3.76 |
| 31320 | Fishery development | 12.24 | 1.45 | 0.74 | 4.71 | - | - | 6.91 | 0.86 | 0.79 | 1.08 | 2.73 | 9.63 | 1.93 | 0.42 | 0.26 | - | 2.61 |
| 31381 | Fishery education/training | 1.12 | 0.62 | 0.28 | - | - | - | 0.89 | - | - | - | - | 0.89 | 0.23 | - | - | - | 0.23 |
| 31382 | Fishery research | 0.35 | - | 0.01 | - | - | - | 0.01 | 0.01 | - | - | 0.01 | 0.02 | 0.06 | 0.27 | - | - | 0.33 |
| 31391 | Fishery services | 0.32 | - | 0.05 | - | - | - | 0.05 | 0.00 | - | - | 0.00 | 0.05 | 0.27 | - | - | - | 0.27 |
| Industry | 86.67 | 21.33 | 5.44 | 2.48 | - | - | 29.26 | 9.47 | 5.48 | 18.64 | 33.59 | 62.85 | 22.61 | 1.09 | 0.12 | - | 23.82 | |
| 32110 | Industrial policy and administrative management | 14.51 | - | 0.18 | - | - | - | 0.18 | 0.03 | 1.84 | 10.36 | 12.23 | 12.41 | 2.11 | - | - | - | 2.11 |
| 32120 | Industrial development | 0.58 | 0.08 | - | - | - | - | 0.08 | - | 0.01 | - | 0.01 | 0.08 | 0.49 | - | - | - | 0.49 |
| 32130 | Small and medium-sized enterprises (SME) development | 33.17 | 12.99 | 1.24 | 0.66 | - | - | 14.89 | 7.27 | 1.99 | - | 9.26 | 24.15 | 7.97 | 0.99 | 0.06 | - | 9.02 |
| 32140 | Cottage industries and handicrafts | 0.11 | - | 0.11 | - | - | - | 0.11 | - | - | - | - | 0.11 | - | - | - | - | - |
| 32161 | Agro-industries | 18.20 | 1.93 | 3.68 | 0.30 | - | - | 5.91 | 1.86 | 1.56 | 0.21 | 3.63 | 9.53 | 8.58 | 0.08 | 0.01 | - | 8.67 |
| 32162 | Forest industries | 0.06 | - | - | - | - | - | - | 0.01 | - | 0.00 | 0.01 | 0.01 | 0.06 | - | - | - | 0.06 |
| 32163 | Textiles, leather and substitutes | 0.10 | - | - | - | - | - | - | 0.00 | 0.01 | - | 0.01 | 0.01 | 0.09 | - | - | - | 0.09 |
| 32164 | Chemicals | 0.00 | - | - | - | - | - | - | 0.00 | - | - | 0.00 | 0.00 | - | - | - | - | - |
| 32167 | Energy manufacturing | 0.30 | - | - | 0.30 | - | - | 0.30 | - | - | - | - | 0.30 | - | - | - | - | - |
| 32168 | Pharmaceutical production | 0.14 | - | - | - | - | - | - | 0.00 | 0.04 | 0.10 | 0.14 | 0.14 | - | - | - | - | - |
| 32171 | Engineering | 0.03 | - | - | - | - | - | - | - | - | 0.03 | 0.03 | 0.03 | - | - | - | - | - |
| 32182 | Technological research and development | 8.43 | 0.16 | - | - | - | - | 0.16 | 0.25 | - | 7.93 | 8.19 | 8.34 | 0.09 | - | - | - | 0.09 |
| 32210 | Mineral/mining policy and administrative management | 7.58 | 4.08 | 0.24 | 1.23 | - | - | 5.55 | 0.00 | 0.04 | - | 0.04 | 5.59 | 1.93 | 0.02 | 0.04 | - | 1.99 |
| 32220 | Mineral prospection and exploration | 0.33 | 0.17 | - | - | - | - | 0.17 | 0.05 | - | - | 0.05 | 0.23 | 0.10 | - | - | - | 0.10 |
| 32261 | Coal | 0.06 | 0.06 | - | - | - | - | 0.06 | - | 0.00 | - | 0.00 | 0.06 | - | - | - | - | - |
| 32262 | Oil and gas | 1.54 | 0.45 | - | - | - | - | 0.45 | - | - | - | - | 0.45 | 1.09 | - | - | - | 1.09 |
| 32265 | Precious metals/materials | 1.03 | 1.03 | - | - | - | - | 1.03 | - | - | - | - | 1.03 | - | - | - | - | - |
| 32266 | Industrial minerals | 0.10 | - | - | - | - | - | - | - | - | - | - | - | 0.10 | - | - | - | 0.10 |
| 32310 | Construction policy and administrative management | 0.39 | 0.38 | - | - | - | - | 0.38 | - | - | - | - | 0.38 | 0.01 | - | 0.01 | - | 0.02 |
| Trade policy and regulations | 36.20 | 7.11 | 2.10 | 1.58 | - | - | 10.79 | 1.74 | 0.94 | 0.27 | 2.95 | 13.74 | 21.63 | 0.75 | 0.07 | - | 22.46 | |
| 33110 | Trade policy and administrative management | 15.17 | 2.82 | 0.46 | 0.37 | - | - | 3.64 | 0.51 | 0.00 | - | 0.51 | 4.15 | 10.70 | 0.32 | - | - | 11.03 |
| 33120 | Trade facilitation | 7.41 | 2.66 | 0.15 | 0.37 | - | - | 3.18 | 0.94 | 0.36 | - | 1.30 | 4.48 | 2.94 | - | - | - | 2.94 |
| 33130 | Regional trade agreements | 0.76 | 0.21 | - | - | - | - | 0.21 | 0.14 | - | - | 0.14 | 0.36 | 0.41 | - | - | - | 0.41 |
| 33140 | Multilateral trade negotiations | 0.60 | 0.11 | - | 0.45 | - | - | 0.56 | 0.04 | - | - | 0.04 | 0.60 | - | - | - | - | - |
| 33150 | Trade-related adjustment | 0.01 | 0.01 | - | - | - | - | 0.01 | - | - | - | - | 0.01 | - | - | - | - | - |
| 33181 | Trade education/training | 1.18 | 0.55 | 0.05 | 0.40 | - | - | 1.00 | 0.02 | 0.05 | 0.10 | 0.18 | 1.18 | - | - | - | - | - |
| 33210 | Tourism policy and administrative management | 11.06 | 0.74 | 1.44 | - | - | - | 2.18 | 0.10 | 0.52 | 0.16 | 0.78 | 2.97 | 7.59 | 0.43 | 0.07 | - | 8.09 |
| General environmental protection | 249.37 | 55.60 | 13.29 | 44.36 | - | 0.17 | 113.43 | 16.60 | 3.47 | 64.15 | 84.23 | 197.65 | 11.20 | 5.13 | 0.75 | 34.64 | 51.72 | |
| 41010 | Environmental policy and administrative management | 149.04 | 13.19 | 2.81 | 34.15 | - | 0.07 | 50.22 | 9.62 | 3.40 | 46.55 | 59.57 | 109.79 | 7.51 | 4.41 | 0.46 | 26.87 | 39.25 |
| 41020 | Biosphere protection | 14.04 | 5.06 | 1.40 | - | - | 0.05 | 6.51 | 5.87 | - | 1.14 | 7.00 | 13.51 | 0.41 | - | - | 0.13 | 0.53 |
| 41030 | Biodiversity | 52.98 | 16.76 | 3.68 | 6.81 | - | 0.05 | 27.30 | 1.04 | 0.07 | 16.47 | 17.58 | 44.88 | 1.31 | - | 0.28 | 6.50 | 8.09 |
| 41040 | Site preservation | 2.42 | 0.78 | - | - | - | - | 0.78 | 0.03 | - | - | 0.03 | 0.80 | 1.41 | - | - | 0.20 | 1.61 |
| 41050 | Flood prevention/control | 0.06 | 0.06 | - | - | - | - | 0.06 | - | - | - | - | 0.06 | - | - | - | - | - |
| 41081 | Environmental education/training | 24.14 | 16.06 | 4.48 | 2.86 | - | - | 23.40 | 0.03 | - | - | 0.03 | 23.43 | 0.48 | 0.05 | 0.01 | 0.18 | 0.71 |
| 41082 | Environmental research | 6.70 | 3.69 | 0.92 | 0.55 | - | - | 5.17 | 0.01 | - | - | 0.01 | 5.18 | 0.08 | 0.68 | - | 0.76 | 1.52 |
| Multisector | 462.40 | 113.42 | 15.75 | 10.90 | - | 3.55 | 143.63 | 59.94 | 47.43 | 13.03 | 120.40 | 264.03 | 105.60 | 68.25 | 7.53 | 16.99 | 198.37 | |
| 43010 | Multisector aid | 156.64 | 37.82 | 10.63 | 4.61 | - | 0.66 | 53.72 | 49.00 | 39.96 | 4.01 | 92.97 | 146.69 | 0.07 | 7.75 | 0.88 | 1.25 | 9.95 |
| 43030 | Urban development and management | 20.85 | 0.03 | 0.18 | 0.23 | - | - | 0.44 | 0.07 | 0.90 | 1.10 | 2.08 | 2.52 | 16.97 | 0.24 | 1.12 | - | 18.33 |
| 43032 | Urban development | 0.15 | 0.15 | - | - | - | - | 0.15 | - | - | - | - | 0.15 | - | - | - | - | - |
| 43040 | Rural development | 28.14 | 3.48 | 4.18 | 0.50 | - | - | 8.16 | 2.38 | 4.00 | 1.93 | 8.32 | 16.48 | 11.53 | 0.07 | 0.06 | - | 11.66 |
| 43041 | Rural land policy and management | 1.95 | 1.23 | 0.49 | 0.24 | - | - | 1.95 | - | - | - | - | 1.95 | - | - | - | - | - |
| 43042 | Rural development | 1.22 | 1.22 | - | - | - | - | 1.22 | - | - | - | - | 1.22 | - | - | - | - | - |
| 43050 | Non-agricultural alternative development | 0.80 | 0.80 | - | - | - | - | 0.80 | - | - | - | - | 0.80 | - | - | - | - | - |
| 43060 | Disaster risk reduction | 54.76 | 23.36 | 0.07 | 5.25 | - | - | 28.68 | 0.40 | 0.59 | 3.08 | 4.06 | 32.74 | 17.78 | 0.05 | 3.19 | 1.00 | 22.02 |
| 43071 | Food security policy and administrative management | 13.12 | 3.03 | - | - | - | 0.44 | 3.46 | 0.63 | - | - | 0.63 | 4.09 | 0.33 | 7.75 | 0.94 | - | 9.02 |
| 43072 | Household food security programs | 25.68 | 22.24 | 0.15 | - | - | - | 22.40 | 0.02 | - | 2.90 | 2.92 | 25.31 | - | 0.10 | 0.27 | - | 0.36 |
| 43073 | Food safety and quality | 1.12 | 0.13 | - | - | - | - | 0.13 | 0.98 | - | - | 0.98 | 1.11 | 0.01 | - | 0.00 | - | 0.01 |
| 43081 | Multisector education/training | 3.03 | 0.19 | 0.00 | 0.04 | - | - | 0.22 | 0.01 | - | - | 0.01 | 0.23 | - | 1.72 | 1.08 | 0.00 | 2.80 |
| 43082 | Research/scientific institutions | 70.11 | - | 0.05 | 0.04 | - | 2.45 | 2.54 | 2.25 | 0.01 | - | 2.26 | 4.80 | - | 50.57 | 0.00 | 14.74 | 65.30 |
| 51010 | General budget support-related aid | 4.90 | - | - | - | - | - | - | 3.00 | 1.89 | 0.01 | 4.90 | 4.90 | - | - | - | - | - |
| 52010 | Food aid and food security programs | 21.42 | 19.76 | - | - | - | - | 19.76 | 1.21 | - | - | 1.21 | 20.96 | 0.46 | - | - | - | 0.46 |
| 60010 | Action relating to debt | 0.07 | - | - | - | - | - | - | - | 0.07 | - | 0.07 | 0.07 | - | - | - | - | - |
| 60020 | Debt forgiveness | 1.63 | - | - | - | - | - | - | - | - | - | - | - | 1.63 | - | - | - | 1.63 |
| 60030 | Relief of multilateral debt | 56.82 | - | - | - | - | - | - | - | - | - | - | - | 56.82 | - | - | - | 56.82 |
| Humanitarian assistance | 1,288.59 | 48.00 | 2.90 | 1,063.65 | - | - | 1,114.55 | 86.88 | 0.00 | 4.50 | 91.38 | 1,205.93 | 70.76 | -0.04 | 11.82 | 0.11 | 82.65 | |
| 72010 | Material relief assistance and services | 356.33 | 7.33 | 2.17 | 294.92 | - | - | 304.42 | 36.19 | - | - | 36.19 | 340.61 | 3.92 | - | 11.80 | - | 15.72 |
| 72011 | Basic health-care services in emergencies | 134.39 | 2.00 | - | 132.39 | - | - | 134.39 | - | - | - | - | 134.39 | - | - | - | - | - |
| 72012 | Education in emergencies | 11.79 | - | 0.51 | 11.28 | - | - | 11.79 | - | - | - | - | 11.79 | - | - | - | - | - |
| 72040 | Emergency food aid | 506.22 | 2.23 | - | 477.42 | - | - | 479.64 | 25.85 | - | - | 25.85 | 505.49 | 0.73 | - | - | - | 0.73 |
| 72050 | Relief coordination; protection and support services | 157.68 | 0.80 | 0.10 | 144.03 | - | - | 144.94 | 12.58 | - | - | 12.58 | 157.52 | 0.05 | - | - | 0.11 | 0.16 |
| 73010 | Reconstruction relief and rehabilitation | 35.06 | 21.76 | - | 0.54 | - | - | 22.30 | 5.16 | 0.00 | 0.23 | 5.39 | 27.69 | 7.35 | - | 0.02 | - | 7.37 |
| 74010 | Disaster prevention and preparedness | 1.86 | 1.85 | - | 0.05 | - | - | 1.90 | - | - | - | - | 1.90 | - | -0.04 | - | - | -0.04 |
| 74020 | Multi-hazard response preparedness | 85.25 | 12.04 | 0.11 | 3.03 | - | - | 15.18 | 7.09 | - | 4.27 | 11.36 | 26.54 | 58.71 | - | - | - | 58.71 |
| Other aid expenditures | 7,686.39 | 78.06 | 33.50 | 42.62 | 49.29 | 179.45 | 382.93 | 31.40 | 0.25 | 44.79 | 76.45 | 459.37 | 5,005.14 | 24.24 | 480.33 | 1,717.30 | 7,227.01 | |
| 91010 | Administrative costs | 415.30 | 78.13 | 17.63 | 38.36 | 49.24 | 175.95 | 359.31 | - | - | - | - | 359.31 | - | 24.30 | 0.57 | 31.12 | 55.99 |
| 93010 | Refugees in donor countries | 1,014.79 | - | - | - | - | - | - | 0.01 | - | - | 0.01 | 0.01 | - | - | - | 1,014.79 | 1,014.79 |
| 93011 | Refugees / asylum seekers in donor countries - food and shelter | 469.89 | - | - | - | - | - | - | - | - | - | - | - | - | - | - | 469.89 | 469.89 |
| 93013 | Refugees / asylum seekers in donor countries - health | 544.62 | - | - | - | - | - | - | - | - | - | - | - | - | - | 343.55 | 201.07 | 544.62 |
| 93014 | Refugees / asylum seekers in donor countries - other temporary sustenance | 117.48 | - | - | - | - | - | - | - | - | - | - | - | - | - | 117.48 | - | 117.48 |
| 99810 | Sectors not specified | 5,108.38 | -0.08 | 0.02 | 4.22 | 0.05 | 3.50 | 7.71 | 31.36 | 0.25 | 44.79 | 76.41 | 84.12 | 5,005.14 | - | 18.67 | 0.44 | 5,024.26 |
| 99820 | Promotion of development awareness | 15.93 | 0.01 | 15.85 | 0.04 | - | - | 15.91 | 0.03 | - | - | 0.03 | 15.94 | - | -0.06 | 0.06 | -0.00 | -0.01 |
| Total – International assistance | 16,049.89 | 1,507.01 | 354.16 | 3,197.25 | 375.62 | 191.82 | 5,625.87 | 398.44 | 310.85 | 643.07 | 1,352.35 | 6,978.22 | 6,360.15 | 180.04 | 509.06 | 2,022.41 | 9,071.67 | |
| (1) These sector codes were created for departmental use and are not part of OECD-DAC's purpose codes list. | ||||||||||||||||||
B2: Humanitarian assistance by country or organization
This table includes ODA and other official assistance expenditures in millions of Canadian dollars.
| Recipient country | Total | Global Affairs Canada | Other government sources | |||||||
|---|---|---|---|---|---|---|---|---|---|---|
| Emergency response | Reconstruction relief and rehabilitation | Disaster prevention and preparedness | Total | |||||||
| Material relief assistance and services | Basic health-care services in emergencies | Education in emergencies | Emergency food aid | Relief coordination; protection and support services | ||||||
| Sub-Saharan Africa (1) | 323.82 | 78.37 | 59.70 | 3.30 | 157.35 | 23.32 | 0.14 | 1.58 | 323.76 | 0.06 |
| Country-allocable | ||||||||||
| Benin | 0.02 | - | - | - | - | - | - | 0.02 | 0.02 | - |
| Burkina Faso | 13.61 | 0.77 | 2.85 | 0.12 | 8.57 | 1.29 | - | 0.01 | 13.61 | - |
| Cameroon | 5.06 | 0.88 | 0.79 | 0.36 | 2.30 | 0.73 | - | - | 5.06 | - |
| Central African Republic | 11.75 | 0.19 | 2.19 | - | 9.38 | - | - | - | 11.75 | - |
| Chad | 11.53 | 1.71 | 3.67 | 0.29 | 4.27 | 1.59 | - | - | 11.53 | 0.00 |
| Democratic Republic of Congo | 34.52 | 3.90 | 9.63 | 0.12 | 18.35 | 2.52 | - | - | 34.52 | - |
| Côte d’Ivoire | 0.01 | - | - | - | - | - | - | 0.01 | 0.01 | - |
| Eswatini | 0.00 | - | - | - | - | - | - | - | - | 0.00 |
| Ethiopia | 39.98 | 14.24 | 3.26 | 0.18 | 21.38 | 0.91 | - | - | 39.98 | - |
| Gambia | 0.00 | - | - | - | - | - | - | - | - | 0.00 |
| Kenya | 22.57 | 2.99 | 3.00 | 0.11 | 15.95 | 0.53 | - | - | 22.57 | - |
| Madagascar | 1.70 | 0.42 | - | - | 1.25 | - | - | - | 1.67 | 0.03 |
| Malawi | 0.50 | - | - | - | 0.50 | - | - | - | 0.50 | 0.00 |
| Mali | 8.58 | - | - | - | 8.33 | 0.25 | - | - | 8.58 | - |
| Mauritius | 0.00 | - | - | - | - | - | - | - | - | 0.00 |
| Mozambique | 1.12 | 0.65 | - | - | 0.25 | 0.20 | - | - | 1.10 | 0.02 |
| Niger | 8.82 | 0.49 | 0.25 | 0.32 | 7.45 | 0.30 | - | - | 8.82 | - |
| Nigeria | 23.89 | 3.73 | 7.27 | 0.13 | 11.40 | 1.38 | - | - | 23.89 | 0.00 |
| Rwanda | 0.01 | - | - | - | - | - | - | 0.01 | 0.01 | - |
| São Tomé and Príncipe | 0.00 | - | - | - | - | - | - | - | - | 0.00 |
| Senegal | 0.02 | - | - | - | - | - | - | 0.02 | 0.02 | - |
| Somalia | 32.87 | 9.73 | 11.75 | 0.08 | 11.02 | 0.30 | - | - | 32.87 | 0.00 |
| South Africa | 0.00 | - | - | - | - | - | - | - | - | 0.00 |
| South Sudan | 38.15 | 10.42 | 6.11 | 0.12 | 20.27 | 0.73 | - | 0.50 | 38.15 | - |
| Sudan | 32.48 | 10.57 | 7.47 | 0.30 | 12.49 | 1.65 | - | - | 32.48 | 0.00 |
| Tanzania | 0.15 | 0.06 | - | 0.02 | - | 0.08 | - | - | 0.15 | - |
| Uganda | 2.87 | 1.58 | 0.29 | 0.17 | - | 0.84 | - | - | 2.87 | - |
| Zambia | 0.00 | - | - | - | - | - | - | - | - | 0.00 |
| Zimbabwe | 1.25 | - | - | - | 1.25 | - | - | - | 1.25 | - |
| Region-allocable | ||||||||||
| East Africa | 0.91 | 0.36 | - | 0.09 | - | 0.46 | - | - | 0.91 | - |
| Sub-Saharan Africa | 6.30 | 6.30 | - | - | - | - | - | - | 6.30 | - |
| Africa | 25.13 | 9.38 | 1.17 | 0.91 | 2.94 | 9.57 | 0.14 | 1.03 | 25.13 | - |
| North Africa | 1.59 | 0.49 | - | 0.10 | - | 0.50 | - | - | 1.09 | 0.50 |
| Country-allocable | ||||||||||
| Algeria | 0.50 | 0.20 | - | 0.05 | - | 0.25 | - | - | 0.50 | - |
| Libya | 1.00 | 0.20 | - | 0.05 | - | 0.25 | - | - | 0.50 | 0.50 |
| Tunisia | 0.00 | - | - | - | - | - | - | - | - | 0.00 |
| Region-allocable | ||||||||||
| North Africa | 0.09 | 0.09 | - | - | - | - | - | - | 0.09 | - |
| Middle East | 292.29 | 79.75 | 41.11 | 3.96 | 128.24 | 35.27 | 1.50 | 2.50 | 292.32 | -0.03 |
| Country-allocable | ||||||||||
| Iraq | 17.76 | 6.35 | 3.09 | 0.29 | 2.08 | 5.95 | - | - | 17.76 | - |
| Jordan | 11.10 | 2.50 | 1.28 | 0.47 | 3.15 | 3.73 | - | - | 11.13 | -0.03 |
| Lebanon | 42.09 | 11.26 | 3.73 | 1.65 | 13.80 | 11.65 | - | - | 42.09 | - |
| Syria | 106.00 | 35.80 | 18.47 | 1.10 | 40.23 | 10.40 | - | - | 106.00 | - |
| West Bank and Gaza | 13.00 | 6.48 | 2.00 | - | 2.23 | 0.80 | 1.50 | - | 13.00 | - |
| Yemen | 82.87 | 14.36 | 10.55 | 0.25 | 53.26 | 1.94 | - | 2.50 | 82.87 | - |
| Region-allocable | ||||||||||
| Middle East | 19.49 | 3.00 | 2.00 | 0.20 | 13.49 | 0.80 | - | - | 19.49 | - |
| Asia | 116.54 | 37.80 | 6.21 | 0.69 | 60.28 | 9.78 | 0.18 | 1.54 | 116.48 | 0.06 |
| Country-allocable | ||||||||||
| Afghanistan | 58.27 | 10.56 | - | - | 46.00 | 1.69 | - | - | 58.25 | 0.02 |
| Bangladesh | 14.20 | 3.91 | 2.74 | 0.30 | 4.00 | 3.26 | - | - | 14.20 | 0.00 |
| Myanmar | 4.79 | 1.00 | 1.30 | 0.06 | 2.00 | 0.37 | 0.04 | 0.00 | 4.79 | - |
| China | 0.00 | - | - | - | - | - | - | - | - | 0.00 |
| India | 0.02 | - | - | - | - | - | - | - | - | 0.02 |
| Indonesia | 0.00 | - | - | - | - | - | - | - | - | 0.00 |
| Nepal | 0.02 | - | - | - | - | - | - | 0.02 | 0.02 | - |
| Pakistan | 23.55 | 15.95 | - | 0.22 | 6.25 | 1.12 | - | - | 23.55 | 0.00 |
| Philippines | 0.06 | 0.05 | - | - | - | - | - | - | 0.05 | 0.01 |
| Sri Lanka | 3.04 | 1.04 | 1.00 | - | 1.00 | - | - | - | 3.04 | - |
| Thailand | 0.00 | - | - | - | - | - | - | - | - | 0.00 |
| Region-allocable | ||||||||||
| Asia | 11.78 | 5.03 | 1.17 | 0.10 | 0.99 | 3.33 | 0.14 | 1.02 | 11.78 | - |
| South Asia | 0.30 | 0.26 | - | - | 0.05 | - | - | - | 0.30 | - |
| Southeast Asia | 0.50 | - | - | - | - | - | - | 0.50 | 0.50 | - |
| Americas | 91.83 | 11.41 | 10.61 | 0.88 | 29.97 | 7.15 | 20.35 | 11.45 | 91.82 | 0.02 |
| Country-allocable | ||||||||||
| Belize | 1.11 | - | - | - | - | - | - | 1.11 | 1.11 | - |
| Bolivia | 0.02 | - | - | - | - | - | - | 0.02 | 0.02 | - |
| Brazil | 0.00 | - | - | - | - | - | - | - | - | 0.00 |
| Colombia | 8.06 | 1.39 | 2.14 | 0.12 | 3.52 | 0.87 | - | - | 8.05 | 0.01 |
| Cuba | 0.10 | 0.10 | - | - | - | - | - | - | 0.10 | - |
| Dominica | 1.07 | - | - | - | - | - | - | 1.07 | 1.07 | - |
| Dominican Republic | 0.00 | - | - | - | - | - | - | - | - | 0.00 |
| Ecuador | 1.00 | 0.20 | - | 0.05 | 0.50 | 0.25 | - | - | 1.00 | 0.00 |
| El Salvador | 0.50 | - | - | - | 0.50 | - | - | - | 0.50 | - |
| Grenada | 1.07 | - | - | - | - | - | - | 1.07 | 1.07 | - |
| Guatemala | 5.18 | - | - | - | 5.17 | - | - | 0.01 | 5.18 | - |
| Guyana | 1.07 | - | - | - | - | - | - | 1.07 | 1.07 | - |
| Haiti | 37.94 | 1.30 | 4.00 | - | 12.63 | 0.00 | 20.00 | 0.01 | 37.94 | - |
| Honduras | 4.98 | - | 0.75 | - | 4.23 | - | - | - | 4.98 | 0.00 |
| Jamaica | 1.07 | - | - | - | - | - | - | 1.07 | 1.07 | - |
| Nicaragua | 0.50 | - | - | - | 0.50 | - | - | - | 0.50 | - |
| Peru | 0.70 | 0.15 | - | 0.04 | 0.32 | 0.19 | - | - | 0.70 | 0.00 |
| Saint Lucia | 1.07 | - | - | - | - | - | - | 1.07 | 1.07 | - |
| Saint Vincent and the Grenadines | 1.11 | - | - | - | - | - | - | 1.11 | 1.11 | - |
| Suriname | 1.16 | 0.05 | - | - | - | - | - | 1.11 | 1.16 | - |
| Venezuela | 6.05 | 0.60 | 2.55 | 0.15 | 2.00 | 0.75 | - | - | 6.05 | 0.00 |
| Region-allocable | ||||||||||
| Caribbean | 2.25 | 0.32 | - | - | - | - | 0.22 | 1.71 | 2.25 | - |
| Central America | 1.91 | 0.97 | - | 0.15 | 0.05 | 0.75 | - | - | 1.91 | - |
| South America | 0.41 | 0.36 | - | - | 0.05 | - | - | - | 0.41 | - |
| Americas | 13.50 | 5.96 | 1.17 | 0.38 | 0.50 | 4.33 | 0.14 | 1.02 | 13.50 | - |
| Europe | 296.94 | 95.91 | 16.36 | 2.86 | 101.80 | 68.58 | 0.14 | 0.00 | 285.64 | 11.30 |
| Country-allocable | ||||||||||
| Hungary | 0.40 | 0.13 | 0.13 | - | - | 0.14 | - | - | 0.40 | - |
| Moldova | 10.55 | 5.79 | 0.13 | 0.75 | - | 3.88 | - | - | 10.55 | - |
| Poland | 3.30 | 2.76 | 0.26 | - | - | 0.27 | - | - | 3.30 | - |
| Romania | 6.27 | 5.38 | 0.13 | - | - | 0.75 | - | - | 6.27 | - |
| Slovakia | 1.40 | 1.13 | 0.13 | - | - | 0.14 | - | - | 1.40 | - |
| Türkiye | 30.63 | 19.93 | - | - | 10.00 | 0.20 | - | - | 30.13 | 0.50 |
| Ukraine | 229.85 | 54.12 | 14.98 | 1.21 | 91.80 | 56.94 | - | - | 219.05 | 10.80 |
| Region-allocable | ||||||||||
| Europe | 14.55 | 6.65 | 0.59 | 0.90 | - | 6.26 | 0.14 | 0.00 | 14.55 | - |
| Oceania | 1.41 | 0.69 | 0.40 | - | - | 0.31 | - | 0.00 | 1.41 | 0.00 |
| Country-allocable | ||||||||||
| Solomon Islands | 0.00 | - | - | - | - | - | - | - | - | 0.00 |
| Tonga | 0.00 | - | - | - | - | - | - | - | - | 0.00 |
| Vanuatu | 0.00 | - | - | - | - | - | - | - | - | 0.00 |
| Region-allocable | ||||||||||
| Oceania | 1.41 | 0.69 | 0.40 | - | - | 0.31 | - | 0.00 | 1.41 | - |
| Global/unallocable | 2.02 | - | - | - | 2.00 | 0.03 | - | - | 2.03 | -0.01 |
| Bilateral humanitarian assistance | 1,126.45 | 304.42 | 134.39 | 11.79 | 479.64 | 144.94 | 22.30 | 17.08 | 1,114.55 | 11.89 |
| Recipient organization | ||||||||||
| Central Emergency Response Fund | 29.40 | 18.17 | - | - | 7.05 | 4.18 | - | - | 29.40 | - |
| Food and Agriculture Organization | 0.88 | 0.12 | - | - | - | 0.01 | 0.04 | 0.71 | 0.88 | - |
| Global Environment Facility Trust Fund | 4.50 | - | - | - | - | - | 0.23 | 4.27 | 4.50 | - |
| Inter-American Development Bank, Inter-American Investment Corporation, Multilateral Investment Fund and Fund for Special Operations | 0.00 | - | - | - | - | - | 0.00 | - | 0.00 | - |
| International Development Association | 70.76 | - | - | - | - | - | - | - | - | 70.76 |
| International Labour Organization | 0.05 | - | - | - | - | - | 0.05 | - | 0.05 | - |
| United Nations Children’s Fund | 6.15 | 6.15 | - | - | - | - | - | - | 6.15 | - |
| United Nations Development Programme | 5.72 | 0.20 | - | - | 0.00 | 0.10 | 2.35 | 3.06 | 5.72 | - |
| United Nations Office for the Coordination of Humanitarian Affairs | 2.00 | - | - | - | - | 2.00 | - | - | 2.00 | - |
| United Nations High Commissioner for Refugees | 12.60 | 7.18 | - | - | - | 5.42 | - | - | 12.60 | - |
| United Nations Population Fund | 2.12 | 1.59 | - | - | - | 0.52 | - | 0.00 | 2.12 | - |
| United Nations Relief and Works Agency for Palestine Refugees in the Near East | 1.87 | 1.87 | - | - | - | - | - | - | 1.87 | - |
| World Trade Organization - International Trade Centre | 0.00 | - | - | - | - | - | - | 0.00 | 0.00 | - |
| World Food Programme | 23.28 | - | - | - | 18.80 | 0.36 | 2.73 | 1.40 | 23.28 | - |
| World Health Organization | 2.82 | 0.91 | - | - | - | - | - | 1.91 | 2.82 | - |
| Multilateral humanitarian assistance | 162.14 | 36.19 | - | - | 25.85 | 12.58 | 5.39 | 11.36 | 91.38 | 70.76 |
| Total - Humanitarian assistance | 1,288.59 | 340.61 | 134.39 | 11.79 | 505.49 | 157.52 | 27.69 | 28.44 | 1,205.93 | 82.65 |
| (1) Projects coded to Africa are included under Sub-Saharan Africa because the majority of the benefits will incur to countries in that region. | ||||||||||
Section C: Canadian international assistance by recipient organization
C1: Summary of Global Affairs Canada’s international assistance by type of organization
This table includes ODA and other official assistance expenditures in millions of Canadian dollars and excludes operations and management costs as well as services rendered abroad.
| Total | Geographic programs | Global Issues and Development | Partnerships for Development Innovation | International Security and Political Affairs | Other programs | |
|---|---|---|---|---|---|---|
| Canadian organizations | 1,158.01 | 421.09 | 339.00 | 331.22 | 58.76 | 7.95 |
| Civil society (1) | 1,022.89 | 346.75 | 335.01 | 319.64 | 14.42 | 7.08 |
| Government | 51.28 | 8.22 | 2.28 | 4.32 | 35.57 | 0.88 |
| Private sector | 83.84 | 66.12 | 1.71 | 7.26 | 8.76 | - |
| Foreign organizations | 859.59 | 320.15 | 401.94 | 5.31 | 130.53 | 1.67 |
| Civil society (1) | 419.20 | 179.14 | 144.47 | 5.24 | 88.68 | 1.67 |
| Government (2) | 278.74 | 123.61 | 120.15 | - | 34.99 | - |
| Private sector | 161.65 | 17.40 | 137.32 | 0.07 | 6.86 | - |
| Multilateral organizations (3) | 4,601.30 | 750.09 | 3,685.62 | - | 158.85 | 6.75 |
| Grants and contributions | 4,122.0 | 750.09 | 3,206.35 | - | 158.85 | 6.75 |
| Payments to international financial institutions | 479.27 | - | 479.27 | - | - | - |
| Total | 6,618.91 | 1,491.33 | 4,426.55 | 336.53 | 348.13 | 16.36 |
(1) For a detailed breakdown of transfer payments to civil society organizations, please consult Section 6 of the Public Accounts of Canada. (2) Global Affairs Canada’s assistance to foreign governments is based on program-based approaches (such as budget support and pooled funding), in line with the Paris Declaration on Aid Effectiveness. (3) More information on contributions to multilateral organizations can be found in Table C2 of this report. | ||||||
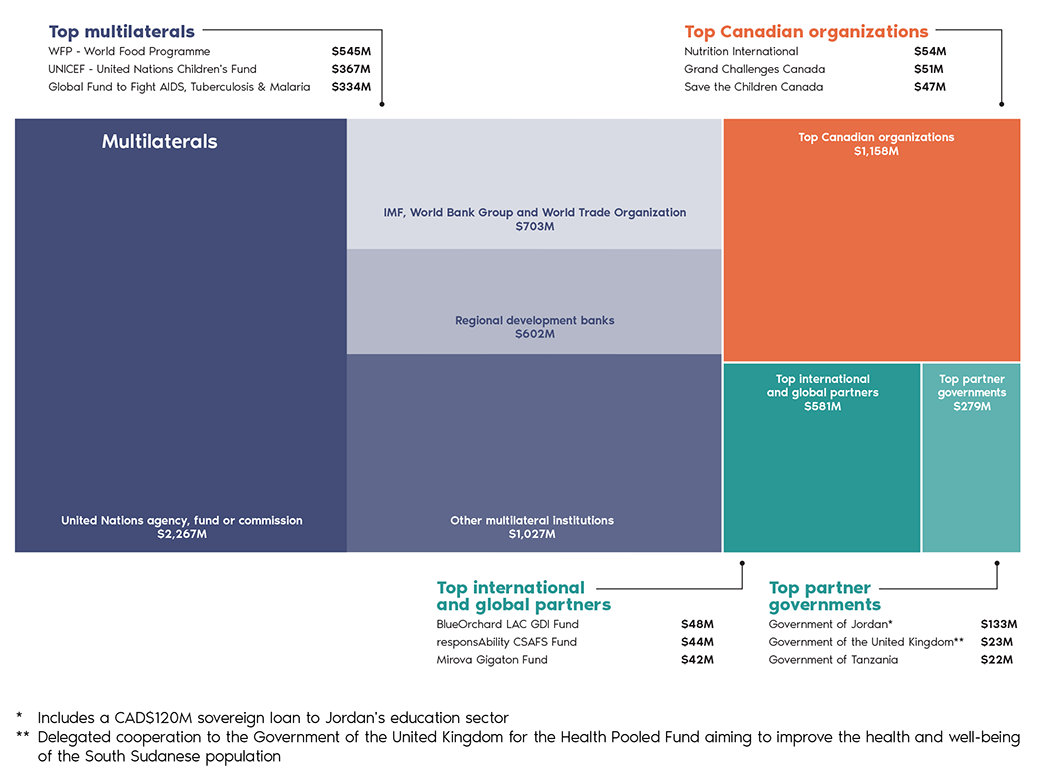
Text version
Types of organization
| Organization | Total |
|---|---|
| Top Canadian organizations | $1,158M |
| Regional development banks | $602M |
| Other multilateral institutions | $1,027M |
| Top international and global partners | $581M |
| Top partner governments | $279M |
| United Nations agency, fund or commission | $2,267M |
| IMF, World Bank Group and World Trade Organization | $703M |
Top partners
| Organization | Total |
|---|---|
| Top Canadian organizations | |
| Nutrition International | $54M |
| Grand Challenges Canada | $51M |
| Save the Children Canada | $47M |
| Top partner governments | |
| Government of Jordan* | $133M |
| Government of the United Kingdom** | $23M |
| Government of Tanzania | $22M |
| Top international and global partners | |
| BlueOrchard LAC GDI Fund | $48M |
| responsAbility CSAFS Fund | $44M |
| Mirova Gigaton Fund | $42M |
| Top multilateral organizations | |
| WFP - World Food Programme | $545M |
| UNICEF - United Nations Children’s Fund | $367M |
| Global Fund to Fight AIDS, Tuberculosis & Malaria | $334M |
* Includes a CAD$120M sovereign loan to Jordan’s education sector
** Delegated cooperation to the Government of the United Kingdom for the Health Pooled Fund aiming to improve the health and well-being of the South Sudanese population
C2: International assistance by multilateral organization
This table includes ODA and other official assistance expenditures in millions of Canadian dollars and excludes operations and management costs as well as services rendered abroad.
| Recipient Organization | Total | Global Affairs Canada | Other government sources | |||||||||
|---|---|---|---|---|---|---|---|---|---|---|---|---|
| Institutional support to multilateral organizations | Global initiatives | Geographic programs | Other programs (1) | Total | Department of Finance Canada | Quebec | Environment and Climate Change Canada | Others (2) | Total | |||
| United Nations agency, fund or commission | 2,326.09 | 398.44 | 1,205.11 | 539.18 | 124.23 | 2,266.96 | - | 1.07 | 24.85 | 33.20 | 59.12 | |
| CERF | Central Emergency Response Fund | 29.40 | 29.40 | - | - | - | 29.40 | - | - | - | - | - |
| UNCCD | United Nations Convention to Combat Desertification | 1.48 | 0.28 | 1.20 | - | - | 1.48 | - | - | - | - | - |
| ESCAP | Economic and Social Commission for Asia and the Pacific | 2.15 | - | 2.15 | - | - | 2.15 | - | - | - | - | - |
| ECA | Economic Commission for Africa | 3.50 | - | - | 3.50 | - | 3.50 | - | - | - | - | - |
| FAO | Food and Agriculture Organization | 97.92 | 14.54 | 5.00 | 78.38 | - | 97.92 | - | - | - | - | - |
| IARC | International Agency for Research on Cancer | 0.66 | 0.66 | - | - | - | 0.66 | - | - | - | - | - |
| IAEA-TCF | International Atomic Energy Agency (Contributions to Technical Cooperation Fund) | 11.53 | 3.44 | - | - | 8.09 | 11.53 | - | - | - | - | - |
| IAEA-Assessed | International Atomic Energy Agency - Assessed Contributions | 5.01 | 5.01 | - | - | - | 5.01 | - | - | - | - | - |
| IFAD | International Fund for Agricultural Development | 39.92 | 25.00 | 11.92 | 3.00 | - | 39.92 | - | - | - | - | - |
| ILO-Assessed | International Labour Organization - Assessed Contributions | 7.42 | 7.42 | - | - | - | 7.42 | - | - | - | - | - |
| ILO-RBSA | International Labour Organization - Regular Budget Supplementary Account | 30.77 | - | - | 20.85 | - | 20.85 | - | - | - | 9.92 | 9.92 |
| UNIDIR | United Nations Institute for Disarmament Research | 0.51 | - | - | - | 0.51 | 0.51 | - | - | - | - | - |
| IOM | International Organization for Migration | 63.02 | - | 35.00 | 13.63 | 6.66 | 55.29 | - | - | - | 7.72 | 7.72 |
| ITU | International Telecommunication Union | 0.94 | - | - | - | - | - | - | - | - | 0.94 | 0.94 |
| UNAIDS | Joint United Nations Programme on HIV/AIDS | 5.00 | 5.00 | - | - | - | 5.00 | - | - | - | - | - |
| MFMP | Multilateral Fund for the Implementation of the Montreal Protocol | 13.71 | 10.43 | - | - | - | 10.43 | - | - | 3.28 | - | 3.28 |
| PAHO | Pan-American Health Organization | 88.01 | 15.75 | 1.25 | 71.00 | - | 88.00 | - | 0.01 | - | - | 0.01 |
| UN | United Nations | 84.76 | 76.68 | - | - | 8.08 | 84.76 | - | - | - | - | - |
| UNICEF | United Nations Children’s Fund | 461.06 | 16.20 | 364.99 | 73.06 | 6.65 | 460.90 | - | - | - | 0.16 | 0.16 |
| UNDEF | United Nations Democracy Fund | 1.00 | - | - | - | 1.00 | 1.00 | - | - | - | - | - |
| UNDPKO | United Nations Department of Peacekeeping Operations | 34.45 | 26.75 | - | - | 7.71 | 34.45 | - | - | - | - | - |
| UNDPPA-SZA | United Nations Department of Political and Peacebuilding Affairs, Trust Fund in Support of Political Affairs | 1.00 | - | - | - | 1.00 | 1.00 | - | - | - | - | - |
| UNDP | United Nations Development Programme | 126.67 | 40.00 | 12.43 | 66.08 | 7.18 | 125.69 | - | - | 0.85 | 0.12 | 0.97 |
| UNESCO | United Nations Educational, Scientific and Cultural Organization | 11.74 | 7.14 | 1.30 | - | 0.40 | 8.84 | - | 0.51 | - | 2.38 | 2.89 |
| UN WOMEN | United Nations Entity for Gender Equality and the Empowerment of Women | 35.72 | 6.50 | 2.00 | 23.60 | 3.62 | 35.72 | - | - | - | - | - |
| UNEP | United Nations Environment Programme | 15.31 | - | 0.66 | 0.50 | - | 1.16 | - | 0.52 | 12.12 | 1.51 | 14.15 |
| UNFCCC | United Nations Framework Convention on Climate Change | 2.05 | 0.55 | - | - | - | 0.55 | - | - | 1.50 | - | 1.50 |
| OHCHR | Office of the United Nations High Commissioner for Human Rights (extrabudgetary contributions) | 10.61 | 5.00 | - | 0.70 | 4.91 | 10.61 | - | - | - | - | - |
| UNIDO | United Nations Industrial Development Organization | 5.25 | - | - | 5.25 | - | 5.25 | - | - | - | - | - |
| UNISDR | United Nations International Strategy for Disaster Reduction | 2.00 | - | - | 2.00 | - | 2.00 | - | - | - | - | - |
| UNMAS | United Nations Mine Action Service | 2.04 | - | - | - | 2.04 | 2.04 | - | - | - | - | - |
| UNOPS | United Nations Office for Project Services | 18.07 | - | 2.00 | 8.92 | 2.65 | 13.57 | - | - | 4.50 | - | 4.50 |
| UNOCHA | United Nations Office for the Coordination of Humanitarian Affairs | 54.87 | 2.00 | 52.07 | 0.80 | - | 54.87 | - | - | - | - | - |
| UN DCO | United Nations Development Coordination Office | 3.74 | 3.00 | - | - | 0.74 | 3.74 | - | - | - | - | - |
| UNHCR | United Nations High Commissioner for Refugees | 126.89 | 12.60 | 100.86 | 10.35 | - | 123.81 | - | 0.01 | - | 3.07 | 3.08 |
| UNODC | United Nations Office on Drugs and Crime | 17.24 | - | - | 2.00 | 15.15 | 17.15 | - | - | - | 0.09 | 0.09 |
| PBF Window 2 | United Nations Peacebuilding Fund (Window Two: Restricted Contributions) | 0.87 | - | - | - | 0.87 | 0.87 | - | - | - | - | - |
| UNFPA | United Nations Population Fund | 91.65 | 15.60 | 25.55 | 48.40 | - | 89.55 | - | - | - | 2.10 | 2.10 |
| UNRWA | United Nations Relief and Works Agency for Palestine Refugees in the Near East | 35.25 | 28.50 | 5.00 | 1.75 | - | 35.25 | - | - | - | - | - |
| UNU | United Nations University (including Endowment Fund) | 2.70 | 2.00 | - | - | - | 2.00 | - | - | - | 0.70 | 0.70 |
| UNVFVT | United Nations Voluntary Fund for Victims of Torture | 0.06 | - | - | - | 0.06 | 0.06 | - | - | - | - | - |
| UPU | Universal Postal Union | 0.44 | - | - | - | - | - | - | - | - | 0.44 | 0.44 |
| UN MPTF | UN Multi-Partner Trust Fund Office | 33.02 | - | - | - | 31.52 | 31.52 | - | - | 1.50 | - | 1.50 |
| WFP | World Food Programme | 555.38 | 25.00 | 438.14 | 92.25 | - | 555.38 | - | - | - | - | - |
| WHO-Assessed | World Health Organization - Assessed Contributions | 0.06 | - | - | 0.06 | - | 0.06 | - | - | - | - | - |
| WHO | World Health Organization | 175.38 | 13.01 | 143.60 | 10.25 | 4.51 | 171.38 | - | - | - | 4.00 | 4.00 |
| WIPO | World Intellectual Property Organization | 0.05 | 0.02 | - | - | - | 0.02 | - | - | - | 0.03 | 0.03 |
| WMO | World Meteorological Organization | 1.10 | - | - | - | - | - | - | - | 1.10 | - | 1.10 |
| WTO-ITC | World Trade Organization - International Trade Centre | 0.96 | 0.96 | - | - | - | 0.96 | - | - | - | - | - |
| Other United Nations agency, fund or commission | 13.77 | 0.00 | - | 2.86 | 10.88 | 13.73 | - | 0.01 | - | 0.03 | 0.04 | |
| International Monetary Fund | 4,390.54 | - | - | 0.40 | - | 0.40 | 4,390.14 | - | - | - | 4,390.14 | |
| World Bank Group | 2,161.94 | 10.00 | 564.76 | 127.80 | 0.50 | 703.06 | 1,445.38 | - | 13.50 | - | 1,458.88 | |
| IBRD | International Bank for Reconstruction and Development | 587.06 | 10.00 | 464.76 | 112.30 | - | 587.06 | - | - | - | - | - |
| IDA | International Development Association | 1,298.18 | - | - | - | - | - | 1,298.18 | - | - | - | 1,298.18 |
| IDA-MDRI | International Development Association - Multilateral Debt Relief Initiative | 32.20 | - | - | - | - | - | 32.20 | - | - | - | 32.20 |
| IFC | International Finance Corporation | 100.00 | - | 100.00 | - | - | 100.00 | - | - | - | - | - |
| PMI | Partnership for Market Implementation | 11.00 | - | - | - | - | - | - | - | 11.00 | - | 11.00 |
| Other World Bank Group | 133.50 | - | - | 15.50 | 0.50 | 16.00 | 115.00 | - | 2.50 | - | 117.50 | |
| World Trade Organization | 1.40 | - | 1.40 | - | - | 1.40 | - | - | - | - | - | |
| Regional development banks | 626.99 | 310.85 | 283.13 | 8.10 | 0.30 | 602.37 | 24.62 | - | - | - | 24.62 | |
| ADB | African Development Fund | 283.95 | 257.23 | - | 2.10 | - | 259.33 | 24.62 | - | - | - | 24.62 |
| AsDB | Asian Development Bank | 30.64 | 30.14 | - | 0.50 | - | 30.64 | - | - | - | - | - |
| CDB | Caribbean Development Bank | 20.35 | 20.35 | - | - | - | 20.35 | - | - | - | - | - |
| EBRD | European Bank for Reconstruction and Development | 283.13 | - | 283.13 | - | - | 283.13 | - | - | - | - | - |
| IDB FSO | Inter-American Development Bank, Fund for Special Operations | 0.25 | 0.25 | - | - | - | 0.25 | - | - | - | - | - |
| IDB | Inter-American Development Bank, Inter-American Investment Corporation and Multilateral Investment Fund | 8.67 | 2.87 | - | 5.50 | 0.30 | 8.67 | - | - | - | - | - |
| Other multilateral institutions | 1,054.31 | 633.07 | 363.56 | 12.17 | 18.31 | 1,027.11 | - | 23.86 | 1.13 | 2.21 | 27.20 | |
| AF | Adaptation Fund | 10.00 | - | - | - | - | - | - | 10.00 | - | - | 10.00 |
| AU | African Union (excluding peacekeeping facilities) | 2.00 | - | - | 2.00 | - | 2.00 | - | - | - | - | - |
| ASEAN | Association of Southeast Asian Nations: Economic Cooperation | 0.75 | - | - | 0.75 | - | 0.75 | - | - | - | - | - |
| CARICOM | Caribbean Community Secretariat | 0.54 | - | - | 0.54 | - | 0.54 | - | - | - | - | - |
| CGIAR | Consultative Group on International Agricultural Research | 25.20 | 25.00 | - | - | - | 25.00 | - | - | - | 0.20 | 0.20 |
| CF | Commonwealth Foundation | 1.13 | 1.13 | - | - | - | 1.13 | - | - | - | - | - |
| COL | Commonwealth of Learning | 4.60 | 2.60 | 2.00 | - | - | 4.60 | - | - | - | - | - |
| CS | Commonwealth Secretariat | 6.22 | 6.22 | - | - | - | 6.22 | - | - | - | - | - |
| GICHD | Geneva International Centre for Humanitarian Demining | 0.83 | - | - | - | 0.83 | 0.83 | - | - | - | - | - |
| GAVI | Gavi, The Vaccine Alliance | 230.00 | 70.00 | 160.00 | - | - | 230.00 | - | - | - | - | - |
| GEF | Global Environment Facility Trust Fund | 132.99 | 132.99 | - | - | - | 132.99 | - | - | - | - | - |
| Global Fund | Global Fund to Fight AIDS, Tuberculosis and Malaria | 433.90 | 333.90 | 100.00 | - | - | 433.90 | - | - | - | - | - |
| GPE | Global Partnership for Education | 100.00 | - | 100.00 | - | - | 100.00 | - | - | - | - | - |
| IICA | Inter-American Institute for Cooperation on Agriculture | 4.76 | 4.75 | - | - | - | 4.75 | - | 0.02 | - | - | 0.02 |
| IDLO | International Development Law Organization | 0.39 | - | - | 0.39 | - | 0.39 | - | - | - | - | - |
| IFFIm | International Finance Facility for Immunisation | 5.00 | 5.00 | - | - | - | 5.00 | - | - | - | - | - |
| IDEA | International Institute for Democracy and Electoral Assistance | 0.50 | 0.25 | - | - | 0.25 | 0.50 | - | - | - | - | - |
| INBAR | International Bamboo and Rattan Organization | 0.04 | - | - | - | - | - | - | - | 0.04 | - | 0.04 |
| OIF | International Organization of La Francophonie | 43.14 | 29.25 | - | - | - | 29.25 | - | 13.83 | - | 0.06 | 13.89 |
| IRENA | International Renewable Energy Agency | 0.48 | 0.48 | - | - | - | 0.48 | - | - | - | - | - |
| JSCA | Justice Studies Center of the Americas | 0.59 | - | - | 0.49 | - | 0.49 | - | - | - | 0.09 | 0.09 |
| OECD | Organisation for Economic Co-operation and Development | 4.05 | - | 1.56 | 0.60 | 1.25 | 3.41 | - | - | 0.50 | 0.14 | 0.64 |
| OECD-Dev. Centre | OECD Development Centre | 0.02 | - | - | - | - | - | - | 0.02 | - | - | 0.02 |
| OAS | Organization of American States | 22.43 | 13.45 | - | 1.83 | 7.03 | 22.30 | - | - | - | 0.12 | 0.12 |
| OSCE | Organization for Security and Co-operation in Europe | 8.88 | 8.05 | - | - | 0.83 | 8.88 | - | - | - | - | - |
| Other multilateral institutions | 15.88 | - | - | 5.57 | 8.12 | 13.69 | - | - | 0.59 | 1.59 | 2.18 | |
| Total | 10,561.28 | 1,352.35 | 2,417.95 | 687.65 | 143.34 | 4,601.30 | 5,860.15 | 24.94 | 39.48 | 35.41 | 5,959.97 | |
Section D: Canadian international assistance by recipient
Geographic distribution of Canada’s total international assistance
Figures in millions of Canadian dollars
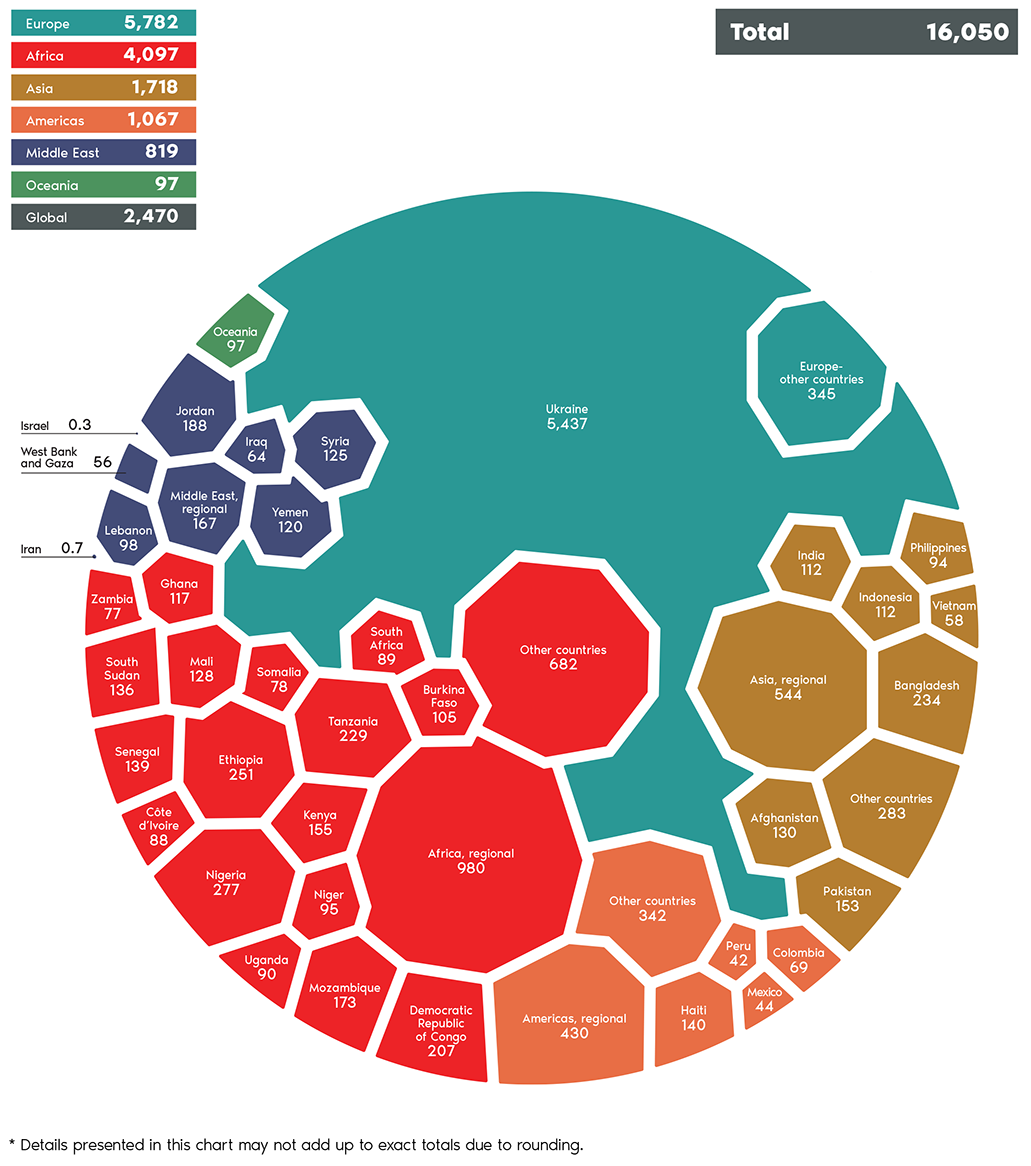
Text version
| Continent total | Total | Percentage of total |
|---|---|---|
| Africa | 4,097 | 30% |
| Americas | 1,067 | 8% |
| Asia | 1,718 | 13% |
| Europe | 5,782 | 43% |
| Middle East | 819 | 6% |
| Oceania | 97 | 1% |
| Global | 2,470 | - |
| Total | 16,050 | 100% |
| Continent | Country | Amount | Percentage of full circle |
|---|---|---|---|
| Africa | Africa, regional | 980 | 7% |
| Africa | Nigeria | 277 | 2% |
| Africa | Ethiopia | 251 | 2% |
| Africa | Tanzania | 229 | 2% |
| Africa | Democratic Republic of Congo | 207 | 2% |
| Africa | Mozambique | 173 | 1% |
| Africa | Kenya | 155 | 1% |
| Africa | Senegal | 139 | 1% |
| Africa | South Sudan | 136 | 1% |
| Africa | Mali | 128 | 1% |
| Africa | Ghana | 117 | 1% |
| Africa | Burkina Faso | 105 | 1% |
| Africa | Niger | 95 | 1% |
| Africa | Uganda | 90 | 1% |
| Africa | South Africa | 89 | 1% |
| Africa | Côte d’Ivoire | 88 | 1% |
| Africa | Somalia | 78 | 1% |
| Africa | Zambia | 77 | 1% |
| Africa | Other countries | 682 | 5% |
| Americas | Americas, regional | 430 | 3% |
| Americas | Haiti | 140 | 1% |
| Americas | Colombia | 69 | 1% |
| Americas | Mexico | 44 | 0% |
| Americas | Peru | 42 | 0% |
| Americas | Other countries | 342 | 3% |
| Asia | Asia, regional | 544 | 4% |
| Asia | Bangladesh | 234 | 2% |
| Asia | Pakistan | 153 | 1% |
| Asia | Afghanistan | 130 | 1% |
| Asia | India | 112 | 1% |
| Asia | Indonesia | 112 | 1% |
| Asia | Philippines | 94 | 1% |
| Asia | Vietnam | 58 | 0% |
| Asia | Other countries | 283 | 2% |
| Europe | Ukraine | 5,437 | 40% |
| Europe | Europe - Other countries | 345 | 3% |
| Middle East | Jordan | 188 | 1% |
| Middle East | Middle East, regional | 167 | 1% |
| Middle East | Syria | 125 | 1% |
| Middle East | Yemen | 120 | 1% |
| Middle East | Lebanon | 98 | 1% |
| Middle East | Iraq | 64 | 0% |
| Middle East | West Bank and Gaza | 56 | 0% |
| Middle East | Iran | 0.7 | 0% |
| Middle East | Israel | 0.3 | 0% |
| Oceania | Oceania | 97 | 1% |
* Details presented in this chart may not add up to exact totals due to rounding.
D1: International assistance by channel and continent
This table includes ODA and other official assistance expenditures in millions of Canadian dollars.
| Recipient organization | Total | Global Affairs Canada | Other government sources | ||||||||||
|---|---|---|---|---|---|---|---|---|---|---|---|---|---|
| Geographic programs | Partnerships for Development Innovation | Global Issues and Development | International Security and Political Affairs | Others | Total | Department of Finance Canada | International Development Research Centre | Environment and Climate Change Canada | Provinces, territories and municipalities | Others | Total | ||
| Africa | |||||||||||||
| Sub-Saharan Africa (1) | 4,045.14 | 613.83 | 252.23 | 1,915.05 | 74.76 | 76.68 | 2,932.55 | 935.50 | 70.27 | 3.61 | 9.14 | 94.05 | 1,112.59 |
| Bilateral aid | 2,335.11 | 613.83 | 252.23 | 1,149.30 | 71.04 | 76.67 | 2,163.07 | - | 70.27 | 3.61 | 4.51 | 93.65 | 172.04 |
| Country-allocable | 1,499.04 | 551.38 | 193.97 | 585.74 | 25.33 | 0.70 | 1,357.12 | - | 40.43 | 3.61 | 4.24 | 93.63 | 141.91 |
| of which ODA | 1,490.51 | 551.38 | 193.93 | 585.74 | 16.84 | 0.70 | 1,348.60 | - | 40.43 | 3.61 | 4.24 | 93.63 | 141.91 |
| Unallocable by country | 836.08 | 62.44 | 58.27 | 563.56 | 45.71 | 75.97 | 805.95 | - | 29.84 | - | 0.27 | 0.02 | 30.13 |
| of which ODA | 819.79 | 62.44 | 58.27 | 562.71 | 30.27 | 75.97 | 789.66 | - | 29.84 | - | 0.27 | 0.02 | 30.13 |
| Multilateral aid | 1,710.03 | - | - | 765.75 | 3.72 | 0.00 | 769.48 | 935.50 | - | - | 4.63 | 0.41 | 940.54 |
| United Nations agency, fund or commission | 160.67 | - | - | 156.60 | 3.66 | 0.00 | 160.27 | - | - | - | - | 0.41 | 0.41 |
| Regional development banks | 281.85 | - | - | 257.23 | - | - | 257.23 | 24.62 | - | - | - | - | 24.62 |
| World Bank Group | 915.08 | - | - | 4.20 | - | - | 4.20 | 910.88 | - | - | - | - | 910.88 |
| Other multilateral organizations | 352.42 | - | - | 347.72 | 0.06 | - | 347.78 | - | - | - | 4.63 | - | 4.63 |
| North Africa | 51.70 | 24.98 | 4.11 | 15.69 | 2.51 | 0.22 | 47.51 | - | 3.22 | - | 0.97 | 0.00 | 4.20 |
| Bilateral aid | 44.69 | 24.98 | 4.11 | 8.84 | 2.40 | 0.22 | 40.54 | - | 3.22 | - | 0.92 | 0.00 | 4.15 |
| Country-allocable | 40.15 | 24.98 | 1.96 | 7.96 | 2.40 | 0.22 | 37.50 | - | 1.72 | - | 0.92 | 0.00 | 2.65 |
| of which ODA | 37.84 | 24.98 | 1.96 | 7.96 | 0.09 | 0.22 | 35.19 | - | 1.72 | - | 0.92 | 0.00 | 2.65 |
| Unallocable by country | 4.54 | - | 2.16 | 0.88 | - | - | 3.04 | - | 1.50 | - | - | - | 1.50 |
| of which ODA | 4.54 | - | 2.16 | 0.88 | - | - | 3.04 | - | 1.50 | - | - | - | 1.50 |
| Multilateral aid | 7.01 | - | - | 6.85 | 0.11 | - | 6.96 | - | - | - | 0.05 | - | 0.05 |
| United Nations agency, fund or commission | 3.20 | - | - | 3.09 | 0.11 | - | 3.20 | - | - | - | - | - | - |
| Regional development banks | - | - | - | - | - | - | - | - | - | - | - | - | - |
| World Bank Group | - | - | - | - | - | - | - | - | - | - | - | - | - |
| Other multilateral organizations | 3.82 | - | - | 3.77 | - | - | 3.77 | - | - | - | 0.05 | - | 0.05 |
| Total – Africa | 4,096.84 | 638.80 | 256.35 | 1,930.75 | 77.27 | 76.90 | 2,980.06 | 935.50 | 73.50 | 3.61 | 10.11 | 94.05 | 1,116.78 |
| Middle East | 818.54 | 157.43 | 12.71 | 526.42 | 61.29 | 17.59 | 775.45 | 26.55 | 6.17 | - | 0.44 | 9.93 | 43.10 |
| Bilateral aid | 741.54 | 128.93 | 12.71 | 505.16 | 61.03 | 17.59 | 725.41 | - | 6.17 | - | 0.15 | 9.81 | 16.13 |
| Country-allocable | 577.58 | 122.33 | 8.91 | 393.04 | 47.87 | 0.02 | 572.16 | - | 3.34 | - | 0.15 | 1.94 | 5.42 |
| of which ODA | 566.85 | 122.33 | 8.91 | 393.04 | 37.14 | 0.02 | 561.43 | - | 3.34 | - | 0.15 | 1.94 | 5.42 |
| Unallocable by country | 163.97 | 6.60 | 3.81 | 112.12 | 13.16 | 17.57 | 153.25 | - | 2.84 | - | - | 7.87 | 10.71 |
| of which ODA | 161.23 | 6.60 | 3.81 | 112.12 | 10.42 | 17.57 | 150.52 | - | 2.84 | - | - | 7.87 | 10.71 |
| Multilateral aid | 77.00 | 28.50 | - | 21.27 | 0.27 | - | 50.03 | 26.55 | - | - | 0.29 | 0.13 | 26.97 |
| United Nations agency, fund or commission | 45.32 | 28.50 | - | 16.42 | 0.27 | - | 45.19 | - | - | - | - | 0.13 | 0.13 |
| Regional development banks | - | - | - | - | - | - | - | - | - | - | - | - | - |
| World Bank Group | 26.55 | - | - | - | - | - | - | 26.55 | - | - | - | - | 26.55 |
| Other multilateral organizations | 5.13 | - | - | 4.84 | - | - | 4.84 | - | - | - | 0.29 | - | 0.29 |
| Asia | 1,718.21 | 290.42 | 33.85 | 896.97 | 66.06 | 37.09 | 1,324.39 | 315.82 | 19.21 | 3.60 | 3.68 | 51.52 | 393.83 |
| Bilateral aid | 1,174.96 | 290.42 | 33.85 | 675.99 | 62.39 | 37.09 | 1,099.73 | - | 19.21 | 3.60 | 0.99 | 51.42 | 75.23 |
| Country-allocable | 687.47 | 267.68 | 20.66 | 341.43 | 31.98 | 0.22 | 661.97 | - | 10.76 | 3.60 | 0.22 | 10.93 | 25.50 |
| of which ODA | 667.87 | 267.68 | 20.66 | 341.43 | 12.38 | 0.22 | 642.37 | - | 10.76 | 3.60 | 0.22 | 10.93 | 25.50 |
| Unallocable by country | 487.49 | 22.73 | 13.18 | 334.56 | 30.42 | 36.87 | 437.76 | - | 8.46 | - | 0.77 | 40.50 | 49.72 |
| of which ODA | 476.24 | 22.73 | 13.18 | 333.72 | 20.01 | 36.87 | 426.51 | - | 8.46 | - | 0.77 | 40.50 | 49.72 |
| Multilateral aid | 543.26 | - | - | 220.98 | 3.67 | 0.00 | 224.65 | 315.82 | - | - | 2.69 | 0.10 | 318.60 |
| United Nations agency, fund or commission | 58.70 | - | - | 56.52 | 2.07 | 0.00 | 58.60 | - | - | - | - | 0.10 | 0.10 |
| Regional development banks | 28.89 | - | - | 28.89 | - | - | 28.89 | - | - | - | - | - | - |
| World Bank Group | 317.82 | - | - | 2.00 | - | - | 2.00 | 315.82 | - | - | - | - | 315.82 |
| Other multilateral organizations | 137.85 | - | - | 133.57 | 1.59 | - | 135.16 | - | - | - | 2.69 | - | 2.69 |
| Americas | 1,066.99 | 377.14 | 42.23 | 450.91 | 57.93 | 33.21 | 961.43 | 22.11 | 30.84 | 1.74 | 4.36 | 46.51 | 105.56 |
| Bilateral aid | 885.02 | 343.19 | 42.23 | 329.93 | 54.92 | 33.21 | 803.48 | - | 30.84 | 1.74 | 2.59 | 46.36 | 81.54 |
| Country-allocable | 542.96 | 268.17 | 27.95 | 157.56 | 27.69 | 1.40 | 482.76 | - | 17.50 | 1.74 | 2.30 | 38.65 | 60.19 |
| of which ODA | 521.75 | 264.63 | 27.95 | 155.23 | 12.36 | 1.40 | 461.55 | - | 17.50 | 1.74 | 2.30 | 38.65 | 60.19 |
| Unallocable by country | 342.06 | 75.03 | 14.28 | 172.37 | 27.23 | 31.81 | 320.72 | - | 13.34 | - | 0.29 | 7.71 | 21.34 |
| of which ODA | 332.10 | 75.03 | 14.28 | 171.52 | 18.12 | 31.81 | 310.76 | - | 13.34 | - | 0.29 | 7.71 | 21.34 |
| Multilateral aid | 181.97 | 33.94 | - | 120.99 | 3.01 | 0.00 | 157.95 | 22.11 | - | - | 1.77 | 0.15 | 24.02 |
| United Nations agency, fund or commission | 41.43 | - | - | 38.33 | 2.95 | 0.00 | 41.28 | - | - | - | - | 0.15 | 0.15 |
| Regional development banks | 23.48 | - | - | 23.48 | - | - | 23.48 | - | - | - | - | - | - |
| World Bank Group | 24.61 | - | - | 2.50 | - | - | 2.50 | 22.11 | - | - | - | - | 22.11 |
| Other multilateral organizations | 92.46 | 33.94 | - | 56.68 | 0.06 | - | 90.69 | - | - | - | 1.77 | - | 1.77 |
| Europe | 5,781.98 | 96.12 | 0.69 | 536.85 | 104.98 | 19.56 | 758.20 | 5,004.60 | 0.04 | - | 11.58 | 7.56 | 5,023.78 |
| Bilateral aid | 5,684.07 | 96.12 | 0.69 | 484.77 | 99.10 | 19.55 | 700.24 | 4,965.00 | 0.04 | - | 11.30 | 7.49 | 4,983.83 |
| Country-allocable | 5,480.32 | 92.38 | 0.21 | 335.12 | 68.79 | - | 496.51 | 4,965.00 | 0.04 | - | 11.30 | 7.47 | 4,983.81 |
| of which ODA | 5,455.46 | 92.38 | 0.21 | 323.75 | 55.31 | - | 471.65 | 4,965.00 | 0.04 | - | 11.30 | 7.47 | 4,983.81 |
| Unallocable by country | 203.75 | 3.74 | 0.49 | 149.65 | 30.31 | 19.55 | 203.73 | - | - | - | - | 0.02 | 0.02 |
| of which ODA | 197.84 | 3.74 | 0.49 | 148.80 | 25.25 | 19.55 | 197.82 | - | - | - | - | 0.02 | 0.02 |
| Multilateral aid | 97.91 | - | - | 52.08 | 5.88 | 0.00 | 57.96 | 39.60 | - | - | 0.28 | 0.07 | 39.95 |
| United Nations agency, fund or commission | 31.39 | - | - | 29.39 | 1.93 | 0.00 | 31.32 | - | - | - | - | 0.07 | 0.07 |
| Regional development banks | - | - | - | - | - | - | - | - | - | - | - | - | - |
| World Bank Group | 39.90 | - | - | 0.30 | - | - | 0.30 | 39.60 | - | - | - | - | 39.60 |
| Other multilateral organizations | 26.62 | - | - | 22.39 | 3.95 | - | 26.34 | - | - | - | 0.28 | - | 0.28 |
| Oceania | 97.44 | 9.51 | 1.32 | 51.12 | 15.92 | 3.84 | 81.72 | 15.43 | 0.26 | - | 0.03 | 0.00 | 15.72 |
| Bilateral aid | 67.35 | 9.51 | 1.32 | 37.60 | 14.81 | 3.84 | 67.08 | - | 0.26 | - | - | 0.00 | 0.26 |
| Country-allocable | 1.82 | 1.17 | 0.04 | 0.53 | - | 0.02 | 1.75 | - | 0.06 | - | - | 0.00 | 0.07 |
| of which ODA | 1.82 | 1.17 | 0.04 | 0.53 | - | 0.02 | 1.75 | - | 0.06 | - | - | 0.00 | 0.07 |
| Unallocable by country | 65.53 | 8.34 | 1.29 | 37.08 | 14.81 | 3.82 | 65.33 | - | 0.20 | - | - | - | 0.20 |
| of which ODA | 61.24 | 8.34 | 1.29 | 36.60 | 11.00 | 3.82 | 61.04 | - | 0.20 | - | - | - | 0.20 |
| Multilateral aid | 30.09 | - | - | 13.52 | 1.11 | 0.00 | 14.64 | 15.43 | - | - | 0.03 | - | 15.45 |
| United Nations agency, fund or commission | 3.52 | - | - | 2.40 | 1.11 | 0.00 | 3.52 | - | - | - | - | - | - |
| Regional development banks | 1.25 | - | - | 1.25 | - | - | 1.25 | - | - | - | - | - | - |
| World Bank Group | 16.43 | - | - | 1.00 | - | - | 1.00 | 15.43 | - | - | - | - | 15.43 |
| Other multilateral organizations | 8.90 | - | - | 8.87 | - | - | 8.87 | - | - | - | 0.03 | - | 0.03 |
| Global/unallocable | 2,469.88 | 0.04 | 7.01 | 71.89 | 13.92 | 4.13 | 96.98 | 40.14 | 50.02 | 43.06 | 478.87 | 1,760.80 | 2,372.90 |
| Bilateral aid | 2,341.99 | 0.04 | 7.01 | 5.67 | 9.94 | 3.65 | 26.30 | - | 50.02 | 35.95 | 471.98 | 1,757.75 | 2,315.69 |
| of which ODA | 2,337.67 | 0.04 | 7.01 | 5.67 | 6.53 | 3.65 | 22.90 | - | 50.02 | 35.95 | 471.98 | 1,756.84 | 2,314.77 |
| of which refugee costs | 763.04 | - | - | - | - | - | - | - | - | - | 461.03 | 302.01 | 763.04 |
| Multilateral aid | 127.89 | - | - | 66.22 | 3.99 | 0.48 | 70.68 | 40.14 | - | 7.12 | 6.90 | 3.06 | 57.21 |
| Summary | |||||||||||||
| Bilateral international assistance | 13,274.73 | 1,507.01 | 354.16 | 3,197.25 | 375.62 | 191.82 | 5,625.87 | 4,965.00 | 180.04 | 44.90 | 492.43 | 1,966.49 | 7,648.86 |
| Multilateral international assistance | 2,775.16 | 62.44 | - | 1,267.66 | 21.75 | 0.50 | 1,352.35 | 1,395.15 | - | 7.12 | 16.63 | 3.90 | 1,422.80 |
| Total – International assistance | 16,049.89 | 1,569.46 | 354.16 | 4,464.91 | 397.38 | 192.32 | 6,978.22 | 6,360.15 | 180.04 | 52.02 | 509.06 | 1,970.39 | 9,071.67 |
| (1) Projects coded to Africa are included under Sub-Saharan Africa because the majority of the benefits will incur to countries in that region. | |||||||||||||
D1.1: Total international assistance by recipient and type of aid
This table includes ODA and other official assistance expenditures in millions of Canadian dollars.
| Recipient | Total | Global Affairs Canada | Other government sources | ||||
|---|---|---|---|---|---|---|---|
| Bilateral | Multilateral | Total | Bilateral | Multilateral | Total | ||
| Africa | 4,096.84 | 2,203.61 | 776.45 | 2,980.06 | 176.19 | 940.59 | 1,116.78 |
| Sub-Saharan Africa (1) | 4,045.14 | 2,163.07 | 769.48 | 2,932.55 | 172.04 | 940.54 | 1,112.59 |
| Country-allocable | |||||||
| Angola | 4.84 | 0.76 | 3.99 | 4.75 | - | 0.09 | 0.09 |
| Benin | 46.66 | 17.35 | 7.45 | 24.81 | 1.47 | 20.38 | 21.85 |
| Botswana | 1.29 | 0.05 | 1.19 | 1.24 | 0.05 | - | 0.05 |
| Burkina Faso | 105.04 | 58.94 | 13.98 | 72.91 | 8.46 | 23.67 | 32.13 |
| Burundi | 25.55 | 6.23 | 10.49 | 16.73 | 0.03 | 8.79 | 8.83 |
| Cameroon | 50.90 | 15.97 | 19.43 | 35.41 | 0.85 | 14.64 | 15.49 |
| Cabo Verde | 4.22 | 0.16 | 0.98 | 1.14 | 0.02 | 3.05 | 3.08 |
| Central African Republic | 32.64 | 12.18 | 12.87 | 25.05 | 0.15 | 7.44 | 7.58 |
| Chad | 35.98 | 21.18 | 9.36 | 30.54 | 0.05 | 5.40 | 5.45 |
| Comoros | 6.28 | 0.93 | 2.59 | 3.51 | 0.02 | 2.75 | 2.76 |
| Democratic Republic of Congo | 206.71 | 91.10 | 52.45 | 143.55 | 4.15 | 59.02 | 63.17 |
| Congo | 15.08 | 3.59 | 3.26 | 6.85 | 0.09 | 8.14 | 8.23 |
| Côte d’Ivoire | 88.46 | 36.62 | 10.00 | 46.62 | 0.63 | 41.22 | 41.85 |
| Djibouti | 5.57 | 0.25 | 3.05 | 3.30 | 0.01 | 2.25 | 2.27 |
| Equatorial Guinea | 1.23 | 0.09 | 0.60 | 0.70 | 0.53 | - | 0.53 |
| Eritrea | 4.08 | 0.15 | 3.92 | 4.07 | 0.01 | - | 0.01 |
| Eswatini | 5.03 | 3.93 | 1.10 | 5.03 | 0.00 | - | 0.00 |
| Ethiopia | 250.70 | 130.00 | 37.29 | 167.29 | 1.33 | 82.09 | 83.41 |
| Gabon | 0.73 | 0.08 | 0.64 | 0.72 | 0.01 | - | 0.01 |
| Gambia | 17.01 | 3.91 | 4.11 | 8.03 | 1.14 | 7.84 | 8.99 |
| Ghana | 116.68 | 70.01 | 20.32 | 90.34 | 3.33 | 23.01 | 26.35 |
| Guinea | 26.51 | 6.97 | 12.31 | 19.28 | 1.30 | 5.93 | 7.22 |
| Guinea-Bissau | 11.51 | 1.59 | 6.10 | 7.68 | 0.01 | 3.81 | 3.82 |
| Kenya | 154.90 | 55.93 | 28.23 | 84.16 | 10.27 | 60.47 | 70.74 |
| Lesotho | 6.27 | 0.27 | 3.55 | 3.82 | 0.01 | 2.44 | 2.45 |
| Liberia | 25.53 | 1.52 | 7.62 | 9.14 | 6.37 | 10.02 | 16.39 |
| Madagascar | 39.77 | 5.87 | 14.43 | 20.31 | 0.76 | 18.70 | 19.46 |
| Malawi | 57.89 | 11.07 | 21.27 | 32.33 | 0.82 | 24.73 | 25.56 |
| Mali | 128.24 | 95.70 | 17.36 | 113.06 | 3.93 | 11.25 | 15.18 |
| Mauritania | 11.39 | 1.12 | 3.39 | 4.52 | 0.01 | 6.86 | 6.87 |
| Mauritius | 1.07 | 0.13 | 0.81 | 0.94 | 0.00 | 0.13 | 0.13 |
| Mozambique | 173.04 | 97.64 | 28.75 | 126.39 | 0.41 | 46.24 | 46.65 |
| Namibia | 3.80 | 0.11 | 3.59 | 3.70 | 0.06 | 0.04 | 0.10 |
| Niger | 95.03 | 27.03 | 22.66 | 49.68 | 5.91 | 39.44 | 45.35 |
| Nigeria | 277.10 | 73.54 | 47.83 | 121.38 | 27.19 | 128.54 | 155.73 |
| Rwanda | 44.82 | 6.89 | 12.44 | 19.33 | 1.71 | 23.78 | 25.50 |
| São Tomé and Príncipe | 5.31 | 0.04 | 2.37 | 2.41 | 0.00 | 2.90 | 2.90 |
| Senegal | 138.91 | 92.45 | 8.18 | 100.63 | 3.25 | 35.03 | 38.28 |
| Seychelles | 0.23 | 0.23 | - | 0.23 | - | - | - |
| Sierra Leone | 31.51 | 7.38 | 10.33 | 17.70 | 0.55 | 13.26 | 13.81 |
| Somalia | 78.20 | 47.25 | 11.64 | 58.88 | 0.04 | 19.28 | 19.32 |
| South Africa | 88.62 | 73.40 | 12.10 | 85.50 | 3.12 | - | 3.12 |
| South Sudan | 136.35 | 104.26 | 20.47 | 124.73 | 0.27 | 11.35 | 11.62 |
| Sudan | 64.51 | 49.10 | 13.74 | 62.84 | 0.34 | 1.33 | 1.67 |
| Tanzania | 228.62 | 88.75 | 36.03 | 124.78 | 26.49 | 77.35 | 103.84 |
| Togo | 24.90 | 4.09 | 7.87 | 11.96 | 1.67 | 11.27 | 12.94 |
| Uganda | 90.36 | 19.60 | 35.47 | 55.07 | 7.96 | 27.34 | 35.29 |
| Zambia | 77.16 | 6.04 | 13.47 | 19.51 | 16.68 | 40.97 | 57.65 |
| Zimbabwe | 23.32 | 5.67 | 16.76 | 22.43 | 0.45 | 0.44 | 0.90 |
| Region-allocable | |||||||
| Sub-Saharan Africa | 218.16 | 205.54 | 0.41 | 205.95 | 11.67 | 0.53 | 12.21 |
| West Africa | 7.71 | 0.84 | 1.49 | 2.33 | - | 5.37 | 5.37 |
| Central Africa | 3.66 | 3.40 | 0.01 | 3.41 | 0.25 | - | 0.25 |
| East Africa | 10.01 | 5.38 | 3.08 | 8.47 | - | 1.54 | 1.54 |
| Southern Africa | 0.84 | 0.35 | 0.49 | 0.84 | - | - | - |
| Africa | 735.21 | 590.42 | 126.18 | 716.60 | 18.20 | 0.41 | 18.61 |
| North Africa | 51.70 | 40.54 | 6.96 | 47.51 | 4.15 | 0.05 | 4.20 |
| Country-allocable | |||||||
| Algeria | 2.59 | 1.33 | 1.11 | 2.44 | 0.15 | - | 0.15 |
| Egypt | 16.94 | 14.21 | 2.34 | 16.55 | 0.39 | - | 0.39 |
| Western Sahara | 0.30 | - | 0.30 | 0.30 | - | - | - |
| Libya | 1.86 | 0.83 | 0.53 | 1.36 | 0.50 | - | 0.50 |
| Morocco | 15.62 | 12.48 | 2.01 | 14.49 | 1.08 | 0.05 | 1.13 |
| Tunisia | 9.64 | 8.65 | 0.47 | 9.12 | 0.52 | - | 0.52 |
| Region-allocable | |||||||
| North Africa | 4.75 | 3.04 | 0.21 | 3.24 | 1.50 | - | 1.50 |
| Middle East | 818.54 | 725.41 | 50.03 | 775.45 | 16.13 | 26.97 | 43.10 |
| Country-allocable | |||||||
| Israel | 0.26 | 0.26 | - | 0.26 | - | - | - |
| Iraq | 63.69 | 62.67 | 1.02 | 63.68 | 0.01 | - | 0.01 |
| Iran | 0.73 | - | 0.73 | 0.73 | - | - | - |
| Jordan | 187.98 | 179.75 | 7.29 | 187.04 | 0.64 | 0.29 | 0.94 |
| Lebanon | 98.16 | 88.19 | 8.16 | 96.35 | 1.80 | - | 1.80 |
| West Bank and Gaza | 56.41 | 35.95 | 17.51 | 53.45 | 2.96 | - | 2.96 |
| Syria | 124.80 | 118.53 | 6.27 | 124.80 | - | - | - |
| Yemen | 119.69 | 86.82 | 6.34 | 93.16 | 0.00 | 26.53 | 26.54 |
| Region-allocable | |||||||
| Middle East | 166.82 | 153.25 | 2.71 | 155.97 | 10.71 | 0.14 | 10.85 |
| Asia | 1,718.21 | 1,099.73 | 224.65 | 1,324.39 | 75.23 | 318.60 | 393.83 |
| Country-allocable | |||||||
| Afghanistan | 129.52 | 118.24 | 8.10 | 126.34 | 0.73 | 2.45 | 3.18 |
| Armenia | 1.85 | 0.53 | 1.07 | 1.60 | - | 0.25 | 0.25 |
| Azerbaijan | 1.41 | 0.33 | 1.08 | 1.41 | - | - | - |
| Bangladesh | 233.86 | 122.09 | 15.21 | 137.29 | 2.19 | 94.37 | 96.57 |
| Bhutan | 6.69 | 1.27 | 1.57 | 2.84 | 0.55 | 3.30 | 3.85 |
| China | 12.96 | 1.03 | 9.76 | 10.78 | 2.18 | - | 2.18 |
| Georgia | 2.07 | 0.17 | 1.70 | 1.87 | 0.00 | 0.19 | 0.20 |
| Indonesia | 111.75 | 88.97 | 20.73 | 109.70 | 1.78 | 0.27 | 2.06 |
| India | 111.87 | 68.92 | 25.56 | 94.48 | 0.49 | 16.89 | 17.39 |
| Kyrgyzstan | 12.17 | 4.47 | 1.84 | 6.31 | 0.02 | 5.84 | 5.86 |
| Cambodia | 23.07 | 3.07 | 5.26 | 8.33 | 0.77 | 13.96 | 14.74 |
| North Korea | 0.34 | - | 0.34 | 0.34 | - | - | - |
| Kazakhstan | 6.37 | 4.33 | 1.96 | 6.29 | - | 0.08 | 0.08 |
| Laos | 8.53 | 2.48 | 1.68 | 4.16 | 0.19 | 4.18 | 4.37 |
| Sri Lanka | 25.03 | 16.99 | 3.20 | 20.19 | 0.64 | 4.19 | 4.83 |
| Myanmar | 51.63 | 43.80 | 6.57 | 50.36 | 0.88 | 0.39 | 1.26 |
| Mongolia | 14.49 | 10.32 | 1.58 | 11.90 | 0.01 | 2.58 | 2.59 |
| Maldives | 1.22 | 0.10 | 0.29 | 0.39 | 0.02 | 0.82 | 0.84 |
| Malaysia | 4.43 | 1.01 | 1.85 | 2.87 | 1.35 | 0.22 | 1.57 |
| Nepal | 33.85 | 3.15 | 5.08 | 8.23 | 1.01 | 24.61 | 25.61 |
| Philippines | 94.19 | 83.43 | 9.02 | 92.45 | 1.74 | - | 1.74 |
| Pakistan | 152.99 | 67.71 | 25.74 | 93.45 | 2.26 | 57.29 | 59.55 |
| Singapore | 0.03 | 0.03 | - | 0.03 | - | - | - |
| Thailand | 4.48 | 0.81 | 2.97 | 3.78 | 0.70 | - | 0.70 |
| Tajikistan | 13.72 | 2.07 | 3.39 | 5.46 | 0.02 | 8.24 | 8.26 |
| Timor-Leste | 1.63 | 0.08 | 1.30 | 1.38 | 0.00 | 0.25 | 0.26 |
| Turkmenistan | 1.59 | 0.44 | 1.15 | 1.59 | - | - | - |
| Uzbekistan | 55.27 | 5.46 | 5.40 | 10.87 | 3.65 | 40.75 | 44.40 |
| Vietnam | 57.54 | 10.68 | 5.57 | 16.25 | 4.32 | 36.97 | 41.28 |
| Region-allocable | |||||||
| Asia | 470.18 | 412.73 | 50.40 | 463.14 | 6.87 | 0.18 | 7.04 |
| Southcentral Asia | 4.76 | 4.64 | 0.12 | 4.76 | - | - | - |
| South Asia | 4.68 | 2.59 | 0.57 | 3.17 | 1.25 | 0.27 | 1.51 |
| Central Asia | 8.62 | 0.23 | 0.96 | 1.18 | 7.36 | 0.07 | 7.43 |
| Southeast Asia | 54.33 | 16.46 | 3.62 | 20.08 | 34.25 | - | 34.25 |
| Eastern Asia | 1.11 | 1.11 | - | 1.11 | - | - | - |
| Americas | 1,066.99 | 803.48 | 157.95 | 961.43 | 81.54 | 24.02 | 105.56 |
| Country-allocable | |||||||
| Antigua and Barbuda | 1.05 | 1.05 | - | 1.05 | - | - | - |
| Argentina | 5.85 | 0.67 | 4.09 | 4.76 | 1.09 | - | 1.09 |
| Barbados | 0.80 | 0.80 | - | 0.80 | - | - | - |
| Bolivia | 27.45 | 20.68 | 2.24 | 22.92 | 2.01 | 2.52 | 4.53 |
| Brazil | 8.60 | 2.56 | 4.74 | 7.29 | 1.31 | - | 1.31 |
| Bahamas | 0.26 | 0.26 | - | 0.26 | - | - | - |
| Belize | 12.02 | 4.99 | 6.54 | 11.52 | 0.50 | - | 0.50 |
| Chile | 3.82 | 3.82 | - | 3.82 | - | - | - |
| Colombia | 69.38 | 61.42 | 3.84 | 65.26 | 4.01 | 0.11 | 4.12 |
| Costa Rica | 6.80 | 4.37 | 1.58 | 5.95 | 0.74 | 0.10 | 0.84 |
| Cuba | 8.60 | 3.83 | 3.08 | 6.91 | 1.69 | - | 1.69 |
| Dominica | 9.86 | 4.86 | 2.82 | 7.68 | 0.00 | 2.17 | 2.18 |
| Dominican Republic | 32.08 | 30.30 | 1.39 | 31.69 | 0.39 | - | 0.39 |
| Ecuador | 28.05 | 21.86 | 3.04 | 24.89 | 2.56 | 0.60 | 3.16 |
| Grenada | 5.91 | 4.21 | 0.13 | 4.34 | 0.13 | 1.44 | 1.57 |
| Guatemala | 26.45 | 22.30 | 2.42 | 24.72 | 1.73 | - | 1.73 |
| Guyana | 13.77 | 10.59 | 0.26 | 10.85 | 0.38 | 2.54 | 2.92 |
| Honduras | 36.26 | 29.68 | 3.55 | 33.23 | 1.19 | 1.85 | 3.03 |
| Haiti | 140.11 | 125.47 | 5.18 | 130.65 | 3.10 | 6.37 | 9.46 |
| Jamaica | 26.83 | 25.47 | 0.80 | 26.27 | 0.15 | 0.41 | 0.56 |
| Saint Kitts and Nevis | 0.43 | 0.43 | - | 0.43 | - | - | - |
| Saint Lucia | 13.17 | 5.14 | 7.19 | 12.33 | 0.14 | 0.70 | 0.84 |
| Montserrat | 0.41 | 0.41 | 0.00 | 0.41 | - | - | - |
| Mexico | 43.86 | 7.95 | 2.06 | 10.01 | 33.85 | - | 33.85 |
| Nicaragua | 17.09 | 8.44 | 4.52 | 12.97 | 0.34 | 3.78 | 4.13 |
| Panama | 6.37 | 4.92 | 1.05 | 5.97 | 0.31 | 0.09 | 0.40 |
| Peru | 41.77 | 33.61 | 4.84 | 38.45 | 3.21 | 0.11 | 3.32 |
| Paraguay | 2.81 | 1.58 | 1.19 | 2.77 | 0.04 | - | 0.04 |
| Suriname | 4.66 | 3.52 | 1.14 | 4.66 | - | - | - |
| El Salvador | 15.68 | 12.94 | 1.53 | 14.47 | 1.21 | - | 1.21 |
| Trinidad and Tobago | 1.88 | 1.88 | - | 1.88 | - | - | - |
| Uruguay | 0.22 | 0.22 | - | 0.22 | - | - | - |
| Saint Vincent and the Grenadines | 4.98 | 3.82 | 0.11 | 3.93 | 0.12 | 0.94 | 1.05 |
| Venezuela | 20.06 | 18.73 | 1.30 | 20.04 | 0.02 | - | 0.02 |
| Region-allocable | |||||||
| Americas | 325.75 | 242.81 | 81.73 | 324.54 | 1.05 | 0.15 | 1.20 |
| Central America | 29.46 | 22.41 | 0.18 | 22.59 | 6.81 | 0.06 | 6.87 |
| South America | 47.14 | 34.25 | 0.33 | 34.58 | 12.56 | - | 12.56 |
| Caribbean | 27.33 | 21.24 | 5.08 | 26.32 | 0.92 | 0.09 | 1.01 |
| Europe | 5,781.98 | 700.24 | 57.96 | 758.20 | 4,983.83 | 39.95 | 5,023.78 |
| Country-allocable | |||||||
| Albania | 0.98 | 0.16 | 0.72 | 0.88 | 0.00 | 0.09 | 0.09 |
| Bosnia and Herzegovina | 1.76 | 0.25 | 1.52 | 1.76 | - | - | - |
| Belarus | 2.52 | 0.69 | 1.83 | 2.52 | - | - | - |
| Hungary | 0.40 | 0.40 | - | 0.40 | - | - | - |
| Moldova | 19.54 | 10.82 | 1.46 | 12.28 | 0.00 | 7.26 | 7.27 |
| Montenegro | 0.86 | 0.06 | 0.71 | 0.77 | - | 0.09 | 0.09 |
| North Macedonia | 26.85 | 25.66 | 1.10 | 26.76 | - | 0.09 | 0.09 |
| Poland | 3.30 | 3.30 | - | 3.30 | - | - | - |
| Romania | 6.27 | 6.27 | - | 6.27 | - | - | - |
| Serbia | 1.33 | 0.33 | 1.00 | 1.33 | - | - | - |
| Slovakia | 1.40 | 1.40 | - | 1.40 | - | - | - |
| Türkiye | 32.54 | 30.33 | 1.68 | 32.01 | 0.53 | - | 0.53 |
| Ukraine | 5,436.92 | 416.66 | 7.91 | 424.57 | 4,983.27 | 29.09 | 5,012.35 |
| Kosovo | 5.14 | 0.19 | 1.70 | 1.88 | 0.01 | 3.25 | 3.26 |
| Ex-states of Yugoslavia | 0.00 | - | 0.00 | 0.00 | - | - | - |
| Region-allocable | |||||||
| Europe | 242.15 | 203.73 | 38.33 | 242.06 | 0.02 | 0.07 | 0.09 |
| Oceania | 97.44 | 67.08 | 14.64 | 81.72 | 0.26 | 15.45 | 15.72 |
| Country-allocable | |||||||
| Fiji | 7.98 | 0.08 | 3.40 | 3.49 | - | 4.49 | 4.49 |
| Micronesia | 0.58 | 0.15 | 0.02 | 0.17 | - | 0.41 | 0.41 |
| Kiribati | 0.87 | 0.06 | 0.13 | 0.19 | 0.00 | 0.67 | 0.67 |
| Marshall Islands | 1.50 | 0.63 | 0.06 | 0.68 | - | 0.82 | 0.82 |
| Nauru | 0.02 | - | 0.02 | 0.02 | - | - | - |
| Niue | 0.27 | - | 0.27 | 0.27 | - | - | - |
| Papua New Guinea | 5.93 | 0.36 | 4.11 | 4.47 | 0.00 | 1.46 | 1.47 |
| Palau | 0.07 | - | 0.07 | 0.07 | - | - | - |
| Solomon Islands | 3.08 | 0.08 | 0.88 | 0.96 | 0.00 | 2.12 | 2.12 |
| Tokelau | 0.01 | - | 0.01 | 0.01 | - | - | - |
| Tonga | 2.73 | 0.20 | 0.54 | 0.74 | 0.00 | 1.99 | 1.99 |
| Tuvalu | 0.69 | 0.04 | 0.03 | 0.07 | 0.00 | 0.62 | 0.62 |
| Vanuatu | 1.30 | 0.10 | 0.35 | 0.45 | 0.06 | 0.80 | 0.85 |
| Samoa | 3.00 | 0.06 | 1.02 | 1.08 | 0.00 | 1.92 | 1.92 |
| Region-allocable | |||||||
| Oceania | 69.42 | 65.33 | 3.74 | 69.07 | 0.20 | 0.15 | 0.35 |
| Global/unallocable (2) | 2,469.88 | 26.30 | 70.68 | 96.98 | 2,315.69 | 57.21 | 2,372.90 |
| International assistance | 16,049.89 | 5,625.87 | 1,352.35 | 6,978.22 | 7,648.86 | 1,422.80 | 9,071.67 |
| (1) Projects coded to Africa are included under Sub-Saharan Africa because most of the benefits will incur to countries in that region. (2) Unallocable aid refers to disbursements that cannot be identified for any particular recipient or sector (e.g. cost of refugees in Canada). | |||||||
Geographic distribution of Canada’s bilateral international assistance
Figures in millions of Canadian dollars
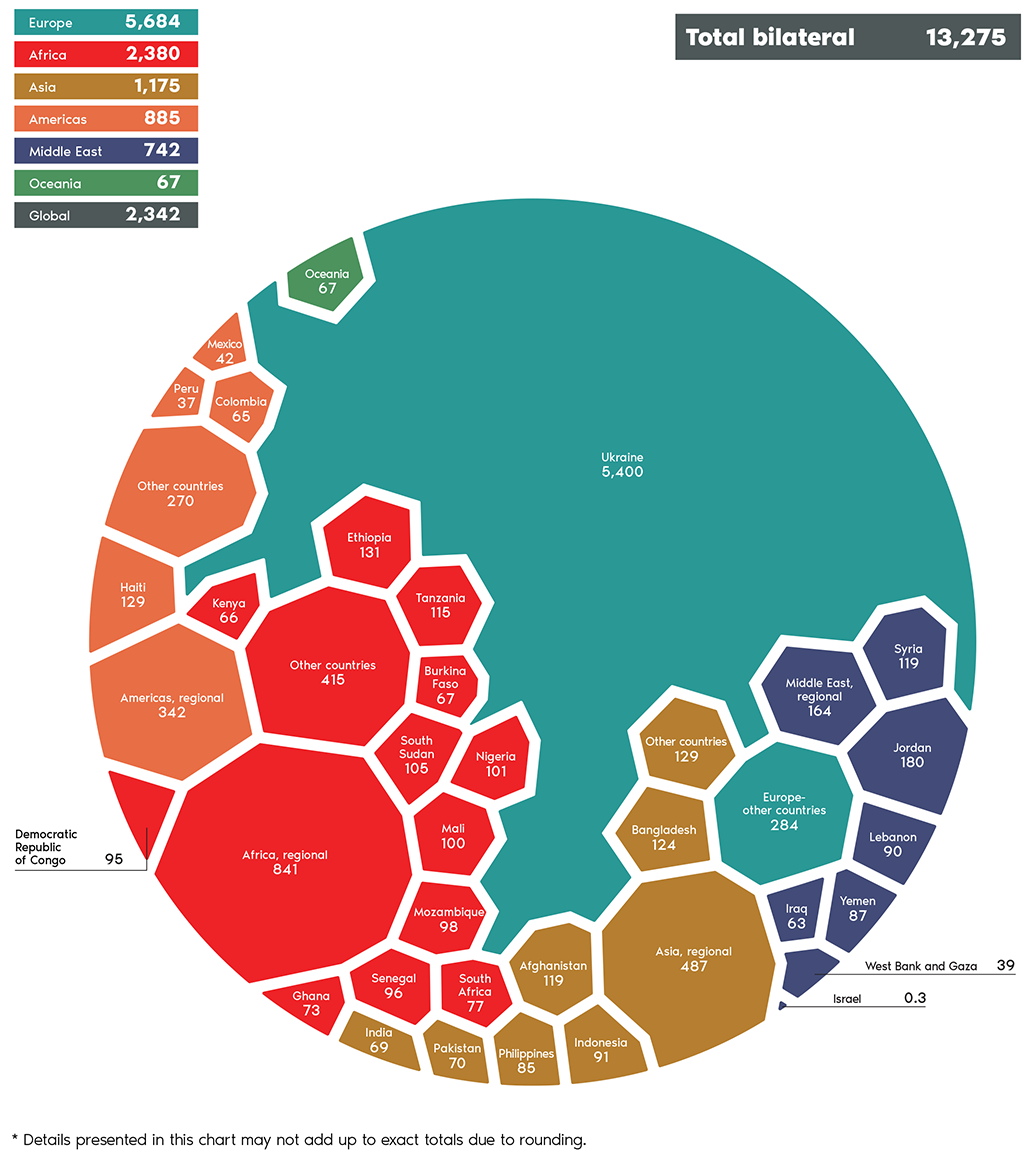
Text version
| Continent total | Total | Percentage of total |
|---|---|---|
| Africa | 2,380 | 22% |
| Americas | 885 | 8% |
| Asia | 1,175 | 11% |
| Europe | 5,684 | 52% |
| Middle East | 742 | 7% |
| Oceania | 67 | 1% |
| Global | 2,342 | - |
| Total | 13,275 | 100% |
| Continent | Country | Amount | Percentage of full circle |
|---|---|---|---|
| Africa | Africa, regional | 841 | 8% |
| Africa | Ethiopia | 131 | 1% |
| Africa | Tanzania | 115 | 1% |
| Africa | South Sudan | 105 | 1% |
| Africa | Nigeria | 101 | 1% |
| Africa | Mali | 100 | 1% |
| Africa | Mozambique | 98 | 1% |
| Africa | Senegal | 96 | 1% |
| Africa | Democratic Republic of Congo | 95 | 1% |
| Africa | South Africa | 77 | 1% |
| Africa | Ghana | 73 | 1% |
| Africa | Burkina Faso | 67 | 1% |
| Africa | Kenya | 66 | 1% |
| Africa | Other countries | 415 | 4% |
| Americas | Americas, regional | 342 | 3% |
| Americas | Haiti | 129 | 1% |
| Americas | Colombia | 65 | 1% |
| Americas | Mexico | 42 | 0% |
| Americas | Peru | 37 | 0% |
| Americas | Other countries | 270 | 2% |
| Asia | Asia, regional | 487 | 4% |
| Asia | Bangladesh | 124 | 1% |
| Asia | Afghanistan | 119 | 1% |
| Asia | Indonesia | 91 | 1% |
| Asia | Philippines | 85 | 1% |
| Asia | Pakistan | 70 | 1% |
| Asia | India | 69 | 1% |
| Asia | Other countries | 129 | 1% |
| Europe | Ukraine | 5,400 | 49% |
| Europe | Other countries | 284 | 3% |
| Middle East | Jordan | 180 | 2% |
| Middle East | Middle East, regional | 164 | 1% |
| Middle East | Syria | 119 | 1% |
| Middle East | Lebanon | 90 | 1% |
| Middle East | Yemen | 87 | 1% |
| Middle East | Iraq | 63 | 1% |
| Middle East | West Bank and Gaza | 39 | 0% |
| Middle East | Israel | 0.3 | 0% |
| Oceania | Oceania | 67 | 1% |
* Details presented in this chart may not add up to exact totals due to rounding.
D2: Bilateral international assistance
This table includes ODA and other official assistance expenditures in millions of Canadian dollars.
| Recipient | Total | Global Affairs Canada | Other government sources | |||||||||||
|---|---|---|---|---|---|---|---|---|---|---|---|---|---|---|
| Geographic programs | Global issues and development | Partnerships for Development Innovation | International Security and Political Affairs | Others | Total | International Development Research Centre | Royal Canadian Mounted Police | Environment and Climate Change Canada | Provinces, territories and municipalities | Others | Total | |||
| Humanitarian Assistance Division | Global initiatives | |||||||||||||
| Africa - Total | 2,379.81 | 638.80 | 326.50 | 831.64 | 256.35 | 73.44 | 76.89 | 2,203.61 | 73.50 | 4.60 | 3.61 | 5.43 | 89.05 | 176.19 |
| Sub-Saharan Africa (1) | 2,335.11 | 613.83 | 325.50 | 823.80 | 252.23 | 71.04 | 76.67 | 2,163.07 | 70.27 | 4.60 | 3.61 | 4.51 | 89.04 | 172.04 |
| Country-allocable | ||||||||||||||
| Angola | 0.76 | 0.04 | - | 0.44 | 0.28 | - | - | 0.76 | - | - | - | - | - | - |
| Benin | 18.82 | 7.32 | - | 0.58 | 9.43 | 0.02 | - | 17.35 | 1.28 | - | - | 0.19 | 0.00 | 1.47 |
| Botswana | 0.10 | 0.05 | - | - | - | - | - | 0.05 | 0.05 | - | - | - | - | 0.05 |
| Burkina Faso | 67.39 | 31.17 | 13.60 | 4.26 | 7.61 | 2.29 | - | 58.94 | 1.63 | - | - | 1.00 | 5.83 | 8.46 |
| Burundi | 6.27 | 0.07 | - | 3.40 | 2.77 | - | - | 6.23 | 0.03 | - | - | - | - | 0.03 |
| Cameroon | 16.82 | 1.62 | 4.80 | 4.69 | 3.30 | 1.56 | - | 15.97 | 0.78 | - | - | 0.06 | 0.00 | 0.85 |
| Cabo Verde | 0.18 | 0.12 | - | - | 0.04 | - | - | 0.16 | 0.02 | - | - | - | - | 0.02 |
| Central African Republic | 12.33 | 0.03 | 11.75 | 0.36 | 0.04 | 0.00 | - | 12.18 | 0.02 | - | - | 0.13 | - | 0.15 |
| Chad | 21.23 | 5.60 | 11.50 | 3.76 | 0.04 | 0.28 | - | 21.18 | 0.05 | - | - | - | 0.00 | 0.05 |
| Comoros | 0.95 | 0.02 | - | - | 0.90 | - | 0.01 | 0.93 | 0.02 | - | - | - | - | 0.02 |
| Democratic Republic of Congo | 95.25 | 15.57 | 34.52 | 28.57 | 11.45 | 0.99 | - | 91.10 | 0.70 | 2.69 | - | 0.26 | 0.50 | 4.15 |
| Congo | 3.68 | - | - | 3.40 | 0.04 | 0.15 | - | 3.59 | 0.01 | - | - | 0.08 | - | 0.09 |
| Côte d’Ivoire | 37.25 | 7.28 | - | 21.00 | 8.32 | 0.02 | - | 36.62 | 0.63 | - | - | - | 0.00 | 0.63 |
| Djibouti | 0.26 | 0.02 | - | 0.15 | 0.05 | 0.02 | 0.01 | 0.25 | 0.01 | - | - | - | 0.00 | 0.01 |
| Equatorial Guinea | 0.62 | 0.06 | - | - | 0.04 | - | - | 0.09 | 0.01 | - | - | - | 0.52 | 0.53 |
| Eritrea | 0.16 | - | - | 0.15 | - | - | - | 0.15 | 0.01 | - | - | - | - | 0.01 |
| Eswatini | 3.93 | 0.12 | - | 3.40 | 0.40 | - | - | 3.93 | - | - | - | - | 0.00 | 0.00 |
| Ethiopia | 131.32 | 69.26 | 44.23 | 0.66 | 13.53 | 2.21 | 0.11 | 130.00 | 1.27 | - | - | 0.05 | - | 1.33 |
| Gabon | 0.10 | 0.02 | - | - | 0.06 | - | - | 0.08 | 0.01 | - | - | - | 0.00 | 0.01 |
| Gambia | 5.06 | 0.12 | - | 3.36 | 0.43 | 0.00 | - | 3.91 | 0.27 | - | 0.88 | - | 0.00 | 1.14 |
| Ghana | 73.35 | 29.98 | - | 20.67 | 18.77 | 0.60 | - | 70.01 | 2.44 | - | 0.88 | 0.02 | - | 3.33 |
| Guinea | 8.27 | 0.71 | - | 0.71 | 5.52 | 0.02 | - | 6.97 | 1.12 | - | - | 0.18 | 0.00 | 1.30 |
| Guinea-Bissau | 1.60 | 0.11 | - | 0.15 | 1.33 | - | - | 1.59 | 0.01 | - | - | - | - | 0.01 |
| Kenya | 66.20 | 15.29 | 22.57 | 1.83 | 13.83 | 2.31 | 0.11 | 55.93 | 5.61 | - | - | 0.06 | 4.59 | 10.27 |
| Lesotho | 0.28 | 0.14 | - | - | 0.13 | - | - | 0.27 | 0.01 | - | - | - | - | 0.01 |
| Liberia | 7.88 | 0.07 | - | - | 1.32 | 0.12 | 0.01 | 1.52 | 0.31 | - | 0.88 | - | 5.18 | 6.37 |
| Madagascar | 6.64 | 0.13 | 1.67 | 0.69 | 3.39 | - | - | 5.87 | 0.26 | - | - | 0.28 | 0.22 | 0.76 |
| Malawi | 11.89 | 0.20 | 0.50 | 5.11 | 5.25 | - | - | 11.07 | 0.80 | - | - | 0.02 | 0.00 | 0.82 |
| Mali | 99.63 | 74.41 | 8.58 | 1.38 | 6.91 | 4.41 | - | 95.70 | 0.15 | 1.91 | - | 0.12 | 1.75 | 3.93 |
| Mauritania | 1.14 | 0.68 | - | 0.15 | 0.04 | 0.23 | 0.02 | 1.12 | 0.01 | - | - | - | - | 0.01 |
| Mauritius | 0.13 | 0.09 | - | - | 0.04 | - | - | 0.13 | 0.00 | - | - | - | 0.00 | 0.00 |
| Mozambique | 98.05 | 65.08 | 1.05 | 23.68 | 7.72 | 0.00 | 0.11 | 97.64 | 0.26 | - | - | 0.13 | 0.02 | 0.41 |
| Namibia | 0.17 | 0.07 | - | - | 0.04 | - | - | 0.11 | 0.06 | - | - | - | - | 0.06 |
| Niger | 32.94 | 12.08 | 8.56 | 0.40 | 2.75 | 3.24 | - | 27.03 | 0.66 | - | - | - | 5.24 | 5.91 |
| Nigeria | 100.73 | 15.87 | 23.89 | 32.27 | 0.96 | 0.55 | - | 73.54 | 3.43 | - | - | - | 23.76 | 27.19 |
| Rwanda | 8.60 | 0.43 | - | - | 6.44 | 0.02 | - | 6.89 | 1.71 | - | - | - | - | 1.71 |
| São Tomé and Príncipe | 0.04 | - | - | - | 0.04 | - | - | 0.04 | 0.00 | - | - | - | 0.00 | 0.00 |
| Senegal | 95.70 | 60.77 | - | 14.72 | 16.69 | 0.16 | 0.11 | 92.45 | 1.93 | - | 0.11 | 1.21 | 0.00 | 3.25 |
| Seychelles | 0.23 | - | - | - | 0.04 | 0.20 | - | 0.23 | - | - | - | - | - | - |
| Sierra Leone | 7.93 | 2.14 | - | 0.91 | 4.19 | 0.14 | - | 7.38 | 0.55 | - | - | - | - | 0.55 |
| Somalia | 47.29 | 8.32 | 32.87 | 5.15 | 0.00 | 0.91 | - | 47.25 | 0.04 | - | - | - | 0.00 | 0.04 |
| South Africa | 76.52 | 4.32 | - | 67.20 | 0.81 | 0.96 | 0.11 | 73.40 | 2.60 | - | - | 0.02 | 0.50 | 3.12 |
| South Sudan | 104.53 | 54.35 | 37.65 | 6.84 | 2.94 | 2.48 | - | 104.26 | 0.26 | - | - | 0.01 | - | 0.27 |
| Sudan | 49.43 | 9.25 | 32.48 | 5.02 | 1.36 | 0.88 | 0.11 | 49.10 | 0.34 | - | - | - | 0.00 | 0.34 |
| Tanzania | 115.24 | 56.92 | 0.15 | 24.57 | 6.70 | 0.41 | - | 88.75 | 2.17 | - | - | 0.10 | 24.22 | 26.49 |
| Togo | 5.76 | 0.14 | - | 0.56 | 3.34 | 0.05 | - | 4.09 | 0.70 | - | 0.88 | 0.10 | 0.00 | 1.67 |
| Uganda | 27.56 | 0.70 | 2.82 | 0.75 | 15.30 | 0.03 | - | 19.60 | 7.60 | - | - | 0.09 | 0.26 | 7.96 |
| Zambia | 22.72 | 0.24 | - | 0.35 | 5.45 | 0.00 | - | 6.04 | 0.33 | - | - | 0.02 | 16.33 | 16.68 |
| Zimbabwe | 6.12 | 0.41 | 1.25 | - | 3.98 | 0.03 | - | 5.67 | 0.22 | - | - | 0.13 | 0.10 | 0.45 |
| Region-allocable | ||||||||||||||
| Sub-Saharan Africa | 217.22 | 2.64 | 5.00 | 156.50 | 40.02 | 1.35 | 0.03 | 205.54 | 11.67 | - | - | - | - | 11.67 |
| West Africa | 0.84 | 0.53 | - | 0.19 | 0.13 | - | - | 0.84 | - | - | - | - | - | - |
| Central Africa | 3.65 | - | - | 3.40 | - | - | - | 3.40 | - | - | - | 0.25 | - | 0.25 |
| East Africa | 5.38 | 4.47 | 0.91 | - | - | - | - | 5.38 | - | - | - | - | - | - |
| Southern Africa | 0.35 | - | - | - | - | 0.35 | - | 0.35 | - | - | - | - | - | - |
| Africa | 608.63 | 54.80 | 25.12 | 372.44 | 18.11 | 44.01 | 75.94 | 590.42 | 18.17 | - | - | 0.02 | 0.02 | 18.20 |
| North Africa | 44.69 | 24.98 | 1.00 | 7.83 | 4.11 | 2.40 | 0.22 | 40.54 | 3.22 | - | - | 0.92 | 0.00 | 4.15 |
| Country-allocable | ||||||||||||||
| Algeria | 1.48 | 0.24 | 0.50 | 0.00 | - | 0.59 | - | 1.33 | 0.15 | - | - | - | - | 0.15 |
| Egypt | 14.61 | 10.20 | - | 3.55 | 0.04 | 0.32 | 0.11 | 14.21 | 0.39 | - | - | - | - | 0.39 |
| Libya | 1.33 | 0.20 | 0.50 | - | - | 0.13 | - | 0.83 | - | - | - | 0.50 | - | 0.50 |
| Morocco | 13.56 | 7.32 | - | 3.40 | 0.77 | 0.88 | 0.11 | 12.48 | 0.77 | - | - | 0.31 | - | 1.08 |
| Tunisia | 9.16 | 7.01 | - | 0.00 | 1.15 | 0.49 | - | 8.65 | 0.40 | - | - | 0.11 | 0.00 | 0.52 |
| Region-allocable | ||||||||||||||
| North Africa | 4.54 | - | - | 0.88 | 2.16 | - | - | 3.04 | 1.50 | - | - | - | - | 1.50 |
| Middle East | 741.54 | 128.93 | 276.74 | 228.42 | 12.71 | 61.03 | 17.59 | 725.41 | 6.17 | 1.81 | - | 0.15 | 8.00 | 16.13 |
| Country-allocable | ||||||||||||||
| Israel | 0.26 | - | - | - | - | 0.26 | - | 0.26 | - | - | - | - | - | - |
| Iraq | 62.67 | 13.76 | 17.76 | - | - | 31.15 | - | 62.67 | 0.01 | - | - | - | - | 0.01 |
| Jordan | 180.39 | 36.48 | 11.13 | 125.01 | 3.13 | 4.01 | - | 179.75 | 0.42 | - | - | 0.10 | 0.12 | 0.64 |
| Lebanon | 90.00 | 40.70 | 42.09 | - | 1.99 | 3.41 | - | 88.19 | 1.80 | - | - | - | - | 1.80 |
| West Bank and Gaza | 38.91 | 28.35 | - | 3.40 | 2.16 | 2.02 | 0.02 | 35.95 | 1.10 | 1.81 | - | 0.05 | - | 2.96 |
| Syria | 118.53 | 0.54 | 106.00 | 3.40 | 1.63 | 6.97 | - | 118.53 | - | - | - | - | - | - |
| Yemen | 86.82 | 2.50 | 80.37 | 3.90 | - | 0.05 | - | 86.82 | 0.00 | - | - | - | - | 0.00 |
| Region-allocable | ||||||||||||||
| Middle East | 163.97 | 6.60 | 19.40 | 92.72 | 3.81 | 13.16 | 17.57 | 153.25 | 2.84 | - | - | - | 7.87 | 10.71 |
| Asia | 1,174.96 | 290.42 | 115.40 | 560.59 | 33.85 | 62.39 | 37.09 | 1,099.73 | 19.21 | - | 3.60 | 0.99 | 51.42 | 75.23 |
| Country-allocable | ||||||||||||||
| Afghanistan | 118.97 | 56.47 | 58.25 | - | 1.30 | 2.23 | - | 118.24 | 0.67 | - | - | 0.03 | 0.04 | 0.73 |
| Armenia | 0.53 | 0.18 | - | - | - | 0.34 | - | 0.53 | - | - | - | - | - | - |
| Azerbaijan | 0.33 | 0.02 | - | - | - | 0.27 | 0.03 | 0.33 | - | - | - | - | - | - |
| Bangladesh | 124.28 | 97.73 | 14.20 | 8.21 | 0.66 | 1.28 | - | 122.09 | 1.19 | - | - | 0.01 | 1.00 | 2.19 |
| Brunei | - | - | - | - | - | - | - | - | - | - | - | - | - | - |
| Bhutan | 1.82 | 1.26 | - | - | - | - | 0.01 | 1.27 | 0.55 | - | - | - | - | 0.55 |
| China | 3.20 | 0.87 | - | - | - | 0.03 | 0.13 | 1.03 | 0.07 | - | 1.60 | - | 0.50 | 2.18 |
| Georgia | 0.17 | 0.10 | - | - | - | 0.07 | - | 0.17 | 0.00 | - | - | - | - | 0.00 |
| Indonesia | 90.75 | 17.25 | - | 71.35 | 0.15 | 0.22 | - | 88.97 | 1.04 | - | 0.67 | - | 0.08 | 1.78 |
| India | 69.41 | 0.61 | - | 67.93 | 0.38 | - | - | 68.92 | 0.48 | - | - | - | 0.02 | 0.49 |
| Kyrgyzstan | 4.49 | 0.12 | - | 3.40 | 0.64 | 0.30 | - | 4.47 | 0.02 | - | - | - | - | 0.02 |
| Cambodia | 3.85 | 0.18 | - | - | 2.70 | 0.20 | - | 3.07 | 0.59 | - | - | 0.10 | 0.09 | 0.77 |
| Kazakhstan | 4.33 | 0.25 | - | - | - | 4.05 | 0.03 | 4.33 | - | - | - | - | - | - |
| Laos | 2.67 | 0.16 | - | - | 0.42 | 1.90 | - | 2.48 | 0.18 | - | - | 0.01 | - | 0.19 |
| Sri Lanka | 17.63 | 5.05 | 3.00 | 5.17 | 1.68 | 2.10 | - | 16.99 | 0.63 | - | - | 0.02 | - | 0.64 |
| Myanmar | 44.67 | 26.95 | 4.70 | 3.40 | 1.87 | 6.87 | - | 43.80 | 0.88 | - | - | - | - | 0.88 |
| Mongolia | 10.33 | 5.20 | - | 4.77 | 0.28 | 0.07 | - | 10.32 | 0.01 | - | - | - | 0.00 | 0.01 |
| Maldives | 0.11 | 0.05 | - | - | - | 0.05 | - | 0.10 | 0.02 | - | - | - | - | 0.02 |
| Malaysia | 2.36 | 0.19 | - | - | 0.02 | 0.80 | - | 1.01 | 0.75 | - | - | - | 0.60 | 1.35 |
| Nepal | 4.16 | 0.39 | - | 0.60 | 2.10 | 0.06 | - | 3.15 | 0.99 | - | - | 0.02 | - | 1.01 |
| Philippines | 85.17 | 9.30 | - | 70.60 | 2.44 | 1.09 | - | 83.43 | 0.62 | - | 0.67 | 0.04 | 0.41 | 1.74 |
| Pakistan | 69.97 | 36.39 | 23.50 | 1.81 | 3.02 | 2.98 | - | 67.71 | 0.61 | - | - | - | 1.65 | 2.26 |
| Singapore | 0.03 | - | - | - | - | 0.03 | - | 0.03 | - | - | - | - | - | - |
| Thailand | 1.51 | 0.22 | - | - | 0.09 | 0.50 | - | 0.81 | 0.70 | - | - | - | 0.00 | 0.70 |
| Tajikistan | 2.09 | 0.06 | - | - | 1.21 | 0.80 | - | 2.07 | 0.02 | - | - | - | - | 0.02 |
| Timor-Leste | 0.08 | 0.08 | - | - | - | - | - | 0.08 | 0.00 | - | - | - | - | 0.00 |
| Turkmenistan | 0.44 | 0.06 | - | - | - | 0.37 | 0.01 | 0.44 | - | - | - | - | - | - |
| Uzbekistan | 9.11 | 0.11 | - | - | - | 5.35 | 0.01 | 5.46 | 0.00 | - | - | - | 3.64 | 3.65 |
| Vietnam | 15.00 | 8.43 | - | 0.53 | 1.70 | 0.03 | - | 10.68 | 0.75 | - | 0.67 | - | 2.90 | 4.32 |
| Region-allocable | ||||||||||||||
| Asia | 419.60 | 17.93 | 11.44 | 309.27 | 12.72 | 24.50 | 36.87 | 412.73 | 6.08 | - | - | 0.77 | 0.02 | 6.87 |
| Southcentral Asia | 4.64 | - | - | 2.95 | - | 1.69 | - | 4.64 | - | - | - | - | - | - |
| South Asia | 3.84 | - | 0.30 | 1.51 | 0.27 | 0.51 | - | 2.59 | 1.25 | - | - | - | - | 1.25 |
| Central Asia | 7.59 | - | - | 0.04 | - | 0.19 | - | 0.23 | 0.36 | - | - | - | 7.00 | 7.36 |
| Southeast Asia | 50.71 | 4.80 | - | 7.94 | 0.20 | 3.52 | - | 16.46 | 0.77 | - | - | - | 33.48 | 34.25 |
| Eastern Asia | 1.11 | - | - | 1.11 | - | - | - | 1.11 | - | - | - | - | - | - |
| Americas | 885.02 | 343.19 | 60.42 | 269.51 | 42.23 | 54.92 | 33.21 | 803.48 | 30.84 | 0.53 | 1.74 | 2.59 | 45.84 | 81.54 |
| Country-allocable | ||||||||||||||
| Antigua and Barbuda | 1.05 | 0.75 | - | - | - | 0.29 | - | 1.05 | - | - | - | - | - | - |
| Argentina | 1.75 | 0.38 | - | - | 0.02 | 0.26 | 0.01 | 0.67 | 1.09 | - | - | - | - | 1.09 |
| Barbados | 0.80 | 0.59 | - | - | - | 0.21 | - | 0.80 | - | - | - | - | - | - |
| Bolivia | 22.69 | 8.24 | - | 7.36 | 4.96 | 0.12 | - | 20.68 | 1.12 | - | - | 0.31 | 0.57 | 2.01 |
| Brazil | 3.86 | 1.97 | - | - | - | 0.54 | 0.04 | 2.56 | 0.84 | - | - | - | 0.47 | 1.31 |
| Bahamas | 0.26 | 0.13 | - | - | - | 0.12 | - | 0.26 | - | - | - | - | - | - |
| Belize | 5.49 | 3.55 | - | - | 0.19 | 1.25 | - | 4.99 | 0.37 | - | 0.13 | - | - | 0.50 |
| Chile | 3.82 | 1.34 | - | 2.34 | - | 0.14 | - | 3.82 | - | - | - | - | - | - |
| Colombia | 65.43 | 33.33 | 8.05 | 11.50 | 1.97 | 6.55 | 0.02 | 61.42 | 2.38 | - | 0.43 | 0.42 | 0.78 | 4.01 |
| Costa Rica | 5.11 | 0.28 | - | 3.29 | 0.20 | 0.60 | - | 4.37 | 0.72 | - | - | 0.02 | - | 0.74 |
| Cuba | 5.52 | 3.83 | - | - | - | - | - | 3.83 | 0.38 | - | - | 0.19 | 1.12 | 1.69 |
| Dominica | 4.86 | 4.70 | - | - | 0.05 | 0.11 | - | 4.86 | 0.00 | - | - | - | - | 0.00 |
| Dominican Republic | 30.69 | 0.30 | - | 29.61 | 0.02 | 0.37 | - | 30.30 | 0.39 | - | - | - | 0.00 | 0.39 |
| Ecuador | 24.42 | 10.61 | 1.00 | 8.73 | 1.08 | 0.44 | - | 21.86 | 2.09 | - | 0.05 | 0.05 | 0.36 | 2.56 |
| Grenada | 4.34 | 4.10 | - | - | - | 0.11 | - | 4.21 | 0.00 | - | 0.13 | - | - | 0.13 |
| Guatemala | 24.03 | 9.49 | 5.17 | 4.77 | 1.95 | 0.92 | - | 22.30 | 1.01 | - | - | 0.56 | 0.16 | 1.73 |
| Guyana | 10.97 | 8.63 | - | - | 1.41 | 0.55 | - | 10.59 | 0.00 | - | 0.13 | - | 0.25 | 0.38 |
| Honduras | 30.86 | 15.75 | 4.98 | 4.50 | 3.59 | 0.85 | - | 29.68 | 0.90 | - | - | 0.19 | 0.10 | 1.19 |
| Haiti | 128.57 | 83.25 | 17.88 | 13.03 | 5.65 | 5.66 | 0.01 | 125.47 | 0.62 | 0.53 | 0.08 | 0.31 | 1.56 | 3.10 |
| Jamaica | 25.62 | 14.74 | - | 8.36 | 0.86 | 1.49 | 0.01 | 25.47 | 0.15 | - | - | - | - | 0.15 |
| Saint Kitts and Nevis | 0.43 | 0.32 | - | - | - | 0.11 | - | 0.43 | - | - | - | - | - | - |
| Saint Lucia | 5.28 | 4.99 | - | - | 0.04 | 0.11 | - | 5.14 | 0.02 | - | 0.13 | - | - | 0.14 |
| Montserrat | 0.41 | 0.41 | - | - | - | - | - | 0.41 | - | - | - | - | - | - |
| Mexico | 41.80 | 2.05 | - | 2.34 | - | 2.25 | 1.31 | 7.95 | 1.23 | - | 0.38 | 0.07 | 32.17 | 33.85 |
| Nicaragua | 8.79 | 5.50 | 0.50 | 1.86 | 0.59 | - | - | 8.44 | 0.28 | - | - | 0.07 | - | 0.34 |
| Panama | 5.22 | 0.34 | - | 3.53 | 0.05 | 1.00 | - | 4.92 | 0.31 | - | - | - | - | 0.31 |
| Peru | 36.82 | 22.71 | 0.70 | 5.39 | 4.36 | 0.45 | - | 33.61 | 2.44 | - | 0.30 | 0.07 | 0.41 | 3.21 |
| Paraguay | 1.62 | 0.31 | - | 1.19 | - | 0.08 | - | 1.58 | 0.04 | - | - | - | - | 0.04 |
| Suriname | 3.52 | 3.26 | - | - | 0.11 | 0.15 | - | 3.52 | - | - | - | - | - | - |
| El Salvador | 14.15 | 5.78 | 0.50 | 4.93 | 0.85 | 0.89 | - | 12.94 | 0.98 | - | - | 0.05 | 0.18 | 1.21 |
| Trinidad and Tobago | 1.88 | 0.40 | - | - | - | 1.47 | - | 1.88 | - | - | - | - | - | - |
| Uruguay | 0.22 | - | - | - | - | 0.22 | - | 0.22 | - | - | - | - | - | - |
| Saint Vincent and the Grenadines | 3.93 | 3.71 | - | - | - | 0.11 | - | 3.82 | 0.12 | - | - | - | - | 0.12 |
| Venezuela | 18.75 | 12.42 | 6.05 | - | - | 0.26 | - | 18.73 | 0.02 | - | - | - | 0.00 | 0.02 |
| Region-allocable | ||||||||||||||
| Americas | 243.87 | 52.09 | 13.49 | 123.96 | 5.31 | 20.70 | 27.27 | 242.81 | - | - | - | 0.29 | 0.76 | 1.05 |
| Central America | 29.22 | 5.89 | 1.80 | 9.67 | 3.02 | 1.38 | 0.64 | 22.41 | 1.65 | - | - | - | 5.16 | 6.81 |
| South America | 46.81 | 6.00 | 0.30 | 18.25 | 2.94 | 4.35 | 2.41 | 34.25 | 11.39 | - | - | - | 1.17 | 12.56 |
| Caribbean | 22.16 | 11.04 | - | 4.90 | 3.01 | 0.81 | 1.49 | 21.24 | 0.30 | - | - | - | 0.62 | 0.92 |
| Europe | 5,684.07 | 96.12 | 285.50 | 199.27 | 0.69 | 99.10 | 19.55 | 700.24 | 0.04 | 0.57 | - | 11.30 | 4,971.93 | 4,983.83 |
| Country-allocable | ||||||||||||||
| Albania | 0.16 | 0.16 | - | - | - | - | - | 0.16 | 0.00 | - | - | - | - | 0.00 |
| Bosnia and Herzegovina | 0.25 | 0.22 | - | - | 0.02 | - | - | 0.25 | - | - | - | - | - | - |
| Belarus | 0.69 | 0.17 | - | - | - | 0.53 | - | 0.69 | - | - | - | - | - | - |
| Hungary | 0.40 | - | 0.40 | - | - | - | - | 0.40 | - | - | - | - | - | - |
| Moldova | 10.82 | 0.27 | 10.55 | - | - | - | - | 10.82 | 0.00 | - | - | - | - | 0.00 |
| Montenegro | 0.06 | 0.06 | - | - | - | - | - | 0.06 | - | - | - | - | - | - |
| North Macedonia | 25.66 | 0.06 | - | 25.60 | - | - | - | 25.66 | - | - | - | - | - | - |
| Poland | 3.30 | - | 3.30 | - | - | - | - | 3.30 | - | - | - | - | - | - |
| Romania | 6.27 | - | 6.27 | - | - | - | - | 6.27 | - | - | - | - | - | - |
| Serbia | 0.33 | 0.27 | - | - | 0.06 | - | - | 0.33 | - | - | - | - | - | - |
| Slovakia | 1.40 | - | 1.40 | - | - | - | - | 1.40 | - | - | - | - | - | - |
| Türkiye | 30.86 | 0.33 | 30.00 | - | - | - | - | 30.33 | 0.03 | - | - | 0.50 | - | 0.53 |
| Ukraine | 5,399.93 | 90.70 | 219.05 | 38.56 | 0.12 | 68.23 | - | 416.66 | - | 0.56 | - | 10.80 | 4,971.91 | 4,983.27 |
| Kosovo | 0.19 | 0.15 | - | - | - | 0.04 | - | 0.19 | - | 0.01 | - | - | - | 0.01 |
| Region-allocable | ||||||||||||||
| Europe | 203.75 | 3.74 | 14.53 | 135.11 | 0.49 | 30.31 | 19.55 | 203.73 | - | - | - | - | 0.02 | 0.02 |
| Oceania | 67.35 | 9.51 | 1.35 | 36.25 | 1.32 | 14.81 | 3.84 | 67.08 | 0.26 | - | - | - | 0.00 | 0.26 |
| Country-allocable | ||||||||||||||
| Fiji | 0.08 | 0.07 | - | - | - | - | 0.01 | 0.08 | - | - | - | - | - | - |
| Micronesia | 0.15 | 0.15 | - | - | - | - | - | 0.15 | - | - | - | - | - | - |
| Kiribati | 0.06 | 0.06 | - | - | - | - | - | 0.06 | 0.00 | - | - | - | - | 0.00 |
| Marshall Islands | 0.63 | 0.10 | - | 0.53 | - | - | - | 0.63 | - | - | - | - | - | - |
| Papua New Guinea | 0.36 | 0.36 | - | - | - | - | - | 0.36 | 0.00 | - | - | - | - | 0.00 |
| Solomon Islands | 0.08 | 0.08 | - | - | - | - | - | 0.08 | - | - | - | - | 0.00 | 0.00 |
| Tonga | 0.20 | 0.20 | - | - | - | - | - | 0.20 | 0.00 | - | - | - | 0.00 | 0.00 |
| Tuvalu | 0.04 | 0.04 | - | - | - | - | - | 0.04 | 0.00 | - | - | - | - | 0.00 |
| Vanuatu | 0.16 | 0.06 | - | - | 0.04 | - | 0.01 | 0.10 | 0.06 | - | - | - | 0.00 | 0.06 |
| Samoa | 0.06 | 0.06 | - | - | - | - | - | 0.06 | 0.00 | - | - | - | - | 0.00 |
| Region-allocable | ||||||||||||||
| Oceania | 65.53 | 8.34 | 1.35 | 35.73 | 1.29 | 14.81 | 3.82 | 65.33 | 0.20 | - | - | - | - | 0.20 |
| Global/unallocable (2) | 2,341.99 | 0.04 | 2.00 | 3.67 | 7.01 | 9.94 | 3.65 | 26.30 | 50.02 | 7.97 | 35.95 | 471.98 | 1,749.77 | 2,315.69 |
| International bilateral assistance | 13,274.73 | 1,507.01 | 1,067.90 | 2,129.35 | 354.16 | 375.62 | 191.82 | 5,625.87 | 180.04 | 15.48 | 44.90 | 492.43 | 6,916.01 | 7,648.86 |
(1) Projects coded to Africa are included under sub-Saharan Africa because most of the benefits will incur to countries in that region. (2) Unallocable aid are disbursements that cannot be identified for any particular recipient or sector (e.g. cost of refugees in Canada). | ||||||||||||||
Geographic distribution of Canada’s multilateral international assistance
Figures in millions of Canadian dollars
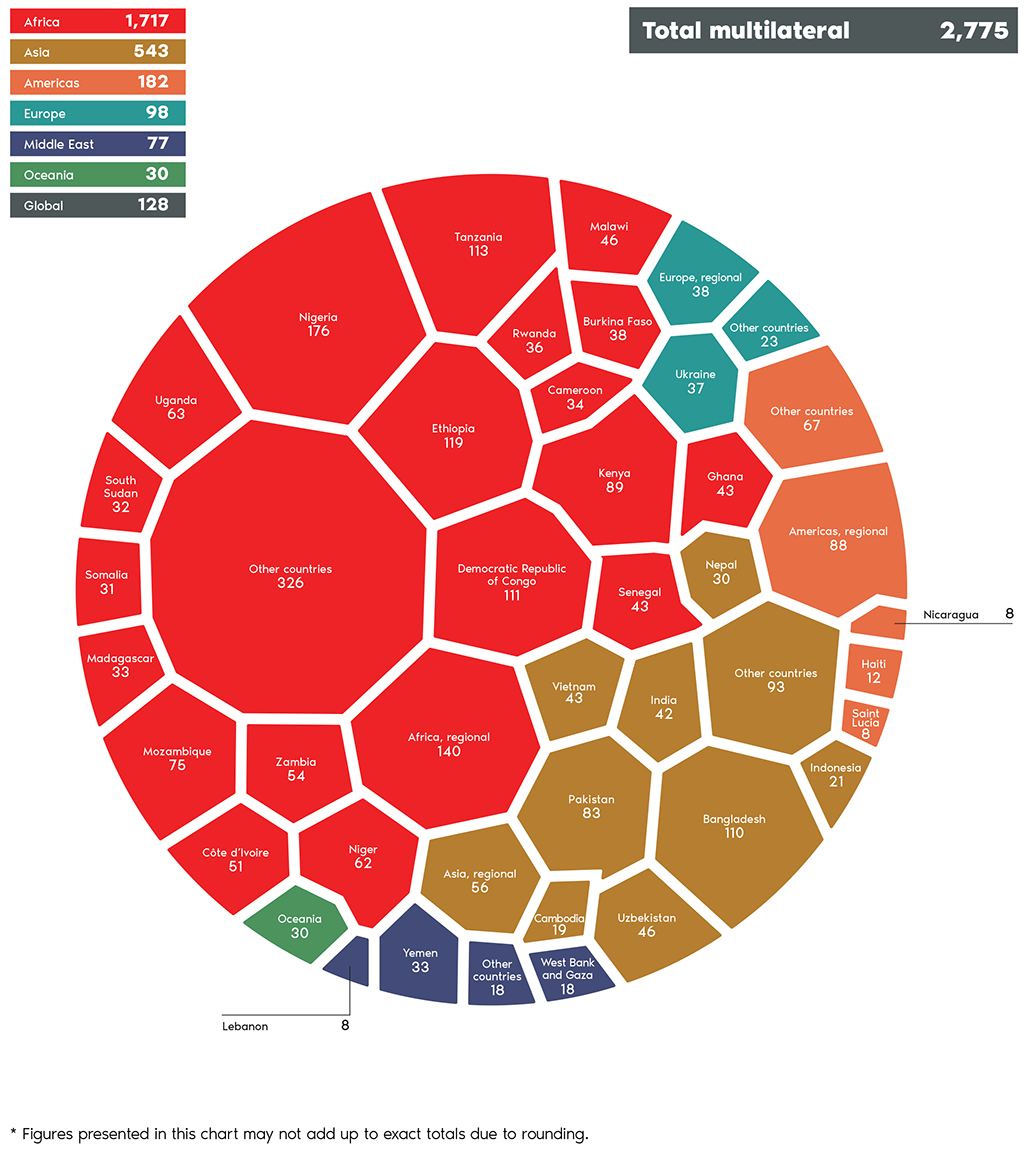
Text version
| Continent total | Total | Percentage of total |
|---|---|---|
| Africa | 1,717 | 65% |
| Americas | 182 | 7% |
| Asia | 543 | 21% |
| Europe | 98 | 4% |
| Middle East | 77 | 3% |
| Oceania | 30 | 1% |
| Global | 128 | - |
| Total | 2,775 | 100% |
| Continent | Country | Amount | Percentage of full circle |
|---|---|---|---|
| Africa | Nigeria | 176 | 7% |
| Africa | Africa, regional | 140 | 5% |
| Africa | Ethiopia | 119 | 5% |
| Africa | Tanzania | 113 | 4% |
| Africa | Democratic Republic of Congo | 111 | 4% |
| Africa | Kenya | 89 | 3% |
| Africa | Mozambique | 75 | 3% |
| Africa | Uganda | 63 | 2% |
| Africa | Niger | 62 | 2% |
| Africa | Zambia | 54 | 2% |
| Africa | Côte d’Ivoire | 51 | 2% |
| Africa | Malawi | 46 | 2% |
| Africa | Ghana | 43 | 2% |
| Africa | Senegal | 43 | 2% |
| Africa | Burkina Faso | 38 | 1% |
| Africa | Rwanda | 36 | 1% |
| Africa | Cameroon | 34 | 1% |
| Africa | Madagascar | 33 | 1% |
| Africa | South Sudan | 32 | 1% |
| Africa | Somalia | 31 | 1% |
| Africa | Other countries | 326 | 12% |
| Americas | Americas, regional | 88 | 3% |
| Americas | Haiti | 12 | 0% |
| Americas | Nicaragua | 8 | 0% |
| Americas | Saint Lucia | 8 | 0% |
| Americas | Other countries | 67 | 3% |
| Asia | Bangladesh | 110 | 4% |
| Asia | Pakistan | 83 | 3% |
| Asia | Asia, regional | 56 | 2% |
| Asia | Uzbekistan | 46 | 2% |
| Asia | Vietnam | 43 | 2% |
| Asia | India | 42 | 2% |
| Asia | Nepal | 30 | 1% |
| Asia | Indonesia | 21 | 1% |
| Asia | Cambodia | 19 | 1% |
| Asia | Other countries | 93 | 4% |
| Europe | Europe, regional | 38 | 1% |
| Europe | Ukraine | 37 | 1% |
| Europe | Other Countries | 23 | 1% |
| Middle East | Yemen | 33 | 1% |
| Middle East | West Bank and Gaza | 18 | 1% |
| Middle East | Lebanon | 8 | 0% |
| Middle East | Other countries | 18 | 1% |
| Oceania | Oceania | 30 | 1% |
* Details presented in this chart may not add up to exact totals due to rounding.
D3: Multilateral international assistance
Multilateral aid cannot be accurately attributed to Canada's contributions, regardless of the methodology used. See definition of “multilateral aid” in the Glossary for a complete explanation.
This table includes ODA and other official assistance expenditures in millions of Canadian dollars.
| Recipient | Total | Global Affairs Canada | Other government sources | |||||
|---|---|---|---|---|---|---|---|---|
| United Nations agency, fund or commission | Regional development banks | Other multilateral organizations | Total | Department of Finance Canada | Others | Total | ||
| Africa - Total | 1,717.04 | 163.50 | 257.23 | 355.71 | 776.45 | 935.50 | 5.09 | 940.59 |
| Sub-Saharan Africa | 1,710.03 | 160.30 | 257.23 | 351.94 | 769.48 | 935.50 | 5.04 | 940.54 |
| Country-allocable | ||||||||
| Angola | 4.08 | 1.10 | 0.11 | 2.78 | 3.99 | 0.09 | - | 0.09 |
| Benin | 27.84 | 1.56 | 2.12 | 3.77 | 7.45 | 20.11 | 0.28 | 20.38 |
| Botswana | 1.19 | 0.36 | - | 0.82 | 1.19 | - | - | - |
| Burkina Faso | 37.65 | 2.46 | 2.78 | 8.73 | 13.98 | 23.40 | 0.28 | 23.67 |
| Burundi | 19.29 | 2.31 | 2.43 | 5.75 | 10.49 | 8.74 | 0.05 | 8.79 |
| Cameroon | 34.08 | 3.01 | 6.58 | 9.85 | 19.43 | 14.64 | - | 14.64 |
| Cabo Verde | 4.04 | 0.35 | - | 0.64 | 0.98 | 3.05 | - | 3.05 |
| Central African Republic | 20.31 | 7.90 | 1.23 | 3.74 | 12.87 | 7.44 | - | 7.44 |
| Chad | 14.76 | 3.19 | 0.30 | 5.87 | 9.36 | 5.40 | - | 5.40 |
| Comoros | 5.33 | 0.33 | 1.60 | 0.65 | 2.59 | 2.61 | 0.14 | 2.75 |
| Democratic Republic of Congo | 111.47 | 11.80 | 16.78 | 23.87 | 52.45 | 59.02 | - | 59.02 |
| Congo | 11.40 | 0.59 | 0.39 | 2.28 | 3.26 | 8.14 | - | 8.14 |
| Côte d’Ivoire | 51.22 | 1.11 | 3.10 | 5.78 | 10.00 | 40.81 | 0.41 | 41.22 |
| Djibouti | 5.31 | 0.44 | 2.10 | 0.51 | 3.05 | 2.12 | 0.14 | 2.25 |
| Equatorial Guinea | 0.60 | 0.32 | - | 0.28 | 0.60 | - | - | - |
| Eritrea | 3.92 | 0.75 | 1.53 | 1.65 | 3.92 | - | - | - |
| Eswatini | 1.10 | 0.35 | - | 0.75 | 1.10 | - | - | - |
| Ethiopia | 119.38 | 6.88 | 11.35 | 19.06 | 37.29 | 82.05 | 0.03 | 82.09 |
| Gabon | 0.64 | 0.54 | - | 0.10 | 0.64 | - | - | - |
| Gambia | 11.96 | 0.64 | 1.81 | 1.67 | 4.11 | 7.80 | 0.04 | 7.84 |
| Ghana | 43.33 | 1.30 | 12.89 | 6.14 | 20.32 | 22.90 | 0.11 | 23.01 |
| Guinea | 18.24 | 1.06 | 6.54 | 4.72 | 12.31 | 5.89 | 0.04 | 5.93 |
| Guinea-Bissau | 9.91 | 0.93 | 3.02 | 2.15 | 6.10 | 3.81 | - | 3.81 |
| Kenya | 88.70 | 1.39 | 9.78 | 17.06 | 28.23 | 60.25 | 0.22 | 60.47 |
| Lesotho | 5.99 | 0.52 | 1.16 | 1.87 | 3.55 | 1.92 | 0.52 | 2.44 |
| Liberia | 17.64 | 2.28 | 3.64 | 1.71 | 7.62 | 9.98 | 0.04 | 10.02 |
| Madagascar | 33.13 | 5.32 | 5.24 | 3.87 | 14.43 | 18.56 | 0.14 | 18.70 |
| Malawi | 46.00 | 3.96 | 5.01 | 12.30 | 21.27 | 24.17 | 0.56 | 24.73 |
| Mali | 28.61 | 10.19 | 1.91 | 5.27 | 17.36 | 11.14 | 0.11 | 11.25 |
| Mauritania | 10.25 | 1.01 | 0.88 | 1.50 | 3.39 | 6.86 | - | 6.86 |
| Mauritius | 0.94 | 0.24 | - | 0.57 | 0.81 | - | 0.13 | 0.13 |
| Mozambique | 74.99 | 2.93 | 6.02 | 19.80 | 28.75 | 46.10 | 0.14 | 46.24 |
| Namibia | 3.63 | 0.45 | - | 3.13 | 3.59 | - | 0.04 | 0.04 |
| Niger | 62.10 | 5.77 | 10.84 | 6.04 | 22.66 | 39.24 | 0.21 | 39.44 |
| Nigeria | 176.37 | 4.74 | 9.43 | 33.66 | 47.83 | 128.50 | 0.04 | 128.54 |
| Rwanda | 36.22 | 2.23 | 3.58 | 6.63 | 12.44 | 23.73 | 0.05 | 23.78 |
| São Tomé and Príncipe | 5.27 | 0.55 | 0.43 | 1.39 | 2.37 | 2.90 | - | 2.90 |
| Senegal | 43.21 | 0.83 | 4.07 | 3.28 | 8.18 | 34.96 | 0.07 | 35.03 |
| Sierra Leone | 23.58 | 1.38 | 5.31 | 3.63 | 10.33 | 12.93 | 0.33 | 13.26 |
| Somalia | 30.92 | 4.70 | 2.52 | 4.42 | 11.64 | 19.28 | - | 19.28 |
| South Africa | 12.10 | 0.91 | - | 11.19 | 12.10 | - | - | - |
| South Sudan | 31.82 | 10.81 | 5.36 | 4.30 | 20.47 | 11.35 | - | 11.35 |
| Sudan | 15.08 | 5.94 | 1.40 | 6.40 | 13.74 | 1.19 | 0.14 | 1.33 |
| Tanzania | 113.38 | 1.92 | 16.87 | 17.24 | 36.03 | 77.30 | 0.05 | 77.35 |
| Togo | 19.14 | 1.61 | 3.09 | 3.17 | 7.87 | 11.16 | 0.11 | 11.27 |
| Uganda | 62.80 | 2.85 | 15.06 | 17.56 | 35.47 | 27.11 | 0.22 | 27.34 |
| Zambia | 54.44 | 1.40 | 2.97 | 9.09 | 13.47 | 40.97 | - | 40.97 |
| Zimbabwe | 17.20 | 2.99 | 1.97 | 11.80 | 16.76 | 0.44 | - | 0.44 |
| Region-allocable | ||||||||
| Sub-Saharan Africa | 0.94 | 0.14 | - | 0.27 | 0.41 | 0.53 | - | 0.53 |
| West Africa | 6.87 | 0.35 | 1.11 | 0.04 | 1.49 | 5.37 | - | 5.37 |
| Central Africa | 0.01 | 0.01 | - | - | 0.01 | - | - | - |
| East Africa | 4.62 | 0.09 | 2.05 | 0.94 | 3.08 | 1.54 | - | 1.54 |
| Southern Africa | 0.49 | 0.25 | 0.23 | - | 0.49 | - | - | - |
| Africa (1) | 126.58 | 33.25 | 60.66 | 32.27 | 126.18 | - | 0.41 | 0.41 |
| North Africa | 7.01 | 3.20 | - | 3.77 | 6.96 | - | 0.05 | 0.05 |
| Country-allocable | ||||||||
| Algeria | 1.11 | 0.75 | - | 0.36 | 1.11 | - | - | - |
| Egypt | 2.34 | 0.81 | - | 1.52 | 2.34 | - | - | - |
| Western Sahara | 0.30 | 0.30 | - | - | 0.30 | - | - | - |
| Libya | 0.53 | 0.53 | - | - | 0.53 | - | - | - |
| Morocco | 2.06 | 0.33 | - | 1.69 | 2.01 | - | 0.05 | 0.05 |
| Tunisia | 0.47 | 0.27 | - | 0.21 | 0.47 | - | - | - |
| Region-allocable | ||||||||
| North Africa | 0.21 | 0.21 | - | - | 0.21 | - | - | - |
| Middle East | 77.00 | 45.19 | - | 4.84 | 50.03 | 26.55 | 0.42 | 26.97 |
| Country-allocable | ||||||||
| Iraq | 1.02 | 0.94 | - | 0.07 | 1.02 | - | - | - |
| Iran | 0.73 | 0.18 | - | 0.55 | 0.73 | - | - | - |
| Jordan | 7.59 | 6.68 | - | 0.62 | 7.29 | - | 0.29 | 0.29 |
| Lebanon | 8.16 | 7.75 | - | 0.41 | 8.16 | - | - | - |
| West Bank and Gaza | 17.51 | 17.51 | - | - | 17.51 | - | - | - |
| Syria | 6.27 | 6.07 | - | 0.20 | 6.27 | - | - | - |
| Yemen | 32.87 | 5.29 | - | 1.05 | 6.34 | 26.53 | - | 26.53 |
| Region-allocable | ||||||||
| Middle East | 2.86 | 0.77 | - | 1.94 | 2.71 | 0.02 | 0.13 | 0.14 |
| Asia | 543.26 | 58.60 | 28.89 | 137.16 | 224.65 | 315.82 | 2.79 | 318.60 |
| Country-allocable | ||||||||
| Afghanistan | 10.55 | 2.89 | 0.46 | 4.74 | 8.10 | 2.45 | - | 2.45 |
| Armenia | 1.32 | 0.28 | 0.22 | 0.56 | 1.07 | 0.20 | 0.05 | 0.25 |
| Azerbaijan | 1.08 | 0.19 | 0.05 | 0.85 | 1.08 | - | - | - |
| Bangladesh | 109.58 | 3.29 | 2.27 | 9.64 | 15.21 | 94.37 | - | 94.37 |
| Bhutan | 4.87 | 0.48 | 0.12 | 0.97 | 1.57 | 3.30 | - | 3.30 |
| China | 9.76 | 0.48 | 2.40 | 6.87 | 9.76 | - | - | - |
| Georgia | 1.90 | 0.25 | 0.72 | 0.73 | 1.70 | 0.19 | - | 0.19 |
| Indonesia | 21.00 | 0.68 | 2.44 | 17.62 | 20.73 | - | 0.27 | 0.27 |
| India | 42.46 | 3.45 | 5.97 | 16.15 | 25.56 | 16.84 | 0.06 | 16.89 |
| Kyrgyzstan | 7.68 | 0.48 | 0.27 | 1.10 | 1.84 | 5.64 | 0.20 | 5.84 |
| Cambodia | 19.22 | 2.18 | 0.38 | 2.70 | 5.26 | 13.96 | - | 13.96 |
| North Korea | 0.34 | 0.14 | - | 0.20 | 0.34 | - | - | - |
| Kazakhstan | 2.04 | 0.19 | 0.13 | 1.64 | 1.96 | - | 0.08 | 0.08 |
| Laos | 5.86 | 0.70 | 0.12 | 0.85 | 1.68 | 4.18 | - | 4.18 |
| Sri Lanka | 7.40 | 0.70 | 1.23 | 1.28 | 3.20 | 4.19 | - | 4.19 |
| Myanmar | 6.95 | 2.57 | 0.00 | 3.99 | 6.57 | 0.39 | - | 0.39 |
| Mongolia | 4.16 | 0.21 | 0.40 | 0.96 | 1.58 | 2.53 | 0.05 | 2.58 |
| Maldives | 1.11 | 0.17 | 0.03 | 0.09 | 0.29 | 0.82 | - | 0.82 |
| Malaysia | 2.07 | 0.24 | 0.00 | 1.61 | 1.85 | - | 0.22 | 0.22 |
| Nepal | 29.69 | 1.50 | 0.40 | 3.19 | 5.08 | 24.25 | 0.35 | 24.61 |
| Philippines | 9.02 | 0.69 | 3.16 | 5.17 | 9.02 | - | - | - |
| Pakistan | 83.03 | 3.59 | 3.78 | 18.37 | 25.74 | 56.93 | 0.36 | 57.29 |
| Thailand | 2.97 | 0.28 | 0.07 | 2.62 | 2.97 | - | - | - |
| Tajikistan | 11.63 | 1.27 | 0.35 | 1.77 | 3.39 | 7.52 | 0.72 | 8.24 |
| Timor-Leste | 1.55 | 0.37 | 0.03 | 0.90 | 1.30 | 0.25 | - | 0.25 |
| Turkmenistan | 1.15 | 0.11 | 0.26 | 0.78 | 1.15 | - | - | - |
| Uzbekistan | 46.16 | 0.37 | 1.71 | 3.32 | 5.40 | 40.67 | 0.08 | 40.75 |
| Vietnam | 42.54 | 0.51 | 0.67 | 4.40 | 5.57 | 36.70 | 0.26 | 36.97 |
| Region-allocable | ||||||||
| Asia | 50.58 | 29.53 | 1.17 | 19.70 | 50.40 | 0.08 | 0.10 | 0.18 |
| Southcentral Asia | 0.12 | 0.12 | - | - | 0.12 | - | - | - |
| South Asia | 0.84 | 0.42 | 0.01 | 0.14 | 0.57 | 0.27 | - | 0.27 |
| Central Asia | 1.03 | 0.16 | 0.01 | 0.79 | 0.96 | 0.07 | - | 0.07 |
| Southeast Asia | 3.62 | 0.12 | 0.04 | 3.46 | 3.62 | - | - | - |
| Americas | 181.97 | 57.04 | 23.48 | 77.43 | 157.95 | 22.11 | 1.92 | 24.02 |
| Country-allocable | ||||||||
| Argentina | 4.09 | 0.34 | 0.57 | 3.19 | 4.09 | - | - | - |
| Bolivia | 4.76 | 0.32 | 0.05 | 1.87 | 2.24 | 2.52 | - | 2.52 |
| Brazil | 4.74 | 0.94 | 0.32 | 3.48 | 4.74 | - | - | - |
| Belize | 6.54 | 0.08 | 6.23 | 0.23 | 6.54 | - | - | - |
| Colombia | 3.95 | 0.74 | 0.31 | 2.78 | 3.84 | - | 0.11 | 0.11 |
| Costa Rica | 1.69 | 0.16 | 0.10 | 1.33 | 1.58 | - | 0.10 | 0.10 |
| Cuba | 3.08 | 0.70 | - | 2.38 | 3.08 | - | - | - |
| Dominica | 4.99 | 0.03 | 2.79 | - | 2.82 | 2.17 | - | 2.17 |
| Dominican Republic | 1.39 | 0.19 | 0.04 | 1.16 | 1.39 | - | - | - |
| Ecuador | 3.64 | 1.09 | 0.21 | 1.73 | 3.04 | - | 0.60 | 0.60 |
| Grenada | 1.58 | 0.01 | - | 0.13 | 0.13 | 1.44 | - | 1.44 |
| Guatemala | 2.42 | 0.57 | 0.02 | 1.82 | 2.42 | - | - | - |
| Guyana | 2.80 | 0.10 | 0.05 | 0.12 | 0.26 | 2.54 | - | 2.54 |
| Honduras | 5.40 | 0.96 | 0.10 | 2.49 | 3.55 | 1.72 | 0.12 | 1.85 |
| Haiti | 11.54 | 2.16 | 0.04 | 2.98 | 5.18 | 6.14 | 0.22 | 6.37 |
| Jamaica | 1.21 | 0.16 | 0.03 | 0.61 | 0.80 | - | 0.41 | 0.41 |
| Saint Lucia | 7.89 | 0.02 | 7.17 | - | 7.19 | 0.70 | - | 0.70 |
| Montserrat | 0.00 | 0.00 | - | - | 0.00 | - | - | - |
| Mexico | 2.06 | 0.33 | 0.24 | 1.49 | 2.06 | - | - | - |
| Nicaragua | 8.31 | 0.29 | 0.18 | 4.05 | 4.52 | 3.78 | - | 3.78 |
| Panama | 1.14 | 0.50 | 0.10 | 0.45 | 1.05 | - | 0.09 | 0.09 |
| Peru | 4.95 | 0.29 | 0.11 | 4.45 | 4.84 | - | 0.11 | 0.11 |
| Paraguay | 1.19 | 0.21 | 0.20 | 0.78 | 1.19 | - | - | - |
| Suriname | 1.14 | 0.05 | 0.06 | 1.02 | 1.14 | - | - | - |
| El Salvador | 1.53 | 0.53 | 0.06 | 0.94 | 1.53 | - | - | - |
| Saint Vincent and the Grenadines | 1.05 | 0.05 | - | 0.06 | 0.11 | 0.94 | - | 0.94 |
| Venezuela | 1.30 | 0.66 | 0.00 | 0.64 | 1.30 | - | - | - |
| Region-allocable | ||||||||
| Americas | 81.88 | 44.83 | 0.32 | 36.58 | 81.73 | - | 0.15 | 0.15 |
| Central America | 0.24 | 0.15 | 0.01 | 0.01 | 0.18 | 0.06 | - | 0.06 |
| South America | 0.33 | 0.32 | 0.01 | - | 0.33 | - | - | - |
| Caribbean | 5.16 | 0.25 | 4.18 | 0.64 | 5.08 | 0.09 | - | 0.09 |
| Europe | 97.91 | 31.32 | - | 26.64 | 57.96 | 39.60 | 0.35 | 39.95 |
| Country-allocable | ||||||||
| Albania | 0.81 | 0.14 | - | 0.58 | 0.72 | - | 0.09 | 0.09 |
| Bosnia and Herzegovina | 1.52 | 0.22 | - | 1.30 | 1.52 | - | - | - |
| Belarus | 1.83 | 0.11 | - | 1.71 | 1.83 | - | - | - |
| Moldova | 8.72 | 0.41 | - | 1.05 | 1.46 | 7.26 | - | 7.26 |
| Montenegro | 0.80 | 0.09 | - | 0.63 | 0.71 | - | 0.09 | 0.09 |
| North Macedonia | 1.20 | 0.21 | - | 0.90 | 1.10 | - | 0.09 | 0.09 |
| Serbia | 1.00 | 0.20 | - | 0.80 | 1.00 | - | - | - |
| Türkiye | 1.68 | 0.23 | - | 1.45 | 1.68 | - | - | - |
| Ukraine | 37.00 | 2.98 | - | 4.93 | 7.91 | 29.09 | - | 29.09 |
| Kosovo | 4.95 | 0.30 | - | 1.40 | 1.70 | 3.25 | - | 3.25 |
| Ex-states of Yugoslavia | 0.00 | 0.00 | - | - | 0.00 | - | - | - |
| Region-allocable | ||||||||
| Europe | 38.40 | 26.43 | - | 11.90 | 38.33 | - | 0.07 | 0.07 |
| Oceania | 30.09 | 3.52 | 1.25 | 9.87 | 14.64 | 15.43 | 0.03 | 15.45 |
| Country-allocable | ||||||||
| Fiji | 7.89 | 0.60 | 0.29 | 2.52 | 3.40 | 4.49 | - | 4.49 |
| Micronesia | 0.43 | 0.00 | 0.02 | - | 0.02 | 0.38 | 0.03 | 0.41 |
| Kiribati | 0.80 | 0.02 | 0.04 | 0.07 | 0.13 | 0.67 | - | 0.67 |
| Marshall Islands | 0.88 | 0.02 | 0.02 | 0.02 | 0.06 | 0.82 | - | 0.82 |
| Nauru | 0.02 | - | 0.02 | - | 0.02 | - | - | - |
| Niue | 0.27 | 0.00 | 0.00 | 0.26 | 0.27 | - | - | - |
| Papua New Guinea | 5.58 | 0.40 | 0.61 | 3.11 | 4.11 | 1.46 | - | 1.46 |
| Palau | 0.07 | 0.01 | 0.06 | - | 0.07 | - | - | - |
| Solomon Islands | 3.00 | 0.09 | 0.04 | 0.75 | 0.88 | 2.12 | - | 2.12 |
| Tokelau | 0.01 | 0.01 | - | - | 0.01 | - | - | - |
| Tonga | 2.53 | 0.05 | 0.04 | 0.45 | 0.54 | 1.99 | - | 1.99 |
| Tuvalu | 0.65 | 0.00 | 0.02 | 0.00 | 0.03 | 0.62 | - | 0.62 |
| Vanuatu | 1.15 | 0.05 | 0.03 | 0.27 | 0.35 | 0.80 | - | 0.80 |
| Samoa | 2.94 | 0.12 | 0.04 | 0.85 | 1.02 | 1.92 | - | 1.92 |
| Region-allocable | ||||||||
| Oceania | 3.89 | 2.14 | 0.02 | 1.58 | 3.74 | 0.15 | - | 0.15 |
| Global/unallocable | 127.89 | 39.27 | - | 31.41 | 70.68 | 40.14 | 17.07 | 57.21 |
| Multilateral international assistance | 2,775.16 | 398.44 | 310.85 | 643.07 | 1,352.35 | 1,395.15 | 27.65 | 1,422.80 |
| (1) Projects coded to Africa are included under sub-Saharan Africa as most of the benefits will incur to countries in that sub-region. | ||||||||
Appendices
Appendix 1 - Reflows from repayable contributions and loans
In millions of Canadian dollars.
| Global Affairs Canada | Export Development Canada | |
|---|---|---|
| Bilateral loans | 18.15 | 16.43 |
| Africa | 9.04 | 0.11 |
| Algeria | 1.64 | - |
| Egypt | 4.68 | 0.11 |
| Morocco | 0.28 | - |
| Tunisia | 2.45 | - |
| Americas | 0.35 | - |
| Dominican Republic | 0.14 | - |
| Ecuador | 0.11 | - |
| Guatemala | 0.10 | - |
| Asia | 8.75 | 16.32 |
| China | - | 16.32 |
| Indonesia | 7.92 | - |
| Malaysia | 0.05 | - |
| Philippines | 0.10 | - |
| Thailand | 0.67 | - |
| Europe | 0.01 | - |
| Malta | 0.01 | - |
| Repayable contributions | 56.31 | - |
| Total | 74.46 | 16.43 |
This table refers to repayments of loans granted to developing countries by the former Canadian International Development Agency and by Export Development Canada and repayable contributions for development-related purposes issued by Global Affairs Canada and the Department of Finance Canada. Note that reflows on repayable contributions and loans are shown as negative amounts in some OECD reports as these were counted as ODA when they were granted. Under Section 23 of the Export Development Act, Export Development Canada reports as ODA concessional sovereign loans. These concessional credits, meeting approved development criteria, are not considered part of the international assistance envelope. | ||
Appendix 2 - Other bilateral official flows by recipient
This table includes non-ODA bilateral assistance expenditure in millions of Canadian dollars.
| Recipient | Total | Global Affairs Canada | Other government sources | ||||||
|---|---|---|---|---|---|---|---|---|---|
| Geographic programs | Partnerships for Development Innovation | Anti-Crime Capacity Building Program | Counter-Terrorism Capacity Building Program | Non-Proliferation and Security Threat Reduction | Peace and Stabilization Operations Program | Other programs | |||
| Sub-Saharan Africa | 24.81 | - | 0.04 | 0.30 | 7.16 | 9.93 | 6.51 | 0.88 | - |
| Burkina Faso | 0.89 | - | - | - | 0.89 | - | - | - | - |
| Benin | 0.02 | - | - | - | - | 0.02 | - | - | - |
| Côte d’Ivoire | 0.02 | - | - | - | - | 0.02 | - | - | - |
| Cameroon | 0.21 | - | - | - | 0.19 | 0.03 | - | - | - |
| Djibouti | 0.02 | - | - | - | - | 0.02 | - | - | - |
| Ghana | 0.60 | - | - | - | - | 0.07 | 0.53 | - | - |
| Gambia | 0.00 | - | - | - | - | 0.00 | - | - | - |
| Guinea | 0.02 | - | - | - | - | 0.02 | - | - | - |
| Kenya | 1.48 | - | - | - | 1.48 | - | - | - | - |
| Mali | 0.86 | - | - | - | 0.84 | 0.02 | - | - | - |
| Mauritania | 0.23 | - | - | - | 0.21 | 0.02 | - | - | - |
| Mozambique | 0.00 | - | - | - | - | 0.00 | - | - | - |
| Niger | 1.37 | - | - | - | 1.34 | 0.02 | - | - | - |
| Nigeria | 0.19 | - | - | - | 0.19 | - | - | - | - |
| Seychelles | 0.23 | - | 0.04 | - | 0.20 | - | - | - | - |
| Sudan | 0.04 | - | - | - | 0.04 | - | - | - | - |
| Sierra Leone | 0.02 | - | - | - | - | 0.02 | - | - | - |
| Senegal | 0.02 | - | - | - | - | 0.02 | - | - | - |
| Somalia | 0.72 | - | - | - | 0.72 | - | - | - | - |
| Chad | 0.21 | - | - | - | 0.19 | 0.02 | - | - | - |
| Togo | 0.03 | - | - | - | - | 0.03 | - | - | - |
| Tanzania | 0.39 | - | - | - | 0.39 | - | - | - | - |
| Uganda | 0.00 | - | - | - | - | 0.00 | - | - | - |
| South Africa | 0.92 | - | - | - | - | 0.92 | - | - | - |
| Zambia | 0.00 | - | - | - | - | 0.00 | - | - | - |
| Zimbabwe | 0.00 | - | - | - | - | 0.00 | - | - | - |
| Sub-Saharan Africa | 0.44 | - | - | 0.12 | - | 0.32 | - | - | - |
| Southern Africa | 0.35 | - | - | - | - | 0.35 | - | - | - |
| Africa | 15.49 | - | - | 0.18 | 0.50 | 7.97 | 5.97 | 0.88 | - |
| North Africa | 2.31 | - | - | - | 2.31 | - | - | - | - |
| Algeria | 0.59 | - | - | - | 0.59 | - | - | - | - |
| Egypt | 0.32 | - | - | - | 0.32 | - | - | - | - |
| Libya | 0.08 | - | - | - | 0.08 | - | - | - | - |
| Morocco | 0.86 | - | - | - | 0.86 | - | - | - | - |
| Tunisia | 0.47 | - | - | - | 0.47 | - | - | - | - |
| Middle East | 13.46 | - | - | - | 8.88 | 3.60 | 0.98 | - | - |
| Israel | 0.26 | - | - | - | - | - | 0.26 | - | - |
| Iraq | 5.68 | - | - | - | 4.89 | 0.79 | - | - | - |
| Jordan | 3.63 | - | - | - | 2.92 | 0.71 | - | - | - |
| Lebanon | 0.89 | - | - | - | 0.89 | - | - | - | - |
| Syria | 0.18 | - | - | - | 0.18 | - | - | - | - |
| West Bank and Gaza | 0.09 | - | - | - | - | - | 0.09 | - | - |
| Middle East | 2.74 | - | - | - | - | 2.10 | 0.64 | - | - |
| Asia | 30.85 | - | - | 1.43 | 5.88 | 18.44 | 4.22 | 0.88 | - |
| Afghanistan | 0.03 | - | - | - | 0.03 | - | - | - | - |
| Bangladesh | 0.70 | - | - | - | 0.70 | - | - | - | - |
| China | 0.03 | - | - | - | - | 0.03 | - | - | - |
| Indonesia | 0.03 | - | - | - | - | 0.03 | - | - | - |
| Kyrgyzstan | 0.30 | - | - | - | 0.30 | - | - | - | - |
| Cambodia | 0.20 | - | - | - | 0.02 | 0.18 | - | - | - |
| Kazakhstan | 4.05 | - | - | - | 0.30 | 3.75 | - | - | - |
| Laos | 1.81 | - | - | - | - | 1.81 | - | - | - |
| Sri Lanka | 0.03 | - | - | 0.03 | - | - | - | - | - |
| Myanmar | 0.70 | - | - | - | - | - | 0.70 | - | - |
| Mongolia | 0.07 | - | - | - | - | 0.07 | - | - | - |
| Maldives | 0.03 | - | - | 0.03 | - | - | - | - | - |
| Malaysia | 0.63 | - | - | - | 0.01 | 0.61 | - | - | - |
| Nepal | 0.06 | - | - | 0.03 | - | 0.03 | - | - | - |
| Philippines | 1.07 | - | - | - | 0.10 | 0.97 | - | - | - |
| Pakistan | 2.97 | - | - | 0.38 | 2.58 | - | - | - | - |
| Singapore | 0.03 | - | - | - | - | 0.03 | - | - | - |
| Thailand | 0.34 | - | - | - | - | 0.34 | - | - | - |
| Tajikistan | 0.80 | - | - | - | 0.74 | 0.07 | - | - | - |
| Turkmenistan | 0.37 | - | - | - | 0.30 | 0.07 | - | - | - |
| Uzbekistan | 5.35 | - | - | - | 0.30 | 5.05 | - | - | - |
| Vietnam | 0.03 | - | - | - | - | 0.03 | - | - | - |
| Asia | 7.38 | - | - | 0.14 | 0.50 | 3.69 | 2.18 | 0.88 | - |
| Southcentral Asia | 0.70 | - | - | - | - | - | 0.70 | - | - |
| Southeast Asia | 2.85 | - | - | 0.66 | - | 1.70 | 0.50 | - | - |
| South Asia | 0.32 | - | - | 0.18 | - | - | 0.14 | - | - |
| Americas | 31.17 | 3.54 | - | 12.53 | - | 5.08 | 2.26 | 7.76 | - |
| Antigua and Barbuda | 1.05 | 0.75 | - | 0.29 | - | - | - | - | - |
| Argentina | 0.21 | - | - | 0.17 | - | 0.01 | - | 0.04 | - |
| Barbados | 0.80 | 0.59 | - | 0.15 | - | 0.01 | - | 0.06 | - |
| Bolivia | 0.09 | - | - | 0.05 | - | 0.00 | - | 0.04 | - |
| Brazil | 0.32 | - | - | 0.04 | - | 0.24 | - | 0.04 | - |
| Bahamas | 0.26 | 0.13 | - | 0.12 | - | 0.01 | - | - | - |
| Belize | 1.25 | - | - | 0.55 | - | - | - | 0.70 | - |
| Chile | 3.82 | 1.34 | - | 0.06 | - | - | - | 2.42 | - |
| Colombia | 0.68 | - | - | 0.64 | - | 0.01 | - | 0.04 | - |
| Costa Rica | 0.58 | - | - | 0.52 | - | 0.02 | - | 0.04 | - |
| Dominica | 0.11 | - | - | 0.11 | - | - | - | - | - |
| Dominican Republic | 0.34 | - | - | 0.25 | - | - | - | 0.09 | - |
| Ecuador | 0.41 | - | - | 0.37 | - | 0.00 | - | 0.04 | - |
| Grenada | 0.11 | - | - | 0.11 | - | - | - | - | - |
| Guatemala | 0.89 | - | - | 0.61 | - | 0.02 | - | 0.26 | - |
| Guyana | 0.53 | - | - | 0.47 | - | - | - | 0.06 | - |
| Honduras | 0.82 | - | - | 0.62 | - | 0.00 | - | 0.20 | - |
| Haiti | 0.12 | - | - | 0.12 | - | 0.00 | - | - | - |
| Jamaica | 1.46 | - | - | 0.70 | - | 0.01 | - | 0.76 | - |
| Saint Kitts and Nevis | 0.43 | 0.32 | - | 0.11 | - | - | - | - | - |
| Saint Lucia | 0.11 | - | - | 0.11 | - | - | - | - | - |
| Mexico | 2.20 | - | - | 0.57 | - | 0.05 | - | 1.59 | - |
| Panama | 0.95 | - | - | 0.76 | - | 0.10 | - | 0.09 | - |
| Peru | 0.43 | - | - | 0.29 | - | 0.09 | - | 0.04 | - |
| Paraguay | 0.08 | - | - | 0.04 | - | - | - | 0.04 | - |
| Suriname | 0.15 | - | - | 0.09 | - | 0.00 | - | 0.06 | - |
| El Salvador | 0.86 | - | - | 0.57 | - | 0.09 | - | 0.20 | - |
| Trinidad and Tobago | 1.85 | 0.40 | - | 1.38 | - | 0.01 | - | 0.06 | - |
| Uruguay | 0.19 | - | - | 0.15 | - | - | - | 0.04 | - |
| Saint Vincent and the Grenadines | 0.11 | - | - | 0.11 | - | - | - | - | - |
| Americas | 4.65 | - | - | 0.18 | - | 3.57 | 0.02 | 0.88 | - |
| Central America | 0.78 | - | - | 0.74 | - | 0.03 | - | - | - |
| South America | 3.72 | - | - | 0.74 | - | 0.75 | 2.23 | - | - |
| Caribbean | 0.81 | - | - | 0.74 | - | 0.07 | - | - | - |
| Europe | 24.50 | - | - | 0.03 | - | 15.58 | 2.91 | 5.98 | - |
| Slovakia | 1.40 | - | - | - | - | - | - | 1.40 | - |
| Ukraine | 13.49 | - | - | - | - | 12.00 | 1.49 | - | - |
| Hungary | 0.40 | - | - | - | - | - | - | 0.40 | - |
| Poland | 3.30 | - | - | - | - | - | - | 3.30 | - |
| Europe | 5.91 | - | - | 0.03 | - | 3.58 | 1.42 | 0.88 | - |
| Oceania | 4.29 | - | - | - | - | 2.86 | 0.92 | 0.51 | - |
| Oceania | 4.29 | - | - | - | - | 2.86 | 0.92 | 0.51 | - |
| Global/unallocable | 4.32 | - | - | 0.93 | 1.13 | 1.32 | - | 0.03 | 0.91 |
| Total – Other official bilateral flows | 135.70 | 3.54 | 0.04 | 15.22 | 25.36 | 56.80 | 17.79 | 16.04 | 0.91 |
Appendix 3 – Abbreviations
- CFLI
- Canada Fund for Local Initiatives
- CGIAR
- Consultative Group on International Agricultural Research
- DND
- Department of National Defence
- EBRD
- European Bank for Reconstruction and Development
- EDC
- Export Development Canada
- FCM
- Federation of Canadian Municipalities
- GAC
- Global Affairs Canada
- GAVI
- Global Alliance for Vaccines and Immunization (GAVI, the Vaccine Alliance)
- GEF
- Global Environment Facility
- GFATM
- Global Fund to Fight AIDS, Tuberculosis and Malaria
- IAE
- International assistance envelope
- ICRC
- International Committee of the Red Cross
- IDA
- International Development Association
- IDB
- Inter-American Development Bank
- IDRC
- International Development Research Centre
- IFAD
- International Fund for Agricultural Development
- IFI
- International financial institution
- IHA
- International humanitarian assistance
- IMF
- International Monetary Fund
- MDI
- Multilateral development institutions
- MDRI
- Multilateral Debt Relief Initiative
- MNCH
- Maternal, newborn and child health
- NGO
- Non-governmental organization
- ODA
- Official development assistance
- ODAAA
- Official Development Assistance Accountability Act
- OECD-DAC
- Organisation for Economic Co-operation and Development - Development Assistance Committee
- OIF
- International Organization of La Francophonie
- PRGT
- Poverty Reduction and Growth Trust
- PSPC
- Public Services and Procurement Canada
- RCMP
- Royal Canadian Mounted Police
- RTAs
- Regional trade agreements
- SDGs
- Sustainable Development Goals
- SME
- Small and medium-sized enterprises
- WMD
- Weapons of mass destruction
- TOSSD
- Total official support for sustainable development
- UN
- United Nations
- UNAIDS
- Joint United Nations Programme on HIV/AIDS
- UNDP
- United Nations Development Programme
- UNESCO
- United Nations Educational, Scientific and Cultural Organization
- UNHCR
- United Nations High Commissioner for Refugees
- UNICEF
- United Nations Children’s Fund
- WFP
- World Food Programme
- WTO
- World Trade Organization
Appendix 4 - Glossary
- Administrative costs (see also operations and management)
- In 1979, OECD-DAC members agreed that ODA figures should include the administrative costs of extending assistance. The inclusion of administrative cost data was intended to improve the comparability of total ODA figures among donor countries.
- Anti-Crime Capacity Building Program (ACCBP)
- The ACCBP improves the capacity of beneficiary states to prevent and respond to threats posed by transnational organized criminal activity throughout the hemisphere, thereby contributing to the full range of Canada’s interests in the Americas. The ACCBP Human Smuggling Envelope is administered by the ACCBP to respond specifically to the global threat posed to Canada by human smuggling ventures abroad.
- Assessed contributions
- Assessed contributions are payments made by the federal government as a result of Canada’s membership in an international organization. To maintain its status in good standing, Canada is required to provide its share of the total operations costs.
- Bilateral assistance (as opposed to multilateral assistance)
- Bilateral assistance is the disbursement of funds where the donor earmarks or controls the funds by specifying the recipient and/or other aspects of the initiative. Bilateral assistance can be undertaken:
- by a donor country directly with a developing country
- with national and international non-governmental organizations (NGOs) active in development and other interal development-related transactions such as interest subsidies, spending on promotion of development awareness, debt reorganization and administrative costs
- with a multilateral organization when the donor effectively controls the disposal of the funds by specifying the recipient or other aspects of the disbursement
Table A shows the breakdown of Canada’s bilateral and multilateral assistance by source and by channel.
Table D2 shows the breakdown of Canada’s bilateral assistance by recipient. - Canada Fund for Local Initiatives (CFLI)
- The CFLI is a contributions program administered at Canadian missions abroad, that is used to advance Canadian interests and priorities in a targeted and flexible manner. It occupies a unique niche: distinct, yet complementary to other Global Affairs Canada programming (i.e. development, security, democracy, humanitarian responses). The CFLI funds small-scale, locally-developed projects of up to $50,000, worth $25,000 on average.
- Channel
- In the context of this report and international development statistics, the term “channel” is used to distinguish between bilateral and multilateral assistance (see definitions for bilateral assistance and multilateral assistance).
- Civil society (as opposed to government institutions or private sector institutions)
- In this report, civil society includes:
- Canadian not-for-profit organizations that have a legal personality in Canada, including NGOs, international NGOs, volunteer cooperation agencies, cooperatives, unions and federations, faith-based organizations, professional associations, educational and policy research institutes
- regional, national and local institutions, not-for-profit organizations and agencies from developing countries and territories that have a legal personality
- international not-for-profit organizations that have a legal personality in the country in which their headquarters are located
To be considered international, an organization must have an international membership and management, and its governing body must be elected regularly on an international basis.
See Table C1. - Cost of refugees
- Refers to refugee-related costs incurred during refugees’ first year in a donor country. It includes the estimated expenditures to bring refugees to a donor country and the costs associated with food, shelter and training. The methodology used is consistent with OECD-DAC directives.
Note that only costs covered by the federal government are considered ODA under the Official Development Assistance Accountability Act. See “About this report” at the beginning of this document.
See definition of ‘‘ODA-eligible imputed costs.’’ - Counter-Terrorism Capacity Building Program (CTCBP)
- The CTCBP improves the capacity of beneficiary states to prevent and respond to threats posed by terrorist activity through the provision of training, equipment, and technical and legal assistance.
- Country programs
(as opposed to regional programs) - Country programs are presented in Tables D1 and D2 and cover a broad range of activities. These include programs carried out directly with government organizations, including with direct budget support. Funds are also managed through an executing agent, or local or international NGOs or institutions, depending on program delivery and the specific conditions and agreements reached with the recipient country.
- Developmental food assistance
- The term refers to the supply of edible human food under national or international programs, including transportation costs, cash payments made for food supplies, project food assistance and food assistance for market sales, excluding emergency food assistance. See definition of ‘‘emergency food assistance.’’
An example of developmental food assistance is the World Food Programme’s School Feeding Program. School meals encourage hungry children to attend school and help them concentrate on their studies. - Disaster prevention and preparedness
- Refers to a specific set of humanitarian assistance activities that support disaster risk reduction (e.g. developing knowledge, natural-risk cartography, legal norms for construction); early warning systems; and emergency contingency stocks and contingency planning, including preparations for forced displacement.
- Emergency food assistance
- This refers to a specific set of humanitarian assistance activities, including general free distribution or special supplementary feeding programs providing short-term relief to targeted population groups affected by emergency situations. The term excludes non-emergency food security assistance programs/food assistance. See ‘‘developmental food assistance.’’
- Expenditures
- The term “expenditures” includes:
- amounts spent (e.g. transfer payment in the form of a grant or contribution)
- capital subscriptions or advances to an international financial institution in the form of a note issuance
- estimated ODA-eligible cost (e.g. a cost for refugees in Canada) - Export Development Canada (EDC)
- Canada reports as ODA concessional credits that it grants through the Export Development Corporation under Section 23 of the Export Development Canada Act. These concessional credits, meeting approved development criteria, are not, however, considered part of the regular assistance program budget (i.e. international assistance envelope).
Since 2014-15, the Statistical Report has been prepared on an expenditures basis and the loan repayments for previous ODA loans are no longer netted out of the totals. - Federation of Canadian Municipalities (FCM)
- Any ODA expenditures are reported by the FCM on behalf of its members. Members of the FCM include Canada’s largest cities, small urban and rural communities, and 17 major provincial and territorial municipal associations.
- Department of Finance Canada
- This refers to ODA flows reported by the Department of Finance Canada, which is responsible for delivering a major portion of Canada’s ODA including debt relief, that is, debt reorganization that relieves the overall burden of debt in partner countries. The Department of Finance also takes the lead in managing Canada’s relationship with the World Bank Group. The funding to the World Bank’s International Development Association and to the International Monetary Fund is reported to Parliament through the Department of Finance’s Main Estimates.
Since 2020-21, the Department of Finance Canada no longer reports contributions to the Heavily Indebted Poor Countries Initiative. These are now reported by Export Development Canada. - FinDev Canada
- A development finance institution that offers financial solutions to businesses in developing countries, with the potential to positively impact market development, empower women and mitigate climate change.
- Fiscal year
- This report is prepared on the fiscal-year basis adopted by the Government of Canada. The fiscal year begins April 1 and ends March 31.
- General budget support
- This refers to a particular category defined by the OECD-DAC as unearmarked contributions to the government budget, support for the implementation of macroeconomic reforms (structural adjustment programs, poverty reduction strategies) and general program assistance (when not allocable by sector).
- Geographic programs
- Global Affairs Canada delivers most of its bilateral assistance through country programs (see “Country programs”) or regional programs (see ‘‘Regional programs”), managed by the department’s Geographic Programs.
- Global Affairs Canada
- Under this department, Canada continues to advance its priorities abroad by undertaking diplomacy and programming in support of international peace and security, democracy, human rights and the rule of law. The development side of Global Affairs Canada remains dedicated to delivering tangible results for those most in need in the developing world, and the department continues to provide whole-of-government coordination in response to international crises and natural disasters.
- Global Issues and Development
- This Global Affairs Canada branch manages the development aspects of Canada’s relations with multilateral organizations, provides financial support for these organizations, and helps determine their policies and programs throughout the world.
Global Issues and Development delivers bilateral and multilateral assistance. See related definitions of ‘‘bilateral assistance’’ and ‘‘multilateral assistance.’’ - Global Partnership Program
- This is the main mechanism through which Canada supports international efforts through concrete projects to prevent the proliferation of weapons and materials of mass destruction and their potential use by terrorists.
- Global Peace and Security Program
- This program responds to increasing international demand for Canadian support and involvement in complex crises, including conflicts and natural disasters, and coordinates whole-of-government engagements in fragile and conflict-affected states. The program also integrates policy, operations, coordination and programming to provide agile, timely and responsive programming to further advance the government’s priorities in the important area of peace and security.
- Humanitarian assistance
- Humanitarian assistance is defined as assistance designed to save lives, alleviate suffering, and maintain and protect human dignity during emergencies and in their aftermath. Humanitarian assistance is delivered in a manner that is consistent with the principles of humanity, impartiality, neutrality and independence.
Humanitarian assistance includes:
- disaster prevention and preparedness
- the provision of shelter, food, water, sanitation and health services, and other items of assistance for the benefit of
affected people, and to facilitate the return to normal lives and livelihoods
- measures to promote and protect the safety, welfare and dignity of civilians and those no longer taking part in hostilities
- rehabilitation, reconstruction and transition assistance while the emergency situation persists - Imputed foreign student costs
- This refers to the cost of educating foreign students from ODA-eligible countries in Canada. It excludes tuition fees paid by foreign students or their sponsors. See definition of ‘‘ODA-eligible imputed costs.’’
- International assistance
- Canada’s international assistance includes all financial resources provided by Canadian governments (federal, provincial, territorial or municipal) to support economic, environmental, social and political development in other (primarily developing) countries.
See section “Understanding the report” for more information. - International assistance envelope (IAE)
- The international assistance envelope is a dedicated, whole-of-government pool of resources for international assistance. It funds the majority of Canada’s international assistance. Most of the activities funded by the IAE qualify as ODA and comply with the requirements of Canada’s Official Development Assistance Accountability Act. Non-ODA eligible activities funded by the international assistance envelope include, for example, security, conflict prevention, stabilization and peacebuilding initiatives that do not meet ODA eligibility due to country eligibility or activity type.
- International Business Development and Innovation
- This Global Affairs Canada branch supports private sector engagement and the management and administration of several international scholarship opportunities for Canadians and foreign students.
- International Development Association (IDA)
- The IDA is the part of the World Bank that helps the world’s poorest countries. The IDA is funded largely by contributions from the governments of its developed member countries. The IDA lends money (known as credits) on concessional terms. This means that IDA credits have no interest charge, and repayments are stretched out over 35 to 40 years, including a 10-year grace period. The IDA also provides grants to countries at risk of debt distress.
Canadian funding to IDA is managed by the Department of Finance Canada. - International Development Research Centre (IDRC)
- The IDRC is a Canadian Crown corporation funded through the IAE that invests in knowledge, innovation and solutions to improve lives and livelihoods in the developing world.
- International financial institution (IFI)
- IFIs are financial institutions that have been established (or chartered) by more than 1 country and are therefore subject to international law. Their owners or shareholders are generally national governments, although other international institutions and other organizations occasionally figure as shareholders. The most prominent IFIs are creations of multiple nations, although some bilateral financial institutions (created by 2 countries) exist and are technically IFIs. Many of these are multilateral development banks. The best-known IFIs are the World Bank, the International Monetary Fund and regional development banks.
- International Humanitarian Assistance Bureau
- This Global Affairs Canada bureau responds to funding requests from multilateral humanitarian organizations such as the United Nations World Food Programme, UNICEF and other experienced humanitarian partners, including the International Red Cross and Red Crescent Movement and NGOs, except in the West Bank and Gaza, where the country program also provides humanitarian assistance.
Refer to Table B2 for a detailed summary of Canada’s international humanitarian assistance. - International Scholarship Program
- This program attracts international students and researchers to Canada by offering scholarships to Canadian and foreign students and by promoting government-funded awards.
- International Security and Crisis Response
- This Global Affairs Canada branch is responsible for coordinating Canadian peace and security objectives.
- Loan repayments
- In this report, the term “loan repayments” refers to repayments to Canada of development-related loans by developing countries, whether the loans were issued by Global Affairs Canada or other departments. A detailed breakdown by country/organization is available in appendices 1 and 2.
“Bilateral loans” – refers to repayments of loans granted by Global Affairs Canada to developing countries prior to 1986.
“Multilateral loans” – refers to repayments of loans granted by Global Affairs Canada to the Andean Development Corporation, the African Development Bank and the Inter-American Development Bank. - Long-term institutional support
- Long-term institutional support, also known as core funding, is the business delivery model that allows the Government of Canada to provide financial support to entities (organizations, institutions or recipient countries) whose actions achieve development results that reflect the Government of Canada’s goals and objectives.
In accordance with international standards, this reports counts long-term institutional support to multilateral organizations as multilateral assistance, while long-term institutional support to NGOs is counted as bilateral assistance. In addition, long-term institutional support to multilateral institutions includes the ODA portion of assessed contributions. See definition of ‘‘assessed contributions.’’ - Material relief assistance and services
- In Table B2, this refers to a specific set of humanitarian assistance activities:
- the provision of shelter, water, sanitation and health services
- the supply of medicines and other non-food relief items
- assistance other than for food or protection to refugees and internally displaced people in developing countries. - Mobilized private finance
- Mobilized private finance refers to the participation of the private sector in sustainable development projects. Official actors such as Canada can attract private investment in developing countries by mitigating risk and improving the enabling environment. The financial engagement of the private sector in a particular project is “mobilized” because of Canada’s involvement to make the project financially viable.
- Multilateral assistance
(as opposed to bilateral
assistance), also known as long-term institutional support
to multilateral
organizations - Multilateral assistance is funding provided to a multilateral institution that:
- conducts all or part of its activities in favour of development
- is an international agency, institution or organization whose members are governments, or a fund managed autonomously
- pools contributions so that they become an integral part of the financial assets
In this report, the term ‘‘multilateral assistance’’ includes both ODA and non-ODA elements.
To estimate/impute the portion of assistance going through multilateral organizations to developing countries, the OECD has developed a series of coefficients based on the flow of resources (on a calendar-year basis) disbursed by the organizations in the developing countries. This set of coefficients is used, in part, to estimate the disbursements shown in Table D3.
It is important to note that any methodology for imputing multilateral flows will always be an approximation. Multilateral flows in a given year are not exactly imputable to donors’ contributions in that year, no matter what methodology is used. Among the reasons for this are:
- General approximations and timing. The estimated country and sector amounts are counted when the government makes the payment to the organization and are based on the totality of the program, rather than when the payment is used by the ultimate recipient. Donors’ contributions to multilateral institutions are reportable in the year they are paid. Many trust funds aim to catalyze additional funding from other investors and donors. Such funds typically need to reach a certain funding threshold before disbursements begin, sometime after Canada’s contribution.
- Limits of data on multilateral outflows. While several multilateral agencies report to the OECD on the use of their funding (by country, by sector, etc.), some do not. Therefore, the country and sector breakdowns of multilateral organizations are estimated using others sources, such as annual reports.
- Grants to lending institutions. Some institutions lend rather than grant funds. Their lending in any one year may be much greater than donors’ contributions, since it also draws on reflows of principal, interest receipts and transfers of funds within the institution. - Multilateral organizations
- The OECD-DAC defines multilateral organizations as international institutions with governmental membership that conduct all, or a significant part of, their activities in favour of development and assistance to recipient countries. They include multilateral development banks (e.g. the World Bank and regional development banks), United Nations agencies, international public-private partnerships, and regional groupings (e.g. certain European Union organizations).
- National Defence
- This refers to ODA-eligible contributions from the Department of National Defence, such as the provision of humanitarian relief supplies. Military-type interventions (for example, bilateral peacekeeping missions) and other activities that are not development-focused are not included in this report.
- ODA-eligible imputed costs
- This describes a cost category that is eligible for ODA status under the OECD-DAC guidelines, but with no actual expenditure data readily available. Instead, an estimate is produced based on a statistical model and/or professional judgement. This includes the cost of refugees (first year), imputed foreign student costs, services provided without charge by other government departments and imputed interest on advance payments, for which definitions can be found in this glossary. The Policy on Transfer Payments no longer requires departments to report the imputed interest costs on advance payments and therefore these costs no longer appear in the Statistical Report.
- Office of Human Rights, Freedoms and Inclusions
- The Office of Human Rights, Freedoms and Inclusion supports religious communities that are facing intolerance or persecution in their country through projects in 4 areas: education on freedom of religion and pluralism; research and monitoring; interreligious dialogue; and legal and legislative support.
- Official bilateral debt relief
- Official bilateral debt relief refers to debt-service relief negotiated through multilateral forums such as the Paris Club. The transfer of funds, administered by the Department of Finance Canada, is considered ODA-eligible.
- Official development assistance (ODA)
- Official development assistance (ODA) represents the vast majority of Canada’s international assistance. Canada accepts 2 definitions of ODA:
1. As defined by the Development Assistance Committee (DAC) of the Organisation for Economic Co-operation and Development, ODA refers to flows to countries and territories on the DAC list of ODA recipients and to multilateral institutions. Funding must be provided by official agencies, including state and local governments, or by their executive agencies. Each transaction must be administered with the promotion of the economic development and welfare of developing countries as its main objective and/or be concessional in character.
2. The term "ODA," as defined by Canada’s Official Development Assistance Accountability Act (ODAAA), is used in Government of Canada publications. Canada’s ODAAA spending is compatible with the OECD-DAC
definition above but is only applicable to federal entities and, in addition, must meet the 3 criteria set out in subsection 4.1 of the Act: a) contribute to poverty reduction, b) take into account the perspectives of the poor, and c) be consistent with international human rights standards. International assistance to alleviate the effects of a disaster or other emergencies is also counted as ODA under the Act. - Operations and management (see also Administrative costs)
- In this report, the term "operations and management costs" refer to those directly incurred by the donor agency to cover the day-to-day costs of extending international assistance.
- Other official assistance (also known as non-ODA)
- This refers to activities that do not meet the conditions for eligibility as official development assistance because they are not primarily aimed at development (e.g. counter-terrorism capacity building, military observers). On the other hand, incremental costs incurred for the use of a donor’s military equipment to deliver humanitarian assistance or perform development services are ODA-eligible (e.g., emergency assistance by the Disaster Assistance Response Team). Activities outside the IAE that are not ODA-eligible are considered out of the scope of this report and hence not reported (e.g. military-related training, supply of military equipment and services to peacekeeping missions, and the forgiveness of debts incurred for military purposes).
- Partnerships for Development Innovation
- This Global Affairs Canada branch provides opportunities for Canadians to engage in international development and contributes to initiatives designed and delivered predominantly by Canadian civil society organizations; the private sector; colleges, universities and research entities; and provincial and regional councils and foundations. The branch facilitates knowledge exchange across the department and with civil society and international partners to advance innovative approaches to international development.
- Payables at year-end
- The recording against the current fiscal year of liabilities incurred but which have not been paid by the end of the accounting period.
- Program assistance
- This term refers to international assistance spending by Global Affairs Canada’s assistance programs, excluding operations and management costs, and changes in the value of investments in IFIs.
- Regional development banks
- These are international financial institutions (IFIs) that are owned and operated by member nations. They are designed to extend development loans and provide other assistance to member nations. The world’s 5 regional development banks are the African Development Bank Group, Asian Development Bank, European Bank for Reconstruction and Development, Caribbean Development Bank and Inter-American Development Bank.
- Regional programs
- Refers to regional programs managed by Global Affairs Canada’s Geographic Programs Bureau (see above) that address the regional issues countries face together. In Tables D1 and D2, these programs are reported separately from country programs. See ’’Country programs’’ above.
- Repayable contributions
- A contribution provided to a recipient institution for investment purposes, with the expectation of long-term reflows at conditions specified in the financing agreement. The provider assumes the risk of total or partial failure of the investment.
- Royal Canadian Mounted Police (RCMP)
- This refers to ODA disbursements made by the RCMP for bilateral programs aimed at post-conflict peacebuilding and security system management and reform.
- Sector codes (Table B1)
- Sector codes are used to describe the purpose of assistance. The list of sectors is compiled by the OECD-DAC. From time to time, modifications are made with the approval of donor countries. The OECD-DAC sector classification contains the following broad categories:
- social infrastructure and services – covering the sectors of education, health, population, water, government and civil society
- economic infrastructure and services – covering transport, communications, energy, banking and finance, and business services
- production – covering agriculture, forestry, fishing, industry, mining, construction, trade and tourism
- multi-sector – covering, for example, general environmental protection; other multi-sector assistance, including urban and rural development; and non-sector allocable assistance for contributions not susceptible to allocation by sector, such as general budget support, actions relating to debt, humanitarian assistance, and internal transactions in the donor country.
The sector identifies the specific area of the recipient’s economic or social structure the contribution is intended to foster. The sector classification does not refer to the type of goods or services provided. - Services provided without charge by other departments
- This refers to costs incurred by other departments for accommodation, legal and cheque-issuing services rendered to Global Affairs Canada. See "ODA-eligible imputed costs" above.
- Services rendered abroad
- These are common services provided to Canada-based and locally engaged Global Affairs Canada personnel at Canada’s diplomatic and consular missions abroad. These funds help to facilitate the presence of development officers in the field and support the implementation of international assistance projects.
- Strategic Policy and Summits
- This Global Affairs Canada branch represents Canada at international forums and ensures that international commitments are reflected in Canadian development policies.
- Sustainable Development Goals (SDGs)
- In September 2015, Canada and 192 other UN member states adopted the 2030 Agenda for Sustainable Development. The 2030 Agenda is a 15-year global framework centred on an ambitious set of 17 Sustainable Development Goals (SDGs), 169 targets and over 230 indicators. The 2030 Agenda envisions a secure world free of poverty and hunger, with full and productive employment, access to quality education and universal health coverage, the achievement of gender equality and the empowerment of all women and girls, and an end to environmental degradation.
The 2030 Agenda is a global framework of action for people, the planet, prosperity, peace and partnership. It integrates social, economic and environmental dimensions of sustainable development, as well as peace, governance and justice elements. It is universal in nature, meaning that developing and developed countries alike will implement the Agenda. Furthermore, the Agenda includes an overarching principle of ensuring that no one is left behind in the achievement of the SDGs.
Canada’s international assistance projects can support multiple SDGs at the same time. - Total official support for sustainable development (TOSSD)
- TOSSD is a new international statistical framework for monitoring official resources and private finance mobilized by official interventions in support of sustainable development. It encompasses all officially supported resource flows to promote sustainable development in developing countries, and to support development enablers and address global challenges at regional or global levels. As such, it includes almost all reported ODA. TOSSD also includes private resources mobilized by the official sector (e.g. through public-private partnerships).
- Unallocable or non-allocable assistance (as opposed to allocable assistance)
- When assistance disbursements cannot be assigned by country or sector (e.g. costs of refugees in Canada), the disbursement is referred to as unallocable or non-allocable.
- Date modified: