
This is a past issue of the State of Trade. For the latest report, please visit Canada’s State of Trade reports.
State of Trade 2022: The Benefits of Free Trade Agreements
ISSN 2562-8321
Table of contents
- Message from the Minister
- Executive summary
- Part 1: 2021 in review
- Part 2: The benefits of free trade agreements
- Bibliography
Message from the Minister
I'd like to introduce the 2022 State of Trade on behalf of the Government of Canada.
This report highlights Canada's robust trade and investment recovery, which has displayed remarkable resilience during another challenging year. This year's report focuses on free trade agreements, which will continue to be vital tools for Canadian businesses as they enter this new phase of the post-pandemic recovery.
Last year was incredibly important for Canadians—it was a year of economic recovery amid a global pandemic. Businesses faced tremendous challenges, ranging from interrupted production and supply chain disruptions to rapid shifts in demand and elevated commodity prices. Despite significant challenges, Canada's two-way trade in goods and services rose 14.1% in 2021 to reach a new record high of $1.5 trillion; this is a testament to the adaptability and resilience of Canadian businesses, workers and entrepreneurs.
The scale of the government's emergency economic support helped to foster this strong recovery and enabled Canadians and businesses to better weather the pandemic. Budget 2022 pledged historic investments—in people, in the green transition and in innovation and productivity—to create jobs and prosperity and build a more robust economic future to support a stable and complete recovery.
Canada's free trade agreements (FTAs) are integral to solid business recovery. Canada is committed to enhancing this network by negotiating new FTAs with high-potential partners. FTAs support economic growth, open doors internationally, and facilitate the development of diversified and resilient supply chains. They also support the rules-based multilateral trading system. They have helped to keep markets open to allow access to food and medical supplies amid the unprecedented challenges of the past two years.
This year's State of Trade report details the impacts that FTAs have had on our economy—including their effects on exporters, workers, sustainability, and inclusiveness. Canada actively implements trade policies that maintain access to foreign markets for Canadian commerce while maximizing trade benefits for all Canadians.
Canada is the only G7 economy with comprehensive free trade access to the entire G7 and European Union. Canada's 15 FTAs cover 61% of the world's GDP and open markets to 1.5 billion consumers worldwide. However, we recognize that opening doors is the first step in succeeding abroad. Our job is to help businesses take those next steps: from the Trade Commissioner Service to Export Development Canada, Canada's toolkit helps Canadian businesses start up, scale up, and access new markets.
As we move into the subsequent recovery phase, Canadian businesses and exporters will need to be as nimble as ever. I am confident that they are up to the challenge.
-The Honourable Mary Ng, Minister of International Trade, Export Promotion, Small Business and Economic Development
Executive summary
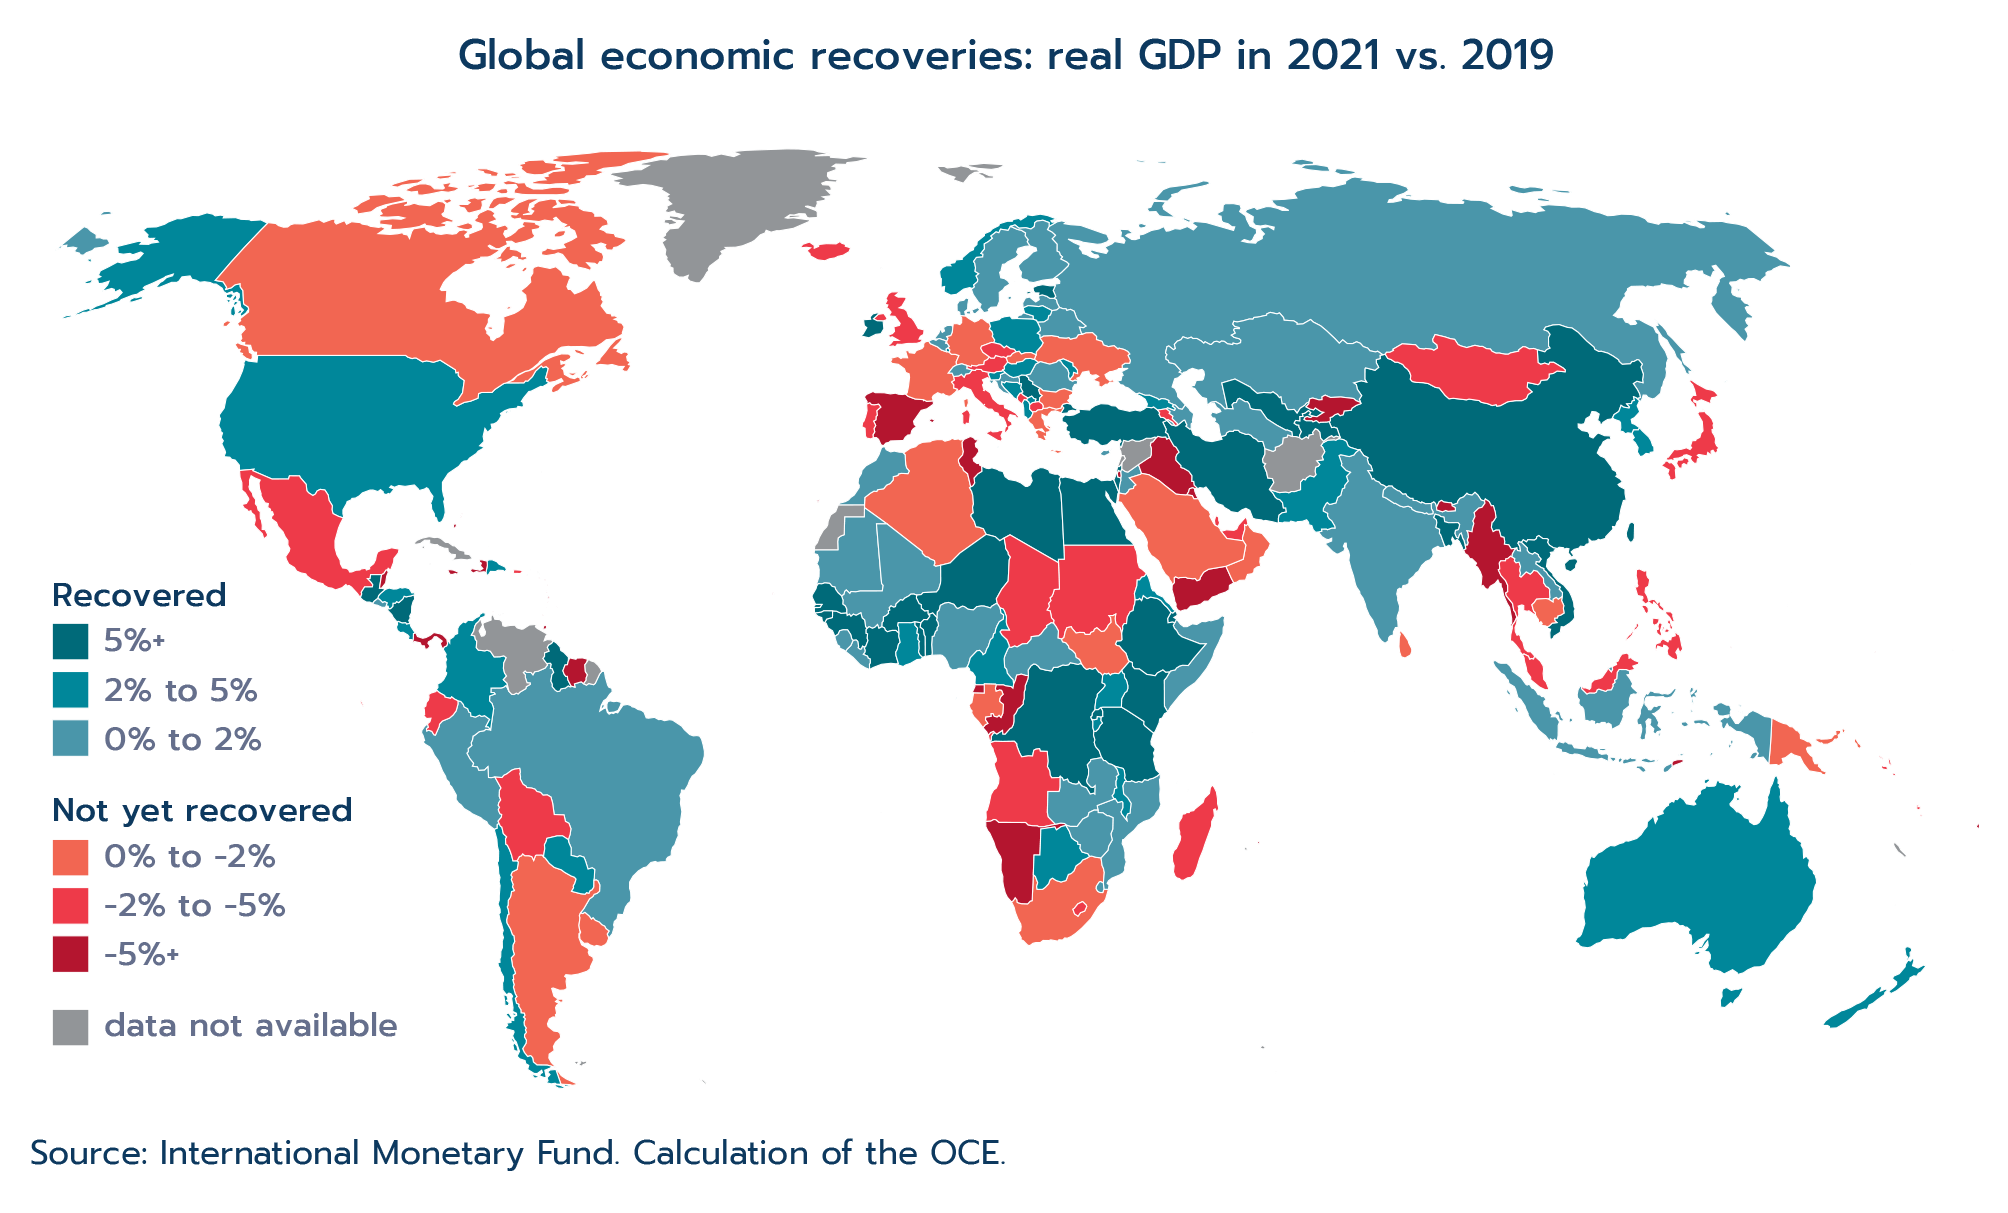
Canada is experiencing an economic recovery while still contending with a global pandemic. The world faced numerous challenges throughout 2021, including multiple waves of COVID-19, pandemic-induced supply chain disruptions and travel restrictions, and uneven vaccine access. Yet global GDP grew 6.1% in 2021 on the heels of a 3.1% contraction in 2020, as economies continued to reopen and production got back on track. However, beneath the surface of this strong growth, many countries struggled to recover from 2020 lows, and economic activity in almost half of all countries was actually lower in 2021 compared to their pre-pandemic 2019 levels.
Canada is also among that group, with last year's GDP coming in 0.9% below 2019 levels, even though Canada actually fared quite well relative to other advanced economies. The only G7 country that was further along in its recovery path was the U.S., with its economic activity 2.1% above 2019 levels. Canada had a strong labour market recovery, with an unemployment rate of only 6.0% by year-end. Many sectors such as finance, real estate, and retail trade thrived, while others, namely those in arts and recreation, accommodation and food struggled due largely to the effects of the pandemic and tight labour markets. Overall, the Canadian economy expanded 4.5% in 2021, following a 5.2% decline the year before.
The surge in activity south of Canada's border helped to drive record-breaking growth in Canadian trade. In 2021, exports of goods and services expanded 18.3% to reach a record high of $766 billion—driven largely by surging natural resources prices, but also from broad-based demand for a multitude of products, from consumer electronics to professional and financial services. Imports of goods and services surged 10.2% to $764 billion on the strength of pharmaceutical and medicinal products as well as imports of a variety of manufactured products. Canada's trade in goods overall enjoyed strong demand in 2021, while services overall had only begun to recover from the pandemic's devastating hit.
Unsurprisingly, Canada's robust trade can largely be credited to the U.S.'s strong economic recovery. Canada's exports of goods and services to the U.S. ballooned by 23.9% (reaching a record $550 billion), and imports grew 9.7% (to $463 billion). Much of this export growth was driven by demand for Canadian natural resources (especially energy products), as well as commercial services. Canada's trade with other countries also experienced notable growth, particularly in exports of goods, which expanded 21.9% overall, with positive growth in 8 out of Canada's top 10 trade partners. Meanwhile, services exports grew only 3.3% overall in 2021 with the recovery only gaining momentum toward the end of the year following the devastating 15.9% drop in 2020.
There was a solid recovery in both Canadian direct investment abroad (CDIA) and inward foreign direct investment (FDI) in 2021, as investment flows increased around the world. Unlike the slow recovery following the 2007-08 global financial crisis, investment flows rebounded quickly in 2021, with both CDIA and FDI surpassing their pre-pandemic levels.
Looking ahead, Canadian companies will continue to face headwinds. Russia's invasion of Ukraine injected fresh uncertainty, exacerbating already high inflation and putting additional pressure on supply chains. An important tool to support Canada's economic recovery is its vast network of free trade agreements (FTAs) that covers 61% of the world's GDP in 51 countries and opens doors to 1.5 billion consumers. This State of Trade report features Canada's FTAs and the benefits they bring to Canadians.
The merits of free trade are well known and include innovation, economies of scale, market competition, and increased access to products, to name a few. This report examines the impacts of FTAs after they have been put in place and the lessons learned from these past experiences.
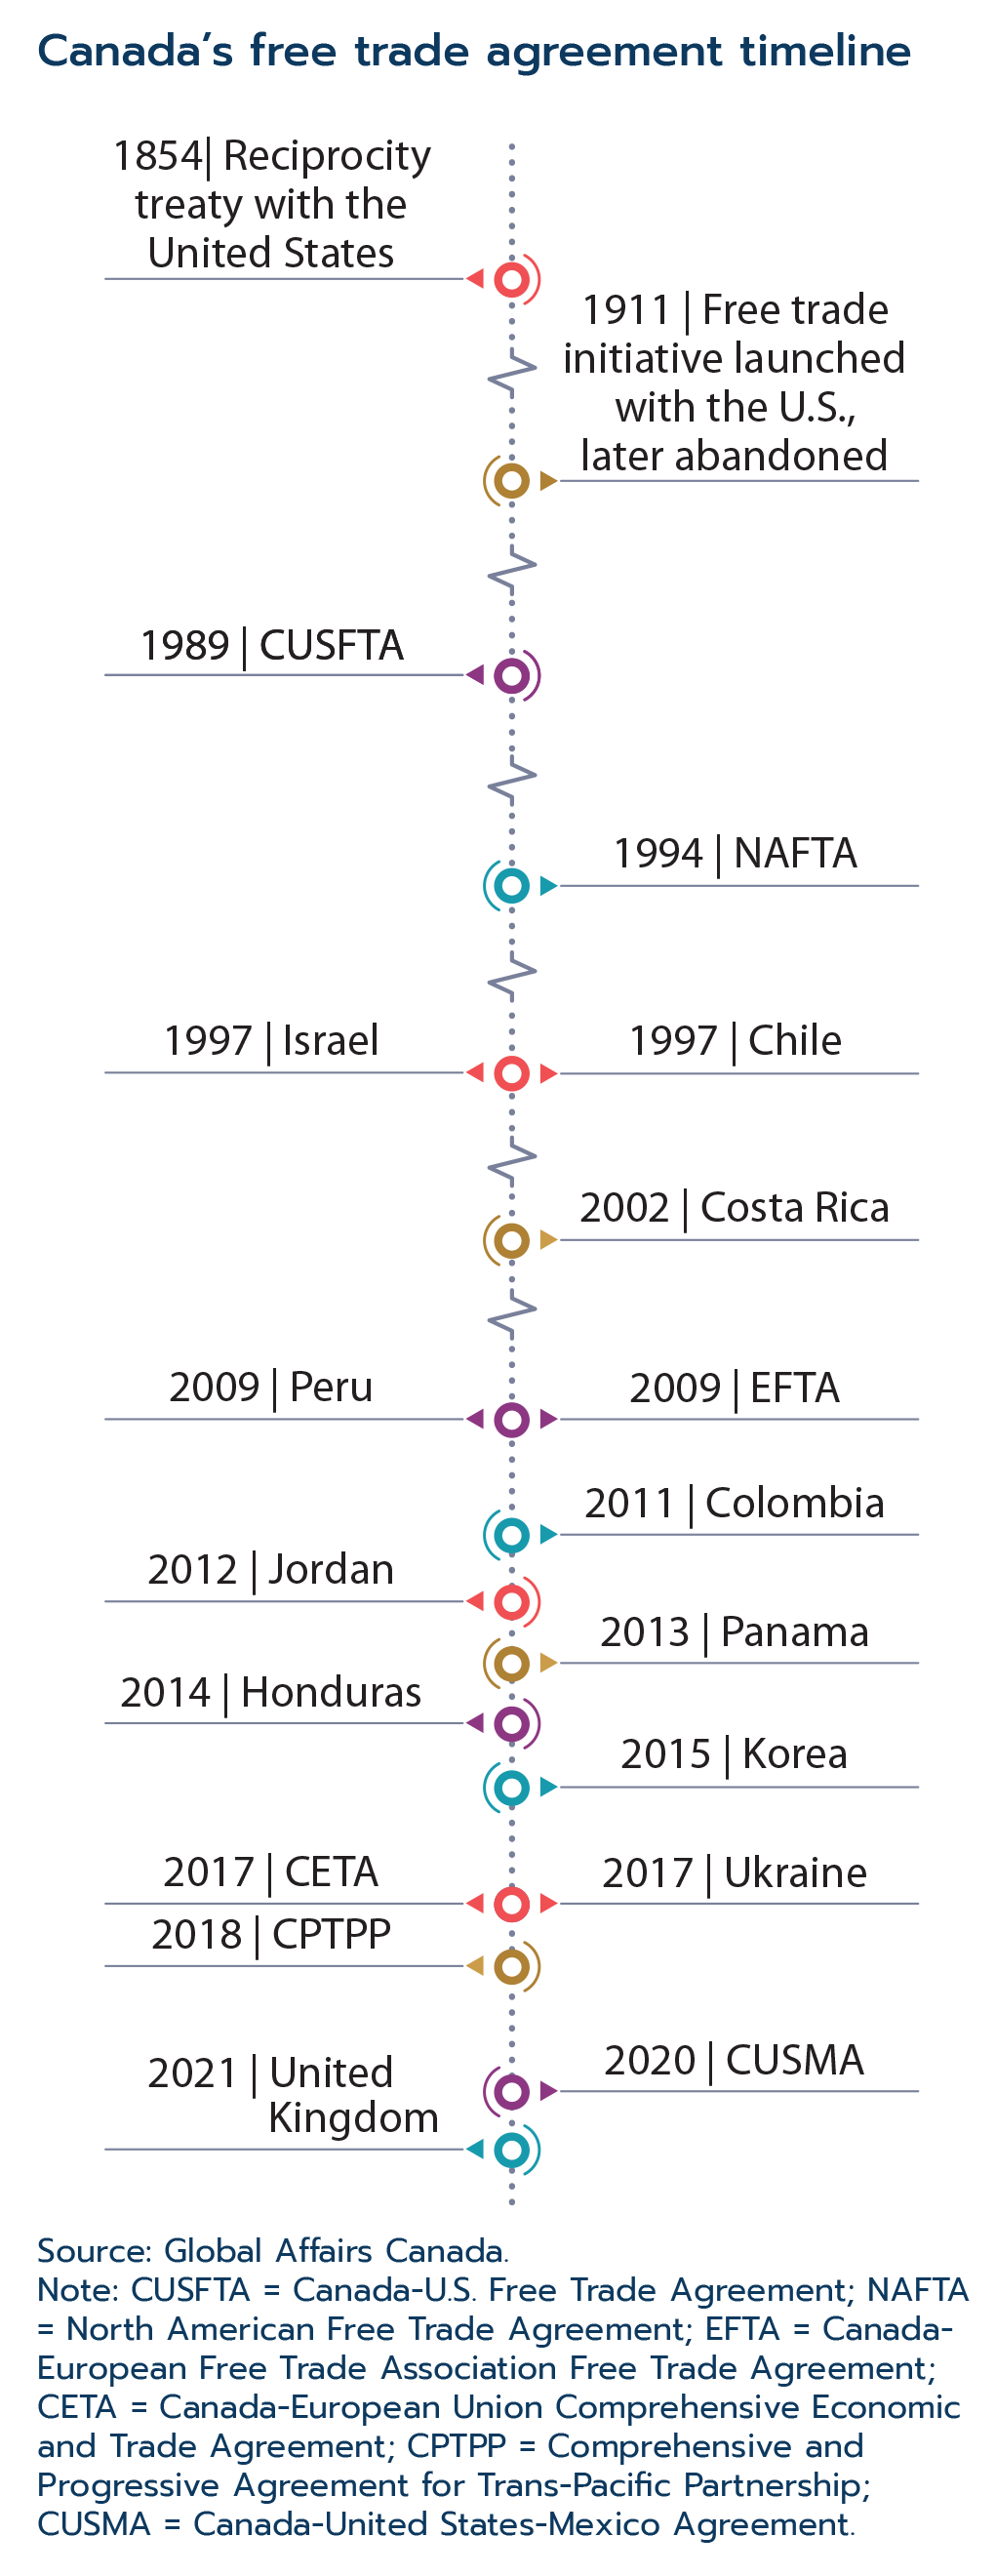
Canada’s embrace of free trade dates back to the 1850s and 1860s, when Canada was part of British North America. However, all 15 of Canada’s current FTAs were put in place during the last 25 years.
Text version - Canada's free trade agreement timeline
A graphic depicts a timeline that starts at 1850 and runs until 2021. The years that Canada’s FTAs came into force are indicated along the timeline.
Canada's free trade agreement timeline
| Year | FTA put into force |
|---|---|
| 1854 | Reciprocity treaty with the United States |
| 1911 | Free trade initiative launched with the U.S., later abandoned |
| 1989 | CUSFTA |
| 1994 | NAFTA |
| 1997 | Israel |
| 1997 | Chile |
| 2002 | Costa Rica |
| 2009 | Peru |
| 2009 | EFTA |
| 2011 | Colombia |
| 2012 | Jordan |
| 2013 | Panama |
| 2014 | Honduras |
| 2015 | Korea |
| 2017 | CETA |
| 2017 | Ukraine |
| 2018 | CPTPP |
| 2020 | CUSMA |
| 2021 | United Kingdom |
Source: Global Affairs Canada.
Note: CUSFTA = Canada-U.S. Free Trade Agreement; NAFTA = North American Free Trade Agreement; EFTA = Canada-European Free Trade Association Free Trade Agreement; CETA = Canada-European Union Comprehensive Economic and Trade Agreement; CPTPP = Comprehensive and Progressive Agreement for Trans-Pacific Partnership; CUSMA = Canada-United States-Mexico Agreement.
The raison d’être of FTAs is to augment trade among signatories to enhance the well-being of society in the long run. Bilateral trade more than doubled in the 10 years following the entry into force of Canada’s FTAs that were signed before 2010 (with the exception of Canada’s FTA with Peru). Moreover, Canadian companies tended to increase their use of tariff preferences in the years following implementation of FTAs. Our analysis of the 1997 Canada-Chile FTA established a causal link determining that the FTA increased bilateral trade 12.2% faster than would have been the case in the absence of the agreement. A similar analysis found that bilateral trade with Colombia increased on average 5.8% to 7.0% faster than it would have in the absence of the Canada-Colombia FTA signed in 2011.
While increased trade is the immediate objective of FTAs, the ultimate objective is to enhance the overall well-being—or welfare—of society. This welfare benefit is measured through producer and consumer gains; the analysis is important because FTAs do not guarantee an optimal welfare outcome. Producers can benefit from efficiency gains; for example, the labour productivity of Canadian manufacturing plants increased following the 1989 Canada-United States FTA, and exporting firms were on average more productive than non-exporting firms following the FTA. Meanwhile, consumers benefit from an increased variety of products at lower prices.
Free trade might boost national welfare on the whole, but there is no guarantee that all people will be better off. Therefore, trade agreements need to be appropriately designed to ensure that all segments of society can benefit from the opportunities that flow from free trade. Research regarding the effects of China’s accession to the World Trade Organization has demonstrated that the adjustment can be quite slow and painful for many workers; however, it’s important to recognize the consumer benefits that stem from the increased access as well as increased export opportunities.
Increased trade between developed countries has been found to have a limited impact on labour market outcomes. In the context of the 1989 Canada-United States FTA, there was no evidence that workers were permanently pushed out of the labour force, even in industries with significant tariff reductions; there were high levels of re-employment in other manufacturing industries or even other firms within the same industry. Perhaps more importantly, decreases in income in the short run were offset by higher earnings in the longer term.
With tariffs around the world now at near historical lows, there are other commitments that are gaining prominence in FTAs. These include commitments to reduce red tape, increase predictability in regulatory requirements, and commitments to broader goals such as addressing environmental issues and protecting human rights. Early evidence points to FTAs being effective at lowering these trade barriers and the overall costs of trade. Additionally, the design of FTAs can contribute to reducing the export of environmentally harmful goods and to increasing so-called “green” goods, particularly for developing countries.
FTAs can also have wider impacts on diplomatic relations, security and governance. In fact, FTAs are closely tied to increases in other types of agreements, including those on investment, infrastructure and transportation, and have even resulted in common voting patterns at the United Nations. Moreover, increased trade between countries with FTAs has been found to significantly reduce the likelihood of conflict between them by increasing the cost of conflict, providing resolution mechanisms and enhancing the familiarity with respective institutions.
As part of the trade diversification agenda, Canada is implementing its inclusive approach to trade. Canada’s approach aims to ensure that the benefits and opportunities that flow from trade are more widely shared, including with equity deserving groups such as women, small and medium-sized enterprises (SMEs), and Indigenous peoples. This involves seeking gender responsive and inclusive provisions across FTAs, supported by gender-based analysis (GBA Plus), and standalone chapters on trade and gender, SMEs, and trade and Indigenous peoples.
FTAs have a broad range of impacts, including significant positive effects that go beyond immediate economic outcomes. Understanding these impacts can help negotiators tailor future FTAs to maximize their positive effects, address fast-evolving phenomena such as the digital economy and confront other issues as they arise.
Part 1: 2021 in review
1.0 Introduction
Key data
Text version - 2021 Growth
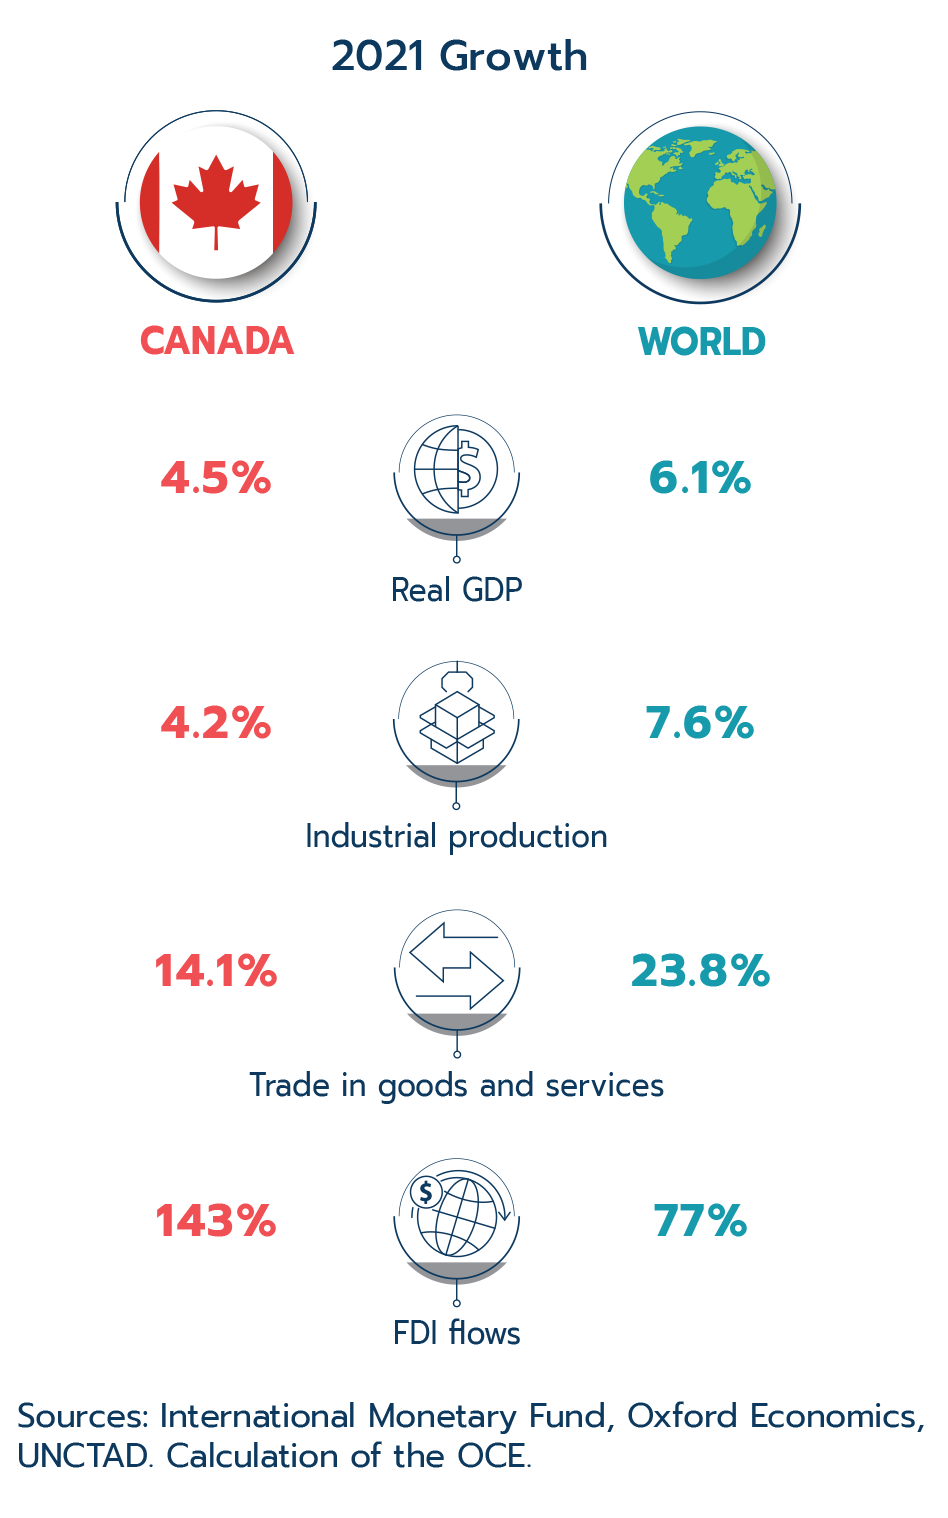
2021 Growth
| Real GDP | Industrial production | Trade in goods and services | FDI flows | |
|---|---|---|---|---|
| Canada | 4.5% | 4.2% | 14.1% | 143% |
| World | 6.1% | 7.6% | 23.8% | 77% |
Sources: Statistics Canada, International Monetary Fund, Oxford Economics, UNCTAD. Calculation of the OCE.
It has been over 2 years since the onset of the global COVID-19 pandemic, which has provoked profound impacts on the global and Canadian economies and disrupted almost every aspect of our daily lives. As 2021 began, the world was already on the path to recovery, albeit an uncertain one. Many countries entered the new year in a weaker position than expected due to unforeseen setbacks such as the emergence of new variants leading to renewed public health restrictions, supply chain disruptions delaying production, and supply and demand imbalances leading to surging prices. As the year went on, and vaccination programs were rolled out, people became more and more optimistic, and the recovery became a little more stable.
However, even amid the optimism, the latter part of 2021 brought forth additional challenges for people and businesses with further supply chain issues and public health concerns, all of which reduced the strength of the recovery. Moreover, the Russian invasion of Ukraine in early 2022 has introduced new challenges around the world and has threatened the rules-based international order. In Part 1 of State of Trade 2022, we will look back at the past year to see how the global and Canadian economies have fared since the historical crash in 2020.
1.1 Global context
Key data
Text version - Global economic recoveries real GDP in 2021 vs 2019
A heat map classifies each country in the world into 1 of 6 categories in terms of their stage of economic recovery, each represented by a colour. The first 3 categories represent countries that had 2021 GDP higher than 2019, and are represented by shades of teal, with the darkest shade being the most recovered. The next 3 categories represent countries that had 2021 GDP lower than 2019 and are represented by shades of red, with the darkest shade being the least recovered.
Recovered (2021 GDP > 2019 GDP)
| % difference in 2021 vs. 2019 GDP | Category | Shade |
|---|---|---|
| 5%+ | 1 | Darkest teal |
| 2% to 5% | 2 | Middle teal |
| 0% to 2% | 3 | Lightest teal |
Not yet recovered (2021 GDP < 2019 GDP)
| % difference in 2021 vs. 2019 GDP | Category | Shade |
|---|---|---|
| 0% to -2% | 4 | Lightest red |
| -2% to -5% | 5 | Middle red |
| -5%+ | 6 | Darkest red |
The colour grey represents countries where data were not available.
Global economic recoveries: 2021 vs. 2019 real GDP
| Territory | GDP recovery category |
|---|---|
| Afghanistan | data not available |
| Albania | 2 |
| Algeria | 4 |
| Andorra | 5 |
| Angola | 5 |
| Antigua and Barbuda | 6 |
| Argentina | 4 |
| Armenia | 5 |
| Aruba | 6 |
| Australia | 2 |
| Austria | 5 |
| Azerbaijan | 3 |
| Bahamas | 6 |
| Bahrain | 5 |
| Bangladesh | 1 |
| Barbados | 6 |
| Belarus | 3 |
| Belgium | 3 |
| Belize | 6 |
| Benin | 1 |
| Bhutan | 6 |
| Bolivia | 5 |
| Bosnia and Herzegovina | 2 |
| Botswana | 2 |
| Brazil | 3 |
| Brunei Darussalam | 3 |
| Bulgaria | 4 |
| Burkina Faso | 1 |
| Burundi | 2 |
| Cabo Verde | 6 |
| Cambodia | 4 |
| Cameroon | 2 |
| Canada | 4 |
| Central African Republic | 3 |
| Chad | 5 |
| Chile | 2 |
| China | 1 |
| Colombia | 2 |
| Comoros | 3 |
| Democratic Republic of the Congo | 1 |
| Congo | 6 |
| Costa Rica | 2 |
| Côte d'Ivoire | 1 |
| Croatia | 3 |
| Cyprus | 3 |
| Czech Republic | 5 |
| Denmark | 3 |
| Djibouti | 1 |
| Dominica | 6 |
| Dominican Republic | 2 |
| Ecuador | 5 |
| Egypt | 1 |
| El Salvador | 3 |
| Equatorial Guinea | 6 |
| Eritrea | 2 |
| Estonia | 1 |
| Eswatini | 3 |
| Ethiopia | 1 |
| Fiji | 6 |
| Finland | 3 |
| France | 4 |
| Gabon | 4 |
| The Gambia | 1 |
| Georgia | 2 |
| Germany | 4 |
| Ghana | 2 |
| Greece | 4 |
| Grenada | 6 |
| Guatemala | 1 |
| Guinea | 1 |
| Guinea-Bissau | 1 |
| Guyana | 1 |
| Haiti | 6 |
| Honduras | 2 |
| Hong Kong | 4 |
| Hungary | 2 |
| Iceland | 5 |
| India | 3 |
| Indonesia | 3 |
| Iran | 1 |
| Iraq | 6 |
| Ireland | 1 |
| Israel | 1 |
| Italy | 5 |
| Jamaica | 6 |
| Japan | 5 |
| Jordan | 3 |
| Kazakhstan | 3 |
| Kenya | 1 |
| Kiribati | 3 |
| Korea | 2 |
| Kosovo | 2 |
| Kuwait | 6 |
| Kyrgyzstan | 6 |
| Laos | 3 |
| Latvia | 3 |
| Lebanon | data not available |
| Lesotho | 5 |
| Liberia | 3 |
| Libya | 1 |
| Lithuania | 2 |
| Luxembourg | 2 |
| Macedonia | 5 |
| Macao | 6 |
| Madagascar | 5 |
| Malawi | 2 |
| Malaysia | 5 |
| Maldives | 6 |
| Mali | 3 |
| Malta | 3 |
| Marshall Islands | 5 |
| Mauritania | 3 |
| Mauritius | 6 |
| Mexico | 5 |
| Micronesia | 6 |
| Moldova | 2 |
| Mongolia | 5 |
| Montenegro | 5 |
| Morocco | 3 |
| Mozambique | 3 |
| Myanmar | 6 |
| Namibia | 6 |
| Nauru | 2 |
| Nepal | 3 |
| Netherlands | 3 |
| New Zealand | 2 |
| Nicaragua | 1 |
| Niger | 1 |
| Nigeria | 3 |
| Norway | 2 |
| Oman | 4 |
| Pakistan | 2 |
| Palau | 6 |
| Panama | 6 |
| Papua New Guinea | 4 |
| Paraguay | 2 |
| Peru | 3 |
| Philippines | 5 |
| Poland | 2 |
| Portugal | 5 |
| Puerto Rico | 5 |
| Qatar | 5 |
| Romania | 3 |
| Russia | 3 |
| Rwanda | 1 |
| Samoa | 6 |
| San Marino | 4 |
| São Tomé and Príncipe | 2 |
| Saudi Arabia | 4 |
| Senegal | 1 |
| Serbia | 1 |
| Seychelles | 4 |
| Sierra Leone | 3 |
| Singapore | 2 |
| Slovakia | 4 |
| Slovenia | 2 |
| Solomon Islands | 5 |
| Somalia | 3 |
| South Africa | 4 |
| South Sudan | 4 |
| Spain | 6 |
| Sri Lanka | 4 |
| St. Kitts and Nevis | 6 |
| St. Lucia | 6 |
| St. Vincent and the Grenadines | 6 |
| Sudan | 5 |
| Suriname | 6 |
| Sweden | 3 |
| Switzerland | 3 |
| Syria | data not available |
| Taiwan | 1 |
| Tajikistan | 1 |
| Tanzania | 1 |
| Thailand | 5 |
| Timor-Leste | 6 |
| Togo | 1 |
| Tonga | 4 |
| Trinidad and Tobago | 6 |
| Tunisia | 6 |
| Turkey | 1 |
| Turkmenistan | 3 |
| Tuvalu | 2 |
| Uganda | 2 |
| Ukraine | 4 |
| United Arab Emirates | 5 |
| United Kingdom | 5 |
| United States | 2 |
| Uruguay | 4 |
| Uzbekistan | 1 |
| Vanuatu | 5 |
| Venezuela | data not available |
| Vietnam | 1 |
| West Bank and Gaza | 6 |
| Yemen | 6 |
| Zambia | 3 |
| Zimbabwe | 3 |
Source: International Monetary Fund. Calculation of the OCE.
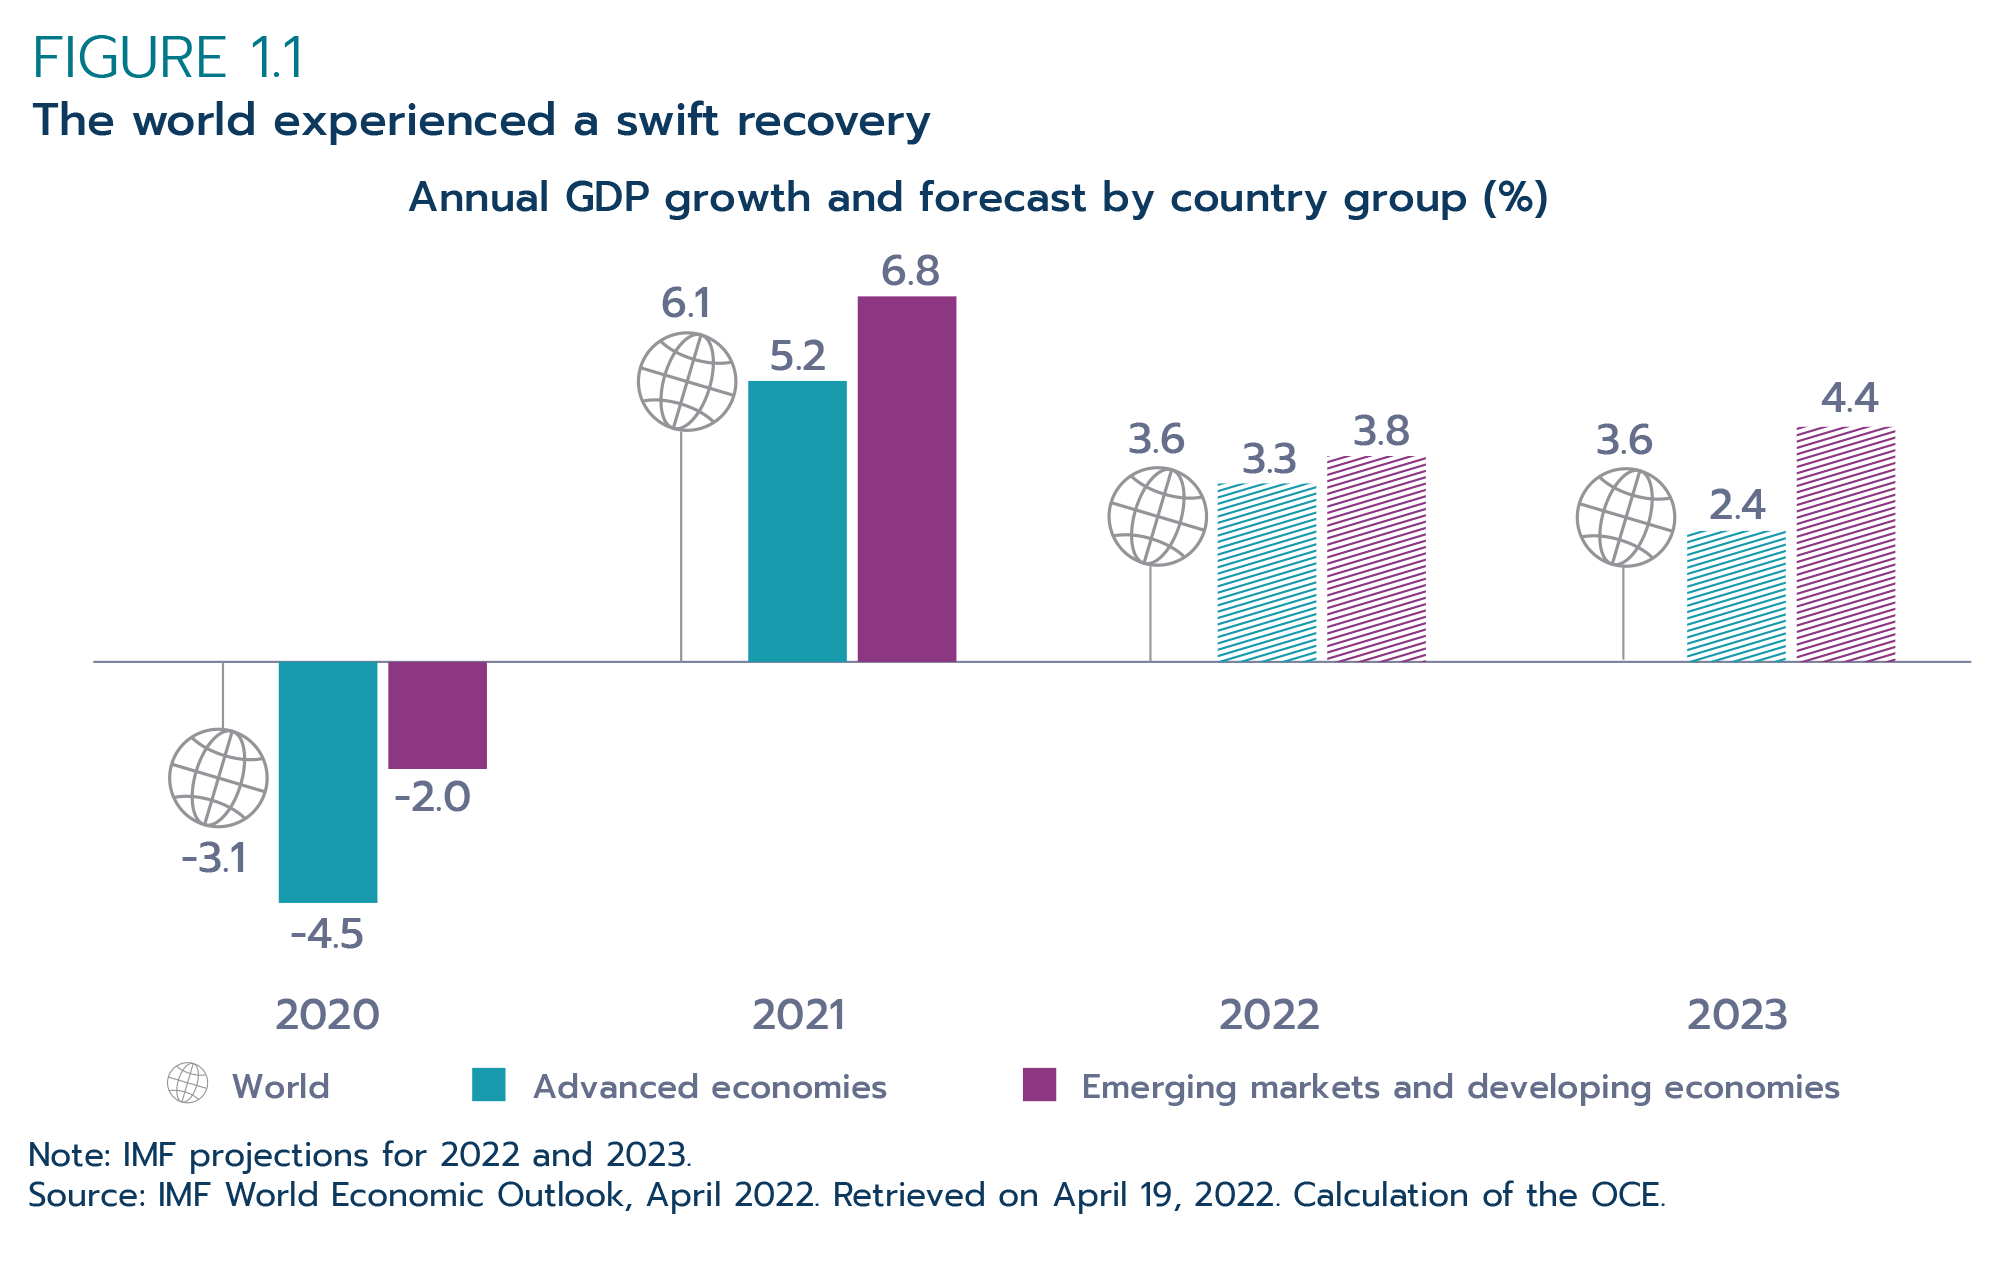
Overall, the world posted a robust economic recovery for 2021. According to the International Monetary Fund (IMF), world real GDP rebounded by 6.1% in 2021 after a 3.1% decline in 2020 (Figure 1.1).
Figure 1.1: The world experienced a swift recovery
Text version - Figure 1.1
Annual real GDP growth and projection by country group (%)
| 2020 | 2021 | 2022 | 2023 | |
|---|---|---|---|---|
| World | -3.1 | 6.1 | 3.6 | 3.6 |
| Advanced economies | -4.5 | 5.2 | 3.3 | 2.4 |
| Emerging markets and developing economies | -2.0 | 6.8 | 3.8 | 4.4 |
Note: IMF projections for 2022 and 2023.
Source: IMF World Economic Outlook, April 2022. Retrieved on April 19, 2022. Calculation of the OCE.
However, while growth surpassed the IMF’s October forecast by 0.2 percentage points, there was a slowdown in economic activity around the world in the second half of the year. One of the key reasons for the slowdown was a prolonged disruption to global supply chains, as high seaborne freight costs, congested ports, and shortages of key products showed few signs of improvement by the end of the year. This, coupled with uneven rollout of vaccines in some countries, restrained global economic activity. Furthermore, despite high vaccine uptake in advanced economies, the emergence and spread of the Omicron variant during the final few weeks of 2021 led to a rapid deterioration of health conditions and consumer sentiment around the world. Lastly, in addition to these factors, broadening price pressures across regions (for example, energy and food prices) continued to build up throughout the second half of the year.
The United States was one of the countries most impacted by the global supply chain disruptions. Supply-side problems persisted throughout the year as container ships waited to unload off the coast of California and a global shortage of semiconductors hampered production in several industries, but primarily in motor vehicle manufacturing. The back up in warehousing, increased shipping rates, and supply and demand imbalances all contributed to a significant deceleration of U.S. economic growth in the third quarter of 2021. In China, the combined effects of resurgence in COVID-19 cases, electricity shortages constraining industrial production, and declining real estate investment also dampened the country’s economic growth. Similarly, in Europe, supply-side disruptions coupled with the later spread of the Omicron variant resulted in economic activity stalling among European countries in the last quarter of the year.
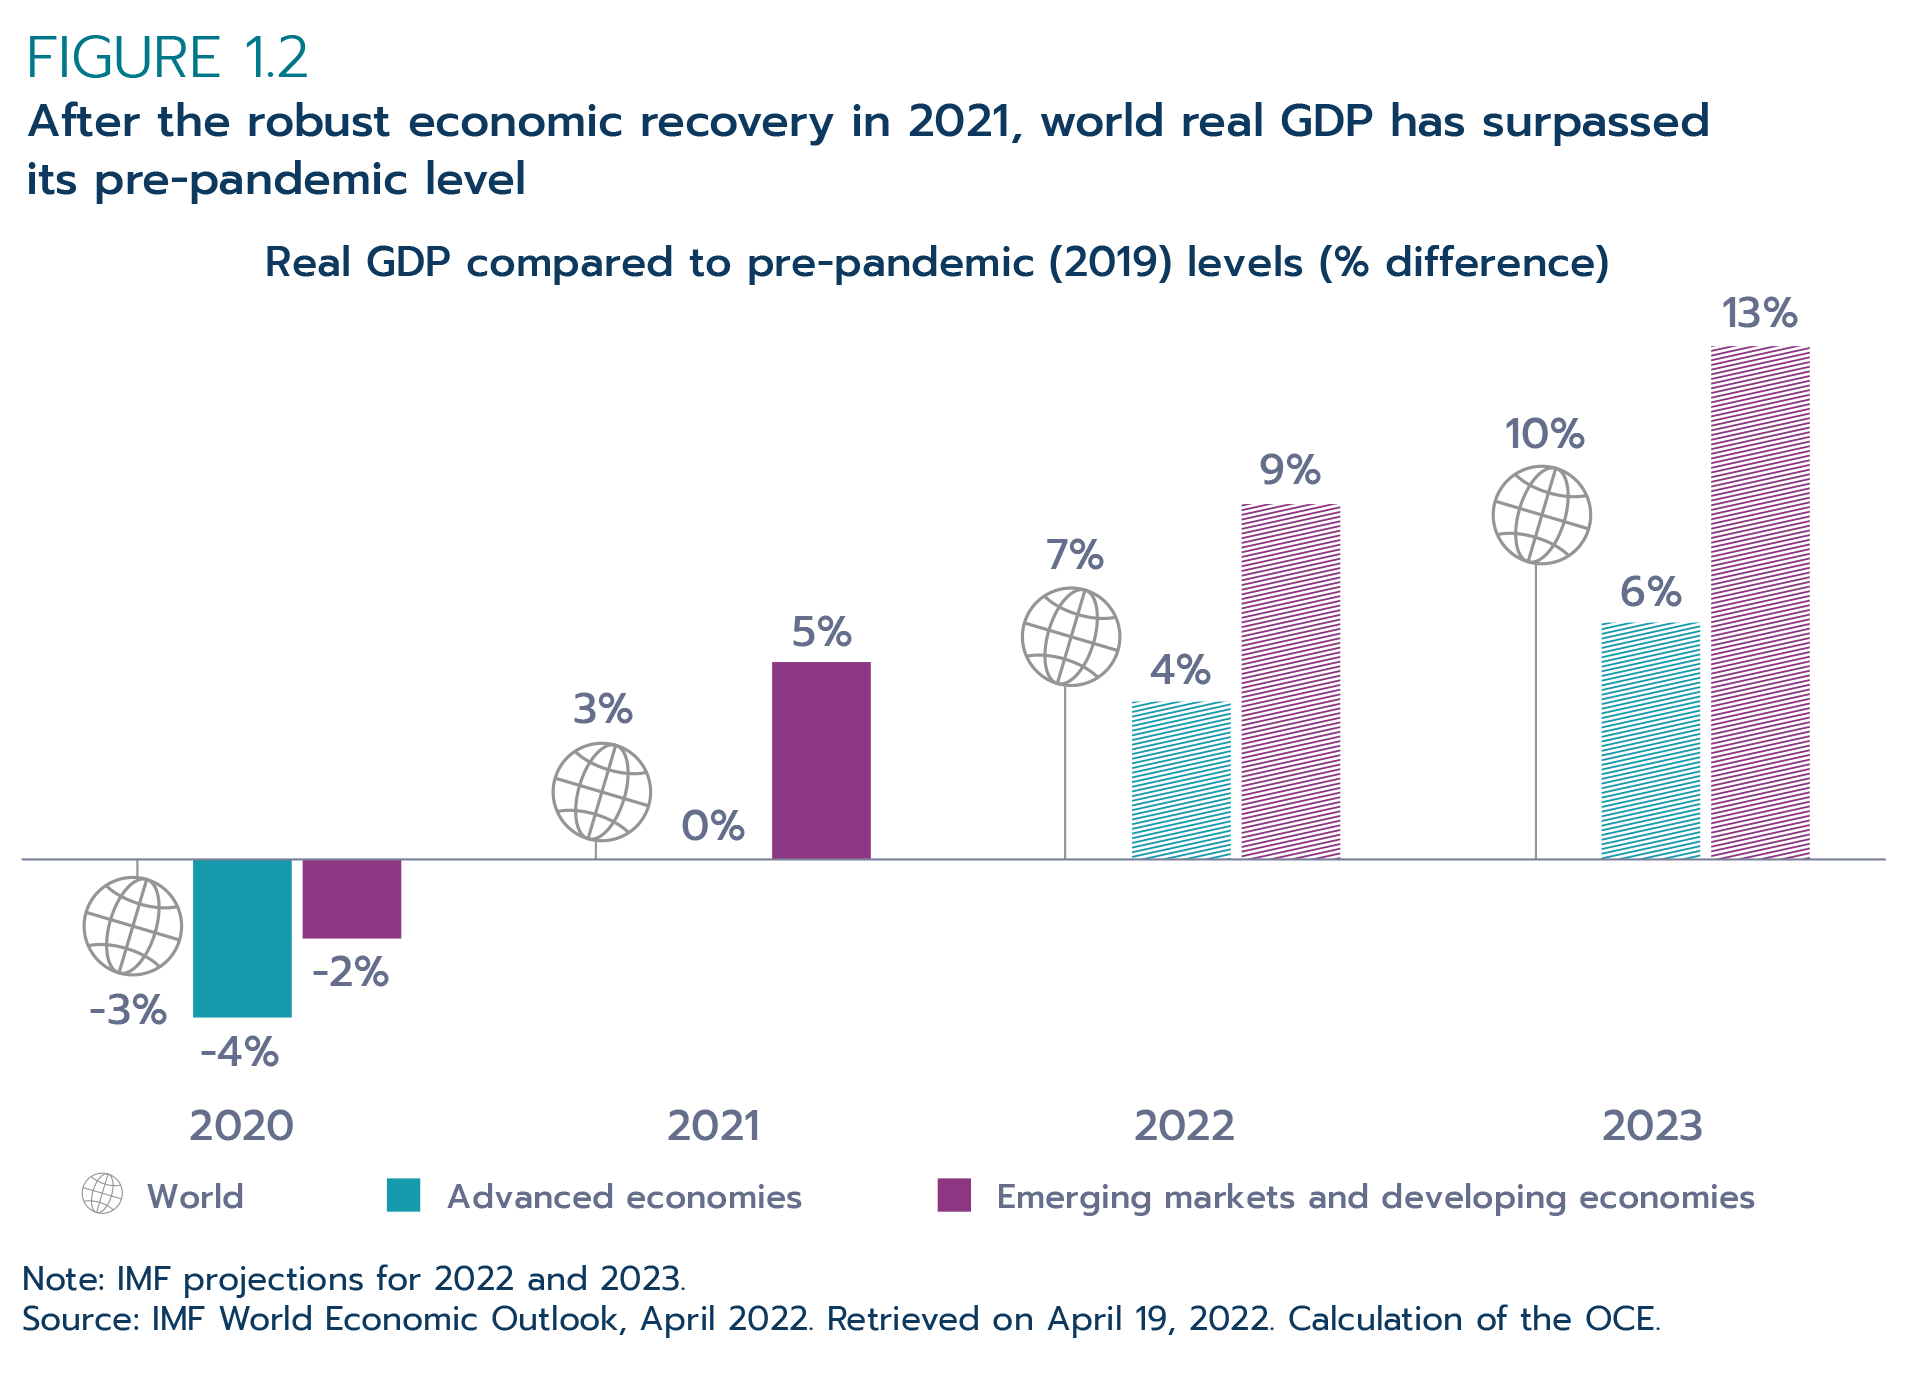
For 2021 overall, emerging markets (6.8% growth) outperformed advanced economies (5.2% growth). While significant uncertainties remain, this trend is currently expected to continue over the next 2 years, with emerging markets growing by 3.8% in 2022 and another 4.4% in 2023; meanwhile, advanced economies are projected to grow 3.3% in 2022 and 2.4% in 2023. In terms of real output levels, both groups of economies recovered their losses incurred in 2020 and surpassed their pre-pandemic 2019 levels by the end of 2021 (Figure 1.2).
Figure 1.2: After the robust economic recovery in 2021, world real GDP has surpassed its pre-pandemic level
Text version - Figure 1.2
Real GDP compared to pre-pandemic (2019) levels (% difference)
| World | Advanced economies | Emerging markets and developing economies | |
|---|---|---|---|
| 2020 | -3% | -4% | -2% |
| 2021 | 3% | 0% | 5% |
| 2022 | 7% | 4% | 9% |
| 2023 | 10% | 6% | 13% |
Note: IMF projections for 2022 and 2023.
Source: IMF World Economic Outlook, April 2022. Retrieved on April 19, 2022. Calculation of the OCE.
Despite widespread supply chain issues such as the ongoing global semiconductor shortage and port backlogs weighing down on the pace of recovery, global merchandise trade posted historical growth in 2021. The resurgence of global economic activity in the first half of the year was the main factor driving global trade volumes above their pre-pandemic records. The World Trade Organization (WTO) estimated a 9.8% increase in world merchandise trade volume in 2021, followed by a projected 3.0% growth in 2022 (WTO, 2022). Compared to the pre-pandemic peak in 2019, 2021 world merchandise trade volume was also 4.3% higher. On the other hand, while the value of global trade in commercial services increased by 15% in 2021, many sectors, especially those that rely on face-to-face interactions, continued to lag behind goods trade.
Following a sharp decline in 2020 (-37%), global inflows of foreign direct investment (FDI) rebounded quickly in 2021, estimated at US$1.7 trillion (UNCTAD, 2022). This represents a 77% increase from 2020, surpassing pre-pandemic levels by over US$150 billion. The recovery was faster than previously projected by UNCTAD (2020) and widespread across regions. Developed economies, which had experienced the largest pandemic-driven drop in FDI (-65%), saw their FDI inflows almost triple in 2021, to an estimated US$777 billion. In developing economies, where the 2020 decline was less severe (-7%), FDI inflows grew by 30% to US$870 billion in 2021 (UNCTAD, 2022). About one third of the increase in global FDI inflows in 2021 was driven by cross-border mergers and acquisitions (M&As) (UNCTAD, 2022). The surge in M&As was primarily in the services sector, which accounted for close to three quarters of cross-border M&A deals in 2021. In January, UNCTAD projected a positive outlook for 2022, with a slower growth than in 2021, as underlying trends were expected to remain unchanged.
The world contended with new challenges right into 2022. The global economy remains fragile, and further setbacks could affect Canada. A major new source of uncertainty was brought about by the Russian invasion of Ukraine, which has led to the loss of thousands of lives and the exodus of millions of Ukrainians. This attack has put the supply of important commodities such as wheat and oil at risk and has resulted in a surge in commodity prices. The ramifications are being felt worldwide, weighing on markets and business confidence. In April, the IMF downgraded its 2022 global GDP forecast to 3.6% from its January forecast of 4.4%, and businesses and markets are expected to continue contending with these global challenges for some time.
1.2 Canadian economic performance
Key data
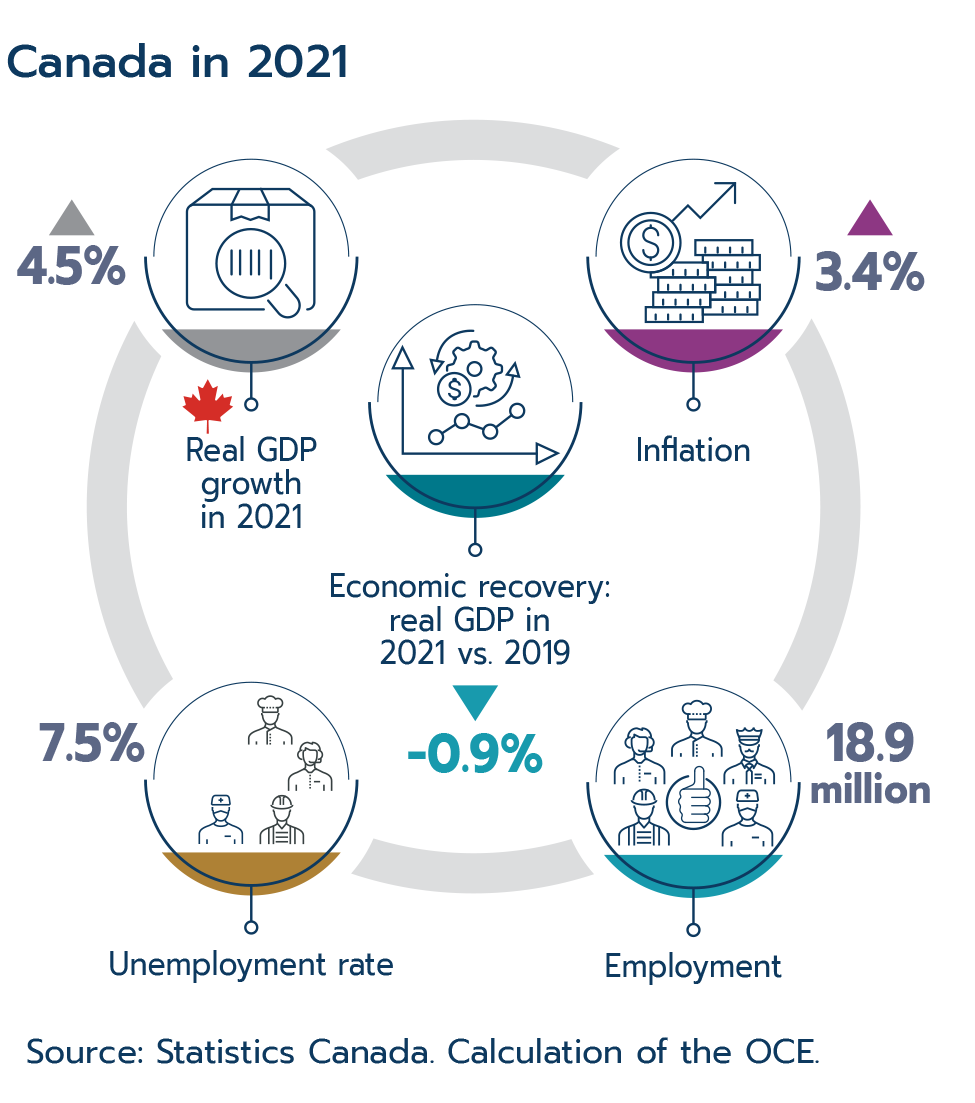
Text version - Canada in 2021
A diagram depicts 2021 economic statistics for the Canadian economy.
Canada in 2021
| Real GDP growth in 2021 | 4.5% |
| Inflation | 3.4% |
| Economic recovery: real GDP in 2021 vs. 2019 | -0.9% |
| Unemployment rate | 7.5% |
| Employment | 18.9 million |
Canada's economy rebounded strongly in 2021 (4.5%) after a historical contraction in the year prior (-5.2%). However, the Canadian economy experienced many challenges, starting with a fresh wave of COVID-19 cases and restrictions, which slowed economic recovery to 4.4% growth in the first quarter of 2021 on the heels of 9.1% growth in the last quarter of 2020 (seasonally adjusted at annual rates). On top of public health measures restricting economic activity, the second quarter of the year experienced a slowdown in the resale housing market and a decline in exports, which together led to a contraction in Canada's real GDP of 3.1%.
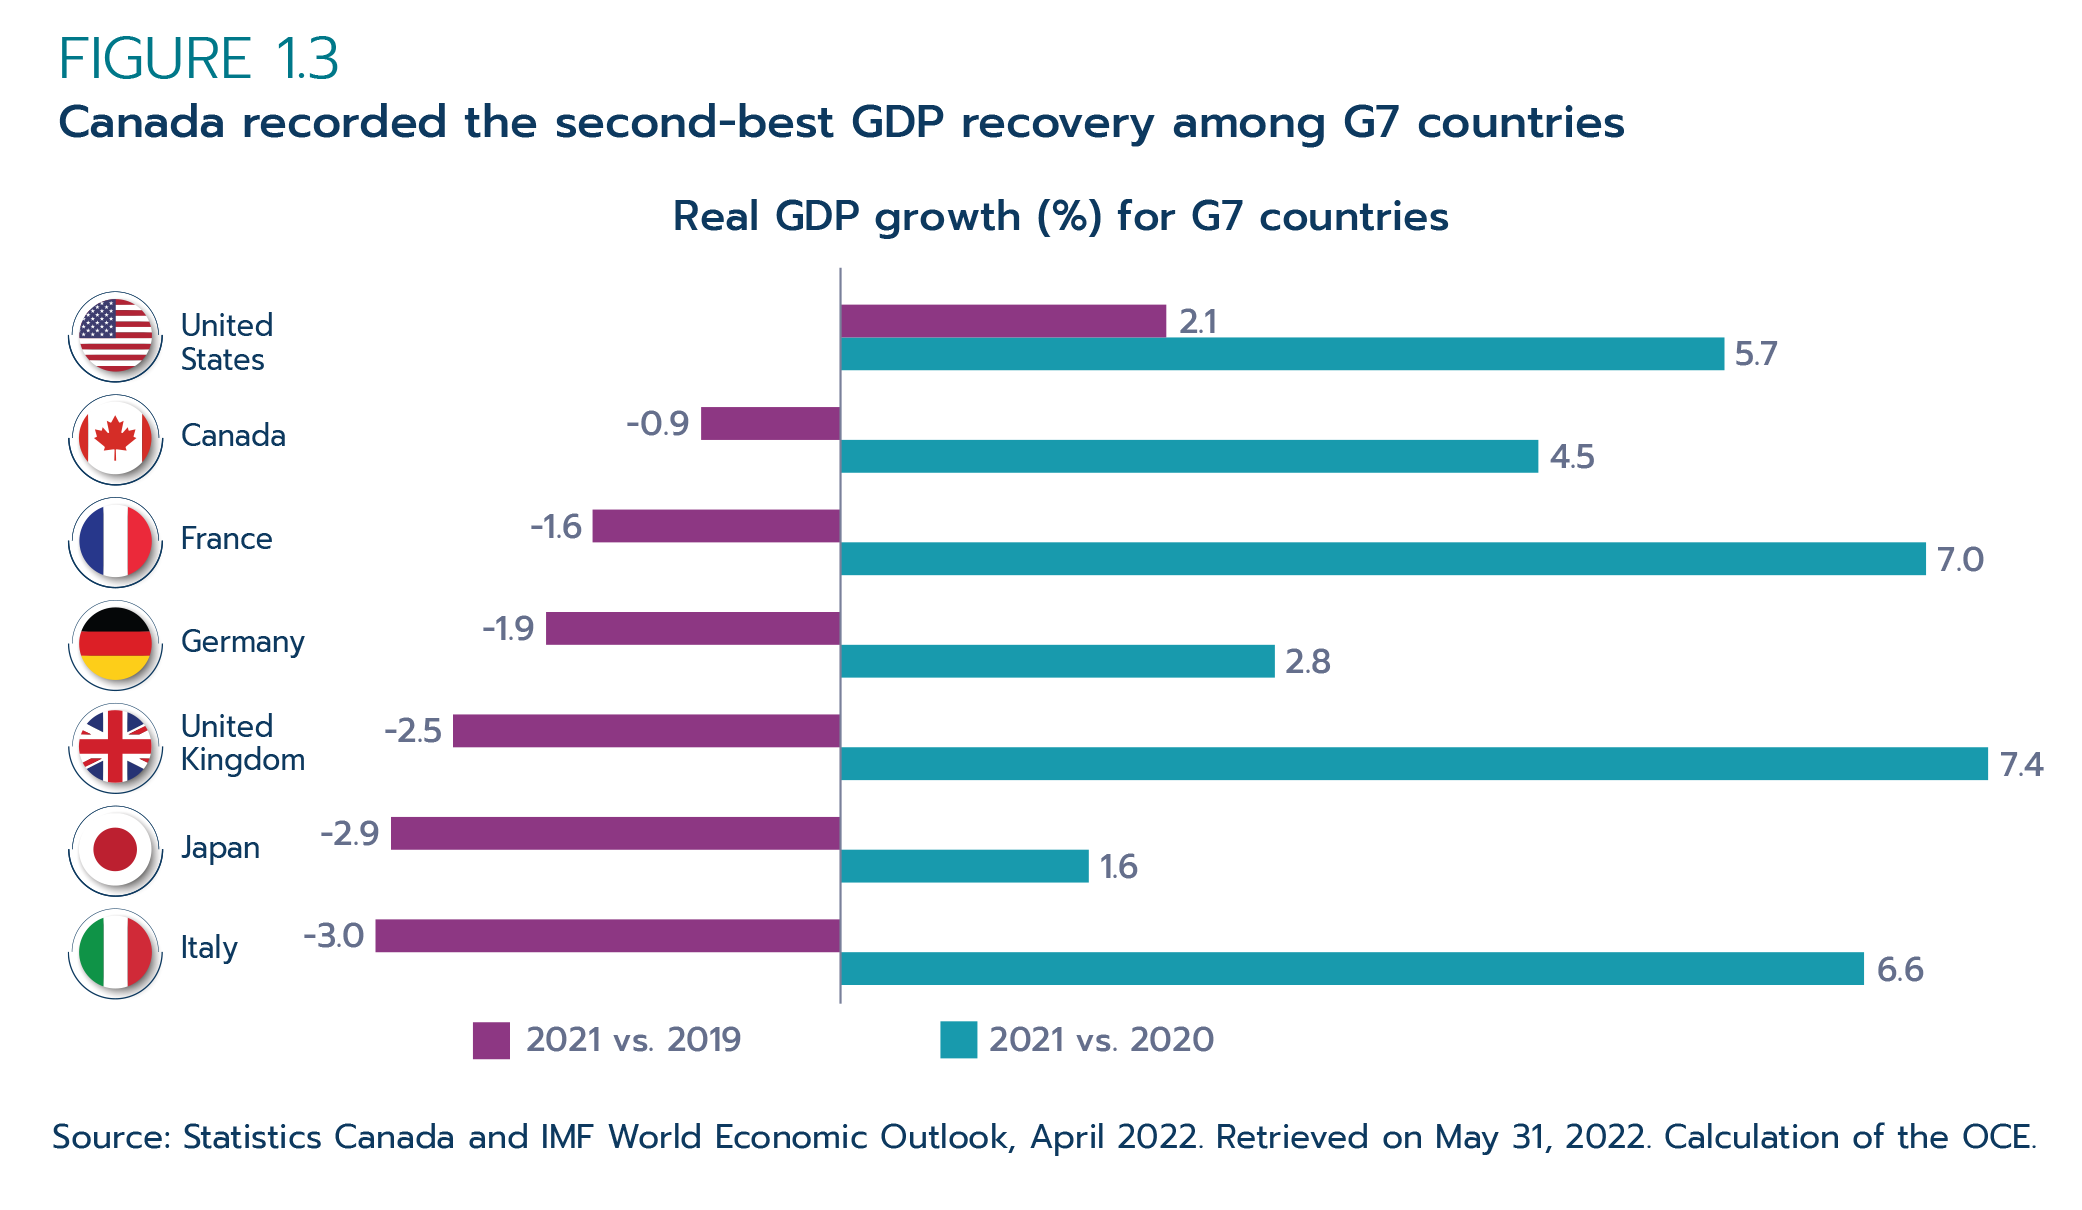
Fortunately, the economic recovery resumed in the second half of 2021. As public health restrictions eased, households increased their spending and exports turned around in the third quarter, leading to a 5.3% growth in overall economic activity. This momentum carried into the fourth quarter of 2021, which saw the economy expand by 6.6% on the back of business investment in engineering structures and home ownership transfer costs. For the full year, Canada's real GDP rose by 4.5%. Moreover, while Canada's 2021 GDP growth was slower than that of many of its G7 peers, it is in a better position than most in terms of the recovery. The U.S. economy had the strongest recovery, with 2021 GDP sitting 2.1% higher than it was in 2019. Canada had the second-strongest showing, with 2021 economic activity only 0.9% lower than in 2019 (Figure 1.3).
Figure 1.3: Canada recorded the second-best GDP recovery among G7 countries
Text version - Figure 1.3
Real GDP growth (%) for G7 countries
| Country | 2021 vs. 2020 | 2021 vs. 2019 |
|---|---|---|
| United States | 5.7 | 2.1 |
| Canada | 4.5 | -0.9 |
| France | 7.0 | -1.6 |
| Germany | 2.8 | -1.9 |
| United Kingdom | 7.4 | -2.5 |
| Japan | 1.6 | -2.9 |
| Italy | 6.6 | -3.0 |
Source: Statistics Canada and IMF World Economic Outlook, April 2022.
Retrieved on May 31, 2022. Calculation of the OCE.
Services industries, especially those relying on face-to-face interactions, were some of the most impacted by the global COVID-19 pandemic and its related health restrictions. However, these industries began to recover in 2021, expanding 5.3%, outpacing the 3.9% growth for goods-producing industries (Figure 1.4). Every services industry except for management of companies and enterprises expanded. Top contributors to the growth were health care and social assistance, real estate and rental and leasing, and professional, scientific and technical services (Figure 1.5). Moreover, accommodation and food services, one of the hardest-hit industries in 2020, expanded by 14.9% in 2021.
Figure 1.4: While 2021 was a strong year, particularly for services, overall activity was lower than in 2019
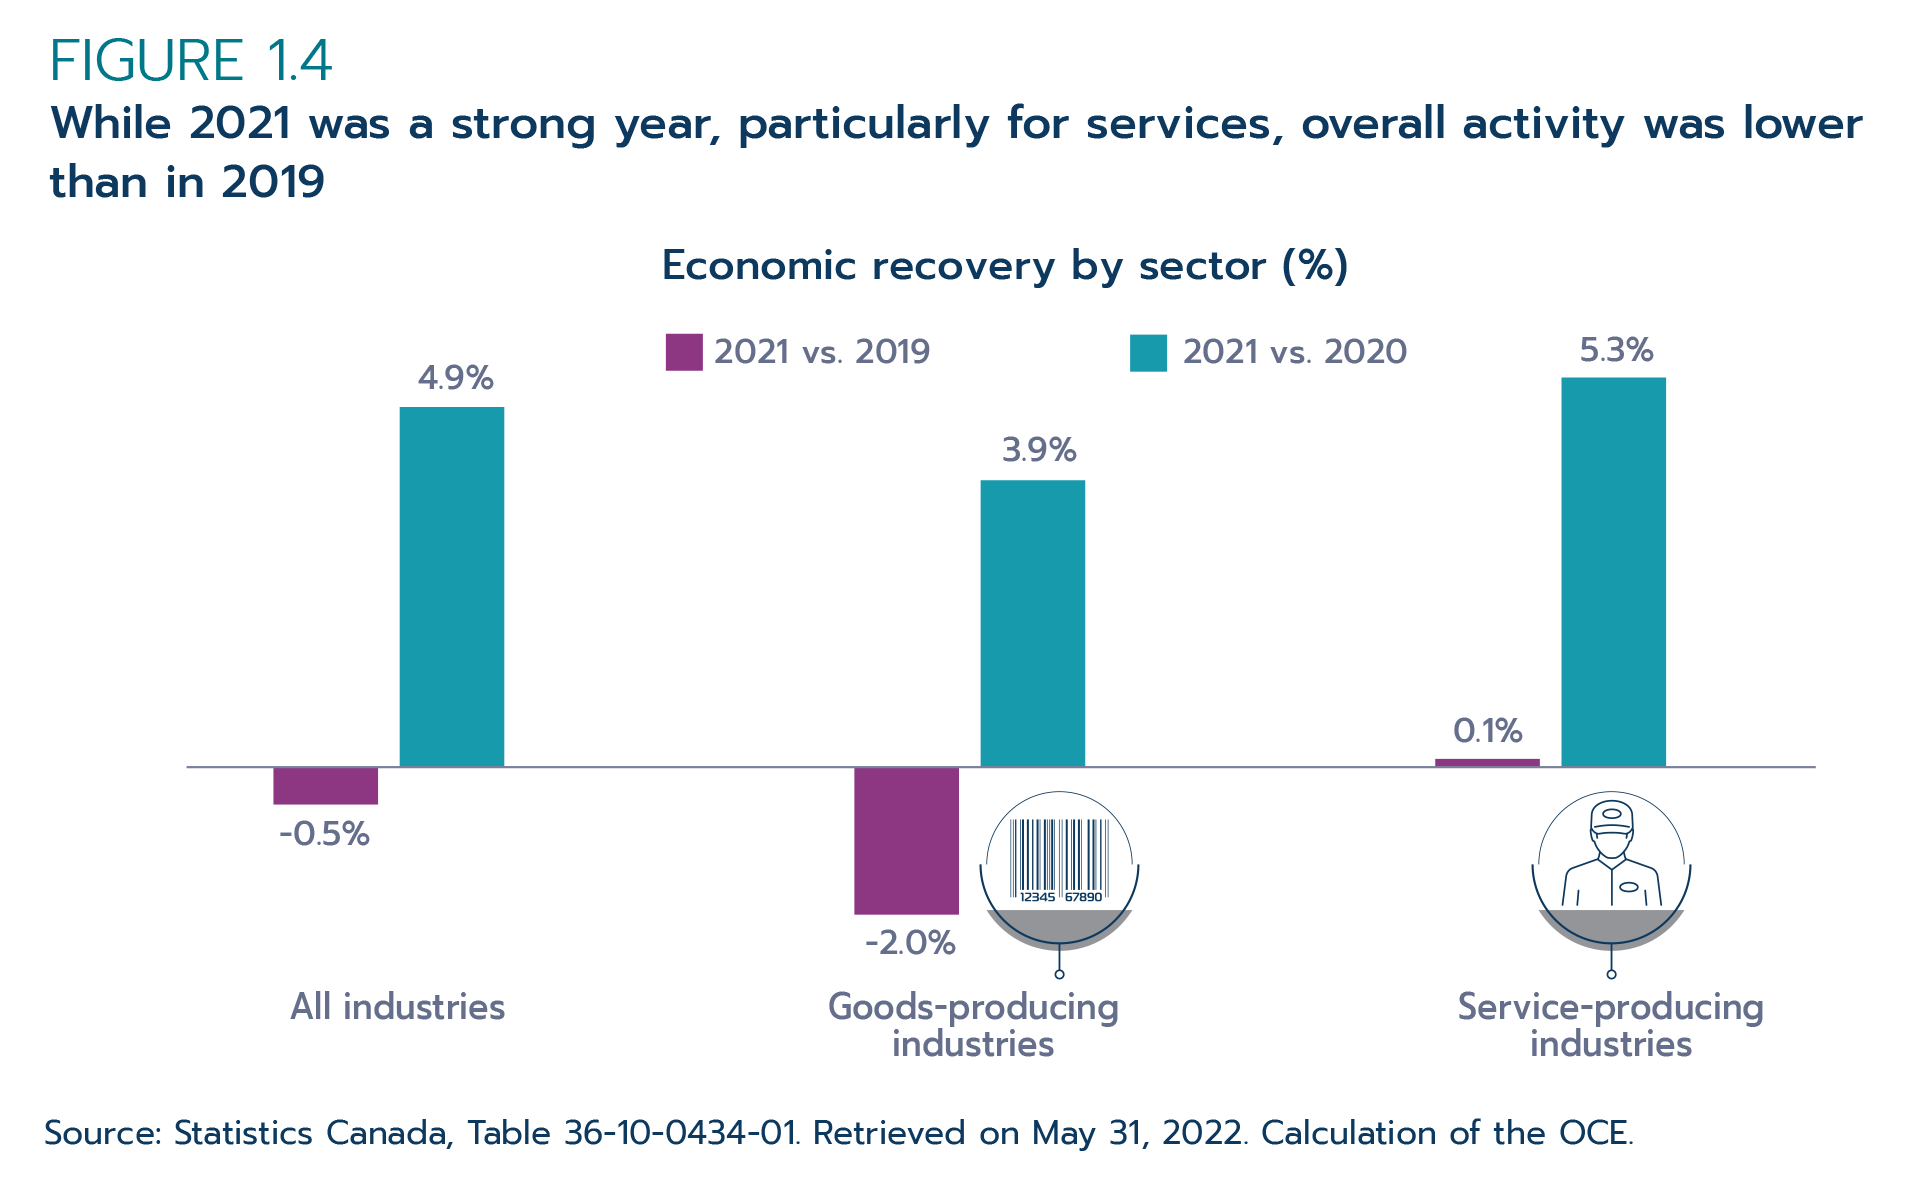
Text version - Figure 1.4
Economic recovery by sector (%)
| 2021 vs. 2020 | 2021 vs. 2019 | |
|---|---|---|
| All industries | 4.9% | -0.5% |
| Goods-producing industries | 3.9% | -2.0% |
| Services-producing industries | 5.3% | 0.1% |
Source: Statistics Canada, Table 36-10-0434-01. Retrieved on May 31, 2022. Calculation of the OCE.
Figure 1.5: Food and entertainment services still lagging behind, while many professional services have recovered
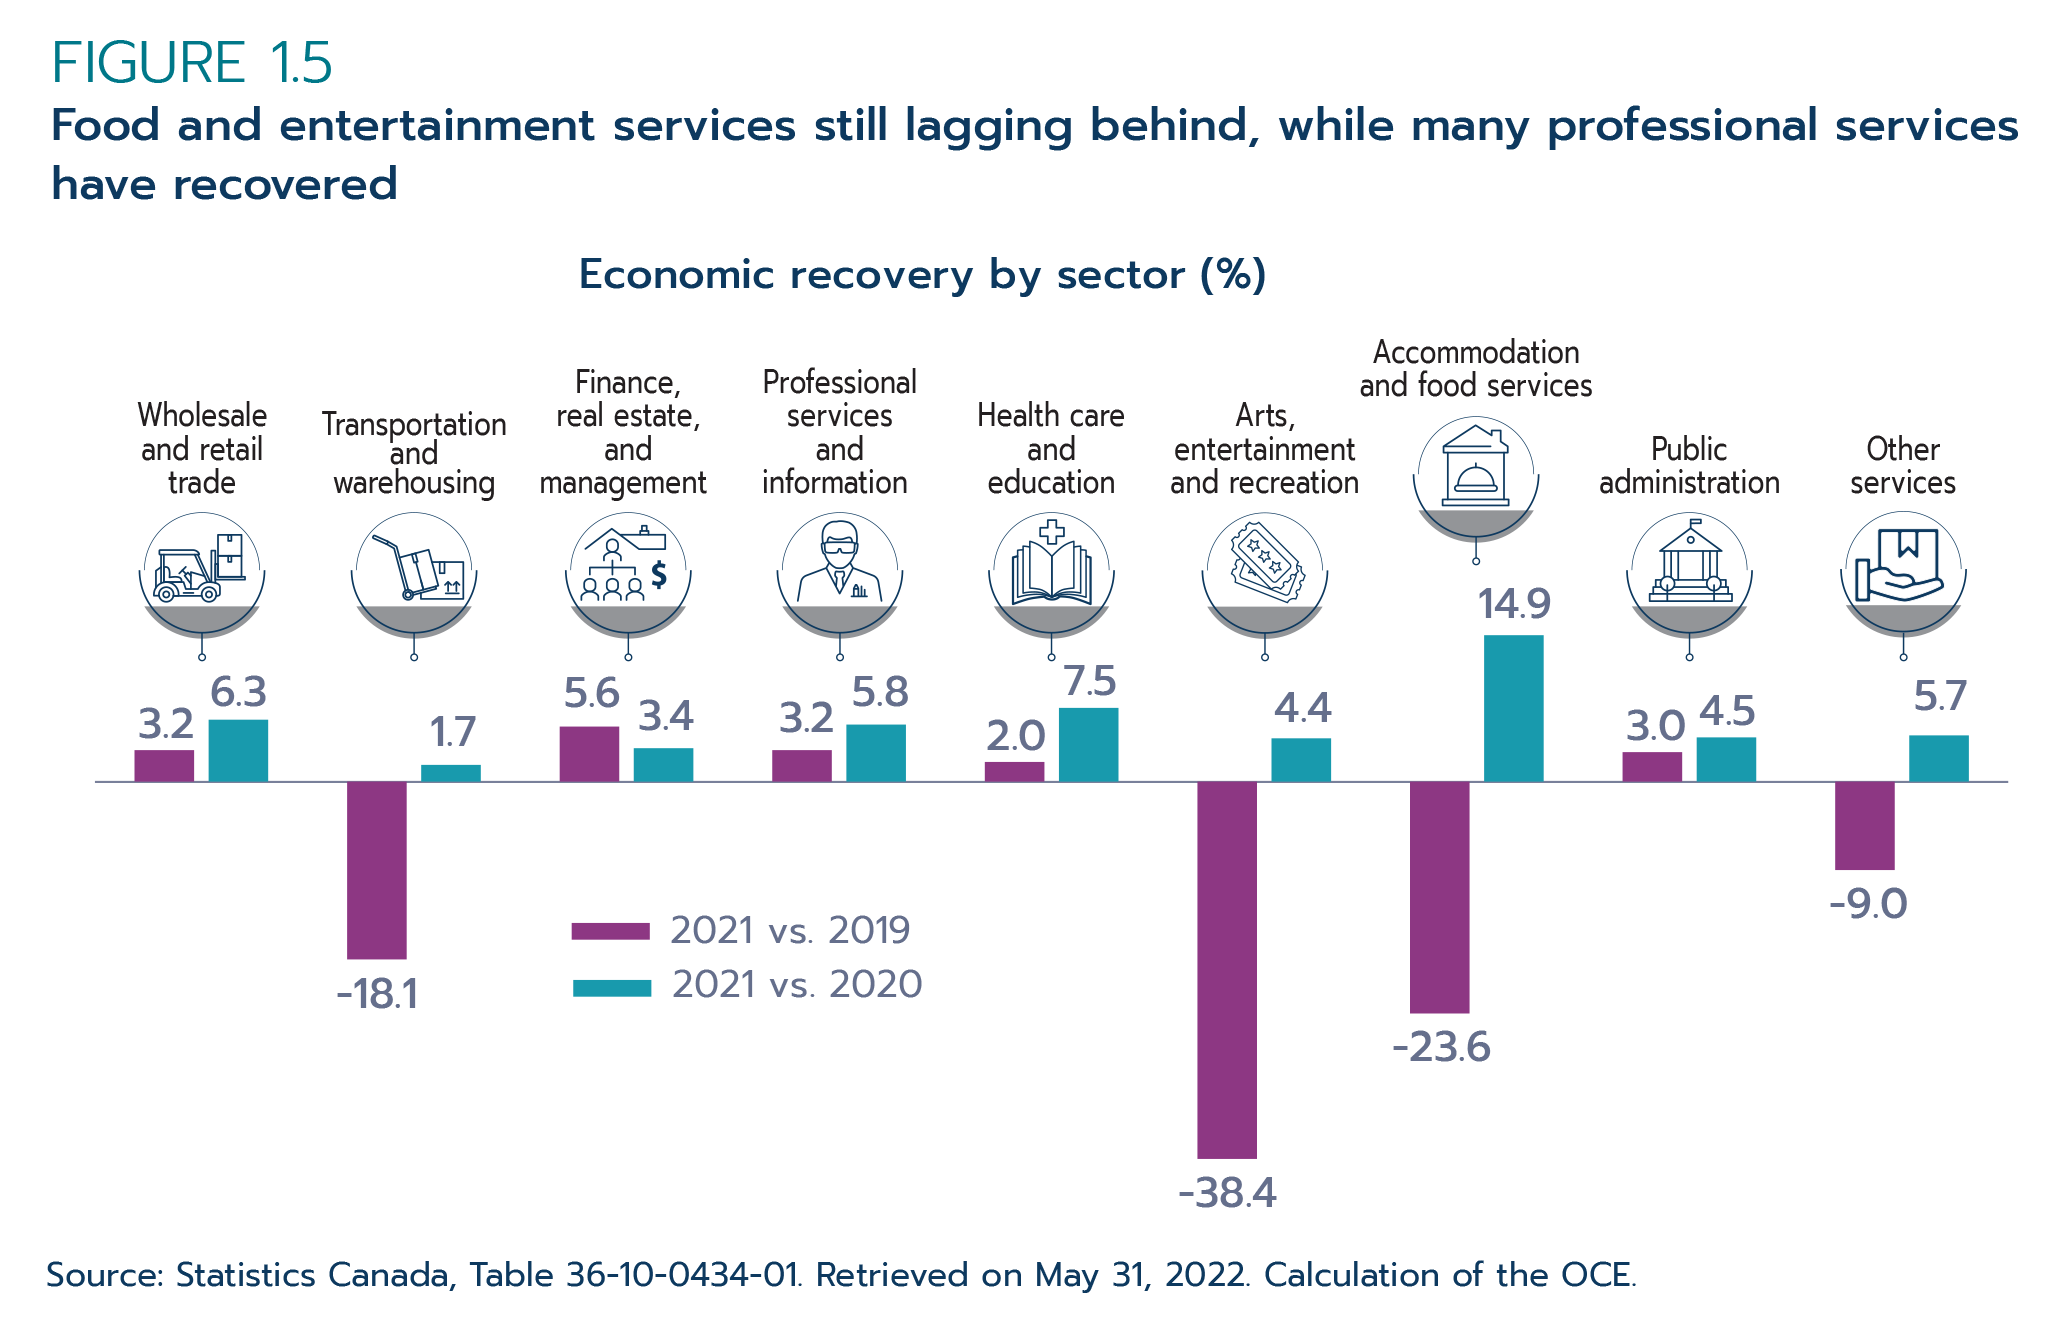
Text version - Figure 1.5
Economic recovery by sector (%)
| 2021 vs. 2019 | 2021 vs. 2020 | |
|---|---|---|
| Wholesale and retail trade | 3.2% | 6.3% |
| Transportation and warehousing | -18.1% | 1.7% |
| Finance, real estate, and management | 5.6% | 3.4% |
| Professional services and information | 3.2% | 5.8% |
| Health care and education | 2.0% | 7.5% |
| Arts, entertainment and recreation | -38.4% | 4.4% |
| Accommodation and food services | -23.6% | 14.9% |
| Public administration | 3.0% | 4.5% |
| Support and other services | -9.0% | 5.7% |
Source: Statistics Canada, Table 36-10-0434-01. Retrieved on May 31, 2022. Calculation of the OCE.
However, despite widespread growth, many services industries did not fully recover their losses from 2020. For example, in addition to management of companies and enterprises, leisure industries such as arts, entertainment and recreation, and accommodation and food services remained far below their pre-pandemic levels. For the year overall, the strong recoveries in some services (namely, real estate and finance) counteracted continued challenges in others, leading to total economic activity in services-producing industries being nearly equal to 2019 levels.
On the goods side, robust growth in mining, quarrying, and oil and gas extraction, construction, and manufacturing were partially offset by a slowdown in agriculture, forestry, fishing and hunting and utilities industries (Figure 1.6). Furthermore, despite the substantial recovery in 2021, overall goods-producing industries posted a slower recovery than services-producing industries and remained 2.0% below their 2019 levels.
Figure 1.6: 2021 growth in many goods industries, but only construction has recovered to pre-pandemic levels

Text version - Figure 1.6
Economic recovery by sector (%)
| 2021 vs. 2020 | 2021 vs. 2019 | |
|---|---|---|
| Agriculture, forestry, fishing and hunting | -6.5% | -3.4% |
| Mining, quarrying, and oil and gas extraction | 6.5% | -1.6% |
| Utilities | -1.4% | -3.8% |
| Construction | 5.8% | 3.6% |
| Manufacturing | 4.5% | -5.7% |
Source: Statistics Canada, Table 36-10-0434-01. Retrieved on May 31, 2022. Calculation of the OCE.
Due to strong employment growth, especially in the latter half of the year, Canada’s labour market largely recovered to pre-pandemic conditions by the end of 2021 (Figure 1.7). Monthly employment rose from a low of 16.1 million in April 2020 to 19.4 million in December 2021, surpassing the pre-pandemic level of 19.1 million recorded in February 2020. Moreover, other labour market indicators reached near pre-pandemic levels by December 2021: the unemployment rate fell back down to 6.0% (5.7% in February 2020), the participation rate rose to 65.4% (65.6% in February 2020), and the employment rate reached 61.5% (61.9% in February 2020).
Figure 1.7: Canada’s labour market recovered to pre-pandemic conditions
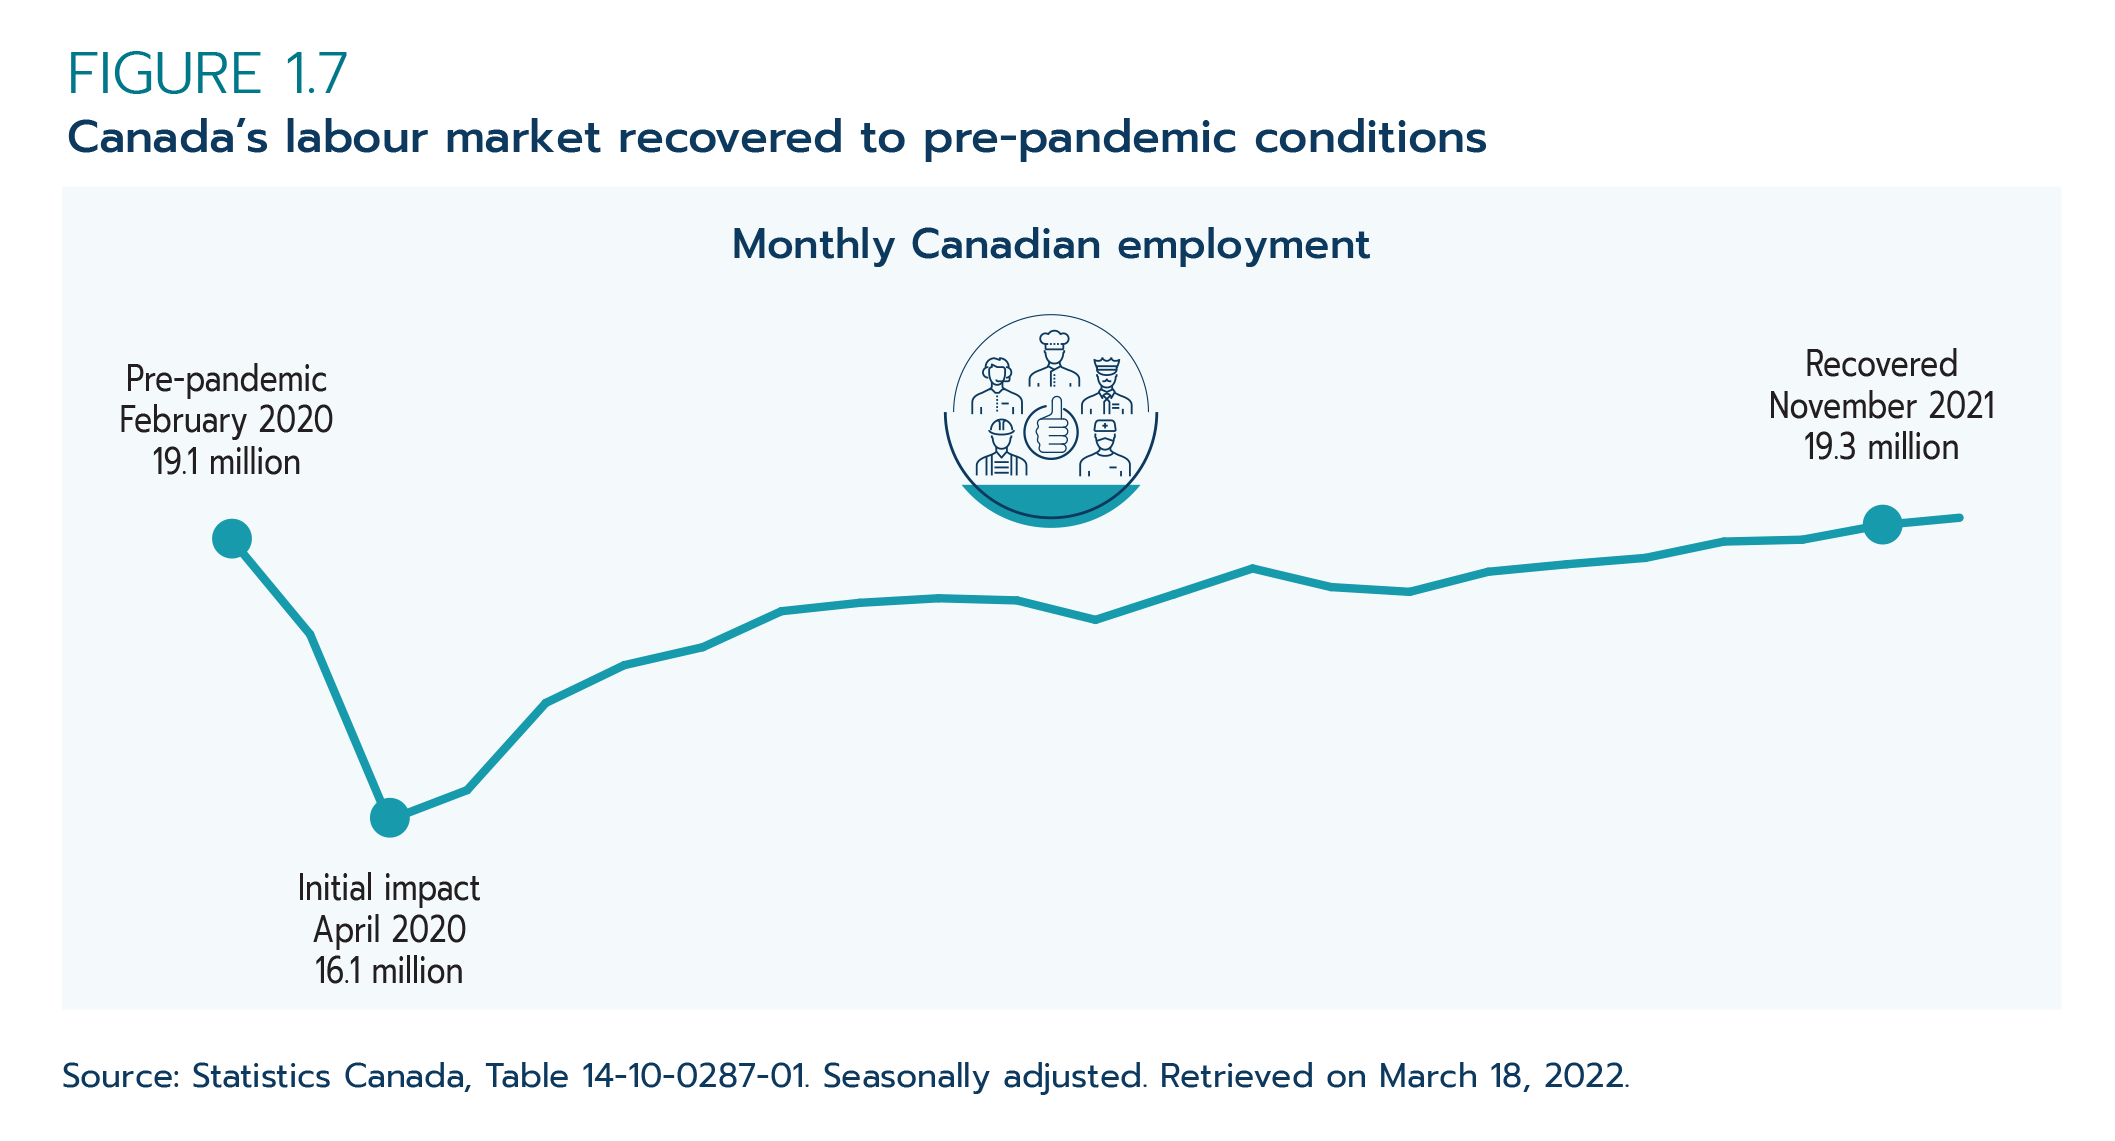
Text version - Figure 1.7
Monthly Canadian employment
| Month | Description | Number employed |
|---|---|---|
| February 2020 | Pre-pandemic | 19.1 million |
| April 2020 | Initial impact | 16.1 million |
| November 2021 | Recovered | 19.3 million |
Source: Statistics Canada, Table 14-10-0287-01. Seasonally adjusted. Retrieved on March 18, 2022.
On the other hand, Canada experienced a surge in prices. The annual average consumer price index (CPI) was 3.4% in 2021, the highest annual inflation since 1991. Prices of goods had surged 4.7% and services by 2.3%. Most of the price increases took place in the second half of the year when monthly inflation accelerated to over 4.0% for most months. Due to global supply chain disruptions, prices for durable goods and food rose by 4.4% and 2.5%, respectively, for the full year. At the same time, elevated prices for oil and natural gas pushed up energy prices by 18.9%. When energy is excluded, annual inflation was only 2.4% in 2021, roughly the same pace as the 2.3% price growth in 2019.
1.3 Highlights of Canada’s trade performance
Key data
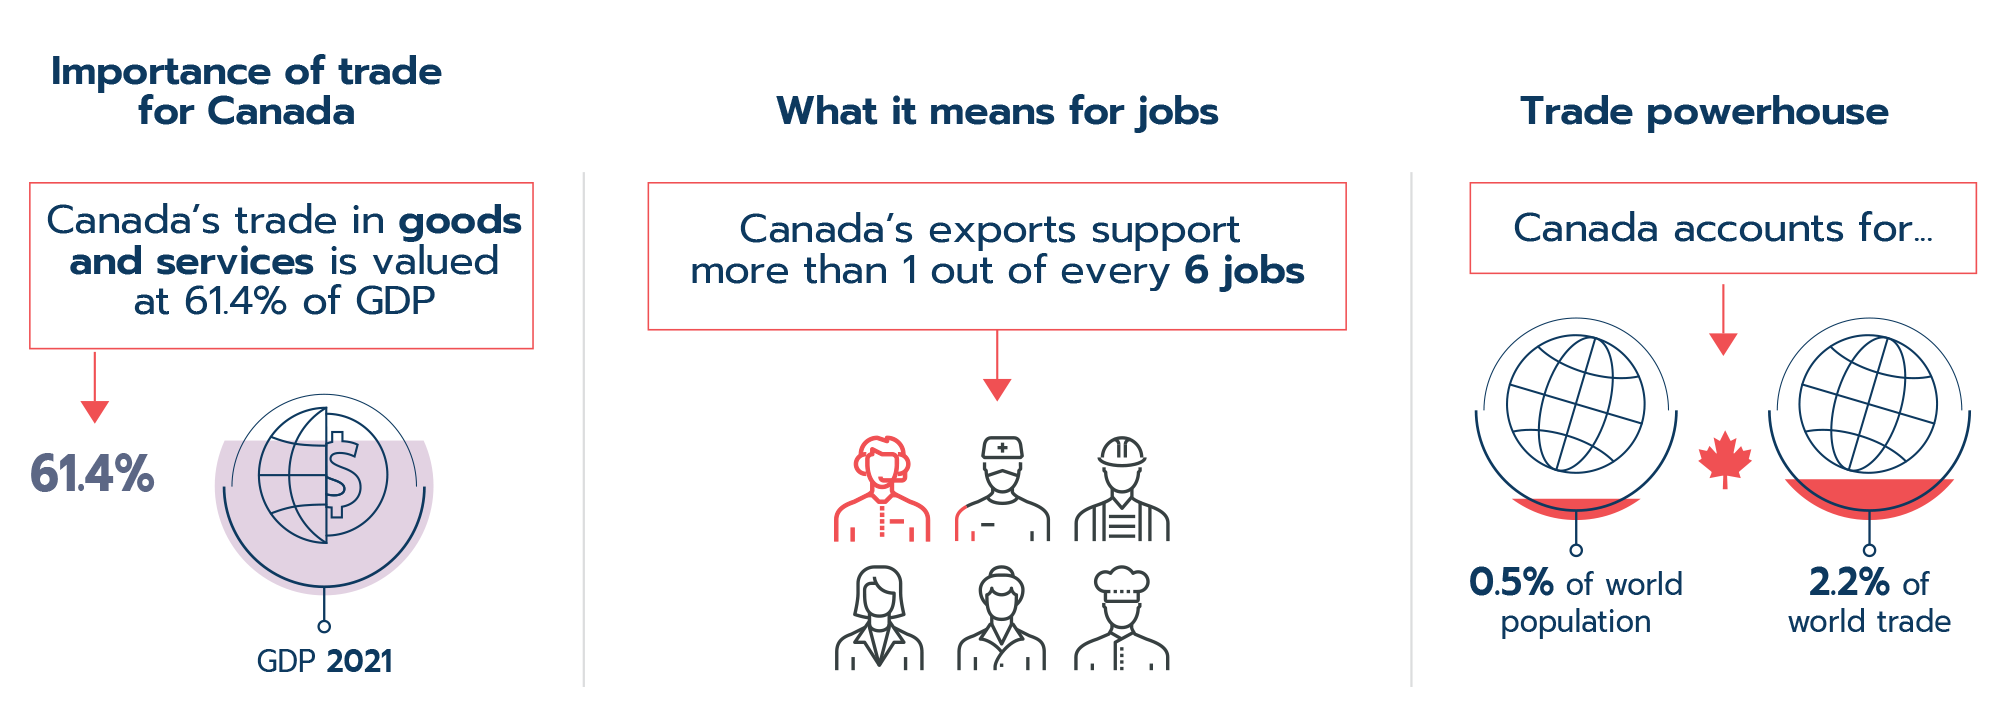

Text version - Canada's exports to several markets had a record-breaking year
There are a series of 3 graphics on Canada's trade:
- Importance of trade for Canada.
- Canada's trade in goods and services is valued at 61.4% of GDP (depicted by a globe icon that is roughly 61% shaded purple)
- What it means for jobs
- Canada's exports support more than 1 out of every 6 jobs (depicted by 6 individuals in work clothing with 1.1 of them coloured in red)
- Trade powerhouse
- Canada accounts for 0.5% of the world's population, but 2.2% of the world's trade (depicted by 2 globes, one with a small slice coloured in red representing Canada's share of the world's population, and the other with a larger slice coloured in red representing Canada's share of the world's trade).
Canada's exports to several markets had a record-breaking year
| Trade partner | 2021 export record value |
|---|---|
| Total exports | $766.3 billion |
| U.S. | $549.7 billion |
| Japan | $16.3 billion |
| South Korea | $7.4 billion |
| Taiwan | $3.0 billion |
| Spain | $2.6 billion |
| Indonesia | $2.4 billion |
Sources: Statistics Canada, International Monetary Fund, World Bank. Calculation of the OCE.
While Canada’s economy ended the year slightly below pre-pandemic levels, its international trade had a record-breaking year.Footnote 1 After a historical crash in 2020, Canada's 2-way trade in goods and services rose 14.1% in 2021 to reach a new record high of $1.53 trillion in value (up 0.2% from 2019). Exports were up 18.3% to $766 billion—a new record high—while imports advanced 10.2% to $764 billion, which remained 2.3% below 2019 levels (Figure 1.8).
Figure 1.8: Canada quickly recovered from 2020 hit
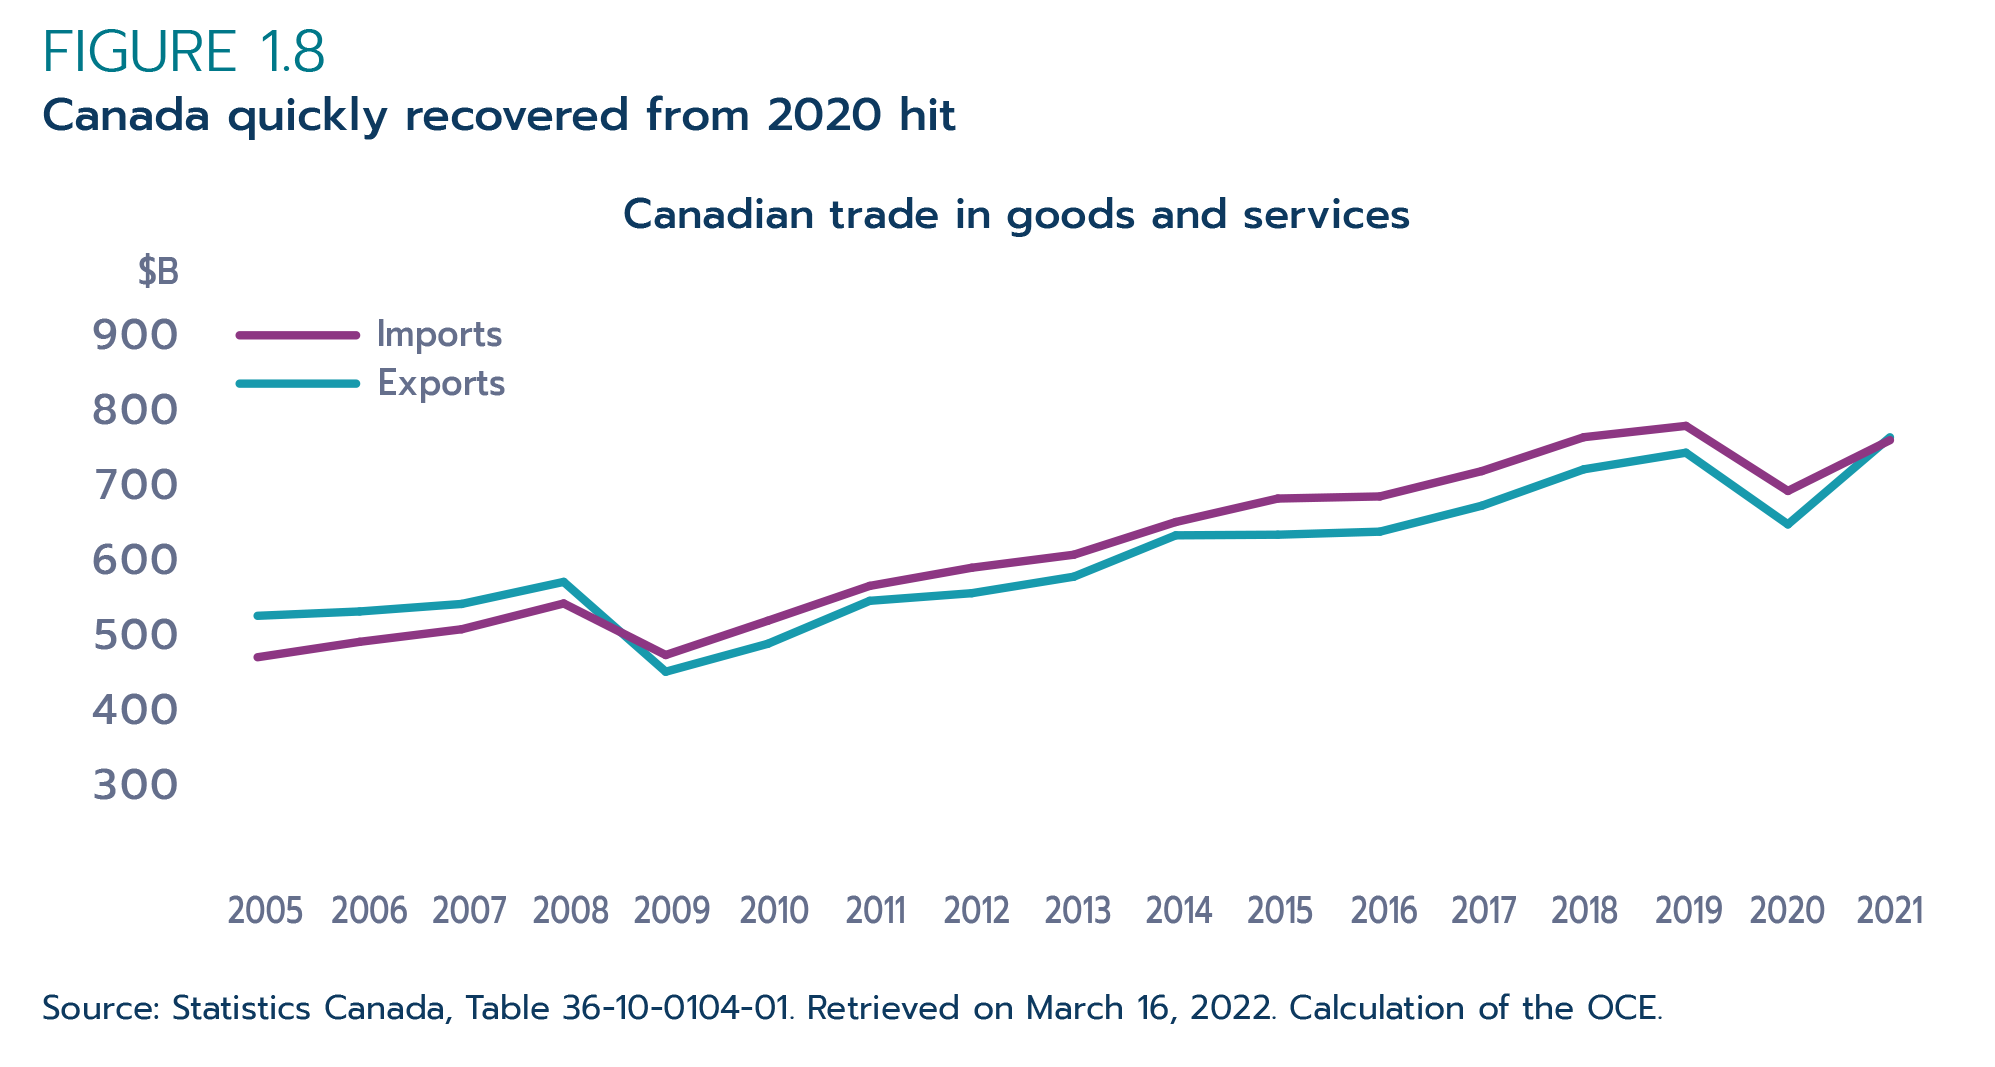
Text version - Figure 1.8
Canadian trade in goods and services ($ billions)
| Year | Import | Export |
|---|---|---|
| 2005 | 468 | 524 |
| 2006 | 489 | 530 |
| 2007 | 506 | 540 |
| 2008 | 541 | 570 |
| 2009 | 471 | 448 |
| 2010 | 517 | 486 |
| 2011 | 565 | 544 |
| 2012 | 589 | 555 |
| 2013 | 607 | 577 |
| 2014 | 651 | 633 |
| 2015 | 683 | 634 |
| 2016 | 686 | 638 |
| 2017 | 720 | 673 |
| 2018 | 766 | 723 |
| 2019 | 782 | 745 |
| 2020 | 693 | 648 |
| 2021 | 764 | 766 |
Source: Statistics Canada, Table 36-10-0104-01. Retrieved on May 31, 2022. Calculation of the OCE.
Goods trade had a stellar year
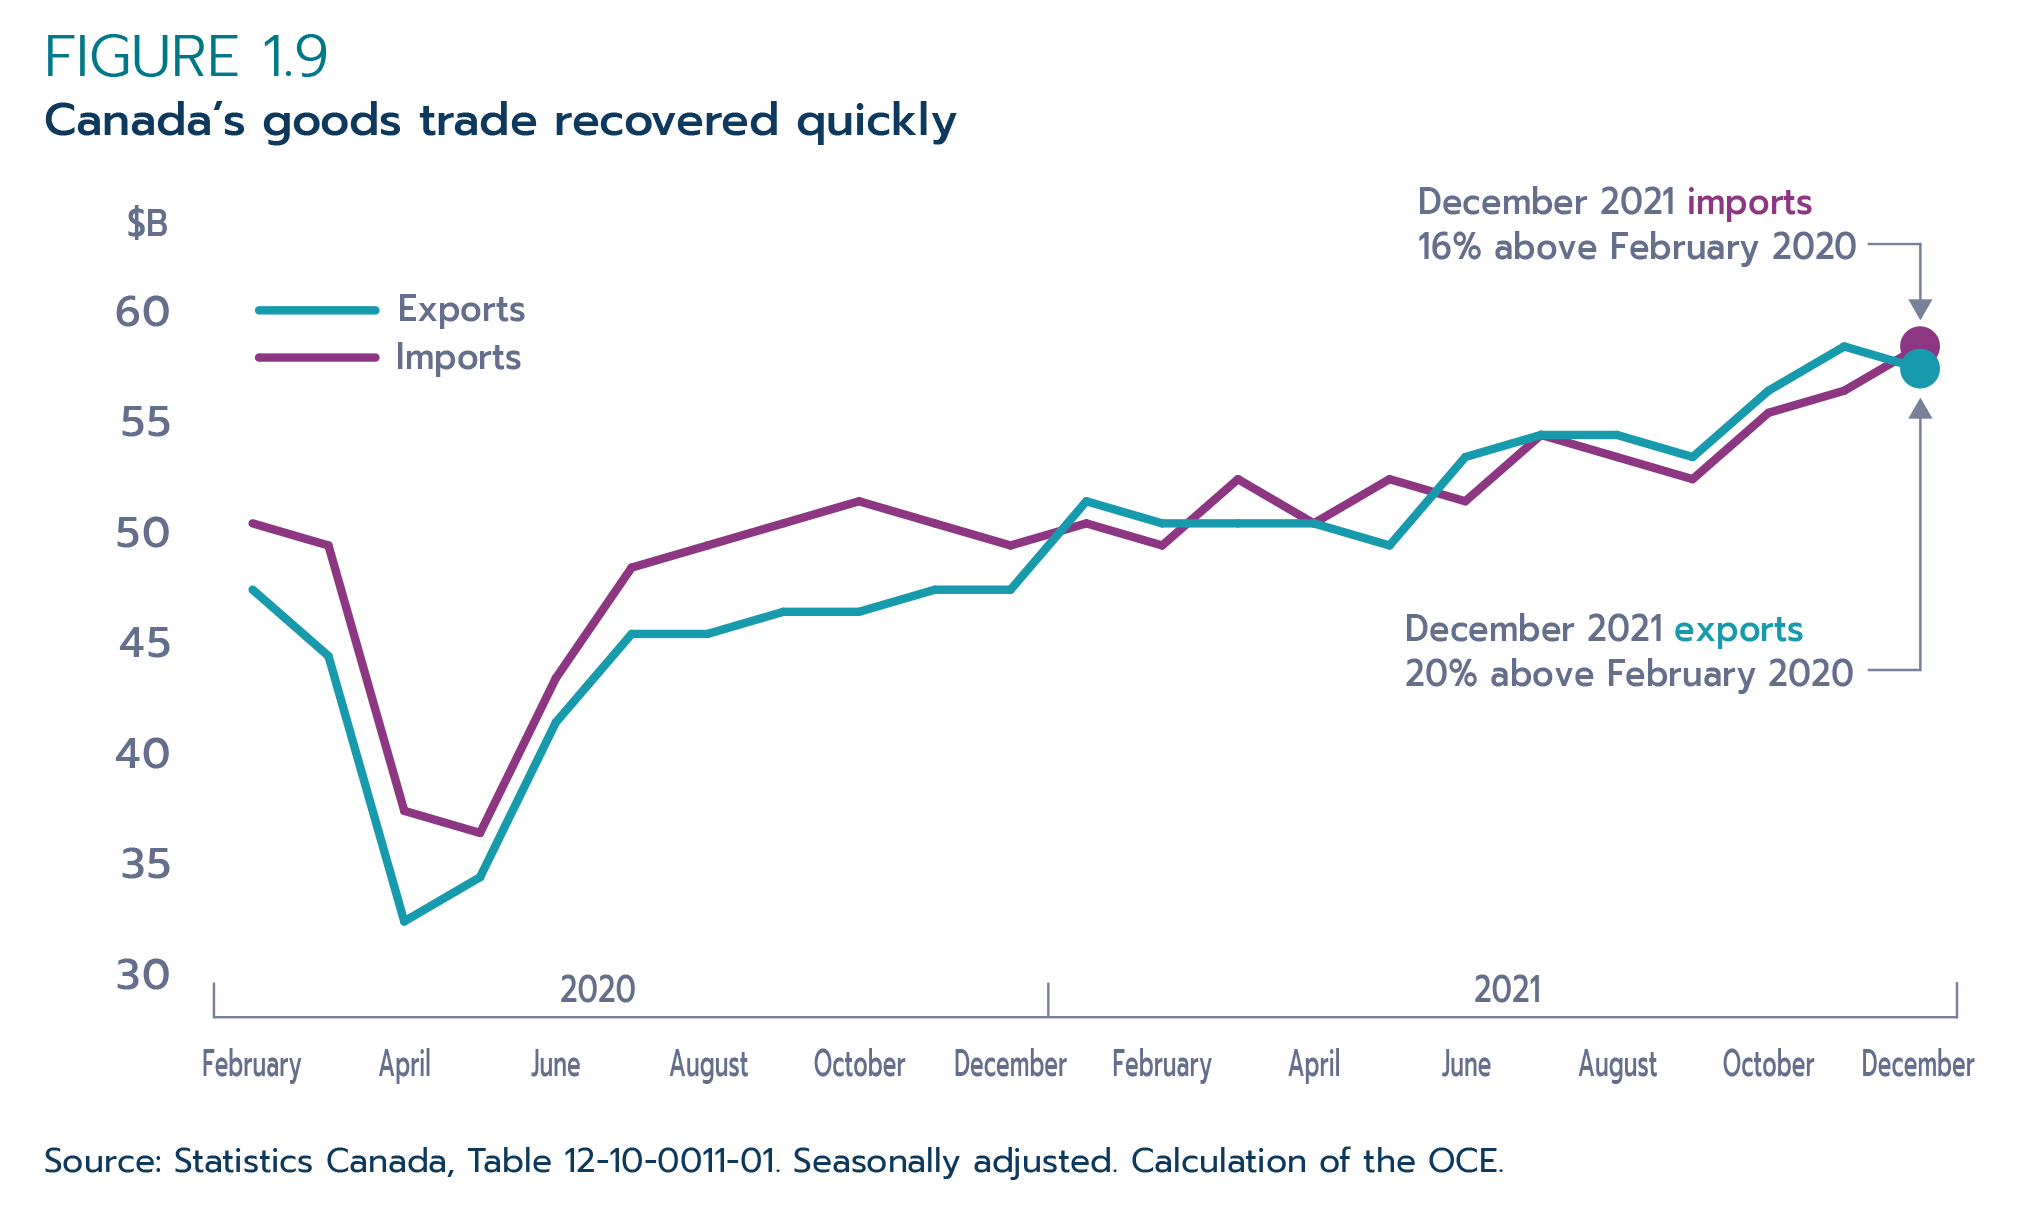
The historical growth in Canada's international trade was mainly due to a recovery in its trade of goods. Following a $125-billion decline in 2020, Canada's 2-way trade in goods increased by nearly $184 billion in 2021 to reach a new record high of $1.27 trillion in value (Figure 1.9). This represented 17.0% growth from 2020, putting total goods trade 4.8% above pre-pandemic levels in 2019.
Figure 1.9: Canada's goods trade recovered quickly
Text version - Figure 1.9
($ billions)
| Exports | Imports | ||
|---|---|---|---|
| 2020 | February | 47 | 50 |
| March | 44 | 49 | |
| April | 32 | 37 | |
| May | 34 | 36 | |
| June | 41 | 43 | |
| July | 45 | 48 | |
| August | 45 | 49 | |
| September | 46 | 50 | |
| October | 46 | 51 | |
| November | 47 | 50 | |
| December | 47 | 49 | |
| 2021 | January | 51 | 50 |
| February | 50 | 49 | |
| March | 50 | 52 | |
| April | 50 | 50 | |
| May | 49 | 52 | |
| June | 53 | 51 | |
| July | 54 | 54 | |
| August | 54 | 53 | |
| September | 53 | 52 | |
| October | 56 | 55 | |
| November | 58 | 56 | |
| December | 57 | 58 |
Source: Statistics Canada, Table 12-10-0011-01. Seasonally adjusted. Calculation of the OCE.
Goods exports registered an especially strong performance. Supported by resource products, Canadian goods exports were up by 21.9% in 2021 to $636 billion in value (a new record). However, these figures reflect changes to the value of exports, which include both volume and price effects (Box 1.1). The 2021 historical growth was largely due to elevated commodity prices. When the effects of prices are removed, the volume of Canada's goods exports only rose by 1.9% in 2021, still 5.3% below pre-pandemic levels in 2019. In contrast, the 12.4% rise in the value of Canada's goods imports (to $632 billion) was driven by both prices and volumes. In fact, the volume of imports increased 8.6% in 2021.
Box 1.1: Price or quantity effect? The impacts of the pandemic on Canadian exports
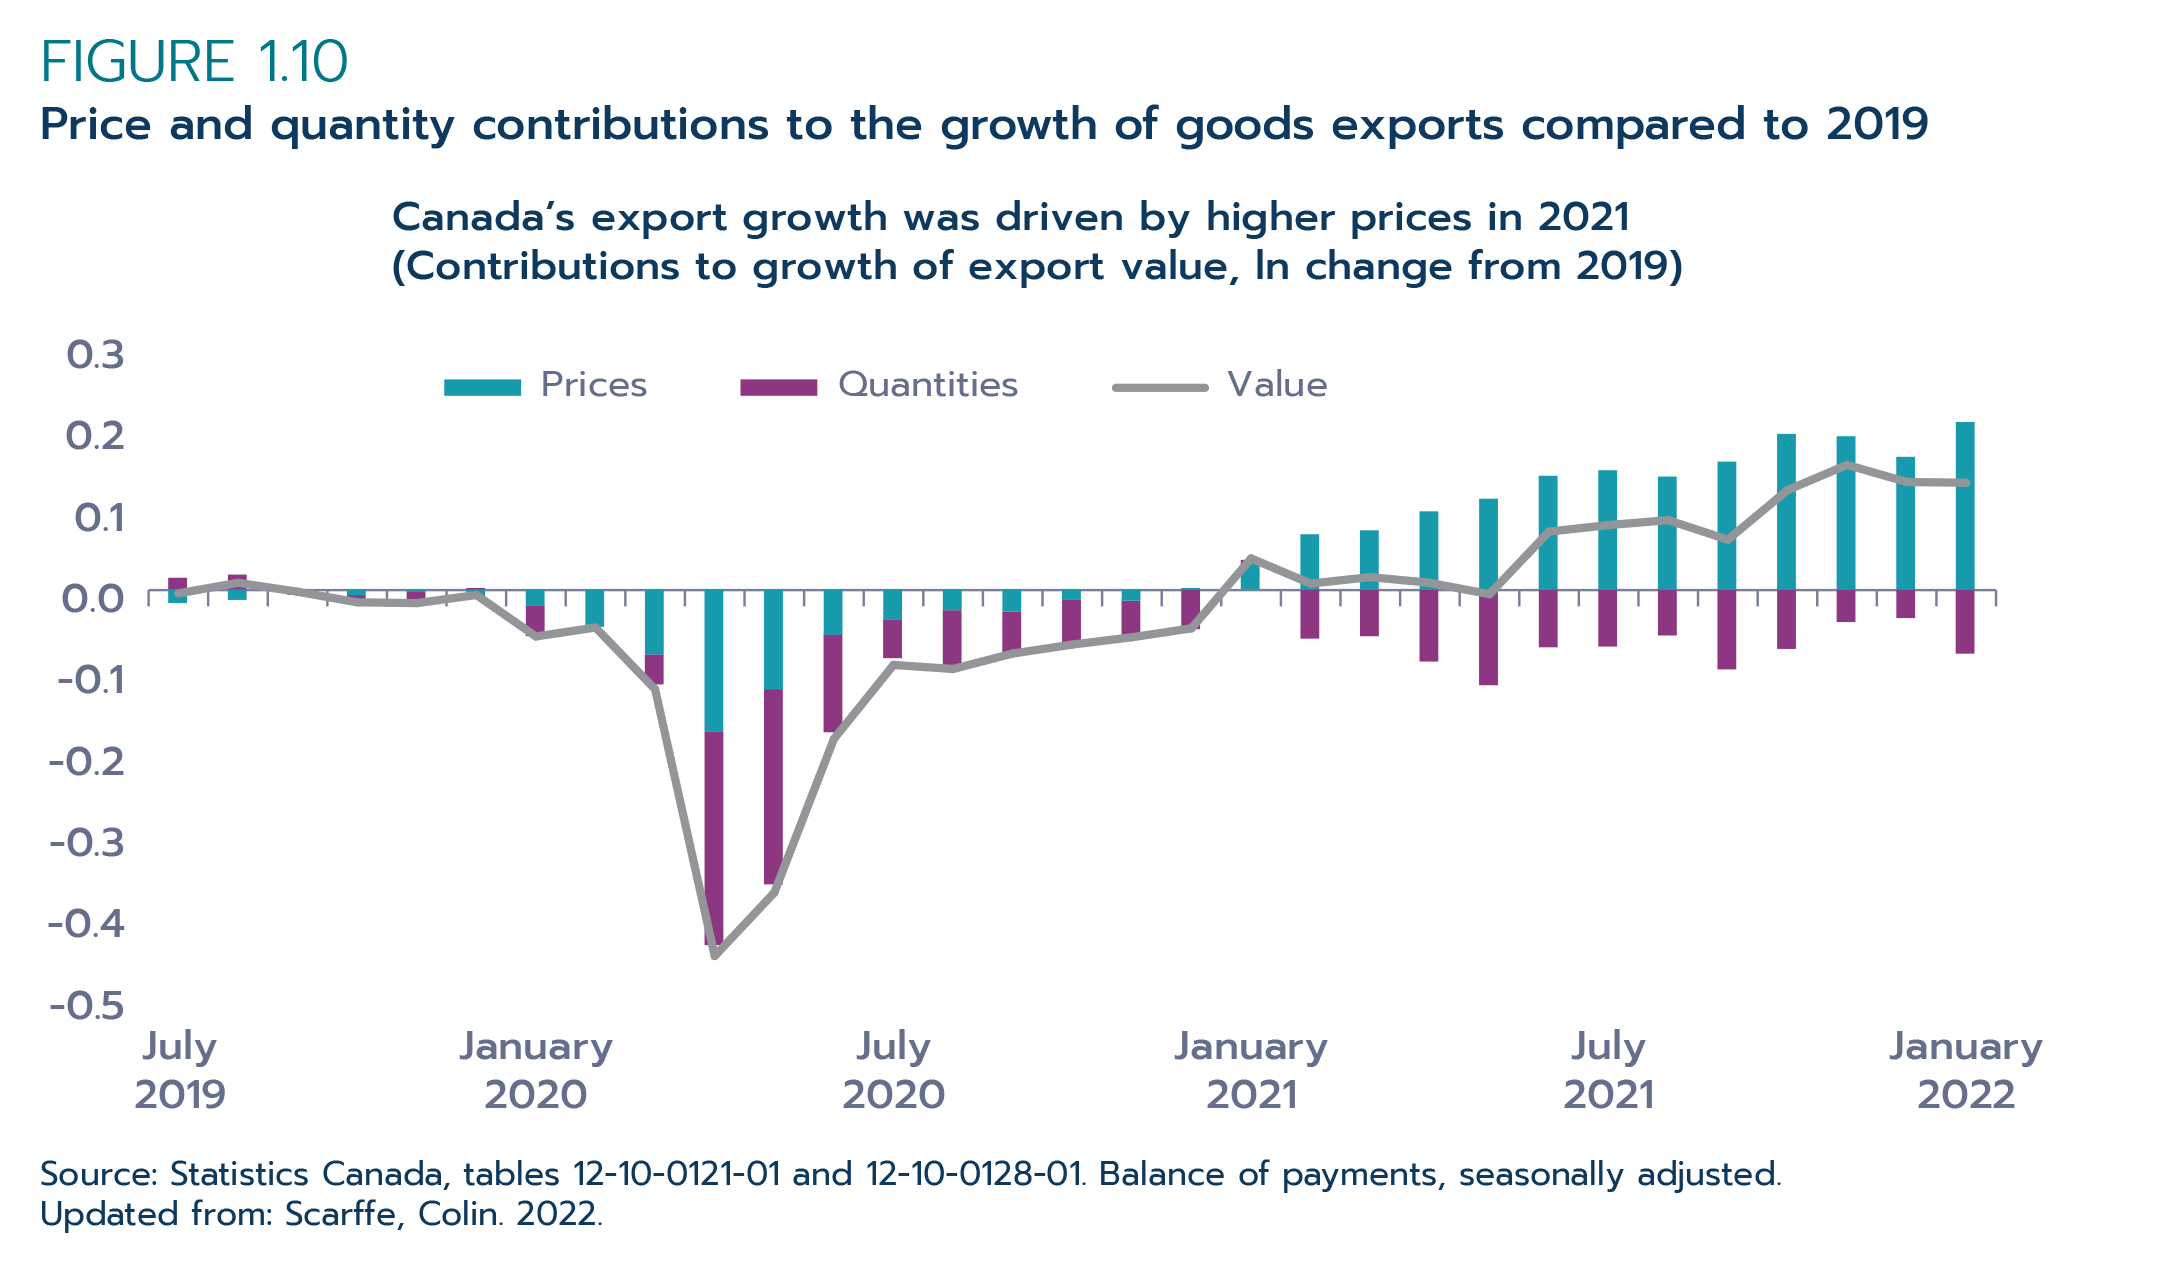
Between January and December 2021, the value of goods exports increased 9.9%—a strong year of growth by any standards. However, Figure 1.10 points to a curious event: this growth was actually the product of 2 offsetting trends. Over the course of 2021, export prices increased 14.7%, while the quantity (volume) of exported goods decreased 4.1%.
Figure 1.10: Price and quantity contributions to the growth of goods exports compared to 2019Footnote 2
Text version - Figure 1.10
Canada's export growth was driven by higher prices in 2021
(Contributions to growth of export value, ln change from 2019)
| Month | Value | Prices | Quantities |
|---|---|---|---|
| Jan-19 | -0.034 | -0.029 | -0.006 |
| Feb-19 | -0.028 | 0.005 | -0.035 |
| Mar-19 | 0.013 | 0.025 | -0.010 |
| Apr-19 | 0.024 | 0.030 | -0.005 |
| May-19 | 0.053 | 0.021 | 0.032 |
| Jun-19 | 0.002 | -0.012 | 0.016 |
| Jul-19 | -0.004 | -0.017 | 0.015 |
| Aug-19 | 0.009 | -0.013 | 0.019 |
| Sep-19 | -0.002 | -0.005 | -0.002 |
| Oct-19 | -0.015 | -0.007 | -0.011 |
| Nov-19 | -0.016 | -0.003 | -0.016 |
| Dec-19 | -0.006 | -0.010 | 0.002 |
| Jan-20 | -0.057 | -0.020 | -0.039 |
| Feb-20 | -0.046 | -0.047 | 0.000 |
| Mar-20 | -0.122 | -0.082 | -0.038 |
| Apr-20 | -0.450 | -0.180 | -0.270 |
| May-20 | -0.372 | -0.126 | -0.247 |
| Jun-20 | -0.183 | -0.057 | -0.124 |
| Jul-20 | -0.092 | -0.038 | -0.049 |
| Aug-20 | -0.097 | -0.026 | -0.074 |
| Sep-20 | -0.078 | -0.028 | -0.056 |
| Oct-20 | -0.067 | -0.013 | -0.056 |
| Nov-20 | -0.058 | -0.014 | -0.046 |
| Dec-20 | -0.047 | 0.002 | -0.050 |
| Jan-21 | 0.039 | 0.032 | 0.006 |
| Feb-21 | 0.008 | 0.070 | -0.062 |
| Mar-21 | 0.016 | 0.075 | -0.059 |
| Apr-21 | 0.009 | 0.099 | -0.091 |
| May-21 | -0.005 | 0.115 | -0.121 |
| Jun-21 | 0.072 | 0.144 | -0.073 |
| Jul-21 | 0.080 | 0.151 | -0.072 |
| Aug-21 | 0.086 | 0.143 | -0.058 |
| Sep-21 | 0.062 | 0.162 | -0.101 |
| Oct-21 | 0.123 | 0.197 | -0.075 |
| Nov-21 | 0.154 | 0.194 | -0.041 |
| Dec-21 | 0.133 | 0.168 | -0.036 |
| Jan-22 | 0.132 | 0.212 | -0.081 |
Source: Statistics Canada, tables 12-10-0121-01 and 12-10-0128-01. Balance of payments, seasonally adjusted. Calculation of the OCE.
Updated from: Scarffe, Colin. 2022. “Price or quantity effect? The impacts of the pandemic on Canadian trade.” Global Affairs Canada. Ottawa.
The initial observation that strong export prices masked weak export quantities raised the question of whether a few products drove the trend or whether the trends were broad-based. Oil prices continued to significantly affect Canadian exports. The overall export price decline in 2020 was due entirely to the decrease in the price of oil. Likewise, the increase in the price of oil in 2021 accounted for 5.5 percentage points of the increase in export prices—yet this was only about a third of the total increase. Prices increased for 87 of the 101 exported products between January and December 2021Footnote 3. Thus while oil played a large role, the increase in export prices in 2021 was largely widespread and was not the result of an increase in price of a single product.
Similarly, regarding the quantity of goods exported, the implications of the observed trends differ depending on whether the cause can be attributed to a single product or widespread softness. Between January and December 2021, airplanes were the largest contributor to decreased export quantities. Low exports of airplanes can likely be attributed to lower demand due to the pandemic, as well as the generally intermittent nature of export sales of the products. However, 57 of the 101 products had lower quantities exported in December than they did in January. While this represents fewer products than the number of those experiencing price increases, a measure of concentration determined that the weakness was broad-based, indicating a more general slowdown.
In sum, the strength of Canada's 2021 export value was driven by prices, while quantities declined. The broad-based increase in export prices happened as economies around the world experienced the highest inflation in decades. Likewise, no single product was responsible for the lower export quantities. Both the increase in the prices and the decrease in quantity of goods exported were the symptoms of broader economic conditions.
Strong growth was broad-based across many different sectors
The substantial growth in goods exports was primarily driven by higher exports of natural resources. Energy products, Canada's top export sector by far in 2021, led all sectors and expanded by 81.4% to a record high of nearly $135 billion in value (Table 1.1). This $61-billion increase in exports represented more than half of the total growth in Canada's goods exports. Exports of energy products were up mainly due to higher exports of crude oil. Besides energy products, forestry products, and metal and non-metallic mineral products each recorded growth of over $10 billion in value. Most other product sectors also recorded significant growth in 2021. Motor vehicles and parts was the only sector that contracted, falling by 4.3% or $3.3 billion, largely due to the prolonged global semiconductor shortage disrupting production activity.
Table 1.1: Value of Canadian goods trade in 2021 by product sector
| Industry | Value ($B) | Change (%) | Change ($B) |
|---|---|---|---|
| Exports | |||
| Farm, fishing and intermediate food products | 47.5 | 9.2 | 4.0 |
| Energy products | 134.8 | 81.4 | 60.5 |
| Metal ores and non-metallic minerals | 25.7 | 23.9 | 4.9 |
| Metal and non-metallic mineral products | 76.6 | 15.3 | 10.2 |
| Basic and industrial chemical, plastic and rubber products | 39.0 | 29.7 | 8.9 |
| Forestry products and building and packaging materials | 54.8 | 31.7 | 13.2 |
| Industrial machinery, equipment and parts | 37.9 | 5.6 | 2.0 |
| Electronic and electrical equipment and parts | 27.0 | 4.9 | 1.3 |
| Motor vehicles and parts | 72.0 | -4.3 | -3.3 |
| Aircraft and other transportation equipment and parts | 24.2 | 7.1 | 1.6 |
| Consumer goods | 79.2 | 14.0 | 9.7 |
| Total | 636.3 | 21.9 | 114.1 |
| Imports | |||
| Farm, fishing and intermediate food products | 23.7 | 10.8 | 2.3 |
| Energy products | 32.1 | 39.2 | 9.0 |
| Metal ores and non-metallic minerals | 15.4 | -6.5 | -1.1 |
| Metal and non-metallic mineral products | 58.8 | 18.3 | 9.1 |
| Basic and industrial chemical, plastic and rubber products | 51.8 | 25.7 | 10.6 |
| Forestry products and building and packaging materials | 30.2 | 16.2 | 4.2 |
| Industrial machinery, equipment and parts | 68.9 | 13.9 | 8.4 |
| Electronic and electrical equipment and parts | 74.2 | 9.1 | 6.2 |
| Motor vehicles and parts | 95.1 | 8.3 | 7.3 |
| Aircraft and other transportation equipment and parts | 19.9 | 2.4 | 0.5 |
| Consumer goods | 136.3 | 7.2 | 9.2 |
| Total | 631.7 | 12.4 | 69.7 |
Source: Statistics Canada, Table 12-10-0122-01. Retrieved on May 31, 2022. Calculation of the OCE.
On the import side, 10 out of 11 product sectors expanded in 2021. Consumer goods, the top import sector accounting for over one fifth of Canadian imports, increased by 7.2% to $136.3 billion in value. This growth was mainly because of increased imports of pharmaceutical and medicinal products, which included COVID-19 vaccines. Other import sectors with strong growth were basic and industrial chemical, plastic and rubber products, metal and non-metallic mineral products, and energy products. The only import sector that declined over the course of 2021 was metal ores and non-metallic minerals. Imports in this sector contracted by 6.5% largely because of lower imports of "other metal ores and concentrates".
Trade with the U.S. drove the rebound
Canada's goods exports experienced strong expansions to most of its top trading partners in 2021. Goods exports to the United States (U.S.) were up by $101 billion or 26.9%, representing almost 90% of the growth in export value for the full year (Table 1.2). This growth was largely driven by increased exports of energy products such as crude oil. As the rate of growth for exports to the U.S. outpaced that of other markets, the U.S. share of Canadian goods exports edged up 3 percentage points to 74.9%. At the same time, Canadian goods imports from the U.S. also registered a double-digit growth of 12.2%.
Table 1.2: Canadian goods trade with top 10 trading partners in 2021
| Partner | Value ($B) | Change (%) | Change ($B) |
|---|---|---|---|
| Exports | |||
| United States | 476.7 | 26.9 | 101.0 |
| European Union | 31.0 | 9.1 | 2.6 |
| China | 28.6 | 10.2 | 2.7 |
| United Kingdom | 18.2 | -14.3 | -3.0 |
| Japan | 14.6 | 17.0 | 2.1 |
| Mexico | 8.9 | 32.7 | 2.2 |
| South Korea | 6.4 | 34.1 | 1.6 |
| Hong Kong | 3.6 | 87.2 | 1.7 |
| Switzerland | 3.2 | -34.8 | -1.7 |
| Norway | 3.2 | 22.6 | 0.6 |
| Other partners | 42.0 | 11.8 | 4.4 |
| Total | 636.3 | 21.9 | 114.1 |
| Imports | |||
| United States | 392.9 | 12.2 | 42.8 |
| European Union | 57.2 | 12.3 | 6.3 |
| China | 57.2 | 15.5 | 7.7 |
| Mexico | 19.6 | 15.4 | 2.6 |
| Japan | 11.2 | 11.7 | 1.2 |
| United Kingdom | 10.0 | 6.6 | 0.6 |
| South Korea | 8.6 | 14.8 | 1.1 |
| Switzerland | 7.3 | -29.2 | -3.0 |
| Brazil | 6.7 | 15.0 | 0.9 |
| Hong Kong | 4.9 | 18.0 | 0.7 |
| Other partners | 56.2 | 18.7 | 8.9 |
| Total | 631.7 | 12.4 | 69.7 |
Source: Statistics Canada, Table 36-10-0023-01. Retrieved on May 31, 2022. Calculation of the OCE.
China and Mexico were also important drivers of export growth. After an unprecedented fall in 2019 due to various trade disputes, Canada's goods exports to China improved for 2 consecutive years, despite the effects of the pandemic. In 2021, goods exports advanced by 10.2% (or $2.7 billion) to reach $28.6 billion in value, mainly supported by higher exports of metallurgical coal. Goods exports to Mexico posted the third-fastest rate of growth out of all of Canada's main export destinations, advancing by 32.7% in 2021 to $8.9 billion in value. This significant growth was mainly driven by farm, fishing and intermediate food products. Over the same period, goods imports from China advanced 15.5% with broad-based gains across many sectors, and goods imports from Mexico were up by 15.4%.
Services trade recovered slightly
Canada's services trade began to recover in 2021 (Figure 1.11). However, the recovery was much slower when compared to goods trade. For the full year, Canadian services trade increased by 1.9% to $262 billion in value, with services exports growing by 3.3% and services imports advancing only 0.6% (Table 1.3). Overall services trade remained 17.4% below 2019 levels in 2021.
Figure 1.11: Services trade only began to recover in the second quarter of 2021

Text version - Figure 1.11
$ billions
| Exports | Imports | ||
|---|---|---|---|
| 2020 | February | 11.7 | 14.6 |
| March | 11.0 | 13.4 | |
| April | 10.1 | 9.9 | |
| May | 9.9 | 9.5 | |
| June | 9.9 | 9.9 | |
| July | 9.9 | 9.6 | |
| August | 10.1 | 9.6 | |
| September | 10.3 | 10.1 | |
| October | 10.4 | 10.1 | |
| November | 10.5 | 10.1 | |
| December | 10.4 | 10.0 | |
| 2021 | January | 10.4 | 10.4 |
| February | 10.3 | 10.0 | |
| March | 10.5 | 10.0 | |
| April | 10.4 | 10.3 | |
| May | 10.5 | 10.4 | |
| June | 10.6 | 10.7 | |
| July | 10.7 | 10.9 | |
| August | 10.9 | 11.1 | |
| September | 11.1 | 12.0 | |
| October | 11.4 | 11.8 | |
| November | 11.7 | 11.9 | |
| December | 11.9 | 12.3 |
Source: Statistics Canada, Table 12-10-0144-01. Seasonally adjusted. Calculation of the OCE.
Table 1.3: Value of Canadian services trade in 2021 by type
| Category | Value ($B) | Change (%) | Change ($B) |
|---|---|---|---|
| Exports | |||
| Travel | 16.5 | -9.1 | -1.7 |
| Transportation | 14.8 | 8.5 | 1.2 |
| Commercial services | 97.3 | 5.0 | 4.6 |
| Government services | 1.4 | 4.1 | 0.1 |
| Total | 130.0 | 3.3 | 4.2 |
| Imports | |||
| Travel | 9.6 | -40.5 | -6.6 |
| Transportation | 26.7 | 14.9 | 3.5 |
| Commercial services | 94.2 | 4.1 | 3.7 |
| Government services | 1.5 | 7.9 | 0.1 |
| Total | 132.1 | 0.6 | 0.8 |
Source: Statistics Canada, Table 36-10-0021-01. Retrieved on May 31, 2022. Calculation of the OCE.
Commercial services fared better than transport and travel
The negative economic impacts of COVID-19 public health restrictions were especially significant for services sectors like travel and transportation that involved face-to-face interactions. Transportation services partially recovered in 2021, with transportation services exports and imports rebounding by 8.5% and 14.9%, respectively. Yet transportation services trade was still 18.8% below 2019 levels. In contrast, despite signs of recovery in the second half of 2021, Canada's total travel services trade contracted for a second consecutive year, with exports falling 9.1% and imports decreasing by over 40% from the year prior.
Commercial services was the one services sector that was largely unaffected by the global pandemic. The resilience in this sector was in part due to businesses adapting to the difficult situation by accelerating their digital transformation (KPMG, 2021). Overall, after a small dip in early 2020, Canada's commercial services exports quickly recovered and surpassed their pre-pandemic levels. Similarly, commercial services imports held steady throughout the past 2 years. For the full year 2021, commercial services exports and imports rose by 5.0% and 4.1%, respectively, from 2020 levels.
Services import sources and export destinations
After posting double-digit declines in 2020, Canada's services trade rebounded with many partners in 2021. Nevertheless, services trade with most of Canada's key trading partners remained below 2019 levels. Similar to goods exports, services exports to the U.S. led all countries and expanded by $4.9 billion in 2021 to reach $73.0 billion (Table 1.4). As Canada's overall services exports only expanded by $4.2 billion in total, increased exports to the U.S. represented the largest growth by far and resulted in the U.S. share of Canadian services exports rising from 54.2% in 2020 to 56.2% in 2021—the largest share since 2005. Services exports to the U.S. rose primarily due to a 6.5% increase in exports of commercial services. At the same time, services imports from the U.S. declined for a second consecutive year, falling by 2.5% in 2021 to $70.5 billion, as the $2.2-billion increase in commercial services imports was more than offset by a $3.8-billion decrease in imports of travel services.
Table 1.4: Canadian services trade with top 10 trading partners in 2021
| Partner | Value ($B) | Change (%) | Change ($B) |
|---|---|---|---|
| Exports | |||
| United States | 73.0 | 7.2 | 4.9 |
| European Union | 15.2 | 4.2 | 0.6 |
| United Kingdom | 6.0 | 3.3 | 0.2 |
| China | 5.2 | -9.1 | -0.5 |
| India | 4.4 | -12.5 | -0.6 |
| Switzerland | 2.0 | 2.4 | 0.0 |
| Mexico | 1.9 | 17.4 | 0.3 |
| Hong Kong | 1.8 | 0.9 | 0.0 |
| Japan | 1.6 | 3.1 | 0.0 |
| Australia | 1.0 | -1.7 | 0.0 |
| Other partners | 17.9 | -4.0 | -0.8 |
| Total | 130.0 | 3.3 | 4.2 |
| Imports | |||
| United States | 70.5 | -2.5 | -1.8 |
| European Union | 18.1 | 11.7 | 1.9 |
| United Kingdom | 8.1 | -5.2 | -0.4 |
| Hong Kong | 5.5 | 29.3 | 1.3 |
| Japan | 2.8 | 7.2 | 0.2 |
| China | 2.6 | 10.5 | 0.2 |
| Singapore | 2.6 | 27.8 | 0.6 |
| India | 2.4 | -1.3 | 0.0 |
| Switzerland | 1.7 | 1.3 | 0.0 |
| Mexico | 1.5 | -35.8 | -0.8 |
| Other partners | 16.3 | -2.1 | -0.4 |
| Total | 132.1 | 0.6 | 0.8 |
Source: Statistics Canada, Table 12-10-0157-01. Retrieved on May 31, 2022. Calculation of the OCE.
Outside of the U.S., Canada's services exports to other top trading partners only improved marginally in 2021. Supported by commercial services, Canadian services exports to the European Union (second-largest destination as a group) and the United Kingdom rose by 4.2% and 3.3%, respectively, in 2021. Services exports to Japan also rose 3.1% on the back of higher exports of travel and transportation services. Bucking the trend, services exports to China posted another decline, falling by 9.1% year-over-year. On the import side, services imports from the EU rebounded significantly, growing by 11.7%, as travel, transportation, and commercial services all increased. Services imports from the U.K. fell 5.2% due to lower imports of commercial services. In Asia, services imports from China and Japan recorded strong growth.
1.4 Canadian foreign direct investment performance
Key data

Text version - Stock of foreign direct investment in Canada, ultimate investor country basis, 2021
Stock of foreign direct investment in Canada, ultimate investor country basis, 2021
| Continent | Value 2021 | % share |
|---|---|---|
| North America | $567B | 52% |
| Europe | $290B | 27% |
| Asia & Oceania | $139B | 13% |
| South & Central America | $19B | 2% |
| Africa | $633M | 0.1% |
Note: Shares may not add to 100% due to rounding.
Source: Statistics Canada. Calculation of the OCE.
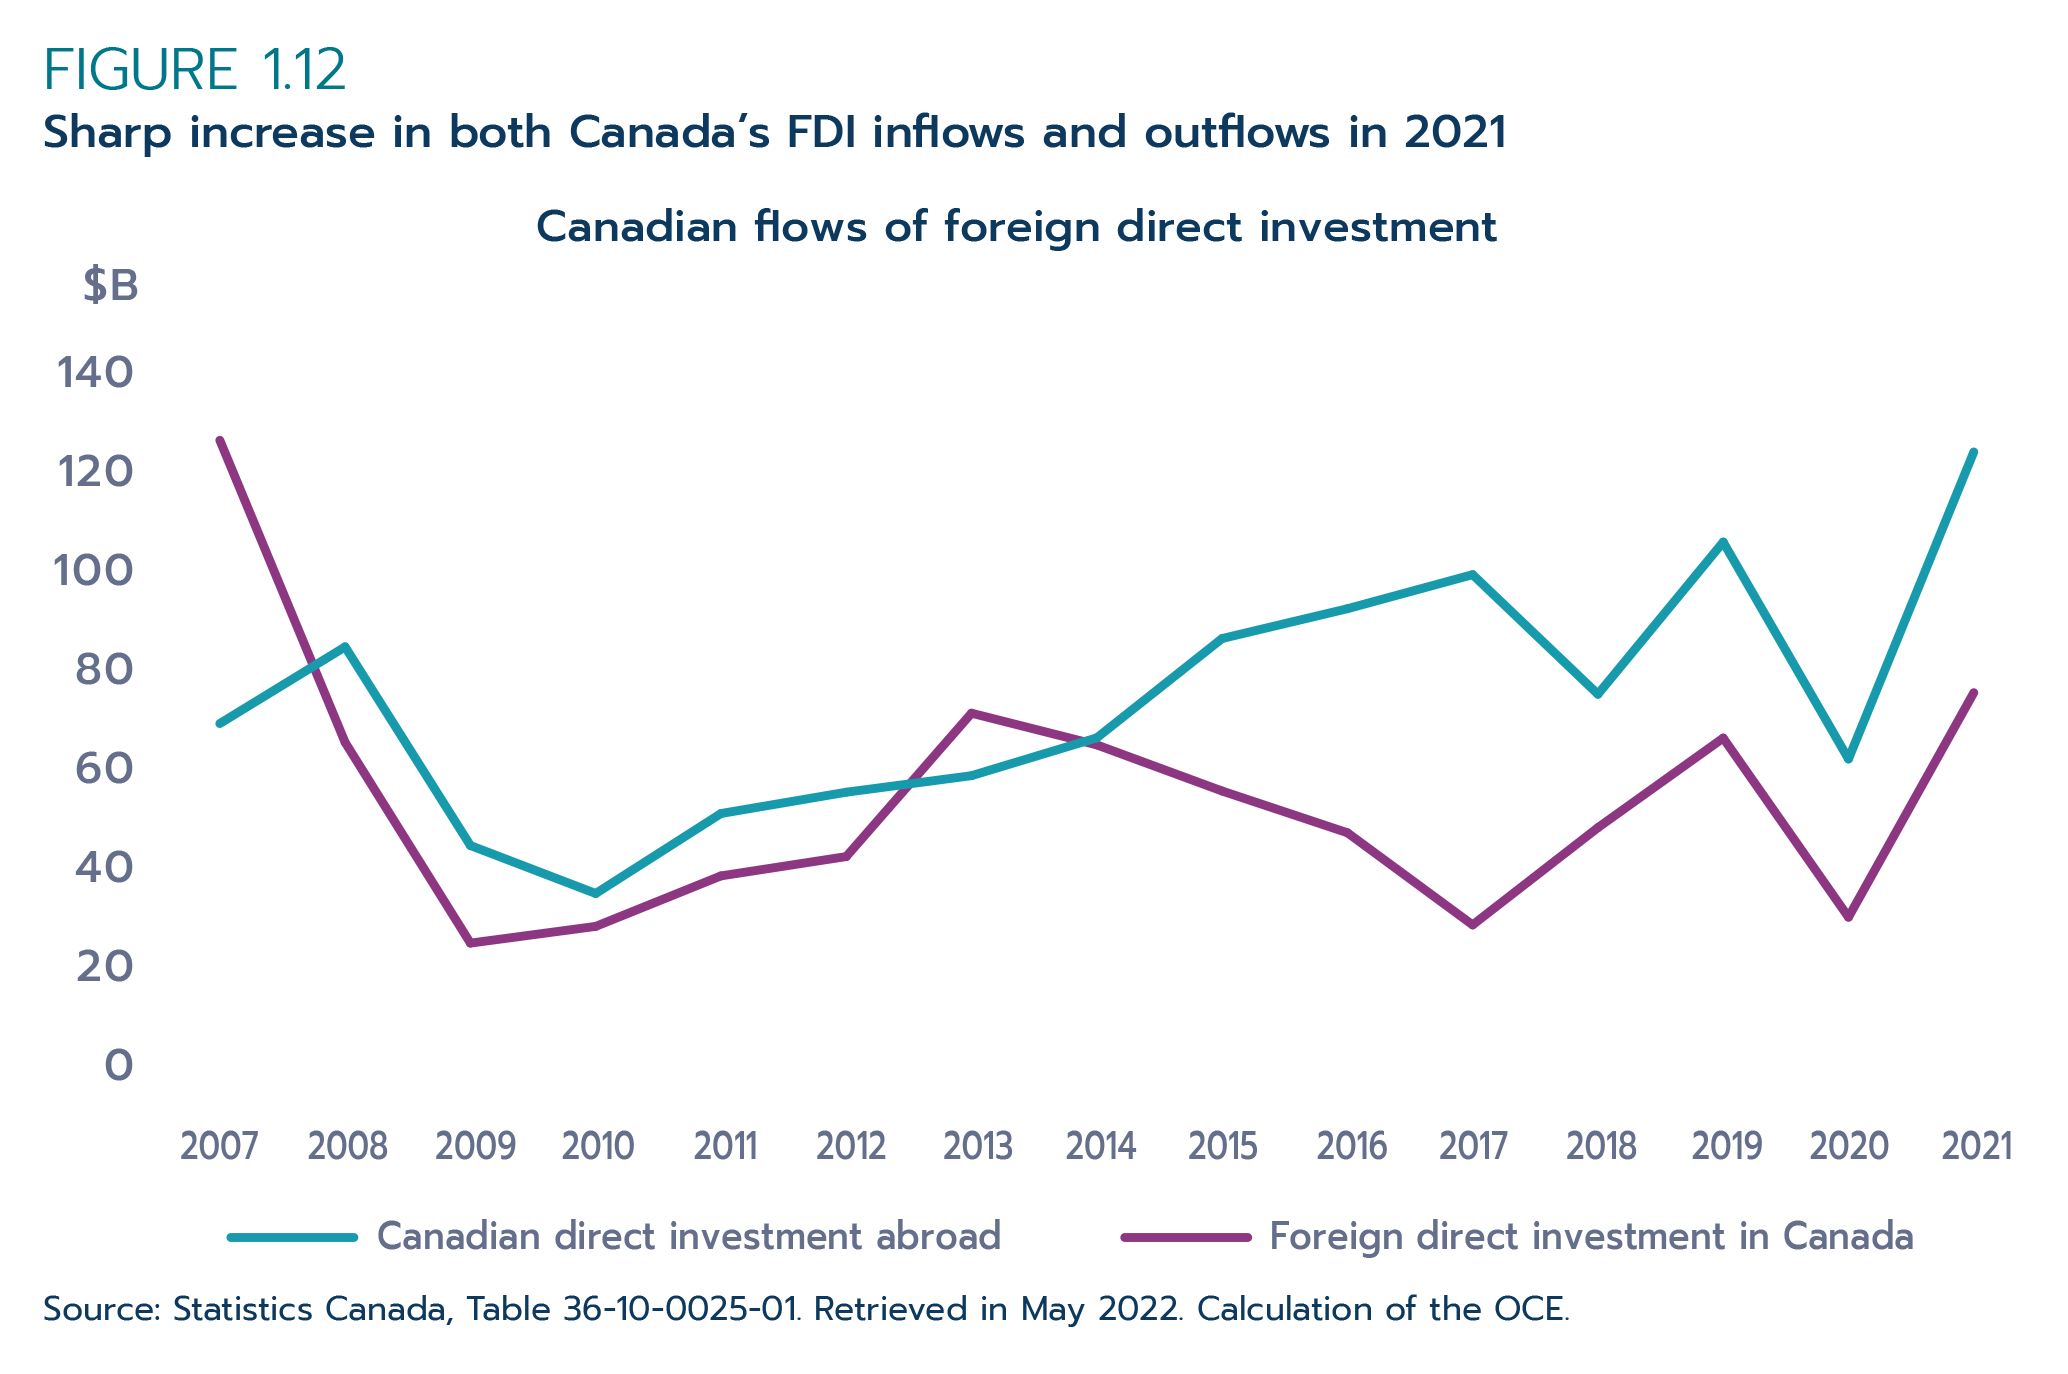
Mirroring the strong rebound in global foreign direct investment (FDI) flows, there was a solid recovery in both Canadian direct investment abroad (CDIA) and inward FDI in 2021 (Figure 1.12). Unlike the slow recovery following the 2007-08 global financial crisis and subsequent recession, CDIA and FDI flows rebounded quickly in 2021, with both surpassing their pre-pandemic levels. CDIA flows reached a record high of $123 billion in 2021, up 97% from 2020 and substantially higher than the $73-billion average of the 2010-2019 decade. Similarly, FDI inflows recorded the highest level since 2007 at $76 billion, representing a 143% increase from 2020 and 52% higher than the 2010-2019 average.
Figure 1.12: Sharp increase in both Canada’s FDI inflows and outflows in 2021
Text version - Figure 1.12
Canadian flows of foreign direct investment ($ millions)
| Canadian direct investment abroad | Foreign direct investment in Canada | |
|---|---|---|
| 2007 | 69,416 | 125,476 |
| 2008 | 84,592 | 65,679 |
| 2009 | 45,268 | 25,948 |
| 2010 | 35,770 | 29,257 |
| 2011 | 51,602 | 39,254 |
| 2012 | 55,819 | 43,076 |
| 2013 | 59,091 | 71,459 |
| 2014 | 66,584 | 65,186 |
| 2015 | 86,242 | 56,057 |
| 2016 | 92,140 | 47,796 |
| 2017 | 98,888 | 29,550 |
| 2018 | 75,221 | 48,803 |
| 2019 | 105,333 | 66,538 |
| 2020 | 62,400 | 31,082 |
| 2021 | 123,169 | 75,515 |
Source: Statistics Canada, Table 36-10-0025-01. Retrieved in May 2022. Calculation of the OCE.
Mergers and acquisitions (M&As) contributed to most of the growth in CDIA, reaching the highest value since 2017 at $64 billion in 2021 and an annual growth of 242%. Reinvested earnings, or earnings from foreign affiliates invested back in the foreign affiliates rather than repatriated, rose at a much lower rate (52%). Conversely, Canada's growth in FDI inflows was largely due to a substantial increase in reinvested earnings. In 2021, reinvested earnings totaled $38 billion—over 10 times the level in 2020 and the highest value recorded since 2007, when it started being tracked. M&As also contributed to the growth in FDI inflows, increasing by 30% from 2020.
Sectoral composition of CDIA and FDI
The trade and transportation sector accounted for almost half of the $123 billion in CDIA flows in 2021, surpassing the finance and insurance sector, which historically held the largest shares of outward investments by Canada. CDIA in the trade and transportation sector grew by more than a factor of 25, from $2.3 billion to $60 billion; it is likely that the Canadian Pacific Railway acquisition of Kansas City Southern (CP, 2021), completed in the last quarter of 2021, contributed to that increase. Management of companies as well as the energy and mining sectors also posted increases in CDIA flows in 2021, but not enough to match the historically high flows of 2019. Finance and insurance, manufacturing and "other industries" saw lower flows in 2021.
With respect to FDI inflows, the manufacturing, and energy and mining sectors accounted for almost half of the $76 billion inflows of 2021, followed by the trade and transportation sector. The management of companies sector received the least flows of FDI in 2021; the flows were 47% lower than in 2020. Among all sectors, including "other industries", management of companies was the only sector in which the 2021 flows remained below its 2010-2019 average.
The majority of the $44-billion increase in FDI flows recorded in 2021 was invested in the energy and mining sector, which went from a $8.8-billion disinvestment in 2020 to $17 billion in 2021. This injection of new investment into the sector was well above the 2014-2019 annual average but below the pre-pandemic level. Inflows in the manufacturing sector also greatly increased to reach $19 billion, 3 times that of the inflows in 2020. Finance and insurance, trade and transportation and "other industries" also posted growth, while investment flows in the management of companies and enterprises sector contracted and fell below 2019 levels.
Table 1.5: CDIA and FDI flows by sector (2021)
| CDIA | Value ($B) | Change (%) | Change ($B) |
|---|---|---|---|
| Energy and mining | 11.6 | 40.5 | 3.4 |
| Manufacturing | 2.1 | -63.0 | -3.6 |
| Trade and transportation | 59.6 | 2,542.0 | 57.3 |
| Finance and insurance | 29.7 | -2.0 | -0.6 |
| Management of companies and enterprises | 13.8 | 144.5 | 8.2 |
| Other industries | 6.4 | -38.0 | -3.9 |
| Total | 123.2 | 97.4 | 60.8 |
| FDI | Value ($B) | Change (%) | Change ($B) |
| Energy and mining | 16.6 | n/a | 25.4 |
| Manufacturing | 19.2 | 215.7 | 13.1 |
| Trade and transportation | 11.4 | 10.9 | 1.1 |
| Finance and insurance | 9.5 | 138.9 | 5.5 |
| Management of companies and enterprises | 4.6 | -46.9 | -4.0 |
| Other industries | 14.3 | 30.5 | 3.3 |
| Total | 75.5 | 143.0 | 44.4 |
Source: Statistics Canada, Table 36-10-0026-01. Retrieved in May 2022. Calculation of the OCE. n/a: not applicable
CDIA destinations and FDI sources
Not surprisingly, the United States remains Canada's top investment partner, as the destination of two thirds ($78 billion) of CDIA and the source of almost half ($35 billion) of all FDI inflows in 2021 (Table 1.6). The U.S. was the main driver for Canada's 2021 investment recovery. About 66% of the $61-billion increase in CDIA flows between 2020 and 2021 were destined to the U.S.; it was the source of nearly half of the $44-billion growth in inflows of FDI.
Luxembourg ranked second among the main CDIA destinations of flows in 2021 (behind the "other countries" category), followed by France and Australia. The large growth in outflows destined for these 3 countries contrasted with limited flows to the United Kingdom and Switzerland, 2 important destinations for CDIA prior to the pandemic. Interestingly, in 2021, CDIA flows to the top 5 destination countries reached their highest levels since 2012 when data on flows were first recorded.
Looking at Canada's FDI sources, the Netherlands was the second main source in 2021, after the U.S., followed by the Cayman Islands and the United Kingdom (after the "other countries" category). With the exception of the 3 Asian partners (China, Japan and Hong Kong) Australia and Switzerland, FDI flows from all top 15 FDI source economies surpassed their pre-pandemic levels.
It should be noted that FDI flows refer to the last country where the investment comes from before arriving in Canada, including intermediary countries through which investments are channeled. While data on the ultimate source country of FDI flows are not available, Statistics Canada does produce data on FDI stock or FDI “positions” on both an ultimate investor country (UIC) and immediate investing country (IIC) basis. These data reveal that investments from some countries that are typically intermediaries, such as the Netherlands and Luxembourg, may have originated from other countries. Conversely, FDI flow data may understate FDI from countries that invest more via intermediaries, such as Japan and China. For more details about foreign investments on the UIC basis, see Chapter 2 of Canada’s State of Trade 2021.
Table 1.6: CDIA and FDI flows (2021)
| CDIA destinations | Value ($B) | Change (%) | Change ($B) |
|---|---|---|---|
| United States | 77.7 | 106.6 | 40.1 |
| Luxembourg | 7.1 | n/a | 7.2 |
| France | 4.2 | 266.3 | 3.1 |
| Australia | 3.2 | 80.4 | 1.4 |
| Brazil | 3.1 | 628.8 | 2.6 |
| Hong Kong | 2.7 | -42.6 | -2.0 |
| United Kingdom | 2.1 | 36.5 | 0.6 |
| Mexico | 1.7 | -57.2 | -2.3 |
| Japan | 1.6 | 500.8 | 1.3 |
| Germany | 1.3 | -32.1 | -0.6 |
| China | 1.0 | -10.9 | -0.1 |
| Switzerland | 0.8 | n/a | 0.9 |
| Cayman Islands | 0.3 | -19.3 | -0.1 |
| Netherlands | 0.2 | -77.3 | -0.6 |
| Barbados | -2.1 | n/a | -5.8 |
| Other countries | 18.4 | 449.6 | 15.0 |
| Total | 123.2 | 97.4 | 60.8 |
| FDI sources | Value ($B) | Change (%) | Change ($B) |
| United States | 35.1 | 132.4 | 20 |
| Netherlands | 9.6 | 67.0 | 3.9 |
| Cayman Islands | 6.4 | 816.3 | 5.7 |
| United Kingdom | 5.0 | 64.4 | 1.9 |
| Luxembourg | 4.1 | n/a | 8.5 |
| France | 3.2 | 442.3 | 2.6 |
| Switzerland | 2.4 | n/a | 6.7 |
| Brazil | 2.3 | 55.6 | 0.8 |
| Germany | 1.6 | 120.1 | 0.9 |
| Australia | 1.1 | n/a | 3.3 |
| Barbados | 0.3 | 29.3 | 0.1 |
| Mexico | 0.1 | -30.5 | -0.1 |
| China | -0.2 | n/a | -0.2 |
| Japan | -0.6 | n/a | -1.3 |
| Hong Kong | -1.2 | n/a | -0.2 |
| Other countries | 6.1 | -57.6 | -8.3 |
| Total | 75.5 | 143.0 | 44.4 |
Source: Statistics Canada, Table 36-10-0473-01. Retrieved in May 2022. Calculation of the OCE. n/a: not applicable
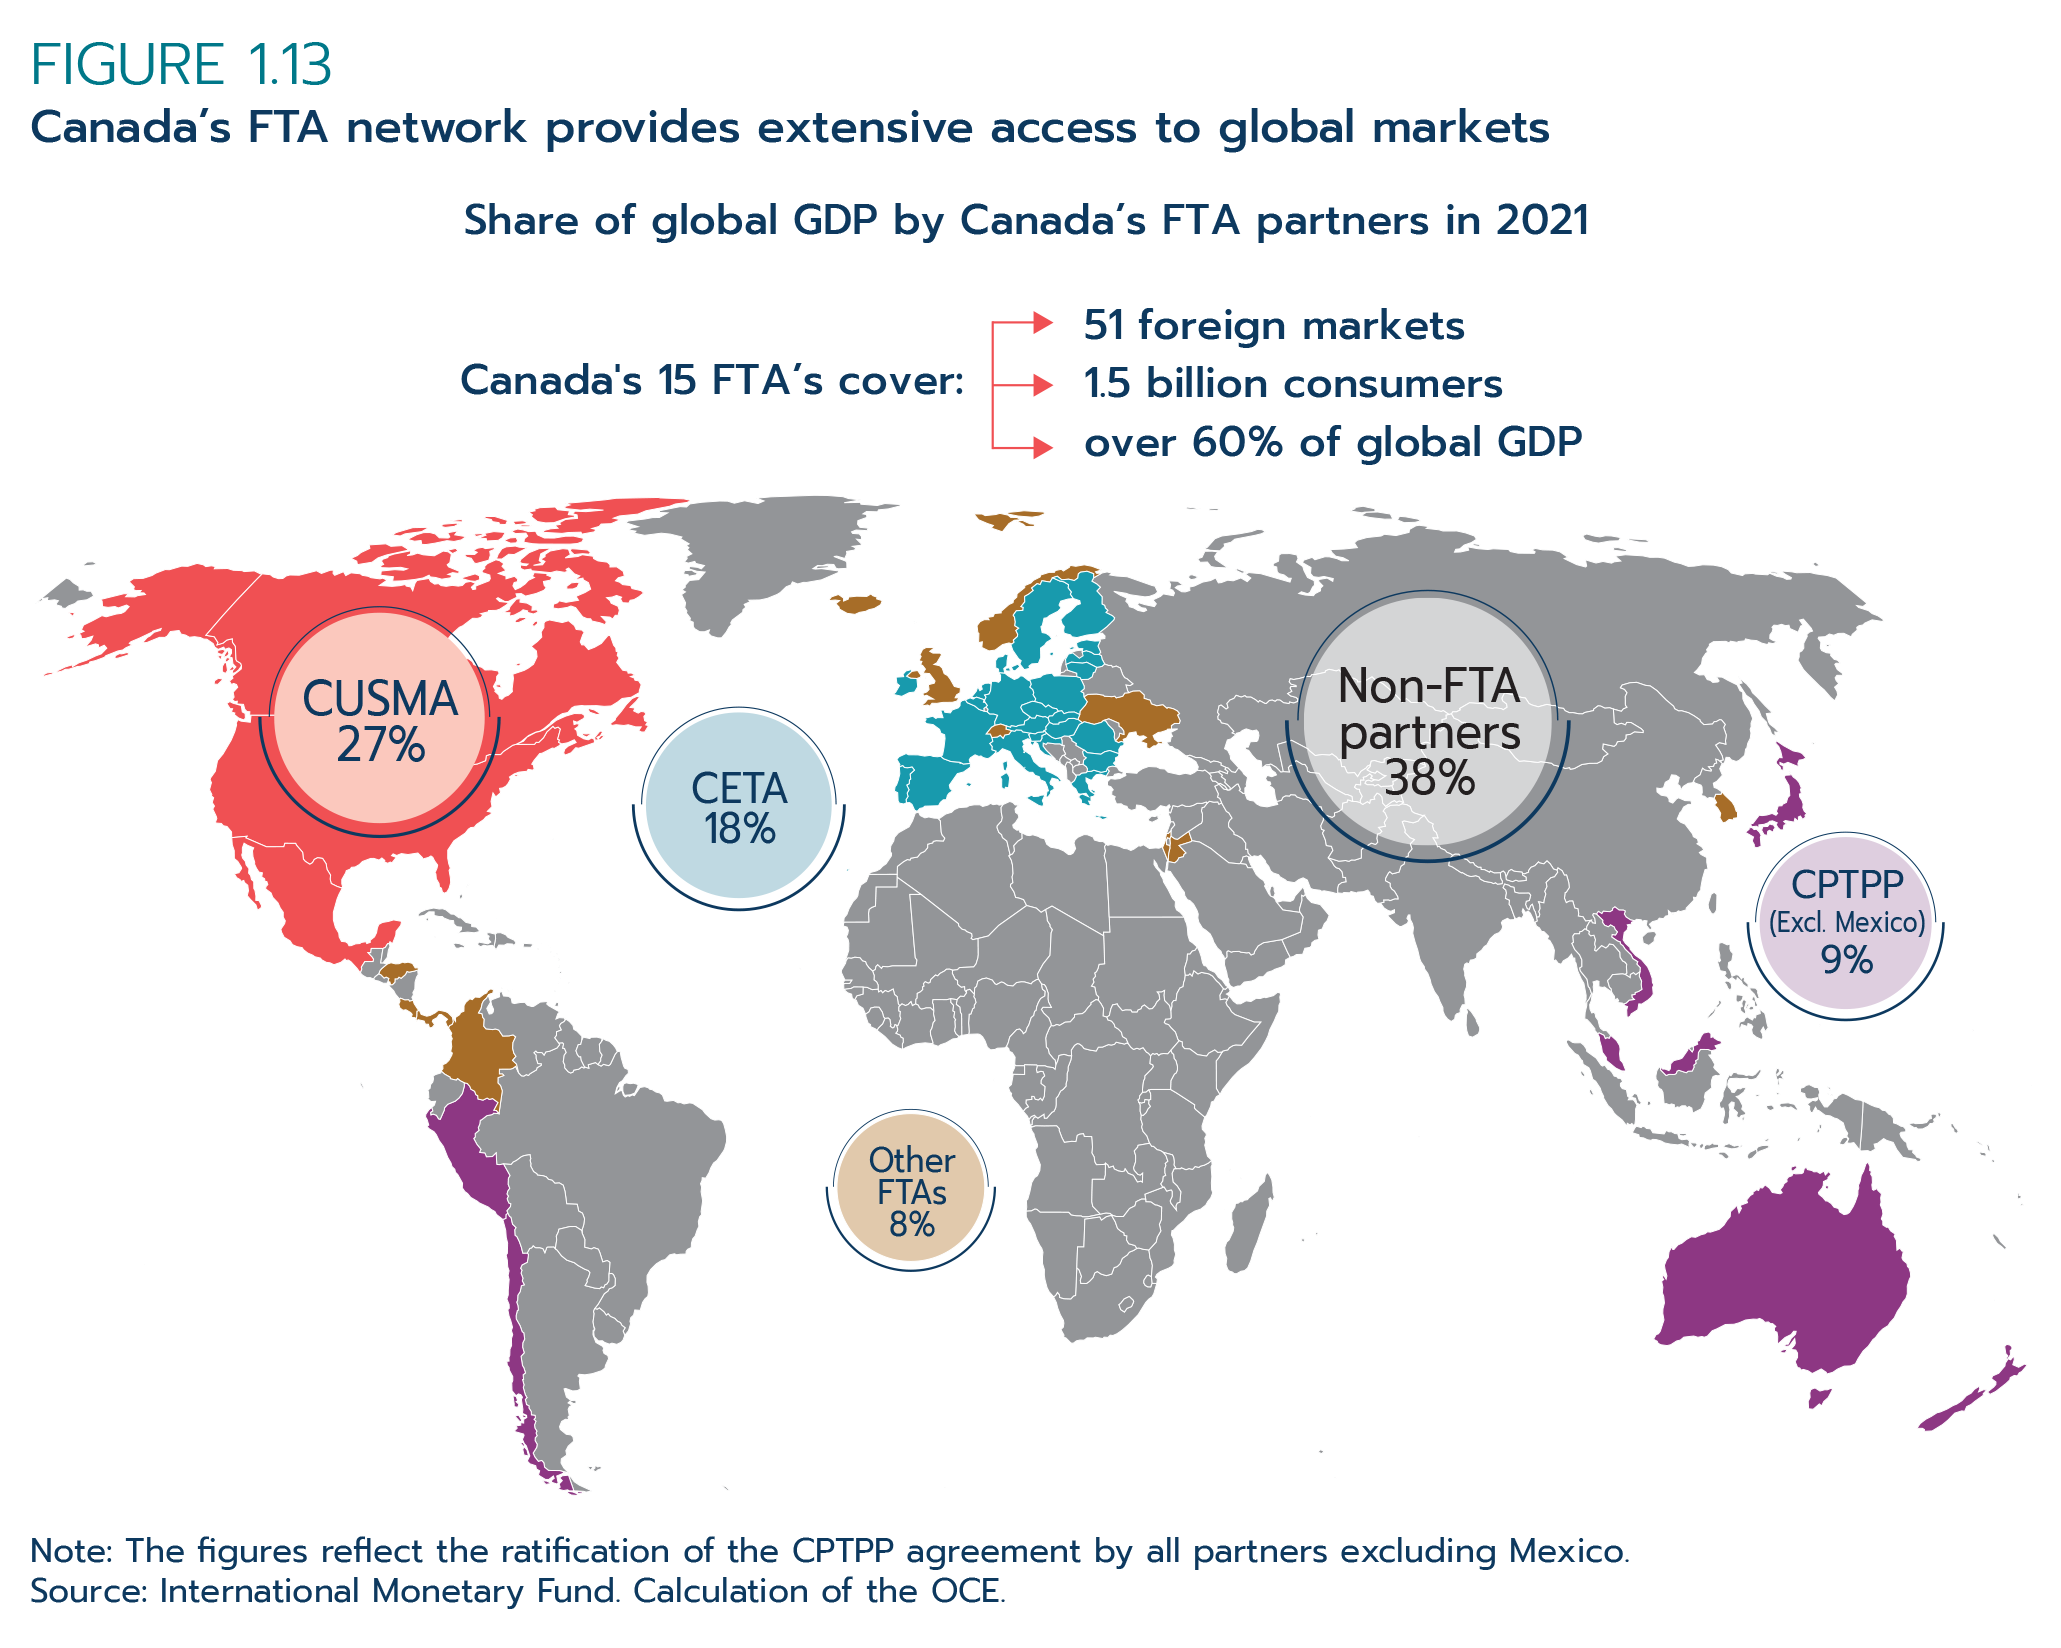
In summary, 2021 was a recovery year for economies around the world including Canada. Businesses continue to experience elevated levels of risk and uncertainty during this recovery period and will need to use all the tools at their disposal to succeed. Free trade agreements (FTAs) are an important way for businesses to reach new markets and ensure that Canada benefits from commercial connections abroad. Canada currently has 15 FTAs that cover 61% of global GDP and give access to 51 foreign markets (Figure 1.13). Part 2 of this document will explore Canada’s experiences with FTAs and highlight Canada’s approach to assessing FTAs to ensure that the benefits of trade are felt by all Canadians.
Figure 1.13: Canada’s FTA network provides extensive access to global markets
Text version - Figure 1.13
Canada's 15 free trade agreements cover:
- 51 foreign markets
- 1.5 billion consumers
- over 60% of global GDP
% Share of global GDP by Canada’s FTA partners in 2021
| FTA | % |
|---|---|
| CUSMA | 27 |
| CETA | 18 |
| CPTPP (excl. Mexico) | 9 |
| Canada’s other FTAs | 8 |
| Non-FTA partners | 38 |
Source: International Monetary Fund. Calculation of the OCE.
Note: The figures reflect ratification of the CPTPP agreement by all partners excluding Mexico.
Part 2: The benefits of free trade agreements
2.0 Introduction
For decades, free trade has been upheld as a central instrument for improving the living standards of individuals across nations. Broad acceptance of the merits of free trade and market-oriented policies over the past decades has contributed to a period of sustained growth and rising prosperity in many parts of the world.
Merits of free trade
The main merits of free trade are well known (GAC, 2012):
- Comparative advantage: Participation in international commerce allows each nation to produce what it is best at producing and to exchange these goods for what other nations are best at producing. Nations can potentially achieve more efficient production and earn higher incomes than in the case where each nation tries to produce everything.
- Economies of scale: While large economies have the potential to achieve significant economies of scale without relying too much on international trade, this is emphatically not the case for Canada and many other small economies. For countries whose economies are similar in size to Canada’s, free trade is almost a necessity, given the sizes of their domestic markets are too small to warrant the minimum scale of production. Access to larger markets therefore becomes critical to providing firms with opportunities to increase the scale of production. The resulting improvement in the scale of production lowers average cost, making production more efficient.
- Market competition and price effects: Free trade enhances market competition. When nations integrate their markets by removing or reducing the barriers to trade, the number of competitors may increase significantly.
- Variety effect: Under freer trade, consumers and producers benefit from a wider variety of goods and intermediate inputs. They are able to buy products from another country that may not be available at the competitive prices offered in their own without free trade.
- Innovation: Free trade generates competitive pressure on firms to innovate and develop new products, processes, ideas, and business practices to survive in a more competitive environment. Free trade also creates an environment conducive to the exchange of new technologies and products.
Evolution of free trade: Multilateral, bilateral and regional free trade agreements
Free trade, as an instrument, was institutionalized under the auspices of the General Agreement on Trade and Tariffs (the GATT) in 1947. The GATT set the stage for multilateral trade liberalization, transforming the global trading system into the present one, which is governed by a set of rules and mechanisms. The GATT orchestrated 8 rounds of multilateral trade negotiations, for example, the Geneva Round in 1947, the Tokyo Round in 1973, the Uruguay Round in 1994, and most recently, the Doha Round, which is still ongoing. The Uruguay Round was concluded with the signing of the Marrakesh Agreement on April 15, 1994, which replaced the GATT with the newly formed World Trade Organization (WTO) in 1995.
Since the inception of the GATT, the number of signatories increased from 23 in 1947 to 164 as of 2021. The average tariff levels for the major GATT participants were about 22% in 1947. After the Uruguay Round, however, the average tariff levels of GATT participants were under 5% (Brown and Irwin, 2017). That said, average tariff levels remained significantly high in many developing economies.
In addition to facilitating tariff reductions, the GATT also rationalized the global trading system by binding the negotiated tariff reductions permanently, establishing the generality of non-discrimination through most-favored nation (MFN) treatmentFootnote 4 and national treatment clauses, ensuring greater transparency of trade policy measures, and providing a forum for the peaceful resolution of bilateral disputes. All of these elements contributed greatly to reducing trade barriers and improving policy certainty.
According to the historian Douglas Irwin, the prosperity of the world economy over the last half century owes a great deal to the growth of world trade that is in turn the result of the foresight of those involved in creating the GATT. Taking a longer-term view, the original GATT architecture helped put the world economy on a sound foundation, thereby improving the livelihoods of hundreds of millions of people around the world (Irwin, 2007).
However, as the WTO expands its membership, it becomes abundantly clear that reaching timely agreements among a large group of countries on a consensus basis at various stages of economic development, with different political and economic systems, values, and preferences is becoming an increasingly difficult task. At the same time, the negotiations of such agreements become even more complicated as the scope of trade liberalization goes beyond tariff reductions, additionally focusing on promoting cooperation among WTO members on a host of beyond-the-border issues. These include regulatory cooperation, intellectual property, government procurement as well as wider social policy issues related to environmental regulations and the protection of labor and human rights.
Due to the complexities associated with the multilateral route to trade liberalization, many countries—both developed and developing—choose the regional or bilateral route. As of 2021, the WTO has been notified of a cumulative 353 bilateral and regional trade agreements that have been put into force. The proliferation of bilateral and regional free trade agreements is reshaping the current landscape of the global trading system, leading people to weigh the merits and the disadvantages of such agreements.
Benefits of bilateral and regional trade agreements
Natural trading partners
Natural trading partners find it easier and quicker to reach a market access agreement because they are geographically close to one another and are already trading extensively with each other.
Shared systems and values
Working with like-minded countries that share similar political systems, values and culture makes it easier to find common ground for beyond-the-border issues in a bilateral or regional environment. These issues are part and parcel to domestic regulatory regimes that are deeply rooted in a country’s political and economic systems, as well as its culture and its religious and social values.
A level playing field
The desire to preserve a level playing field and recoup preferencesFootnote 5 lost due to the formation of an FTA between other trading partners, along with other geo-political and strategic considerations, can motivate a country to launch FTA discussions with a potential new trading partner.
The rise of the mega-regional agreement
A growing trend in recent years has been the formation of the so-called mega-regional trade agreements, which involves the world’s 10 largest economies and many other countries located across different continents. These mega-regional trade agreements include the 11-member Comprehensive and Progressive Agreement for Trans-Pacific Partnership (CPTPP) and the 16-member Regional Comprehensive Economic Partnership (RCEP). These agreements are significant because they account for a significant portion of world trade, covering substantial regulations governing international commerce in a wide range of areas, and therefore can drive up the costs of staying outside these mega-regional trading blocs significantly.
Shortfalls of bilateral and regional trade agreements
In spite of the contribution of increased global trade to global growth and prosperity, both for Canada and the world, some experts have questioned the benefits of the bilateral and regional approaches of FTAs. Critics argue that the proliferation of FTAs may create overlapping rules making it difficult for firms to navigate and to access the benefits of these agreements. Others like Bhagwati and Sriivasan (2002) argue that FTAs discriminate against non-members, who are unable to access the preferential treatment that these agreements create, making FTAs suboptimal from a broader economic welfare perspective.
In a number of jurisdictions, there is ongoing public debate over the extent to which FTAs may contribute to a relative decline in employment and wages of workers in some sectors. Nonetheless, policy-makers and many economists remain convinced by the evidence that FTAs remain an effective policy tool to lower trade barriers, improve market access, promote greater trade between nations and increase economic welfare. This paper explores and assesses many of these issues in closer detail, along with a review of literature, to inform our findings.
Canada’s free trade experience
Canada’s embrace of free trade dates back to the 1850s and 1860s when Canada was part of British North America.
Timeline
In 1854, Britain entered into the Elgin-Marcy Treaty (also known as the Reciprocity Treaty) with the United States of America. As part of British North America, Canada was included in this treaty. However, the U.S. government abrogated the agreement in 1866.
In 1911, the United States agreed to enter into a free trade arrangement with Canada, but this initiative was abandoned when the Liberal government that had initiated the trade discussions lost the election (Policy Options, 2007).
In 1987, Canada and the United States successfully concluded the Canada-United States Free Trade Agreement (CUSFTA). Canada was motivated to enter into the CUSFTA to secure access to the largest market in the world in the face of rising protectionism in the United States. The CUSFTA provided Canada with an opportunity to address its domestic agenda, namely to increase the competitiveness of Canadian industries and to boost its national productivity, which had consistently lagged that of the United States for decades.
The CUSFTA was later expanded to include Mexico, leading to the formation of the North American Free Trade Agreement (NAFTA).
Since the successful implementation of the CUSFTA, Canada has embarked on numerous FTA initiatives and set in motion a series of bilateral and regional trade negotiations that concluded with 15 bilateral and regional trade agreements covering 51 countries across Europe, Latin America and Asia (Figure 2.1). The Comprehensive Economic and Trade Agreement (CETA) allowed Canada to expand trade with its second-largest trading partner, the European Union, which was also one of the world’s largest economies at the time of inception in 2017.
Figure 2.1: Evolution of Canada’s trade: Balance of payments for imports and exports, 1950-2021
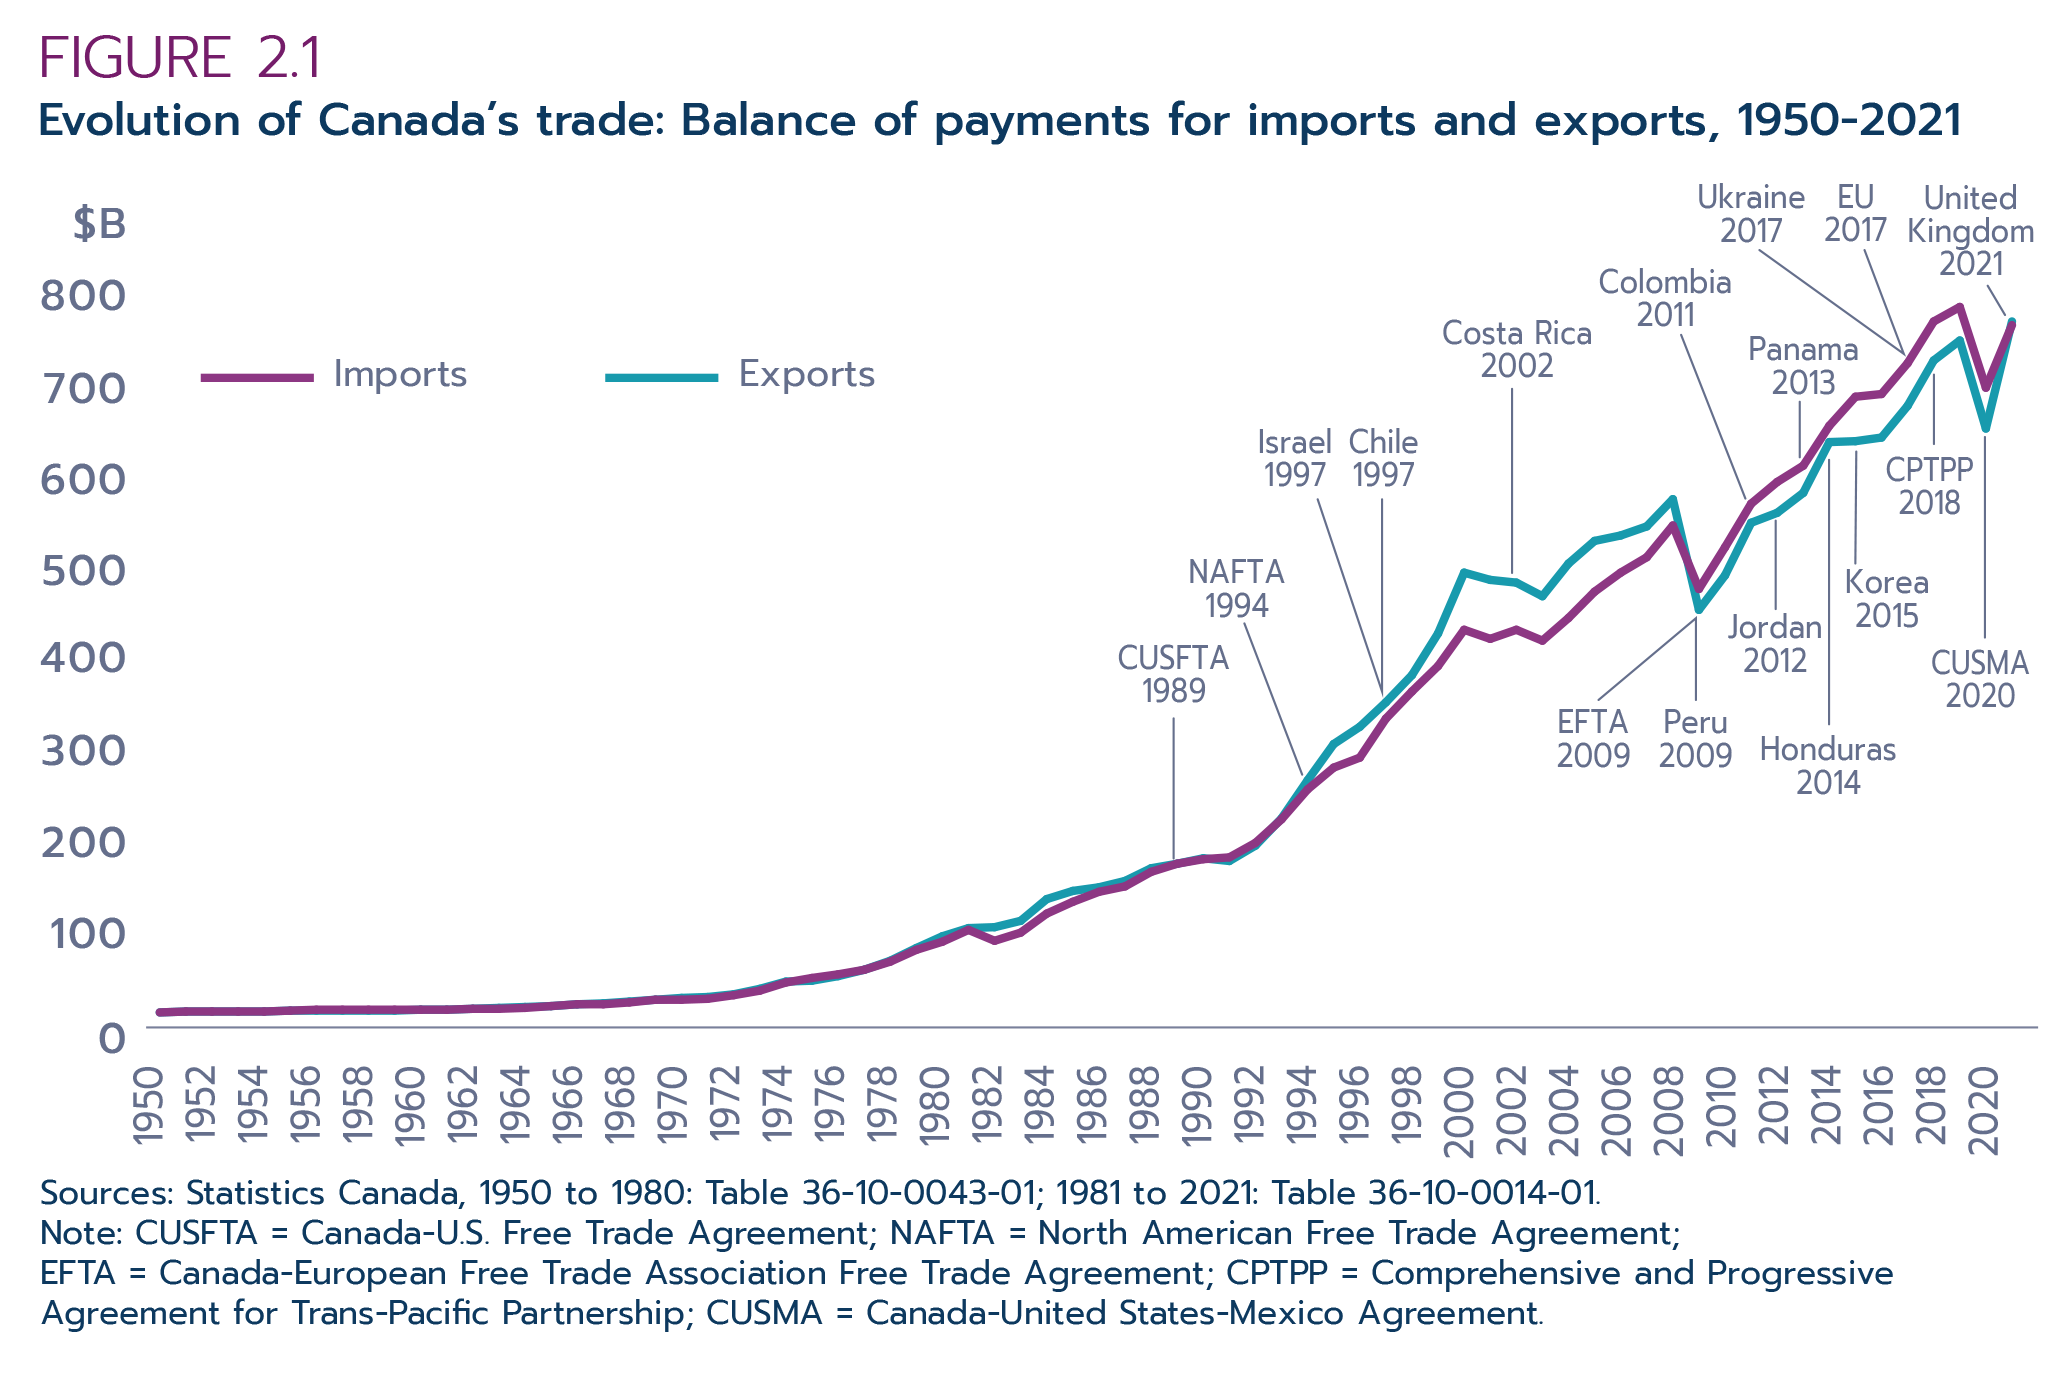
Text version - Figure 2.1
($ billions)
| Year | Imports | Exports |
|---|---|---|
| 1950 | 4 | 4 |
| 1951 | 5 | 5 |
| 1952 | 5 | 5 |
| 1953 | 5 | 5 |
| 1954 | 5 | 5 |
| 1955 | 6 | 6 |
| 1956 | 7 | 6 |
| 1957 | 7 | 6 |
| 1958 | 7 | 6 |
| 1959 | 7 | 6 |
| 1960 | 7 | 7 |
| 1961 | 7 | 7 |
| 1962 | 8 | 8 |
| 1963 | 8 | 9 |
| 1964 | 9 | 10 |
| 1965 | 11 | 11 |
| 1966 | 13 | 13 |
| 1967 | 13 | 14 |
| 1968 | 15 | 16 |
| 1969 | 18 | 18 |
| 1970 | 18 | 20 |
| 1971 | 19 | 21 |
| 1972 | 23 | 24 |
| 1973 | 28 | 30 |
| 1974 | 37 | 38 |
| 1975 | 42 | 39 |
| 1976 | 46 | 44 |
| 1977 | 51 | 51 |
| 1978 | 60 | 61 |
| 1979 | 73 | 75 |
| 1980 | 82 | 88 |
| 1981 | 95 | 97 |
| 1982 | 83 | 98 |
| 1983 | 92 | 105 |
| 1984 | 113 | 129 |
| 1985 | 126 | 138 |
| 1986 | 137 | 142 |
| 1987 | 143 | 149 |
| 1988 | 159 | 163 |
| 1989 | 168 | 168 |
| 1990 | 173 | 174 |
| 1991 | 175 | 171 |
| 1992 | 191 | 188 |
| 1993 | 217 | 218 |
| 1994 | 250 | 260 |
| 1995 | 274 | 300 |
| 1996 | 285 | 319 |
| 1997 | 328 | 346 |
| 1998 | 358 | 376 |
| 1999 | 386 | 422 |
| 2000 | 426 | 489 |
| 2001 | 416 | 481 |
| 2002 | 426 | 478 |
| 2003 | 414 | 463 |
| 2004 | 439 | 499 |
| 2005 | 468 | 524 |
| 2006 | 489 | 530 |
| 2007 | 506 | 540 |
| 2008 | 541 | 570 |
| 2009 | 471 | 448 |
| 2010 | 517 | 486 |
| 2011 | 565 | 544 |
| 2012 | 589 | 555 |
| 2013 | 607 | 577 |
| 2014 | 651 | 633 |
| 2015 | 683 | 634 |
| 2016 | 686 | 638 |
| 2017 | 720 | 673 |
| 2018 | 766 | 723 |
| 2019 | 782 | 745 |
| 2020 | 693 | 648 |
| 2021 | 762 | 766 |
Lines on the chart identify the years in which Canada had an FTA come into force:
| FTA | Year in force |
|---|---|
| CUSFTA | 1989 |
| NAFTA | 1994 |
| Israel | 1997 |
| Chile | 1997 |
| Costa Rica | 2002 |
| EFTA | 2009 |
| Peru | 2009 |
| Colombia | 2011 |
| Jordan | 2012 |
| Panama | 2013 |
| Honduras | 2014 |
| Korea | 2015 |
| Ukraine | 2017 |
| EU | 2017 |
| CPTPP | 2018 |
| CUSMA | 2020 |
| United Kingdom | 2021 |
Sources: Statistics Canada, 1950 to 1980: Table 36-10-0043-01; 1981 to 2021: Table 36-10-0014-01.
Note: CUSFTA = Canada-U.S. Free Trade Agreement; NAFTA = North American Free Trade Agreement; EFTA = Canada-European Free Trade Association Free Trade Agreement; CPTPP = Comprehensive and Progressive Agreement for Trans-Pacific Partnership; CUSMA = Canada-United States-Mexico Agreement.
The trade data accumulated over 30 years since Canada first concluded the CUSFTA with the United States is enough to assess the costs and benefits of free trade and globalization in general—that is, whether FTAs have delivered on their promises to achieve expected outcomes—and to ask what lessons can be learned from the past FTAs.
Part 2 of this report will highlight various aspects of FTAs. Section 2.1 focuses on the trade creation effect of FTAs, using the recently completed ex post impact assessments of the Canada-Chile FTA and the Canada-Colombia FTA as examples. Section 2.2 explains the welfare implications of Canada’s FTAs. Section 2.3 considers the labour market implications of these agreements, featuring the results of recent research on the Canada-U.S. FTA. Section 2.4 goes beyond tariffs to explore beyond the border aspects of FTAs such as environment and labour. Finally, Section 2.5 gives an overview of the interplay between diplomacy and FTAs.
2.1 The trade creation effects of free trade agreements
If a free trade agreement (FTA) is working as intended, one would expect more trade to be created between the FTA partners. This is because an FTA provides reciprocal preferences between countries that are party to the agreement, but does not extend them to non-FTA parties that continue to trade under most-favored nation (MFN) status. Therefore, one of the larger questions surrounding FTAs is whether the improved market access they are meant to create actually results in increased trade between the FTA partner countries. Assessing this should be the first step before embarking on any other analysis of the effect of trade agreements.
To investigate the question of trade creation by FTAs, many different comparisons and quantitative analyses need to be carried out. This analysis will start by presenting general trends of bilateral trade between Canada and its FTA partner countries since the implementation of FTAs, followed by decomposing the bilateral trade by comparing the trade performance from different perspectives to detect the signs of trade creation under FTAs. While these comparisons help to illustrate trade gains under various FTAs, they cannot be considered as indicators of a causal effect of an FTA. Thus, a more sophisticated econometric analysis is needed to isolate the trade creation effect of FTAs from other factors that also influence trade flows, such as exchange rate fluctuations, change in commodity prices, and general market conditions in the partner countries.
Specifically, the investigation of the trade creation effect of FTAs will be carried out in the following steps:
- 1) Overall trends in Canada’s trade with its FTA partners.
- 2) Historical comparisons of trade flows: we will look at comparisons of trade performance between FTA partner countries before and after the implementation of FTAs for the products that directly benefit from the FTA.
- 3) Cross-country comparisons: we will look at comparisons of trade performance between FTA partner countries and trade between FTA and non-FTA partner countries that share similar economic characteristics in terms of the size of GDP, population, income levels, and geographic locations over the same period.
- 4) Comparisons of trade growth based on tariff reductions: we will look at comparisons of trade performance between the liberalized sectors and non-liberalized sectors or between the sectors that are subject to different levels of tariff reductions under FTAs.
- 5) Utilization of FTA preferences: we will look at the evolution of FTA utilization over time (a key indicator in determining whether FTA members are obtaining benefits of a trade agreement) after the implementation of trade agreements and compare the utilization across various FTAs.
- 6) Finally, the results of econometric analysis are presented and discussed to demonstrate a causal effect of an FTA. Such analysis allows for the control of other factors that also influence trade performance, such as changes in exchange rates, commodity prices, and income growth in partner countries.
Overall trends in Canada’s trade with its FTA partners
A simple data tabulation shows that across Canada's long-standing FTAs, except the one with Peru, bilateral trade between Canada and its major FTA partners more than doubled 10 years following the entry into force of the agreements (Figure 2.2), compared to growth of 47.5% for Canada's trade with non-FTA partner countries. This is no surprise because Canada's FTAs aim for and achieve duty-free trade with only a few exceptions for specific products. Among Canada's FTA partners, Canada's trade with Mexico grew the fastest, exceeding 200%. While some FTAs, such as those with Mexico and Chile, brought about exceptional trade growth after 10 years, there is no guarantee; for example, Canada's FTA with Peru improved in the first 5 years of the implementation of the agreement. Ten years later, trade with Peru experienced inferior growth than the non-FTA trade, due largely to a decline in gold imports. Various factors can influence trade creation, such as changes in the trade composition, commodity price fluctuations, and exporters finding other markets with better opportunities. In-depth statistical work is required to investigate the factors that lead to such outcomes.
Figure 2.2: Canada's bilateral trade growth with its trading partners (%)
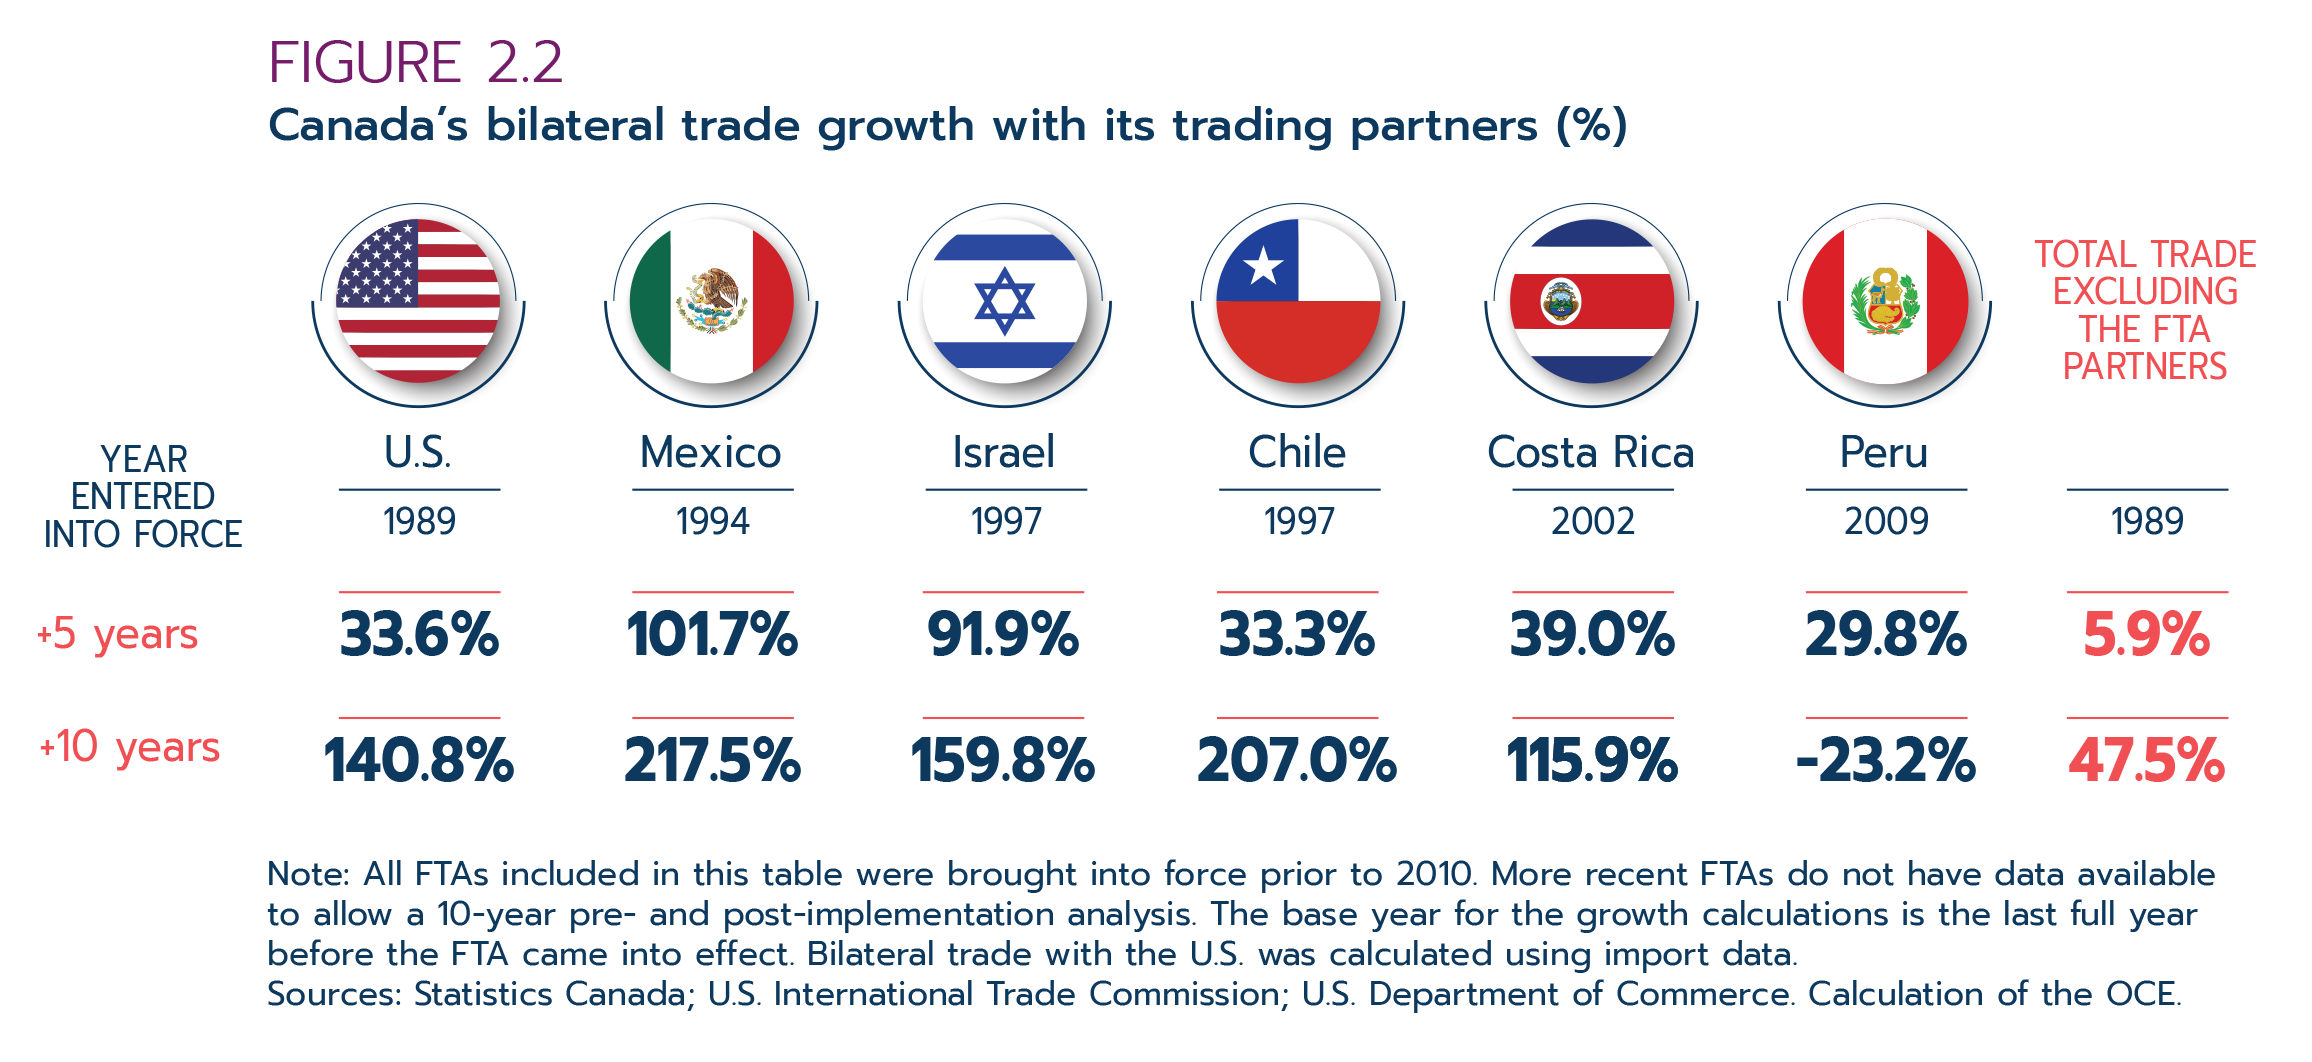
Text version - Figure 2.2
| FTA partner countries | Year entered into force | 5 years after implementation (%) | 10 years after implementation (%) |
|---|---|---|---|
| U.S. | 1989 | 33.6 | 140.8 |
| Mexico | 1994 | 101.7 | 217.5 |
| Israel | 1997 | 91.9 | 159.8 |
| Chile | 1997 | 33.3 | 207.0 |
| Costa Rica | 2002 | 39.0 | 115.9 |
| Peru | 2009 | 29.8 | -23.2 |
| Total trade excluding FTA partners | 1989 | 5.9 | 47.5 |
Note: All FTAs included in this table were brought into force prior to 2010. More recent FTAs do not have data available to allow a 10-year pre- and post-implementation analysis. The base year for the growth calculations is the last full year before the FTA came into effect. Bilateral trade with the U.S. was calculated using import data.
Sources: Statistics Canada; U.S. International Trade Commission; U.S. Department of Commerce. Calculation of the OCE.
Figure 2.3 categorizes the growth of Canada’s goods trade with its key trading partners into 2 groups: trade with its free trade partners 10 years before and 10 years after entry into force of FTAs and trade with non-FTA trading partners over the same period. Time zero is set as the date of entry into force. On average, trade with both country groups was growing at the same pace, around 7% a year before the FTA entered into force. After entry into force of FTAs, these 2 country groups were on different growth trajectories: trade grew at 10% a year with FTA partners and at 6% a year with non-partners. This strongly suggests that Canada’s FTAs have generated more trade between FTA partner countries relative to non-FTA partner countries.
Figure 2.3: Growth of Canada's 2-way goods trade before and after FTA entry into force
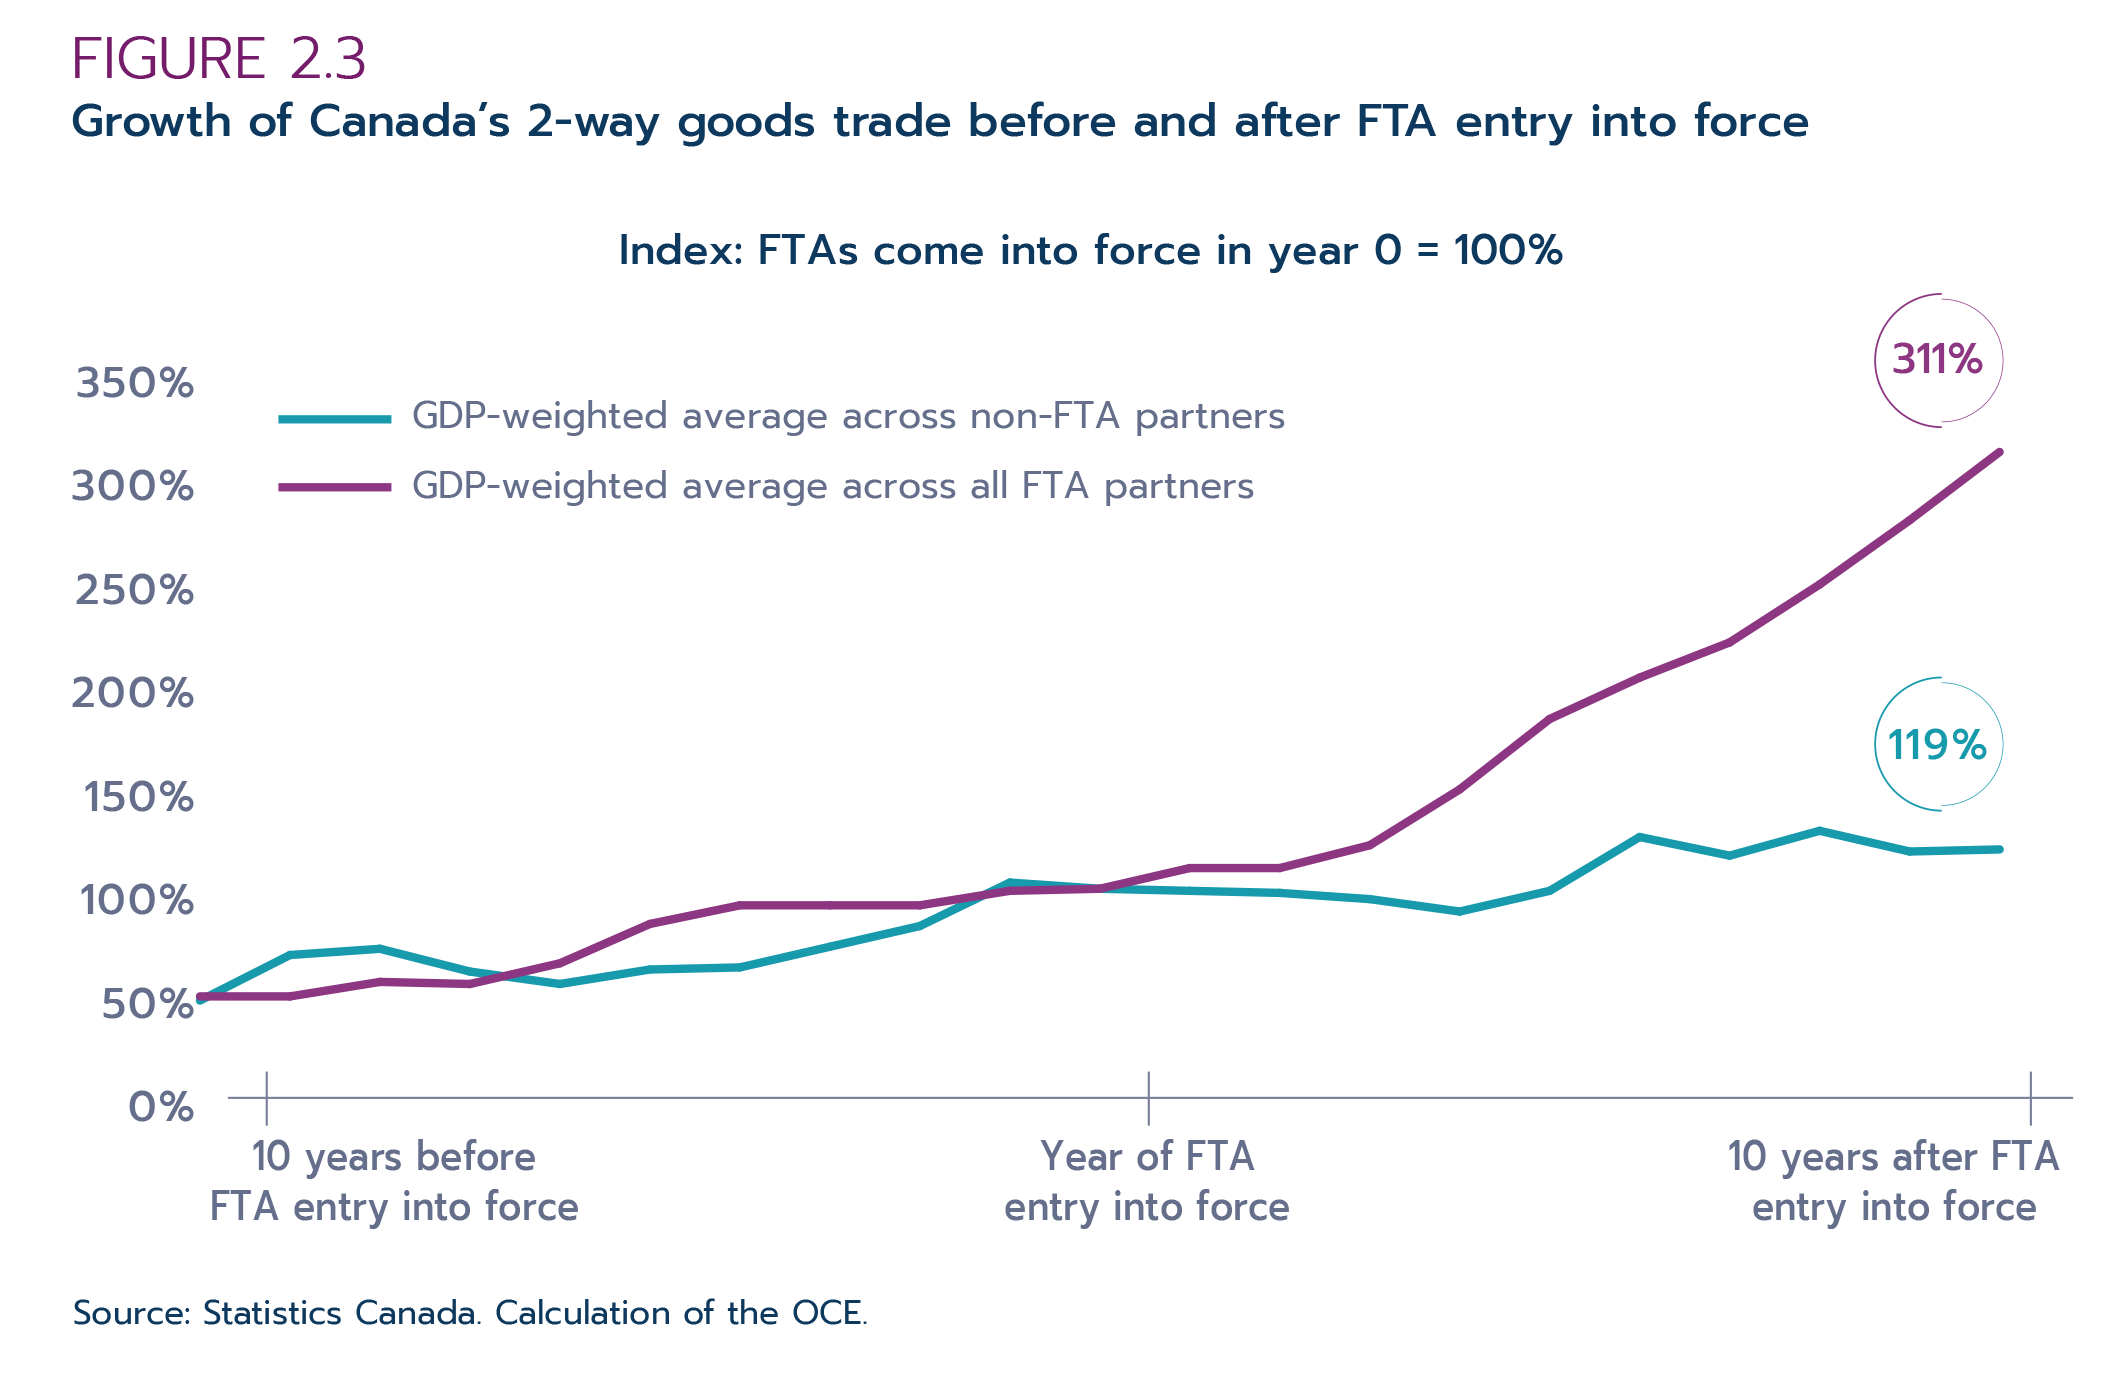
Text version - Figure 2.3
Index: FTAs come into force in year 0 = 100%
| Time | GDP-weighted average across all FTA partners | GDP-weighted average across non-FTA partners |
|---|---|---|
| 10 years before FTA entry into force | 48% | 46% |
| -9 | 48% | 68% |
| -8 | 55% | 71% |
| -7 | 54% | 60% |
| -6 | 64% | 54% |
| -5 | 83% | 61% |
| -4 | 92% | 62% |
| -3 | 92% | 72% |
| -2 | 92% | 82% |
| -1 | 99% | 103% |
| Year of FTA entry into force | 100% | 100% |
| 1 | 110% | 99% |
| 2 | 110% | 98% |
| 3 | 121% | 95% |
| 4 | 148% | 89% |
| 5 | 182% | 99% |
| 6 | 202% | 125% |
| 7 | 219% | 116% |
| 8 | 247% | 128% |
| 9 | 278% | 118% |
| 10 years after FTA entry into force | 311% | 119% |
Source: Statistics Canada. Calculation of the OCE.
Next, the discussion decomposes the general trends of bilateral trade by focusing on the trade performance of products that directly benefit from FTAs. It is a conditional presentation of trade flows that isolates and tracks the trade performance of products subject to tariff reduction commitments under various FTAs, relative to those not under trade commitments.
Historical comparisons of trade flows
We conducted a historical comparison of trade performances before and after entry into force of FTAs for all products that are affected by FTAs. Affected products are the products that are dutiable for all countries that are not party to the agreements, but become duty-free under the FTA commitments. Products that are already duty-free (unaffected products) under the normal MFN status before the FTA and products that are exempted from the concessions are excluded from the FTA benefit calculations.
Figure 2.4 presents an overview of the growth in exports and imports for the products that are covered under some of Canada's key FTAs before and after their implementation. In general, exports of products that benefited from tariff reductions grew faster than exports of products with no FTA treatment. There are some exceptions as is the case with Canadian exports under CETA where trade in unaffected products grew faster than that for affected products. Factors such as changes in prices of products that were tariff-free prior to the FTA, namely for Canada's significant resources exports, as well as changes in the composition of exports may influence the utilization of CETA benefits. As noted above, to identify the factors underlying such an outcome requires advanced statistical analysis.
Figure 2.4: Growth* in Canadian trade with selected FTA partners by coverage of FTA (%)

Text version - Figure 2.4
| EU | Korea | Chile | Colombia | ||
|---|---|---|---|---|---|
| Exports | All affected products | 15.1% | 34.2% | 56.2% | 142.6% |
| All unaffected products | 32.2% | 10.6% | 362.7% | 28.3% | |
| Imports | All affected products | 48.4% | 96.1% | 75.3% | 118.7% |
| All unaffected products | 35.5% | 39.1% | 516.1% | 81.4% | |
*CETA time periods: 2015 to 2016 and 2018 to 2019; Korea time periods: 2010 to 2014 and 2015 to 2019; Chile time period: 1996 to 2011; Colombia time periods: 2002 to 2010 and 2011 to 2019.
Sources: Special data tabulation from Statistics Canada; data exchanges with the European Commission, Korea, Chile and Republic of Colombia. Calculation of the OCE.
Note: Figures in this table represent growth of average exports and imports before and after the FTA for the products covered (affected) by FTA vs. not covered by the FTA.
Cross-country comparisons
Another useful approach when examining the effect of FTAs involves a direct comparison of trade growth between FTA partner countries to trade growth with non-FTA partner countries. To ensure this comparison is credible, non-FTA partner countries selected for comparisons should share similar economic characteristics with FTA countries in terms of the size of GDP, population, income levels, and geographic locations over the same period.
Figure 2.5 shows the trade growth of Canada, the EU, and Chile with their key trading partners since the implementation of the Canada-EU CETA and the Canada-Chile FTA. CETA was provisionally entered into force in 2017. Figure 2.5 reveals a noticeable trend: the growth of Canada's trade with the EU and the growth of the EU's trade with Canada from the EU's perspective exceeded Canada's and the EU's trade with other major trading partners during the period from 2016—a year before the inception of the CETA—to 2019, a year before the start of the COVID-19 pandemic.
Similarly, for the Canada-Chile FTA (CCFTA), 10 years following the implementation of CCFTA in 1997, Canadian exports to and imports from Chile grew strongly relative to other non-FTA Latin American countries except for Peru (GAC, 2013). Although Canada’s trade with Chile showed strong growth over the period, a similar trend cannot be found from Chile’s perspective because Chile has signed FTAs with almost all its major trading partners.
Figure 2.5: Cross-country comparisons of merchandise trade performance under CETA and CCFTA
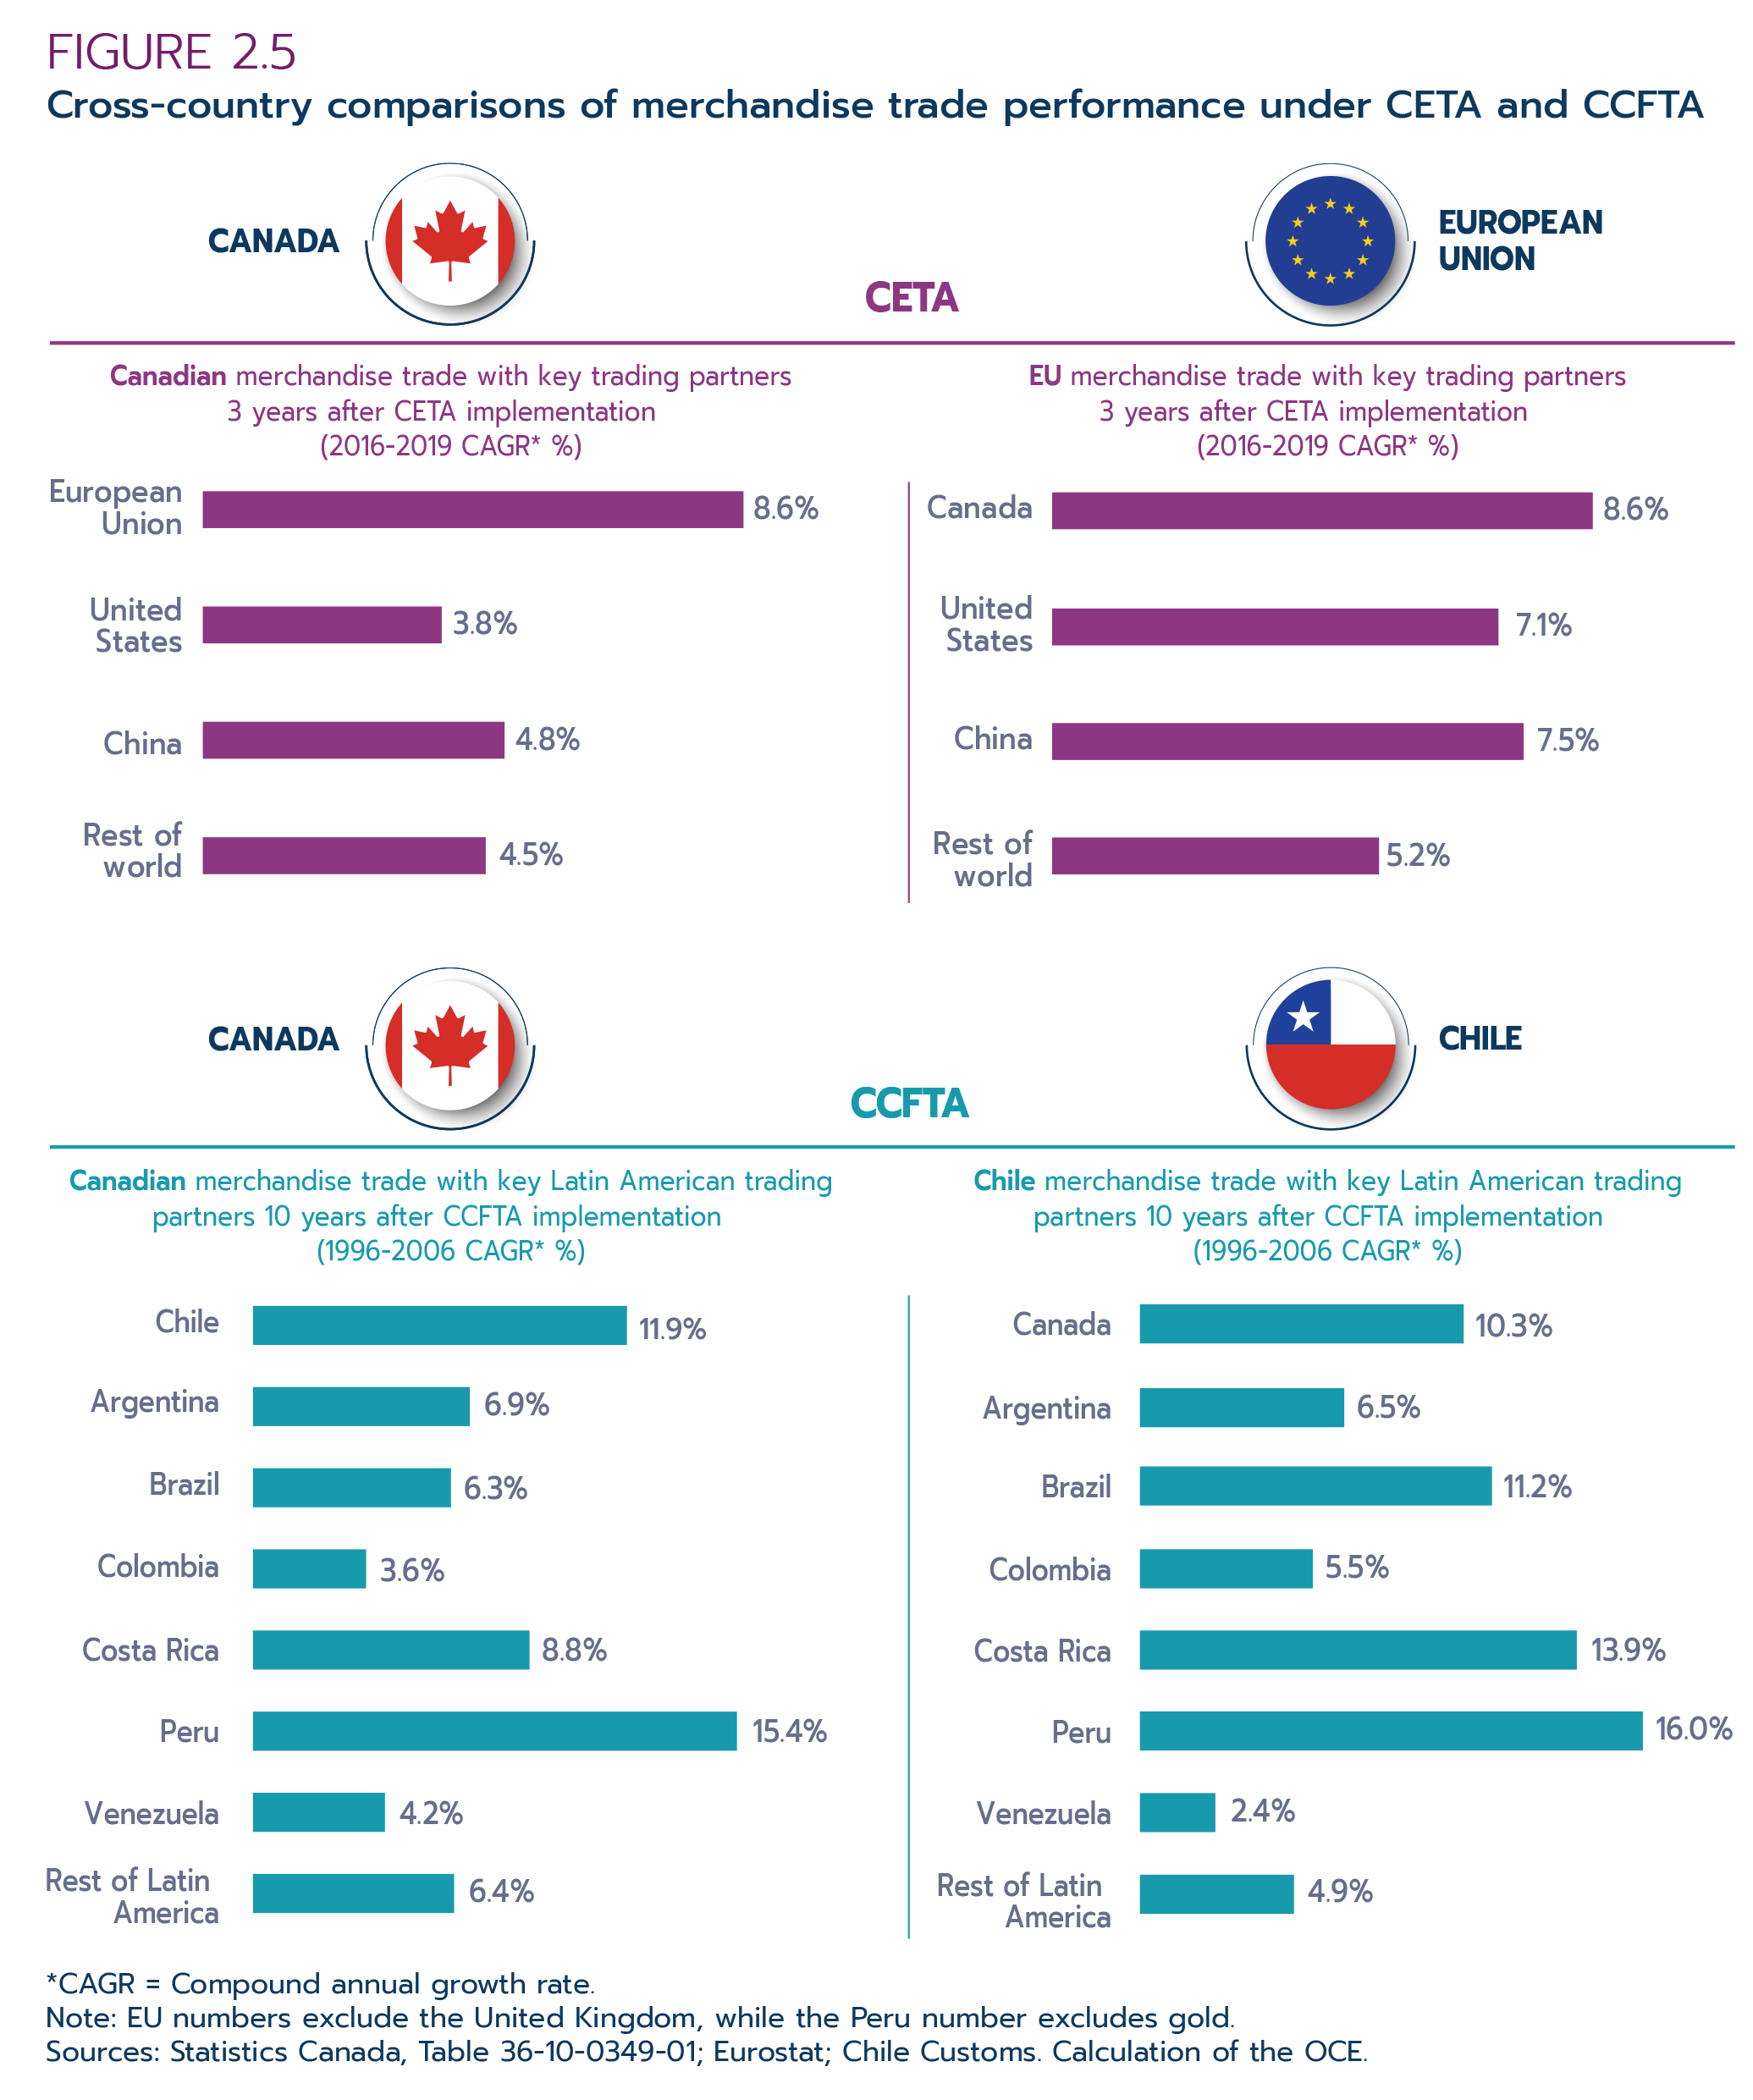
Text version - Figure 2.5
Canadian merchandise trade with key trading partners 3 years after CETA implementation
(2016-2019 CAGR* %)
| 2016-2019 | |
|---|---|
| European Union | 8.6 |
| United States | 3.8 |
| China | 4.8 |
| Rest of world | 4.5 |
EU merchandise trade with key trading partners 3 years after CETA implementation
(2016-2019 CAGR* %)
| 2016-2019 | |
|---|---|
| Canada | 8.6 |
| U.S. | 7.1 |
| China | 7.5 |
| Rest of world | 5.2 |
Canadian merchandise trade with key Latin American trading partners 10 years after CCFTA implementation
(1996-2006 CAGR* %)
| 1996-2006 | |
|---|---|
| Chile | 11.9% |
| Venezuela | 4.2% |
| Peru | 15.4% |
| Costa Rica | 8.8% |
| Colombia | 3.6% |
| Brazil | 6.3% |
| Argentina | 6.9% |
| Rest of Latin America (non-FTA) | 6.4% |
Chile merchandise trade with key Latin American trading partners 10 years after CCFTA implementation
(1996-2006 CAGR* %)
| 1996-2006 | |
|---|---|
| Canada | 10.3% |
| Venezuela | 2.4% |
| Peru | 16.0% |
| Costa Rica | 13.9% |
| Colombia | 5.5% |
| Brazil | 11.2% |
| Argentina | 6.5% |
| Rest of Latin America (non-FTA) | 4.9% |
*CAGR = Compound annual growth rate.
Note: EU numbers exclude the United Kingdom, while the Peru number excludes gold.
Sources: Statistics Canada, Table 36-10-0349-01; Eurostat; Chile Customs. Calculation of the OCE.
Comparisons of trade growth based on tariff reductions
Further cross-sectoral comparisons can be done to examine the trade creation effects on dutiable products across varying preference margins, that is, the difference between preferential and MFN tariffs. If trade flows are sensitive to tariff cuts, one would expect trade flows for the products that experience substantial tariff reductions (larger preference margins) to grow faster than trade flows for the products with modest tariff reductions (smaller preference margins). For example, trade in products with preference margins that exceed 10 percentage points is expected to grow more strongly than that for products with preference margins of only 1 to 2 percentage points. This is exactly what is depicted in Figure 2.6, which shows the growth of Canada's trade by preference margins under 4 of its major FTAs. Across all major FTAs, trade growth for the products with tariff reductions of more than 10 percentage points consistently outperformed trade growth for the products with modest tariff cuts.
Figure 2.6: Merchandise trade growth by preference margin across major FTAs
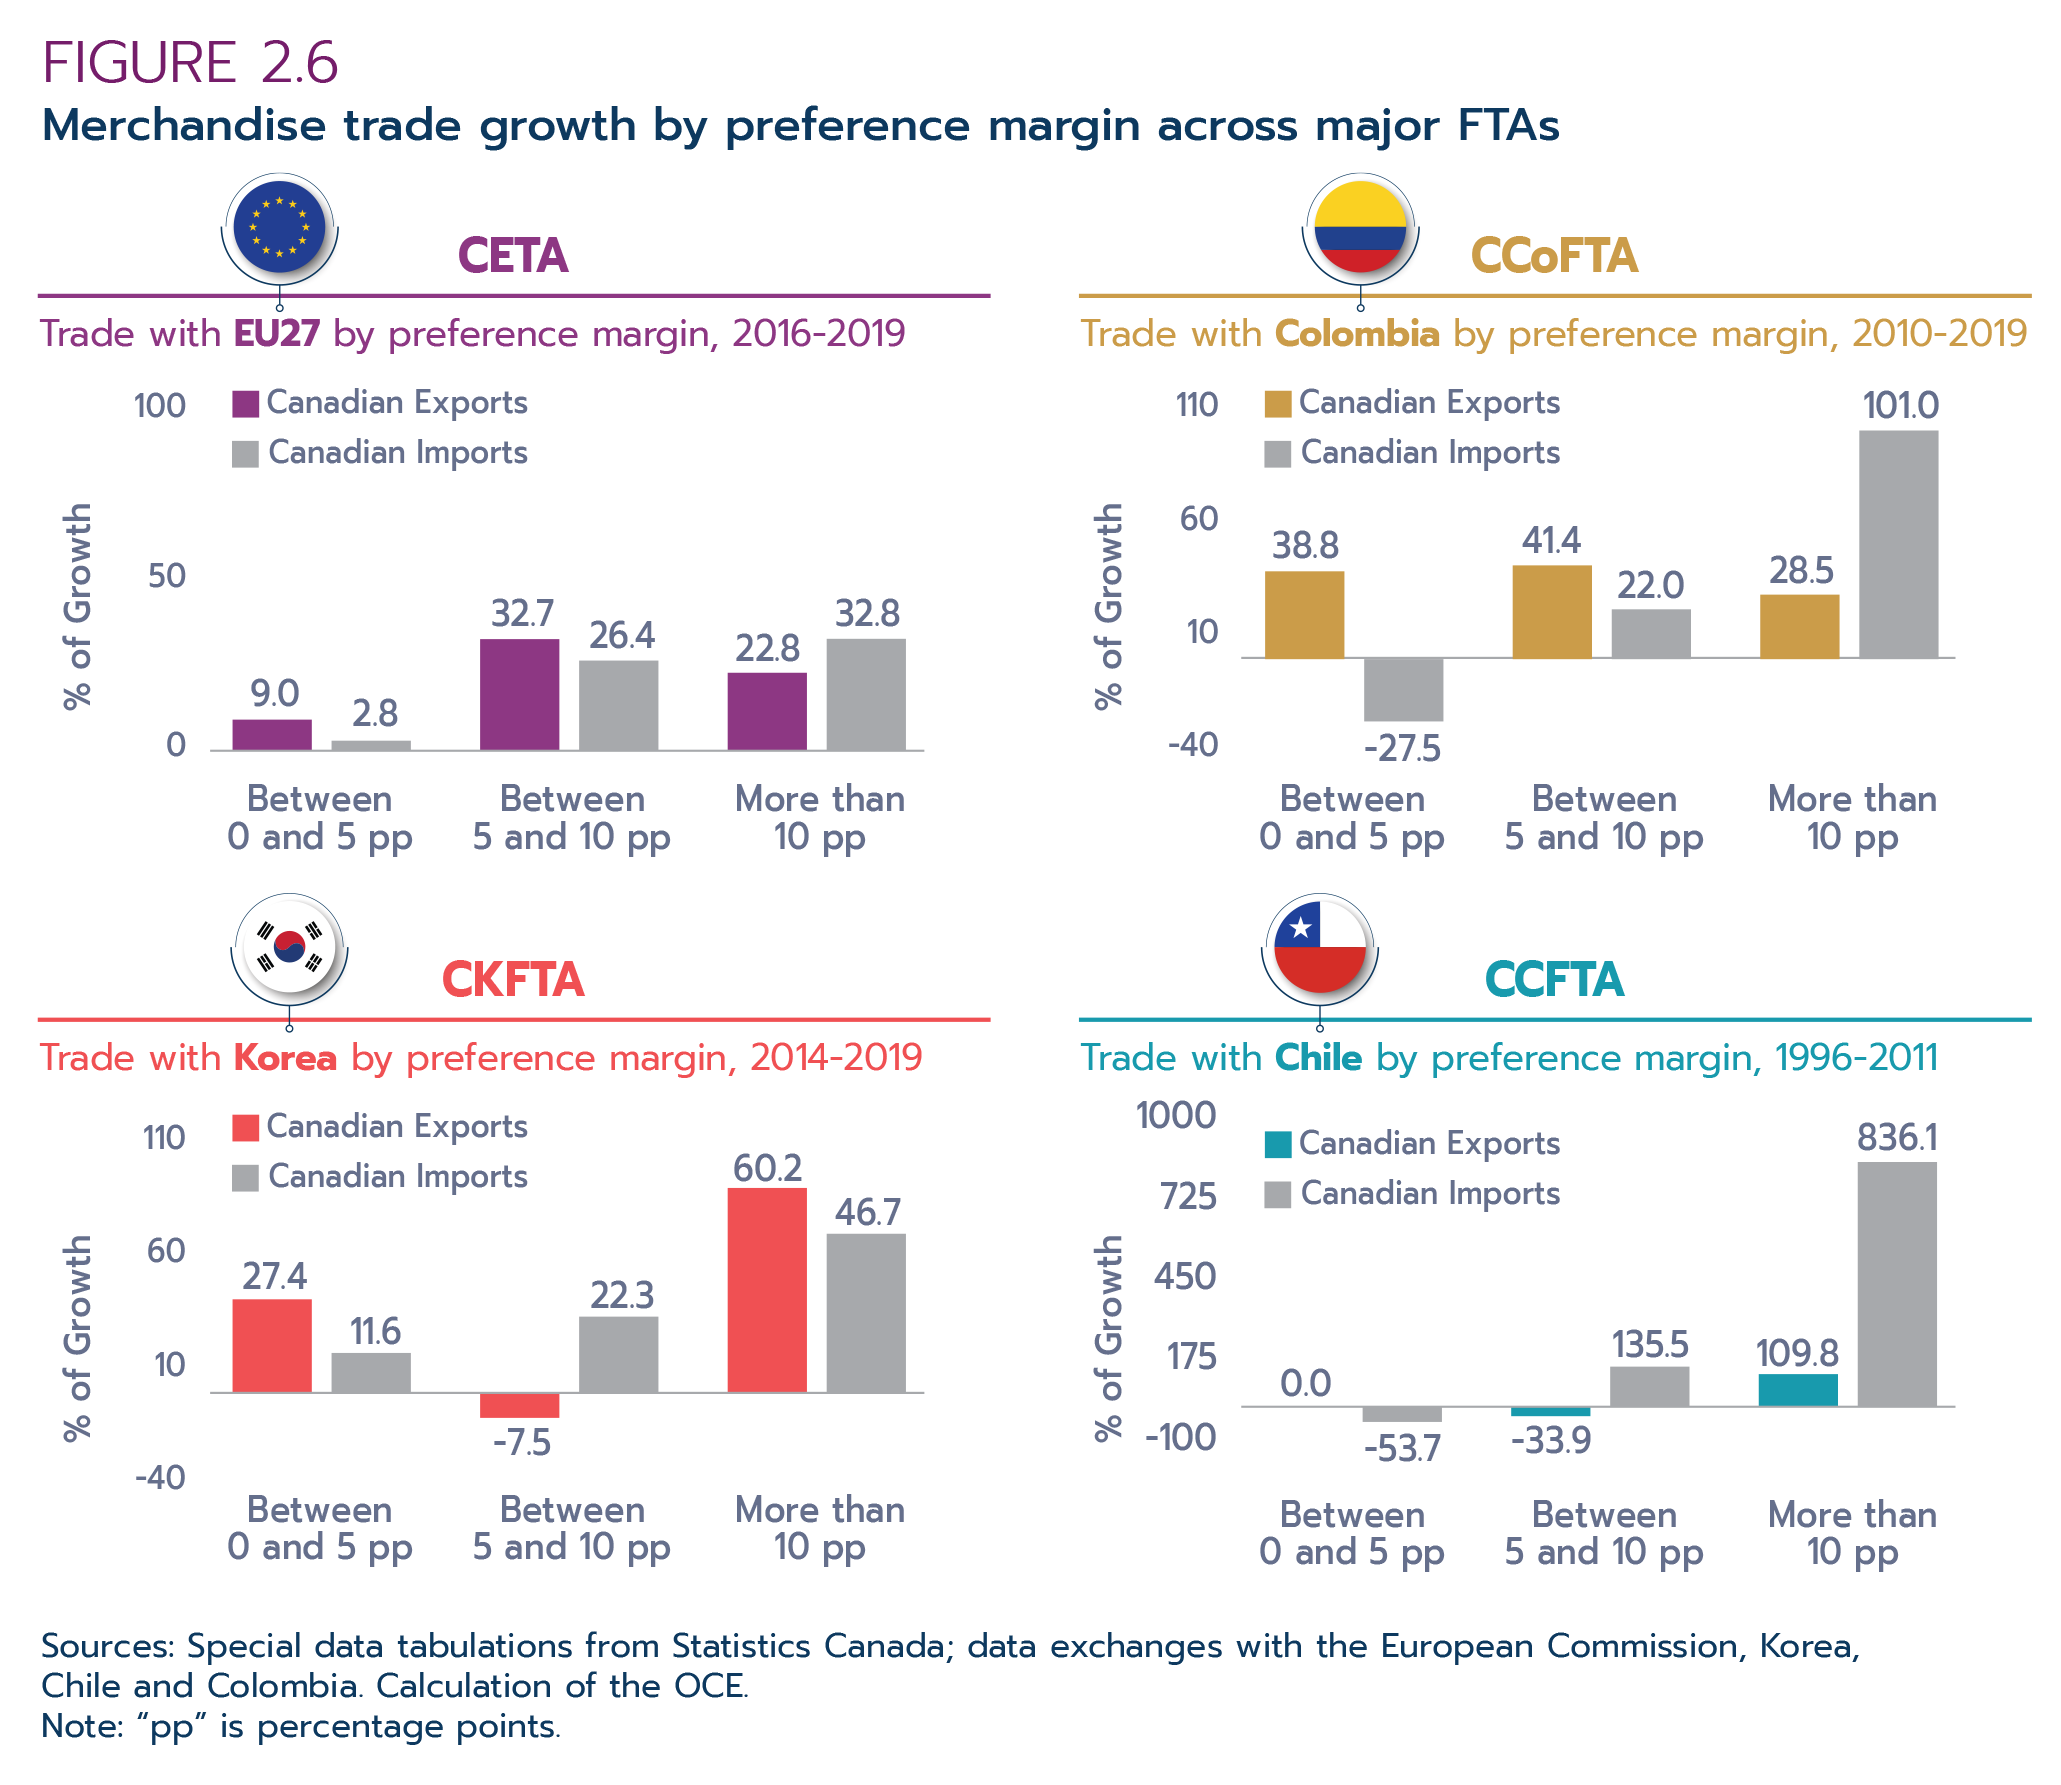
Text version - Figure 2.6
CETA: Trade with EU27 by preference margin, 2016-2019 (% growth)
| Canadian exports | Canadian imports | |
|---|---|---|
| Between 0 and 5 pp | 9.0 | 2.8 |
| Between 5 and 10 pp | 32.7 | 26.4 |
| More than 10 pp | 22.8 | 32.8 |
CCoFTA: Trade with Colombia by preference margin, 2010-2019 (% growth)
| Canadian exports | Canadian imports | |
|---|---|---|
| Between 0 and 5 pp | 38.8 | -27.5 |
| Between 5 and 10 pp | 41.4 | 22.0 |
| More than 10 pp | 28.5 | 101.0 |
CKFTA: Trade with Korea by preference margin, 2014-2019 (% growth)
| Canadian exports | Canadian imports |
|---|---|---|
| Between 0 and 5 pp | 27.4 | 11.6 |
| Between 5 and 10 pp | -7.5 | 22.3 |
| More than 10 pp | 60.2 | 46.7 |
CCFTA: Trade with Chile by preference margin, 1996-2011 (% growth)
| Canadian exports | Canadian imports | |
|---|---|---|
| Between 0 and 5 pp | 0.0 | -53.7 |
| Between 5 and 10 pp | -33.9 | 135.5 |
| More than 10 pp | 109.8 | 836.1 |
Sources: Special data tabulations from Statistics Canada; data exchanges with the European Commission, Korea, Chile and Colombia. Calculation of the OCE.
Note: "pp" is percentage points.
Utilization of FTA preferences
A key indicator in determining whether FTA partners are obtaining the benefits of a trade agreement is the preference utilization rate (PUR), which measures the extent to which tariff preferences under a particular trade agreement are being used when products cross the borders. For an economy to benefit from FTAs, businesses need to take advantage of them. To that end, businesses need to claim the preferences and demonstrate that they meet the requirements to receive the preferential tariffs. Therefore, the preference utilization rates are the important indicators to monitor the extent to which trade agreements are utilized.
Box 2.1: Utilization rate of FTA preferences
The preference utilization rate is a ratio of the value of imports that claimed to have received preferential treatment to the value of imports that are eligible to claim the FTA preferences. It is expressed by the following equation:

As evidenced in Figures 2.7 and 2.8, in most cases the PURs for Canadian imports from FTA partners are higher than those for Canadian exports, with PURs increasing over time.
Figure 2.7: Utilization rate across major FTAs (%)
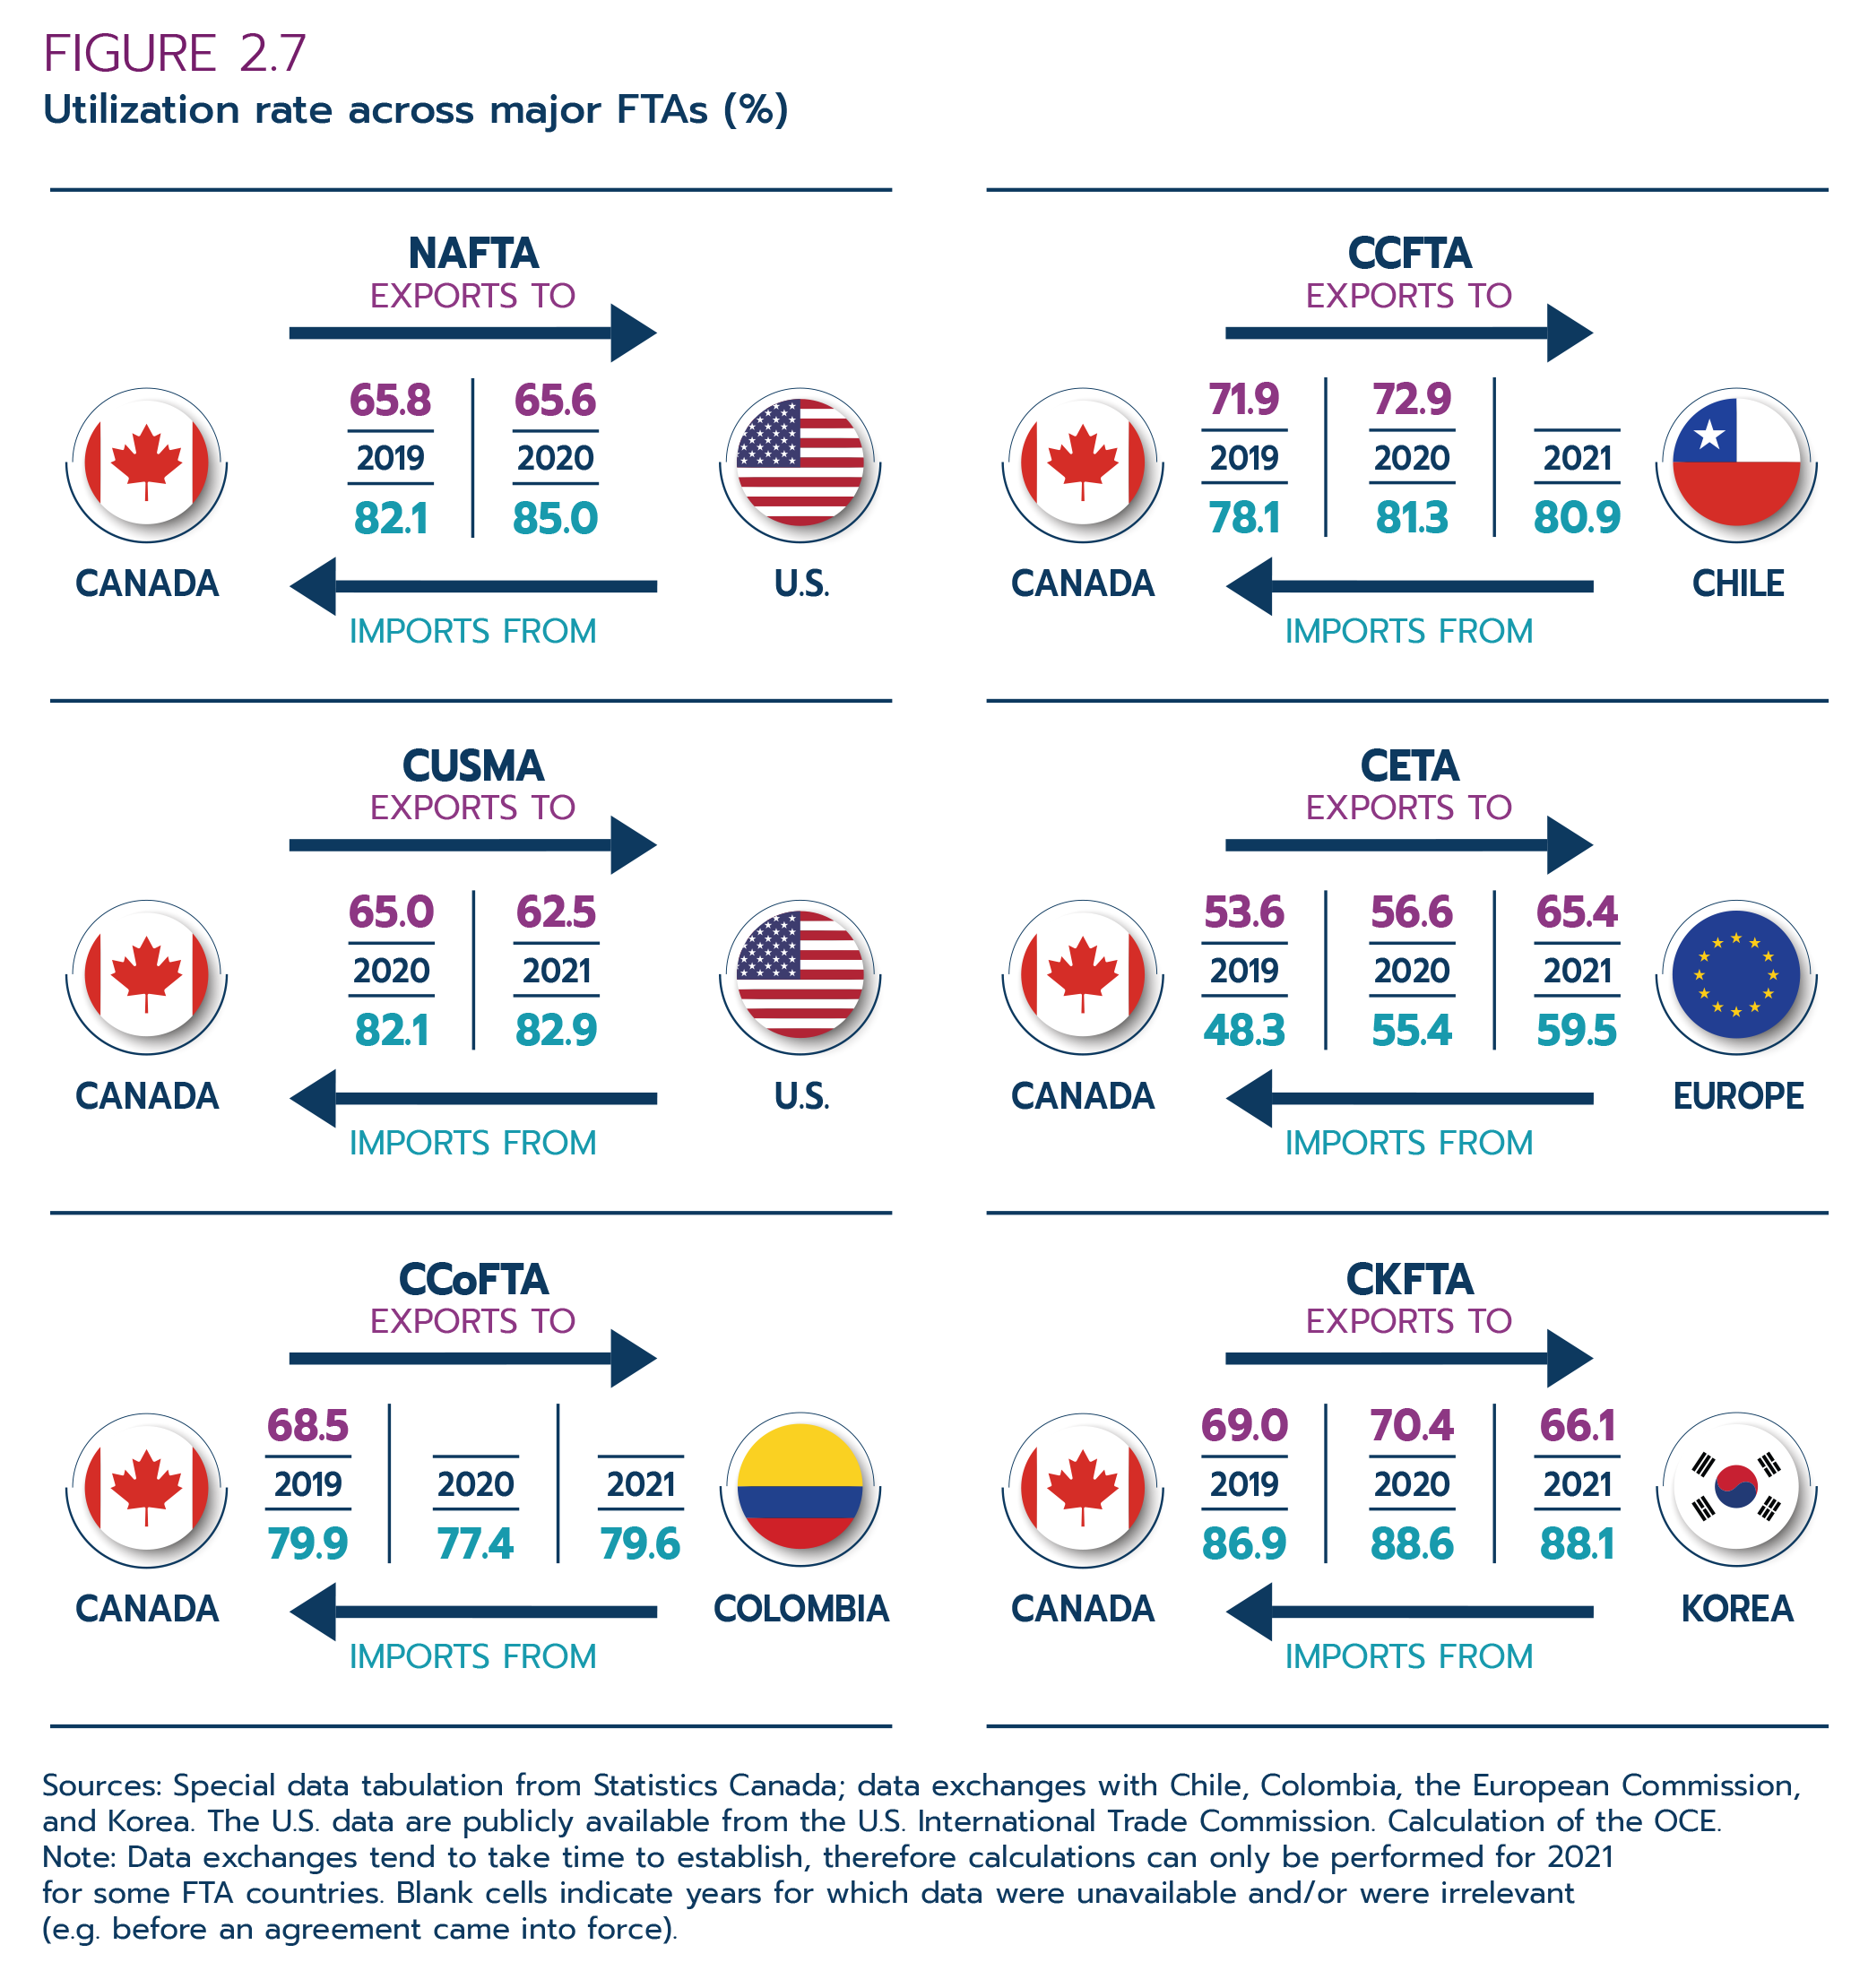
Text version - Figure 2.7
| 2019 | 2020 | 2021 | |
|---|---|---|---|
| Canada exports to U.S. (NAFTA) | 65.8 | 65.6 | |
| Canada imports from U.S. (NAFTA) | 82.1 | 85.0 | |
| Canada exports to U.S. (CUSMA) | 65.0 | 62.5 | |
| Canada imports from U.S. (CUSMA) | 82.1 | 82.9 | |
| Canada exports to Colombia (CCoFTA) | 68.5 | ||
| Canada imports from Colombia (CCoFTA) | 79.9 | 77.4 | 79.6 |
| Canada exports to Chile (CCFTA) | 71.9 | 72.9 | |
| Canada imports from Chile (CCFTA) | 78.1 | 81.3 | 80.9 |
| Canada exports to Europe (CETA) | 53.6 | 56.6 | 65.4 |
| Canada imports from Europe (CETA) | 48.3 | 55.4 | 59.5 |
| Canada exports to Korea (CKFTA) | 69.0 | 70.4 | 66.1 |
| Canada imports from Korea (CKFTA) | 86.9 | 88.6 | 88.1 |
Sources: Special data tabulation from Statistics Canada; data exchanges with Chile, Colombia, the European Commission, and Korea. The U.S. data are publicly available from the U.S. International Trade Commission. Calculation of the OCE.
Note: Data exchanges tend to take time to establish, therefore calculations can only be performed for 2021 for some FTA countries. Blank cells indicate years for which data were unavailable and/or were irrelevant (e.g. before an agreement came into force).
Figure 2.8: Utilization rates across CPTPP partners (%)
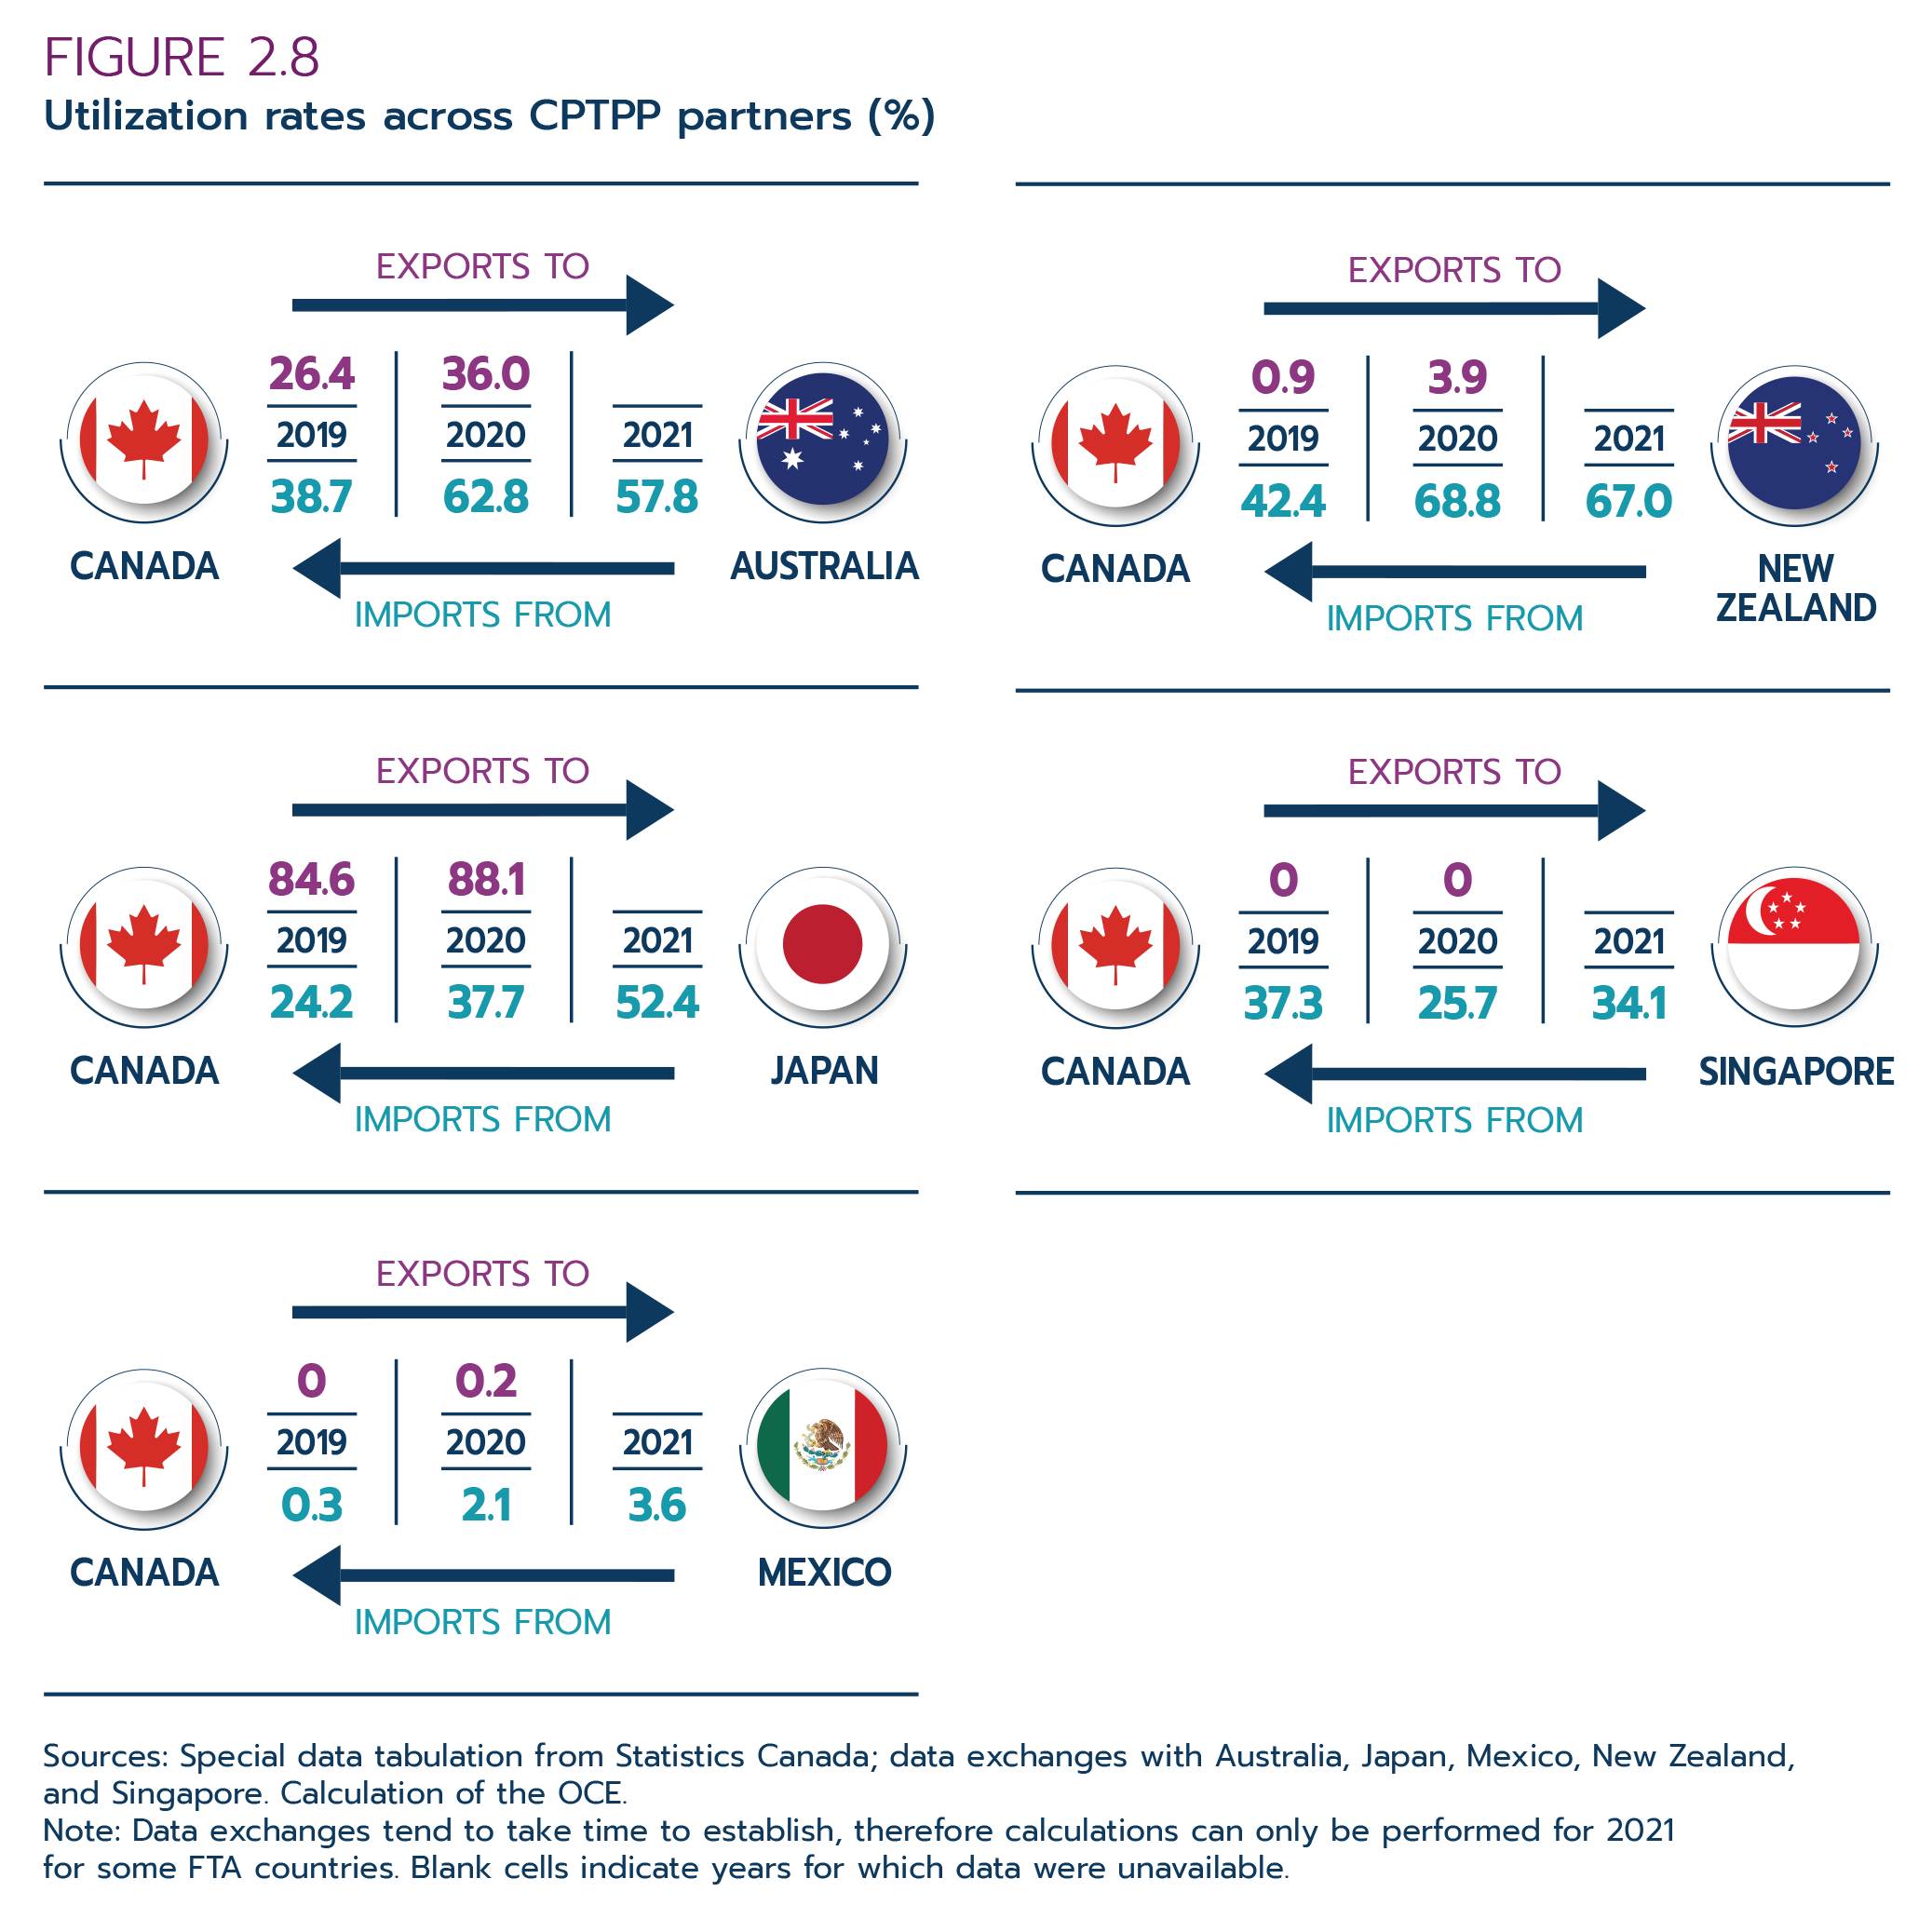
Text version - Figure 2.8
| 2019 | 2020 | 2021 | |
|---|---|---|---|
| Canada exports to Australia | 26.4 | 36.0 | |
| Canada imports from Australia | 38.7 | 62.8 | 57.8 |
| Canada exports to Japan | 84.6 | 88.1 | |
| Canada imports from Japan | 24.2 | 37.7 | 52.4 |
| Canada exports to Mexico (CPTPP only) | 0 | 0.2 | |
| Canada imports from Mexico (CPTPP only) | 0.3 | 2.1 | 3.6 |
| Canada exports to New Zealand | 0.9 | 3.9 | |
| Canada imports from New Zealand | 42.4 | 68.8 | 67.0 |
| Canada exports to Singapore | 0 | 0 | |
| Canada imports from Singapore | 37.3 | 25.7 | 34.1 |
Sources: Special data tabulation from Statistics Canada; data exchanges with Australia, Japan, Mexico, New Zealand, and Singapore. Calculation of the OCE.
Note: Data exchanges tend to take time to establish, therefore calculations can only be performed for 2021 for some FTA countries. Blank cells indicate years for which data were unavailable.
The PURs of CETA have been improving steadily for both exports and imports. For example, the PURs for Canadian exports to the EU grew from 53.6% in 2019 to 65.4% in 2021. This means that more than 60% of total Canadian exports to the EU that were eligible for CETA preferences made use of the CETA preferences. Similarly, the PURs for Canadian imports from the EU also grew from 48.3% in 2019 to 59.5% in 2021. It is noteworthy that both PURs for exports and imports have increased during the pandemic.
While overall PURs of CETA improved, there is great variation across EU member states. For example, the PUR for Canadian exports to Malta was 1.9% and 86.5% for exports to Denmark in 2020. Even for large and trade-oriented EU member states, PURs are not as high as expected. In 2020, the PUR for Canadian exports to Germany was 40.7%, while the PUR for Canadian imports from Germany was 32.8% (Global Affairs Canada and the European Commission, 2021).
At the product level, high PURs could be found in Canadian exports of some agri-food products (for instance, 98% for sugars and sugar confectionary and 96% for preparations of vegetables) and fish and seafood products (96.6%), while PURs were reported lower in sectors like aircrafts and parts or organic chemicals. Within the same sector, the PURs can vary substantially from 1 member state to another. For instance, the PURs for Canadian exports to the EU of motor vehicles and parts ranged from 7.3% for Finland and 18.0% for Belgium to 53.8% for Germany in 2020. Similarly, for Canada’s imports from the EU, the PURs of motor vehicles and parts ranged from 0.2% for Hungary and 19.3% for Germany to 78.5% for Belgium (Global Affairs Canada and the European Commission, 2021).
The Canada-Korea FTA, implemented in 2014, is one of the more highly utilized FTAs among Canada’s major FTAs. The PURs for Canada’s imports from Korea increased from 81.0% in 2018 to 88.1% in 2021. The dominance of auto products in Canada’s imports from Korea and high utilization of preferences for auto products was partly responsible for high PURs. On the other hand, PURs for Canadian exports to Korea trended down slightly from 74.8% in 2018 to 66.1% in 2021.
Among CPTPP countries, Canadian exports to Japan reached high utilization of CPTPP preferences very quickly. Canadian businesses took full advantage of preferences from the beginning of the implementation of the CPTPP with PURs standing at 84.6% in 2019 and further rising to 88.1% in 2020. PURs for Canadian imports from Japan also improved steadily from 24.2% in 2019 to 52.4% in 2021, another example of rising PURs during the pandemic.
The utilization rates can be low for the countries with overlapping FTAs. For example, Mexico reports PURs of only 0.2% for its imports from Canada under CPTPP in 2020 because the majority of Mexico's imports from Canada—64% of such imports that are eligible to claim the CPTPP preferences—claimed "Other preferences". The data provided by the Mexican government do not spell out which other preferences these imports used, but we suspect that it could be the NAFTA/CUSMA preferences or the preferences under the WTO aircraft agreement. Similarly, the shares of Canada's exports to New Zealand and Australia that claimed the CPTPP preferences were low, 3.9% and 36.0%, respectively, in 2020. This is because a significant part of Canada's trade with these 2 countries continued to use the preferences under the pre-existing trade agreements: Canada and New Zealand granted each other preferential tariff rates on a limited range of products agreed under the Agreement on Trade and Economic Cooperation between Canada and New Zealand (the New Zealand Treaty [NZT]) established in 1982 and preferential tariff rates on a limited range of products agreed under the Canada-Australia Trade Agreement (the Australia Treaty [AUT]) established in 1960 and amended in 1973. Out of New Zealand's total imports from Canada that are eligible to claim the CPTPP preferences, 63.8% of these imports claimed the NZT preferences, compared to 3.9% that claimed the CPTPP preferences. Of Australia's total imports from Canada that are eligible to claim CPTPP preferences, 10.1% of such imports claimed AUT preferences, compared to 36.0% that claimed CPTPP preferences. On the other hand, the utilization rates of CPTPP preferences for Canada's imports from New Zealand and Australia are reasonably high, about 67.0% and 57.8%, respectively. Only 12.2% of all Canadian imports from New Zealand that were eligible to claim CPTPP preferences actually claimed the NZT preferences, and 6.0% of all Canadian imports from Australia that were eligible to claim the CPTPP preferences actually claimed the AUT preferences.
The utilization rates for Canada’s exports to Singapore totalled zero. This reflects the fact that Singapore is a free-port country. Singapore offers duty-free access for most of its imports from the world even before CPTPP. Canada thus would not have any extra preferences under the CPTPP for its exports to Singapore. On the other hand, the PUR for Canadian imports from Singapore was 34.1% in 2021, which means Canadian businesses indeed benefit from trade with Singapore under the CPTPP.
It is worth noting the variation in PURs across FTAs. The utilization of preferences for some agreements may seem low. There are many factors that could influence the use of the preferences by businesses such as low business awareness of the agreement, difficulty obtaining the rules of origin certificates from exporters, composition of trade, complicated customs procedures, low preference margins and, as we have seen, overlapping trade agreements.
Econometric analysis
While comparisons of the historical data at an aggregate level shown above provide a rudimentary assessment of the effects of the FTAs before and after the implementation across countries and across sectors, such analysis falls short of establishing a causal relationship between an FTA and trade flows. This causal link is essential to provide direct evidence for the trade creation effects of trade agreements. However, the complexity involved in trying to isolate the effects of trade agreements from numerous other factors that can also influence trade flows between countries makes this a challenging task. To determine the trade creation effect of FTAs, one has to resort to the use of econometrics, a more sophisticated statistical analysis.
The remainder of this section will present the latest econometric evidence on the trade creation effects of trade agreements. The analysis draws on recent empirical literature and the results from in-house ex post analysis of the Canada-Chile FTA and the Canada-Colombia FTA carried out by the Office of the Chief Economist at Global Affairs Canada.
Average treatment effect estimation
The average treatment effect estimation is an econometric approach that is widely used to establish the causal effect of FTAs. It compares the amount of trade in the presence of the trade agreement (“treated” by an FTA) and the “would have been” amount of trade in the absence of the trade agreement (“untreated” by an FTA). For example, the econometric example presented below on the Canada-Colombia FTA (CCoFTA) organizes the data as follows:
- Treated:
- Canada’s trade with Colombia for products affected by the CCoFTA since the implementation of the agreement in 2011 onward
- Untreated:
- Canada’s trade with Colombia prior to 2011 (historical comparison)
- Canada’s and Colombia’s trade with other similar but non-FTA partner countries (cross-country comparison)
- Canada’s and Colombia’s trade in products not covered by the CCoFTA (cross-product comparison)
A positive estimated treatment effect of CCoFTA indicates a positive trade creation effect of the trade agreement.
Box 2.2: Estimating average treatment effect
The average treatment effect (ATE) is an econometric method that aims to quantify the extent to which a trade agreement directly creates trade flows between FTA trading partners. The method compares trade flows both in the presence of and in the absence of the trade agreement. More specifically, ATE uses the trade agreement as the treatment, which impacts trade flows, and compares such data to an environment where the trade agreement did not take place:
- (i) Treated: FTA implemented
- (ii) Untreated: no FTA implemented
Realistically, to assess the effect of this treatment, one must synthesize what the trade flows would have been under current conditions, that is, without the treatment. Since trade flows under the “would have been” condition are not observable, a counterfactual of what “would have been” is created and directly compared to the sample data where the treatment is present. Empirically, the counterfactual can be created by using trade data for countries without a preferential arrangement during the period of interest. The effect will be measured as the average difference in trade performance between treated and untreated observations for each country pair.
The ATE methodology can be expressed by the following equation:

The following section will present the key findings from the application of the average treatment effect estimation to the Canada-Chile FTA and the Canada-Colombia FTA reported by the Office of the Chief Economist at Global Affairs Canada.
Canada-Chile Free Trade Agreement
The Canada-Chile Free Trade Agreement (CCFTA), which entered into force on July 5, 1997, was path-breaking in many respects for both Canada and Chile. For Canada, it was the first free trade agreement concluded with a major South American country and the most economically significant trade agreement since NAFTA. For Chile, it was the first comprehensive free trade agreement concluded with a leading industrialized economy.
Considering that the CCFTA was a catalyst for Canadian trade with a large economy such as Chile in Latin America, one would have expected that it would lead to significant trade creation. However, Chile was very active in signing FTAs following the CCFTA, completing 18 more FTAs with, among others, the EU, the U.S., Mexico and China. With a total of 22 current agreements in force, Chile has one of the largest number of agreements and FTA partners in the world. As a result, the proportion of Chile’s trade with its FTA partners covers more than 90% of its total merchandise trade.
Owing to the wide coverage of Chile’s trade agreements with its trading partners, Canadian exporters might not have extra preferences in the Chilean market. The CCFTA might have provided Canadian exporters temporary advantages in the earlier days of the implementation of the agreement, but such advantages were quickly offset by subsequent trade agreements Chile signed with other trading partners. Under such a situation, one might naturally wonder what would be the gains of signing the CCFTA with Chile? The CCFTA provides a natural experiment to answer the questions regarding the size and sources of gains in a world where preferences extensively overlap and preferential benefits offset each other under multiple trade agreements.
To address this question, the Canada-Chile Economic Study adopted the average treatment effect estimation to obtain a more comprehensive assessment of the trade creation effect of the CCFTA. In this case, both Canada and Chile are considered as having received a treatment (that is, the tariff preferences under CCFTA) and trade between Canada and Chile with their respective non-FTA partner countries is considered as having not been treated. The average treatment effect is estimated by comparing the trade performance between the “treated” and “untreated”, while controlling for GDP, productivity, import penetration, and other variables.
The econometric analysis concluded that the CCFTA delivered on its promises by allowing both countries to expand their bilateral trade significantly:
- The CCFTA increased bilateral trade growth between Canada and Chile 12.2% faster than would have been the case in the absence of the CCFTA.
- Chile became the third most important destination for Canadian exports to Latin America after Mexico and Brazil in 2011—15 years after the implementation of CCFTA, compared to sixth most important in 1997.
Additionally, the study also found the presence of trade diversion, which has dampened the trade creation effects of CCFTA. However, overall, the trade creation effect overwhelmed the trade diversion effect.
The study also highlights the importance of new trading relationships (extensive margin) under the CCFTA. The CCFTA not only stimulated the expansion of existing trading relationships (intensive margin) by lowering tariffs, but also encouraged “new” trade or extensive margins of trade through the creation of new trading activities such as the introduction of new products and new trading relationships. This is the direct result of the trade agreement, which reduced the tariff barriers for all affected products, including products that had not been traded before. In the case of the CCFTA, about 90% of Canadian exports to Chile post FTA were new products never exported before the implementation of the CCFTA.
Table 2.1 shows the number of products that Canada imported from Chile in 1996 and in 2011 classified by existing and new products grouped by tariff reductions. Since the implementation of the CCFTA, the number of products at the detailed HS code levelFootnote 6 that Canada imported from Chile nearly tripled from 454 products in 1996 to 1,210 products in 2011. Only 288 products that were imported prior to the agreement continued to be imported in 2011, but there was a net increase of 922 new products added to the existing portfolio of products imported from Chile.
Table 2.1: Number of products imported from Chile affected by CCFTA tariff reductions
| Number of products (1996) | Number of products (2011) | |||
|---|---|---|---|---|
| Tariff reduction | Existing products | New products | Total | |
| Duty-free | 377 | 243 | 743 | 986 |
| 0.1−5 pp | 23 | 14 | 44 | 58 |
| 5.1−10 pp | 26 | 21 | 32 | 53 |
| ≥10.1 pp | 28 | 10 | 103 | 113 |
| Total | 454 | 288 | 922 | 1,210 |
Source: COMTRADE database. Calculation of the OCE.
Similarly, Table 2.2 shows that more than half of the growth in total imports from Chile was from new products that were not traded prior to the FTA, whereas the remainder was from existing goods. The strong presence of gains from trade at the extensive margin (“new” trade) indicates that by opening up to trade with Canada, Chilean businesses expanded the variety of their products offered at more competitive prices to the Canadian market.
Table 2.2: Growth (%) of extensive and intensive margins of Canadian imports from Chile
| Tariff reduction | Growth in imports (1996 to 2011) | Share of existing products (intensive) | Share of new products (extensive) |
|---|---|---|---|
| Duty-free | 516.1% | 183.2% | 332.9% |
| 0.1-5 pp | -53.7% | -46.1% | -7.6% |
| 5.1-10 pp | 135.5% | 124.2% | 11.2% |
| ≥10.1 pp | 836.1% | 792.2% | 43.9% |
| Total | 459.6% | 173.5% | 286.1% |
Source: COMTRADE database. Calculation of the OCE.
On the export side, the number of products that Canada exported to Chile more than doubled from 848 products in 1996 to 1,759 products in 2011 (Table 2.3). Some 581 products exported in 1996 continued to be exported to the Chilean market in 2011, while 1,178 new products were added to the list of Canadian exports to Chile over the period. The majority of these new products, about 973, were introduced under the category with tariff reductions of more than 10 percentage points.
Table 2.3: Number of products exported to Chile by CCFTA tariff reductions
| Number of products in 1996 | Number of products in 2011 | ||
|---|---|---|---|---|
| Tariff reduction | Existing products | New products | Total | |
| Duty-free | 141 | 99 | 167 | 266 |
| 0.1−5 pp | 0 | 0 | 0 | 0 |
| 5.1−10 pp | 41 | 29 | 38 | 67 |
| ≥10.1 pp | 666 | 453 | 973 | 1,426 |
| Total | 848 | 581 | 1,178 | 1,759 |
Source: COMTRADE database. Calculation of the OCE.
Table 2.4 shows that more than 50% of the growth in Canadian exports to Chile arises from existing products, while the remaining growth comes from new trade. The largest trade creation effects at the extensive margin came from product categories that benefited from tariff reductions of more than 10 percentage points, a clear result of the FTA.
Table 2.4: Growth (%) of Canadian exports to Chile by extensive and intensive margin
| Tariff reduction | Growth in exports (1996 to 2011) | Share of existing products (intensive) | Share of new products (extensive) |
|---|---|---|---|
| Duty-free | 362.7% | 139.2% | 223.5% |
| 0.1-5 pp | 0.0% | 0.0% | 0.0% |
| 5.1-10 pp | -33.9% | -22.8% | -11.0% |
| ≥10.1 pp | 109.8% | 69.2% | 40.5% |
| Total | 96.4% | 53.9% | 42.5% |
Source: COMTRADE database. Calculation of the OCE.
Canada-Colombia Free Trade Agreement
The average treatment effect estimation has also been applied to study the trade creation effect of the Canada-Colombia FTA (CCoFTA). The econometric results suggest the CCoFTA has had a moderate effect: trade growth between Canada and Colombia increased by an average 5.8% to 7% faster than it would have in the absence of the CCoFTA.
The moderate trade creation effect of the CCoFTA could be explained by the following 2 factors that came into play during the implementation period of the trade agreement.
First, immediately after the CCoFTA entered into force, Colombia introduced a unilateral tariff reduction, which resulted in a large number of tariff lines being transformed from MFN-dutiable to duty-free. In a typical FTA ex post analysis, the increase in dutiable trade is a rough indicator of gains in trade covered by the trade agreement. However, the increase in dutiable exports by Canada to Colombia became almost insignificant compared to the increase in duty-free exports after Colombia’s unilateral tariff reductions.
Second, Colombia’s relatively small market buffeted by the strong effect of fluctuations in commodity prices on its purchasing power constrains the size of gains Canada can realize from the CCoFTA. Following the implementation of the CCoFTA in 2011, commodity prices experienced a sharp decline in 2014. Since Colombia’s currency is closely tied to commodity prices, the Colombian peso depreciated by 51% during that period. As a result of this negative economic shock, Colombian exports to other economies fell significantly, especially its oil exports.
Conclusions
The analysis presented above suggests there is compelling evidence that FTAs have been trade creative and have worked as intended. Canada’s FTA programs have made significant contributions to the large increase in Canada’s trade with FTA partner countries that has grown over and above the trade with non-FTA partner countries.
As the overall preference utilization of most of Canada’s FTAs has been steadily improving over time, additional efforts could be deployed to ensure Canadian businesses take full advantage of FTAs in every sector and with every member state of agreements. It is reassuring to see that businesses have made better use of the FTAs during the pandemic, which is evidenced by steady increases in PURs in 2020 and 2021 for most agreements.
It is worth noting that FTAs have not only been effective in generating more trade in existing products at the intensive margin, but also more trade of new products built on the new trading relationships at the extensive margin. As FTAs have significantly reduced the entry thresholds, new trade could become a key driver for trade expansion.
2.2 The welfare impact of free trade agreements
Introduction
Welfare economics is concerned with how the allocation of resources and goods affects social welfare. It deals with the 2 fundamental issues that affect the overall well-being of people in the economy:
- 1) economic efficiency—how economic resources can be optimally allocated to maximize the economic benefits for everybody in the society
- 2) income distribution—how social welfare can be maximized with a suitable level of redistribution
In empirical research, welfare analysis evaluates the costs and benefits of policy changes to the economy and guides public policy toward maximizing the total welfare of society.
With respect to welfare implications of FTAs, the most extensively discussed topic in the trade literature is the potential suboptimal efficiency outcomes of FTAs. The previous section discussed whether improved market access under an FTA actually results in increased trade between the FTA partner countries. The analysis presented in that section provides compelling evidence that FTAs have worked as intended. Canada’s FTA programs have made significant contributions to the large increase in Canada’s trade with FTA partner countries. However, critics argue that although FTAs might promote greater trade between member countries, they represent suboptimal welfare outcomes, in comparison to multilateral or even unilateral trade liberalization (Bhagwati and Srinivasan, 2002).
In a seminal work, Viner (1950) shows that an FTA does not necessarily improve the economic welfare of member countries. This is because the preferential removal of tariffs may lead to both trade creation and trade diversion.
Trade creation occurs when an FTA causes production to move from less efficient producers to more efficient producers or from comparatively disadvantaged sectors to comparatively advantaged sectors within the FTA. This is an efficiency enhancement change and generally raises the economic welfare of FTA member countries.
By contrast, trade diversion arises when an FTA causes production to move from efficient producers outside the FTA to less efficient producers within the FTA. This is an inefficient change and represents the economic costs of discriminating against more efficient producers in favour of less efficient producers. Trade diversion generally reduces the welfare of FTA member countries.
Because any single FTA could produce a combination of trade creation and trade diversion, the net national welfare effect of an FTA can be either positive or negative. In other words, member countries can gain or lose economic welfare overall as a result of an FTA. It is therefore important to understand this balance. Welfare impact assessments of FTAs assess whether economic gains from trade creation outweigh the costs from trade diversion, leading to an overall improvement in economic welfare among member countries.
In the following section, we attempt to validate the extent to which FTAs contribute to welfare gains.
A framework for the welfare impact assessment
The economic framework to assess the welfare impact of FTAs consists of comparisons of consumer gains (surpluses) and producer gains (surpluses) and potential welfare losses under different market structures and conditions.
Producer gains
Determining producer gains (producer surpluses) involves measuring the amount that producers benefit from a policy change—in this case the FTA—which is roughly equal to the net change in profit margins. Producer gains come from the following 3 sources.
Allocative efficiency gains
There are 2 types of allocative efficiency gains:
- 1) Sector level—Historically, economics literature focused on gains from trade stemming from differences in comparative advantage (becoming proficient at producing a product and trading that product for other products). By reallocating economic resources from comparatively disadvantaged sectors to comparatively advantaged sectors, overall economic efficiency improves.
- 2) Firm level—This refers to productivity gains resulting from the reallocation of economic resources from less efficient production to more efficient production. Firm-level reallocations arise due to differentiation between different firms (Melitz, 2003; Bernard et al., 2003). Even in a narrowly defined industry, firms can be differentiated based on their productivity, which can result in having larger, more profitable firms and smaller, less profitable firms. Increases in a globally integrated market under FTAs creates more competition within a given industry, which more negatively affects the least profitable firms. The firms that perform better not only survive but thrive and expand into new markets, while firms that perform worse contract or cease operations. This generates a gain from trade as the firms that survive are the better-performing firms, meaning that the overall efficiency of the industry improves.
Productive efficiency gains
In contrast to allocative efficiency gains that exist between firms, productive efficiency gains are focused within firms. These gains from trade are related to the positive effects on innovation and technological progress under FTAs. In this case, the same conditions that give rise to allocative efficiency gains can also give rise to productive efficiency gains. Increasing productivity through investment requires a significant upfront cost. Increasing the size of the available market through international trade creates the favorable market conditions that encourage firms to invest in development to increase productivity, since firms in large markets under the FTA have the sales volumes needed to justify the high costs of innovation.
Terms of trade gains
Terms of trade is measured by the ratio of export prices to import prices. It is the ratio at which a country can export or sell domestic goods in exchange for imported goods. When terms of trade improve, a unit of exports will buy more imports. By contrast, worsening the terms of trade implies that the country concerned must export more to afford the same quantity of imports. Under an FTA, import prices decline and export prices rise as an FTA reduces and eliminates tariff protections and encourages more sales between FTA partner countries; as a result, terms of trade improve for FTA partner countries. On the other hand, non-FTA partner countries are expected to experience worsening terms of trade as they don’t receive the same benefits as FTA countries.
Consumer gains
Measuring consumer gains (surpluses) involves determining the gains obtained by consumers because they are able to purchase a product for a more competitive price under an FTA. Consumer gains come from the following sources:
- Lower consumer prices due to eliminations and reductions of tariff protections under an FTA
- More variety as consumers can buy products from an FTA partner country that may not be available at competitive prices offered in their own in the absence of the FTA
In the welfare impact analysis, these gains would be weighed against potential welfare costs:
- Government revenue losses—revenues are lower due to eliminations and reductions of tariffs under an FTA.
- Production losses resulting from imports competition—free trade not only creates access to larger markets it also increases competition. Firms that are already efficient are able to weather the increased competition and can take advantage of the access to larger markets, while poorer performing firms are dominated by the increased competition.
- Costs of trade diversion—these costs escalate as a result of increasing trade with less efficient producers in FTA partner countries at the expense of more efficient non-FTA partner countries.
The welfare impact assessment of FTAs assesses whether welfare gains from trade creation under an FTA outweigh the costs from trade diversion, leading to overall better welfare outcomes among member countries. Positive gains in productivity in the affected industries indicate that gains in economic efficiency from trade creation exceed economic losses from trade diversion. A net increase of product varieties at competitive prices means an improvement in consumer gains (surpluses).
Recent empirical evidence
While the theoretical literature on the welfare implications of FTAs is well developed, the empirical literature is still maturing. A comprehensive review of the overall welfare implications of FTAs at present derives only from ex ante impact assessments based on computable general equilibrium models. However, some recent ex post impact assessment literature attempts to address certain aspects of economic welfare, in particular, productivity gains of affected industries. The new evidence from this body of literature on trade creation and productivity gains is particularly encouraging.
The following sections review the recent empirical literature of ex post evaluations of economic welfare of FTAs and discuss the welfare impacts of FTAs from the point of view of producer gains (surpluses) and consumer gains (surpluses) and the channels through which both groups accumulate benefits from free trade.
Allocative efficiency gains
Evidence from the literature supports the idea that FTAs yield allocative efficiency gains. Lileeva and Trefler (2010) provide evidence of this in the context of the Canada-United States Free Trade Agreement (CUSFTA). Using firm-level data, the authors examine a sample of 5,000 Canadian manufacturing firms that had never exported prior to the agreement. Allocative efficiency would suggest that the most productive firms would be more likely to start exporting in the face of falling trade costs while the least productive non-exporting firms would contract or leave the market.
The authors find that 40% of the sample firms began exporting after the CUSFTA came into force and that these firms tended to be more productive on average. More than half of the firms that began exporting were in the top 20th percentile of labour productivity and these highly productive firms were 3 times more likely to start exporting in response to tariff liberalization compared to the least productive firms.
How do these changes in the composition of firms in the market affect Canadian welfare? Lileeva and Trefler (2010) show that the overall labour productivity in the Canadian manufacturing sector improved by 13.8% in the wake of tariff concessions under the CUSFTA (Figure 2.9).
Figure 2.9: Overall effect of CUSFTA on Canadian manufacturing productivity
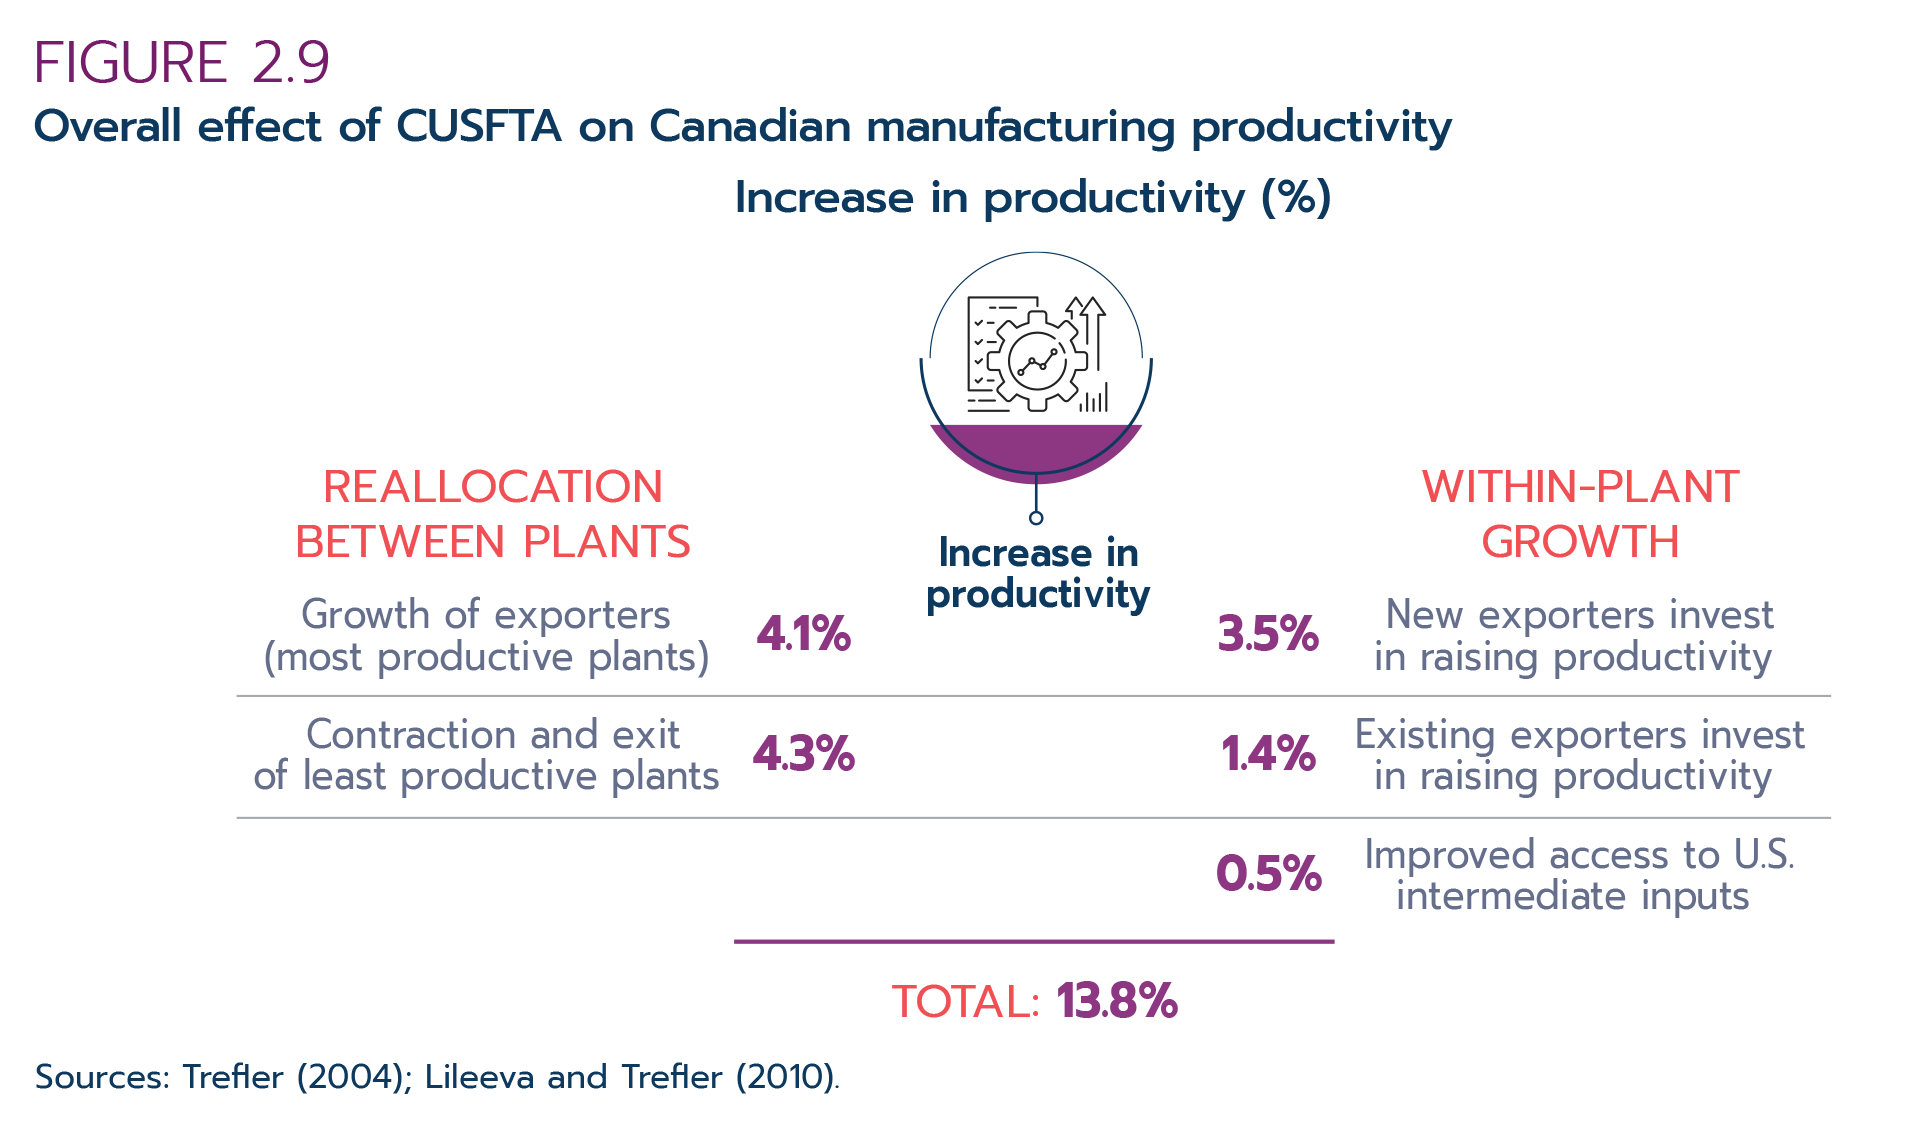
Text version - Figure 2.9
Increase in productivity (%)
| Reallocation between plants | % |
|---|---|
| Growth of exporters (most productive plants) | 4.1 |
| Contraction and exit of least productive plants | 4.3 |
| Within-plant growth | |
| New exporters invest in raising productivity | 3.5 |
| Existing exporters invest in raising productivity | 1.4 |
| Improved access to U.S. intermediate inputs | 0.5 |
| Total | 13.8 |
Sources: Trefler (2004); Lileeva and Trefler (2010).
More than half of the total productivity gains come from allocative efficiency gains between firms (8.4%). These gains can be further broken up into 2 components:
- Growth of exporting firms
- Contraction and exit of least productive firms
First, tariff concessions in the United States under the CUSFTA allowed Canadian firms to export more, shifting the composition of production toward highly productive exporting firms. Lileeva and Trefler (2010) estimate that the growth in highly productive exporting firms raised Canadian manufacturing productivity by 4.1%.
Second, Canadian tariff concessions under the CUSFTA adjusted the landscape of Canadian manufacturing, with exporting firms growing at the expense of non-exporting firms. The least productive Canadian firms either contracted or exited the market. The productivity gains associated with this adjustment in domestic market shares amounted to 4.3%.
Overall, the allocative efficiency gain for the Canadian manufacturing sector in the wake of the CUSFTA is 8.4%, a significant gain in productivity in a relatively short time.
The authors emphasize that these findings provide significant support for the theory of allocative efficiency gains not only in the Canadian context but beyond. The variation shown in Canadian manufacturing firms is common across many countries, including the United States (Bernard et al., 2003), European countries (Mayer and Ottaviano, 2008; Bartelsman, Hatiwanger, and Scarpetta, 2009), as well as China and India (Hsieh and Klenow, 2009). For example, Bernard and Jensen (2004) find that almost half of all growth in U.S. manufacturing productivity from 1983 to 1992 was driven by a reallocation of resources toward exporters.
Productive efficiency gains
Tariff liberalization in the U.S. under the CUSFTA created a larger market for Canadian firms to access, creating favourable conditions that theoretically should encourage these firms to invest in innovation and productivity enhancements.
Lileeva and Trefler (2010) examine their sample of 5,000 firms and find that the labour productivity of the firms that started exporting rose 29% compared to non-exporters. The authors find that the reason for this is because the new exporters invest in technology and innovation more than non-exporting firms.
However, the 29% increase in productivity is not entirely attributable to the CUSFTA alone. Using a statistical technique, the authors determine that the firms that started exporting due to the CUSFTA increased their productivity by 15.3%. Since these newly exporting firms represent only a portion of total Canadian manufacturing output, the authors calculate that new exporters increased the overall productivity of the Canadian manufacturing sector by 3.5%.
The authors also find that existing exporters increased their investments in technology after the CUSFTA came into force. These investments by existing firms contributed to an additional 1.4% improvement in productivity.
Finally, improved access to U.S. intermediate inputs under the CUSFTA increased Canadian manufacturing productivity by 0.5%.
The literature shows that these findings are not unique to Canada. For example, Bustos (2011) examines Argentinian firm-level data following the tariff cuts of the Mercosur regional trade agreement. Bustos finds that firms that began exporting during this period also increased their spending on technology; technology spending increased the most in sectors that experienced the most improved access to Brazilian product markets through tariff cuts. Shen (2016) finds strong complementarities between exporting and productivity-enhancing investments among firms in Spain. Bloom, Draca and Van Reenen (2011) show that European firms increased investments in research and development, patents, and information technology in the face of increased Chinese import competition.
Consumer gains
Free trade expands consumer choices. Under free trade, consumers can buy a wider variety of products produced anywhere in the integrated market. Economic integration also allows production of each individual variety of product to be consolidated for the whole integrated market. Given increasing returns to scale, this reduces average production costs, leading to lower prices for each variety.
This so-called variety effect, which is the cornerstone of pro-free trade arguments, is difficult to measure in a comprehensive way. One study found that the CUSFTA resulted in larger access to mass produced, lower-priced Californian wines for Canadian consumers. This actually ended up benefiting Canadian consumers and Canada’s domestic wine industry, which reduced the number of varieties produced to focus on ice wine as a result of increased competition from Californian wine producers (Beamish and Celly, 2003).
Free trade both lowers import prices and enhances market competition. When nations integrate their markets by removing or reducing the barriers to trade, the number of products, both foreign and domestically produced, increases significantly. The additional competition in an integrated market ensures that benefits achieved under free trade, including lower prices, are passed on to consumers.
However, measuring the price effect of trade agreements is notoriously difficult. Many factors influence price movements, including changes in income, fluctuations in exchange rates at the macro level, and changes in consumer tastes and preferences and age distribution of the population at the micro level. These factors and more make efforts to isolate the price effects of FTAs extremely difficult. Empirical literature in this area continues to evolve; evidence will be presented when available.
Conclusion
The recent ex post impact analysis provides compelling evidence that Canada’s FTA programs have made significant contributions to the large increase in Canada’s trade with FTA partner countries. However, increased trade between FTA partner countries does not guarantee that greater trade between FTA partner countries under an FTA would necessarily improve welfare. A key challenge in measuring such improvements to economic welfare is determining whether FTAs lead to trade creation as opposed to simply diverting trade. This question arises because of trade diversion, which might result in suboptimal welfare outcomes compared to outcomes from multilateral or even unilateral trade liberalization.
2.3 The labour market impact of free trade agreements
Introduction
Free trade plays a central role in driving trade growth, improving economic efficiency and achieving economic prosperity in many parts of the world. That said, trade agreements do not necessarily improve the lives of everyone within an economy. Free trade might boost national welfare in the aggregate, but there is no guarantee that people in all segments of the labour market would be better off from freer trade. Therefore, trade agreements need to be appropriately designed to ensure that all segments of society, including historically overlooked and under-represented groups, can benefit and take advantage of the opportunities that flow from free trade.
To address these concerns, nations conduct both ex ante and ex post labour market impact assessments for the trade agreements they negotiate, in addition to their regular economic impact assessments (Box 2.3). This section will focus on the ex post labour impact assessment of free trade agreements, summarize the key findings from the latest literature in this area, and draw out the lessons learned from the recent experiences of Canada and other countries.
Policy-makers and economists alike acknowledge that under free trade there will be some winners and some losers. Yet, society at large can ultimately expect better overall economic outcomes as the gains to winners more than sufficiently offset any losses incurred by those experiencing adverse effects from foreign competition. It is this assurance that motivates nations to pursue free trade. From an analytical perspective, it is therefore critical to empirically validate that this assurance remains well-founded after decades of intensive globalization and economic integration between nations.
Free trade has 2 notable impacts on a country’s labour market:
- First, as a result of freer trade, nations benefit from increased foreign market access and expanding domestic business and job opportunities. The importance of such export-led job growth for a nation’s income is also reinforced by the fact that wages in export-oriented firms tend to be higher than wages in firms that are less export-oriented.
- Second, freer trade enables domestic consumers and producers to purchase imported goods and services at lower prices; however, increased foreign competition from freer trade may reduce the demand for domestically produced goods and services. Local firms in affected industries become vulnerable when barriers to protect them are removed or reduced under free trade agreements. These industries may have to undertake significant adjustments to adapt to the new economic reality: they can innovate to become more productive and face import competition better, or they can close plants, cut jobs and reduce earnings, which could affect some workers and communities.
Box 2.3: Ex ante labour market impact assessment of future trade agreements
While this section focuses on the ex post impact assessment of free trade agreements on the labour market after they have come into force, the Office of the Chief Economist at Global Affairs Canada has also developed a labour market module for the ex ante labour market impact assessment of future trade agreements. The labour market module expands upon the traditional computable general equilibrium (CGE) model by taking into account gender, age, and the distribution of Canadian workers across 8 different occupational groups and 65 sectors of the economy. This module can estimate the number of jobs added or affected by trade agreements for women, youth and others in various sectors and occupational groups because of a trade agreement.
This new approach departs from the traditional economic modelling in a fundamental way. First, traditional CGE models do not focus on the impact on labour markets because they assume that in the long-run everyone who wants a job will find one. Second, they assume that labour markets are friction-free. Given sufficient time, workers can move freely between industries and occupations. The shortcomings of this approach are that it lacks information about the economic well-being of the people behind trade and does not account for the friction that is felt in the short-term regarding the reallocation of jobs in response to an FTA.
Advances in the availability of detailed labour data and economic modelling have made it possible to create a detailed labour market module that allows for significant characterization of workers and their occupations, as well as accounting for friction in the labour market as workers move into and out of the labour market and between jobs.
Statistics Canada census data provide labour market data by gender, occupation, sector of employment, and age. However, this is just a snapshot in time of Canadian labour market conditions. Policy-makers are also interested in transitional dynamics, that is, how the labour market might adjust in the event that a new free trade agreement is signed. To account for this, Statistics Canada’s Survey of Labour Income Dynamics (SLID) is used to obtain information on how workers change their occupations over time, or when they enter or leave the labour market. By combining the SLID data with the Canadian census data, it is possible to know which industries have demand for certain occupations and what type of workers are willing to transition between occupations.
When these data are linked to a model of international trade, it is possible to estimate how the labour market might react to economy-wide changes stemming from a free trade agreement. As sectors expand or contract, demand for labour and occupations can change, necessitating an adjustment process in the economy as workers potentially change industries or occupations to pursue new opportunities.
When this economic modelling is completed early in the negotiations process, policy-makers can understand which industries, occupations, genders and age groups could benefit or face challenges as a result of a new free trade agreement and use this information to inform further negotiations. This new approach to modelling is being used in current and future economic impact assessments in the Office of the Chief Economist at Global Affairs Canada (see, for example, GAC, 2022).
This section reviews recent empirical evidence of tariff reduction commitments under trade agreements and increased imports penetration in general on the labour market in Canada.
Evolution of the debate on trade and labour
The concerns over the negative impact of free trade on the comparatively disadvantaged industries is not new. Trade theory—specifically, the Stolper-Samuelson effect (Stolper and Samuelson, 1941)—predicts that free trade could lead to an increase in returns for capital and skilled labour relative to low-skilled labour in countries where capital and skilled labour are relatively abundant. The reverse is predicted to occur in countries where low-skilled labour is abundant. In other words, the Stolper-Samuelson effect suggests that international trade might make skilled workers in industrialized countries relatively better off compared to unskilled workers during the course of globalization.
The Stopler-Samuelson effect is applicable for trade between countries with very different economic characteristics such as trade between developed and less developed countries. Under the Stopler-Samuelson framework, trade is mainly driven by the differences in national economic characteristics. As such, it provides little guidance on trade between countries with similar economic characteristics and associated labour market consequences, for example, trade between the 2 industrialized countries.
It was the “new trade theory” developed in the 1980s that attempted to explain rising trade between countries with similar national economic characteristics. The new trade theory argues that trade between the 2 similar countries is mainly driven by specialization resulting from the consumer’s love of variety and the desire by firms to increase economies of scale in developing niche products in response to the consumer’s love of variety. The labour market consequences of trade under such a circumstance reflect the changes in the production structure and specialization across countries. This issue will be discussed in the section below on the labour market implications of trade in the context of the Canada-United States Free Trade Agreement (CUSFTA).
CUSFTA’s impact on jobs and income
Implemented on January 1, 1989, the CUSFTA was Canada’s first major trade agreement with the United States, its largest trading partner. The agreement had significant effects on bilateral trade and production patterns between the 2 countries (Head and Ries, 1999; Trefler, 2004). However, very little is known about what happened to workers on either side of the border after the 2 industrialized countries liberalized their trade. A study on the long-run labour market effects of the CUSFTA by Kovak and Morrow (2022) attempts to fill this gap by examining the effects of the CUSFTA on Canadian labour markets according to employment status and the type of firms where workers were employed (small and medium enterprises vs. larger enterprises) using longitudinal, matched employer-employee administrative data between 1984 and 2004 from Statistics Canada. This study tracks the career trajectories of workers who were initially employed in 1988 in industries subsequently subject to both Canadian and American tariff concessions under the CUSFTA.
The CUSFTA provides a unique setting for analyzing a trade shock on labour markets because of the size and extent of economic integration between the 2 countries, with a large number of Canadian industries involved in trade with the U.S. Trade with the U.S. accounts for over 70% of Canada’s total trade and more than 50% of total production. In some extreme cases, like the automotive industry, more than 90% of Canadian automotive production is exported to the United States.
Job losses and worker displacement following the implementation of the CUSFTA yielded varying effects based on the attachment of workers to the labour market. Notably, research investigates whether impacts differ across workers with high or low attachment to the labour force. High attachment workers are those who were consistently employed, while low attachment workers are those who were inconsistently employed. More specifically, “high” attachment refers to workers who had earnings in every year in a given period (in the case of results presented below between 1985 and 1988, inclusively) that equalled or exceeded 1,600 annual hours of work at the nominal provincial minimum wage in the province of employment (Autor et al., 2014).
Following the implementation of the CUSFTA, Canadian workers initially employed in manufacturing industries that subsequently lost tariff protection under the agreement experienced an increase in the probability of job loss, especially if they were employed at large firms.
More specifically:
- Workers with low attachment to the labour market in industries that had Canadian tariff concessions under the CUSFTA had a higher probability (3.1 percentage points) of losing their jobs compared to workers in industries with no Canadian concessions. On the other hand, if these workers were in an industry that benefited from U.S. tariff reductions, that is, providing greater access to their industry to the U.S. market, they were 2.8 percentage points less likely to lose their jobs.
- In contrast, workers with high attachment to the labour market were less affected by Canadian concessions. Highly attached workers in affected industries were 1.1 percentage points more likely to lose their jobs than workers in industries without concessions. Similar to low attached workers, high attached workers were 2.6 percentage points less likely to lose their jobs when working in an industry that benefited from U.S. concessions.
- Overall, low attachment workers were more negatively affected by the CUSFTA on average, while high attachment workers were more likely to have job stability.
Kovak and Morrow (2022) also found that the agreement did not lead to lower total earnings for either low or high attachment workers.
- Low attachment workers: on average, low attachment workers in Canada saw earnings that were 0.6% lower due to Canadian concessions under the CUSFTA. However, the negative effect was offset by higher earnings in other industries such as construction, mining, and services. Earnings rose by 1.4% due to U.S. concessions, which yielded an overall positive effect on earnings for low attachment workers.
- High attachment workers: U.S. concessions increased the cumulative earnings of high attachment workers by 1.6%, while Canadian concessions decreased earnings of high attachment workers by 0.2%.
- Overall, job separations or displacements did not lead to lower cumulative earnings for either low or high attachment workers. Short-term income losses in the initial industry of employment were offset by higher earnings in other sectors, including services, construction, and mining in the longer term.
- Finally, Kovak and Morrow (2022) also found that low attachment workers did not experience permanent job displacement as a result of Canadian tariff concessions. There was a high probability of re-employment in other manufacturing industries, in other firms in the same manufacturing industry or in other industries such as construction, mining, and services. This labour market mobility is consistent with trade theory and could be a contributing factor to the limited impact on long-run earnings for low attachment workers.
Conclusion
The literature shows that increased trade between developed countries has a limited impact on labour market outcomes. In the context of the CUSFTA, the literature did not find higher rates of permanent displacement in industries with significant Canadian tariff concessions. Indeed, there was a high probability of re-employment in other manufacturing industries, in other firms in the same manufacturing industry or in other industries. More importantly, displacement under the CUSFTA did not lead to lower cumulative earnings for affected workers. Income losses in the short run in the initial industry of employment were offset by higher earnings in other sectors in the longer term.
The effect of the CUSFTA represents textbook labour market dynamics: job opportunities in expanding sectors mostly make up for jobs lost in import-competing sectors. However, the CUSFTA is not the best test case to examine the Stolper-Samuelson effect given that the trade agreement is between 2 of the world’s capital-intensive industrialized countries with skilled labour forces.
There is no evidence in recent trade literature to support the view that the costs of free trade have exceeded the benefits. Free trade as a whole leaves participating countries better off in the aggregate, but the review of the literature shows that increased trade, particularly with developing countries, can have localized negative effects on the labour market. A good understanding of expected significant adjustments is key to designing future free trade agreements in the best possible way or have transition programs and policies ready to attenuate such adjustments.
2.4 Beyond the border—assessing FTAs beyond tariffs
Traditionally, analyses of FTAs have focused primarily on the economic and welfare impacts of reducing tariffs on goods. However, with tariffs now at historical lows globally, other FTA commitments are gaining in prominence and importance.
This includes obligations that:
- increase transparency and reduce red tape to make trade simpler and less costly
- provide greater certainty and predictability for exporters, service providers and investors by locking in market access and regulatory requirements
- ensure trade liberalization goes hand-in-hand with broader goals, such as addressing environmental degradation and climate change and protecting human and labour rights
As the scope of FTAs has grown, researchers have started to evaluate whether these commitments are achieving their intended outcomes. This is an important step to take as policy-makers in Canada and around the world seek to ensure that decisions are based on evidence in order to secure the best outcomes for their populations and businesses. Accordingly, the following sections will summarize a selection of existing empirical analyses regarding key areas of FTAs beyond tariffs and may help to provide an early indication of whether existing FTA provisions are working and where further research may be warranted.
While initial results are promising, there are limitations to such analyses. For example, conditions such as transparency or certainty are difficult to quantify. Moreover, in some cases, relevant data are either missing, inconsistent or incomparable (for example, across sectors or countries). While Canada has established deeper, more comprehensive commitments in its recent FTAs, such as the Comprehensive Economic and Trade Agreement (CETA), the Comprehensive and Progressive Agreement for Trans-Pacific Partnership (CPTPP) and the Canada-United States-Mexico Agreement (CUSMA), it is too early for the impact of these newly introduced, non-tariff commitments to be reliably measured. Researchers and analysts will need to continue improving upon existing analytical approaches to provide policy-makers with the most accurate and applicable information available.
Easing the burden of non-tariff barriers to trade
With tariffs diminishing over time, non-tariff measures are increasingly shaping trade and have outpaced tariff-related barriers in influencing the flow of goods and services (UNCTAD and WTO, 2018; Cadot, Gourdon and van Tongeren, 2018; UNCTAD, accessed 2022).
Economies typically adopt measures in the pursuit of legitimate policy objectives. However, these measures can make trade more challenging or costly, if not impossible when they are used to block imports, take the form of regulations or procedures that discriminate in favour of domestic suppliers, are opaque or difficult to navigate or are unnecessarily difficult for exporters to comply with (Abbyad and Herman, 2017). If not addressed, any of these measures can erode the market access benefits of FTAs. Addressing non-tariff barriers is now considered as important as addressing tariffs in determining access to markets (WTO, 2021).
The following can make trade more costly for a business:
- quotas that limit the quantity of imports
- duplicative or conflicting regulations
- labelling requirements
- requirement to include locally produced content in a product
- government purchasing policy that favours domestic products
- domestic subsidies
- overly burdensome administrative procedures
- arbitrary rules or standards on food or products
Box 2.4: Protecting Canadians
Some regulations make sense, such as those designed to protect the health of consumers or the environment. While regulations can have an important role, they can also unnecessarily restrict or distort trade or be more restrictive than necessary to achieve the intended policy objective.
Canada’s FTAs preserve the ability to take measures necessary to protect health, safety and the environment, while ensuring that these measures are based on science, are no more trade restrictive than necessary and are not discriminatory or a disguised restriction on trade.
Canada seeks to reduce costs of doing business through its FTAs by:
- enhancing transparency and good regulatory practices, including by ensuring that FTA partners make their respective rules and regulations visible, easy to access and as simple as possible
- ensuring that technical regulations, standards and procedures do not discriminate against foreign products or create unnecessary obstacles to trade
- encouraging regulatory cooperation and the use of international standards to harmonize regulations and simplify the global regulatory environment for exporters
- working to keep customs procedures transparent, predictable and consistent for traders
- helping to ensure that market access gains for Canadian agriculture, agri-food and forestry products are not undermined by unnecessary or scientifically unjustified sanitary- or phytosanitary-related trade restrictions
- promoting cooperation between experts to resolve problems and raise concerns
Measuring effectiveness of FTAs in easing the burden of non-tariff barriers to trade
Given the significant impact of non-tariff barriers on trade, a growing body of research is examining whether FTAs successfully address such barriers. This work is in its early stages and has proven challenging given the diverse types of non-tariff measures, which are often difficult to detect or quantify (Abbyad and Herman, 2017). Many FTA provisions that aim to facilitate trade and address non-tariff barriers are incremental and discrete, and their benefits are difficult to quantify on an economic basis.
These studies provide early evidence that FTAs could be effective at lowering trade barriers as well as the costs of trade. In a rough assessment of “deep integration” clauses of FTAs, such as harmonization and mutual recognition of standards or conformity assessment, researchers found that these FTAs dampen the cost-raising effects of non-tariff measures by approximately 20 to 25% (Cadot and Gourdon, 2016). One paper found that FTAs that have deeper transparency provisions appear to more strongly promote trade, increasing bilateral trade by more than 1% per transparency provision (Lejárraga and Shepherd, 2013).
A first working paper on the impact of trade facilitation provisions suggests that they have a small yet statistically significant impact on bilateral trade costs between FTA partners. This effect can be more pronounced when supported by multilateral, regional or bilateral Aid For Trade facilitation measures (Duval, Neufeld and Utoktham, 2016). The paper notes that more work is needed to understand the effectiveness of trade facilitation provisions, including new indicators and innovative ways to estimate the impact of measures on trade and trade costs.
A study of Chile’s, Colombia’s and Peru’s FTAs found that exports by small firms increased by 40% on average for FTAs with more provisions to reduce technical barriers to trade and 10% for larger firms (Fernandes et al., 2021). In another novel study, researchers found that targeted government-to-government regulatory cooperation had a positive effect on trade and reduced compliance costs (Cadot, Gourdon and van Tongeren, 2018).
The ability to strengthen this type of analysis depends on strong data. The United Nations Conference on Trade and Development (UNCTAD) has been developing a comprehensive set of non-tariff measure indicators, which now cover 100 economies and over 90% of global trade (WTO, 2021). This is the first attempt to quantify and bring together consistent data from across economies, though the availability and quality of data remains uneven.
UNCTAD’s early work to quantify non-tariff measures across countries and sectors indicates that non-tariff measures have a bigger influence on trade than tariffs (UNCTAD and WTO, 2018).
The following non-tariff measures are the most frequently used:
- 1) technical barriers to trade, which affect approximately 65% of global imports
- 2) export measures, affecting 20% of global exports
- 3) sanitary and phytosanitary measures, covering close to 20% of global imports (concentrated in the agriculture sector)
Notably, the available data do not yet allow researchers to separate legitimate measures from protectionist ones. Further work is required to quantify and understand the implications of these measures on a practical level in a way that could better inform trade rules.
Others continue to build on UNCTAD’s work by attempting to quantify the trade costs of non-tariff measures and have developed promising approaches (Cadot, Gourdon and van Tongeren, 2018). In addition, the Organisation for Economic Co-operation and Development’s (OECD’s) Trade Facilitation Index can help benchmark the condition of border procedures and assess improvement over time. We can expect to see this type of analysis become more robust over the coming years.
Until data quality is sufficiently strong, the most promising route for an ex post evaluation is a qualitative assessment. This could focus on how Canada’s FTAs have been used to discipline non-tariff measures to avoid the adoption, implementation and entry into force of non-tariff barriers that erode market access. It will likely remain more challenging to evaluate whether trade rules in a specific FTA have prevented a trading partner from putting in place new non-tariff barriers. The ability to undertake these types of evaluations will depend on the strength of underlying data and the body of research that these data inform.
Increasing certainty and predictability
Uncertainty can challenge a firm’s ability to engage in international markets. In practice, uncertainty may appear in many forms. For example, businesses may believe that a country might alter the course of its trade or investment policy in the foreseeable future, such as by changing tariffs or implementing new regulatory requirements. This may increase the level of perceived risk and affect the interest of businesses in pursuing economic or financial opportunities in that market. Beyond impacting individual firms, a lack of certainty and predictability can also threaten broader supply chains. The OECD states “stable, transparent and predictable trade and investment policy regimes reduce uncertainty costs for businesses, while open and rules-based trade facilitates supply chain diversification choices by firms” (OECD, retrieved 2022).
FTAs are often touted for their liberalizing effects, providing preferential market access to trading parties through a reduction in tariffs and other barriers. However, certainty and predictability are also critical for businesses. FTAs provide certainty and predictability for trading actors, such as exporters, service providers and investors, by committing parties to “lock in” certain conditions.
For example, Canadian FTAs can provide certainty and predictability in several ways (Figure 2.10).
Figure 2.10: How FTAs can provide certainty and predictability
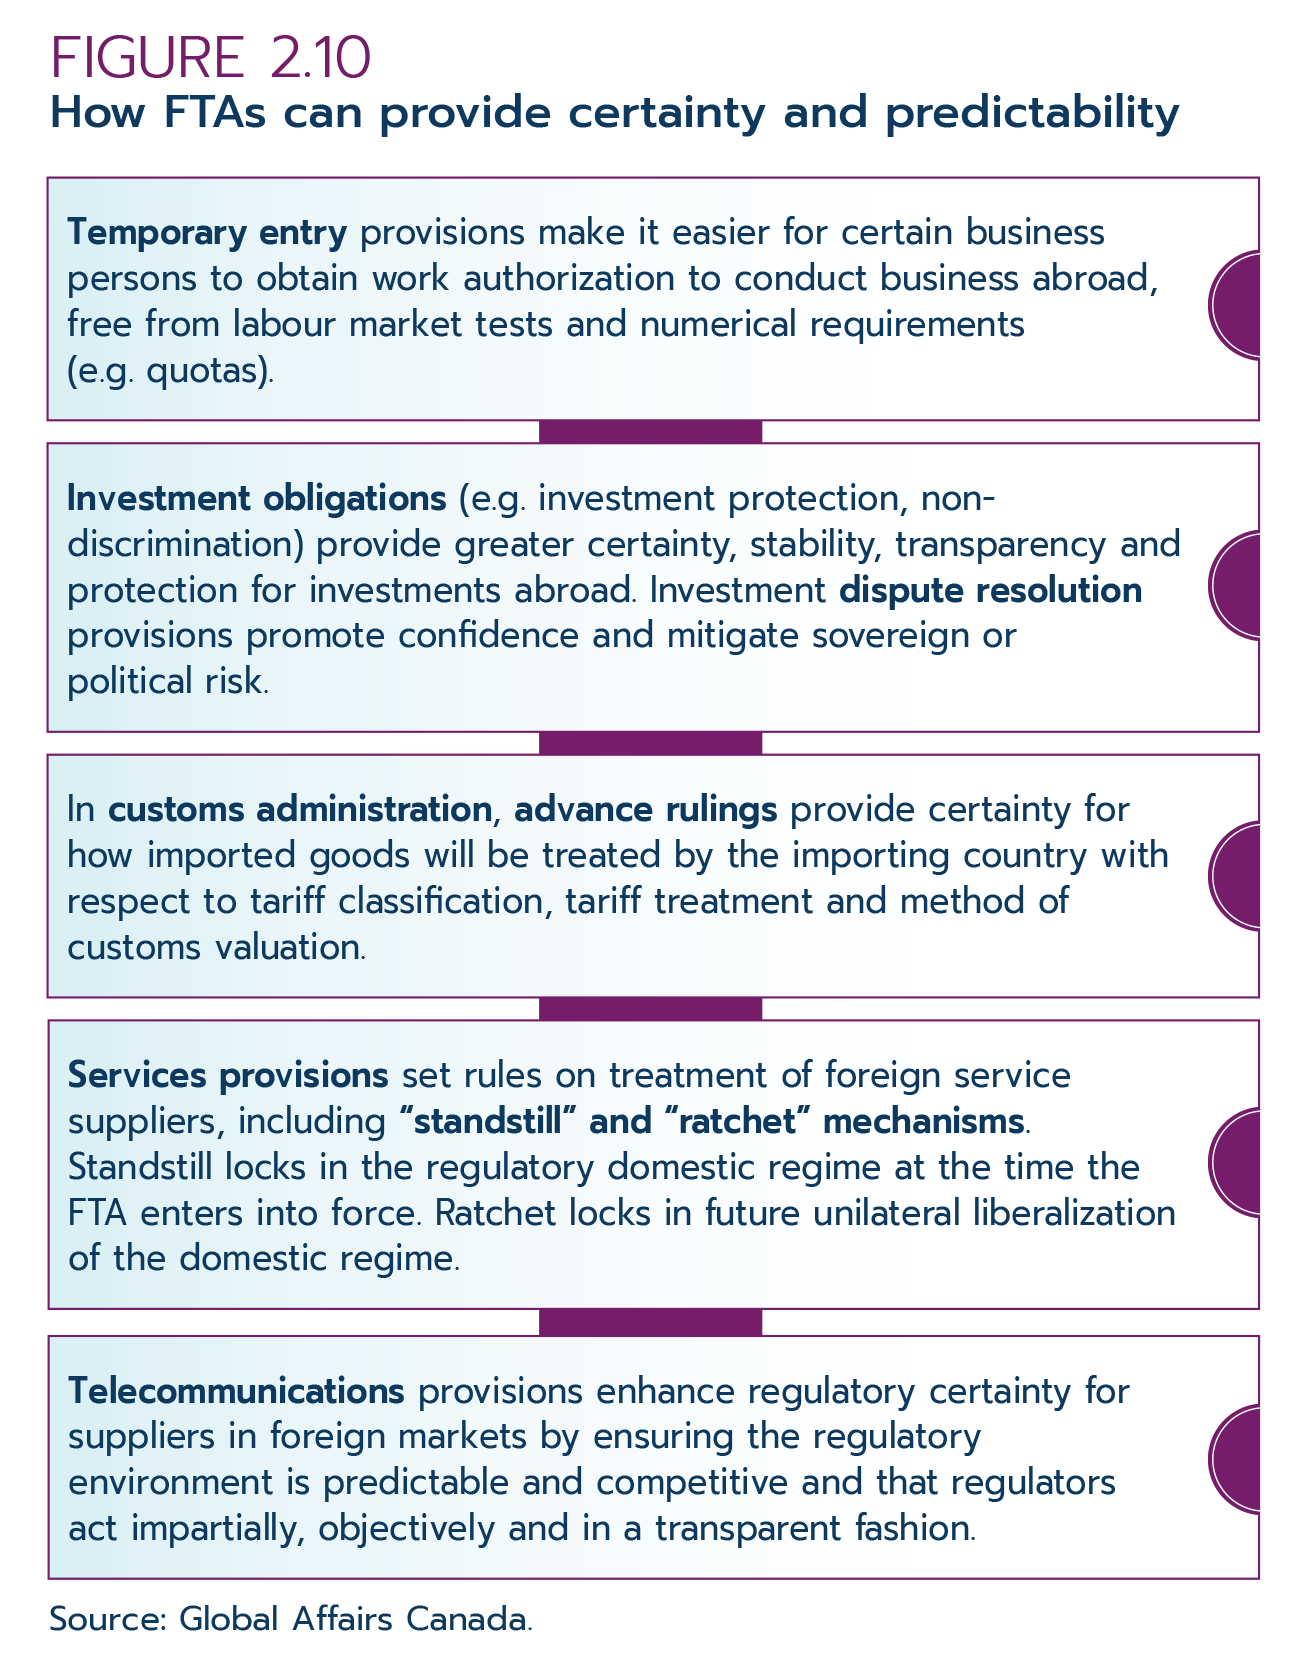
Text version - Figure 2.10
Temporary entry provisions make it easier for certain business persons to obtain work authorization to conduct business abroad, free from labour market tests and numerical requirements (e.g. quotas).
Investment obligations (e.g. investment protection, non-discrimination) provide greater certainty, stability, transparency and protection for investments abroad. Investment dispute resolution provisions promote confidence and mitigate sovereign or political risk.
In customs administration, advance rulings provide certainty for how imported goods will be treated by the importing country with respect to tariff classification, tariff treatment and method of customs valuation.
Services provisions set rules on treatment of foreign service suppliers, including “standstill” and “ratchet” mechanisms. Standstill locks in the regulatory domestic regime at the time the FTA enters into force. Ratchet locks in future unilateral liberalization of the domestic regime.
Telecommunications provisions enhance regulatory certainty for suppliers in foreign markets by ensuring the regulatory environment is predictable and competitive and that regulators act impartially, objectively and in a transparent fashion.
Source: Global Affairs Canada.
Canada is also working hard to provide certainty and predictability in rapidly evolving sectors via rules for digital trade and environmental provisions (Figure 2.11).
Figure 2.11: How FTAs can provide certainty and predictability in rapidly evolving sectors
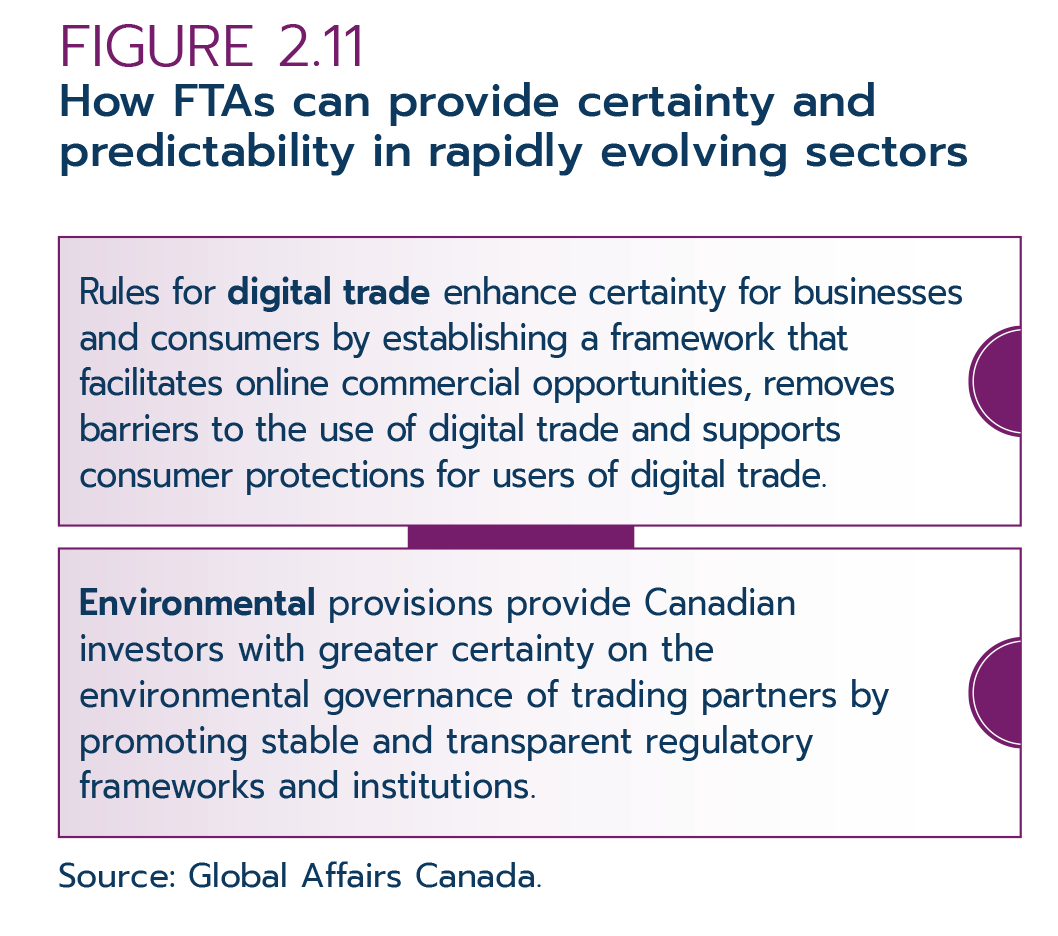
Text version - Figure 2.11
Rules for digital trade enhance certainty for businesses and consumers by establishing a framework that facilitates online commercial opportunities, removes barriers to the use of digital trade and supports consumer protections for users of digital trade.
Environmental provisions provide Canadian investors with greater certainty on the environmental governance of trading partners by promoting stable and transparent regulatory frameworks and institutions.
Source: Global Affairs Canada.
Measuring effectiveness of FTAs in increasing certainty and predictability
Uncertainty reduces trade (Novy and Taylor, 2020), for example, by delaying the entry of exporters into new markets and making them less apt to take advantage of tariff reductions (Handley, 2011). The negative impact of uncertainty is magnified (1) in global value chains where goods cross multiple borders and incur the cost of trade barriers at each step and (2) when exporters are seeking to export to countries where institutions lack credibility (Handley, 2011).
Binding commitments are one avenue to reduce or eliminate trade policy uncertainty, thus facilitating expansion into new markets and economic activity (Handley, 2011; Handley and Limão, 2015; Handley and Limão, 2017). Interestingly, this positive trade effect does not require a reduction in tariffs: binding commitments, such as those in FTAs, can be effective on their own. Binding commitments for services trade have been found to increase trade (Limão and Maggi, 2015; Borchert and Di Ubaldo, 2021). While both multilateral commitments and FTAs have positive effects on trade, the supplementary commitments and resulting certainty found in FTAs produce additional gains (Ciuriak, Dadkhah and Lysenko, 2020; Benz and Rozensteine, 2021). As an example, the U.S. International Trade Commission stated that CUSMA’s binding commitments that reduce trade policy uncertainty, such as those relating to cross-border trade in services, digital trade and e-commerce, will have a positive effect on trade, similar to tariff reductions (Shikkher and Torsekar, 2019). Likewise, a Global Affairs Canada economic impact assessment of CUSMA indicated that the agreement could reduce policy uncertainty in certain areas such as services, investment and digital trade, though did not evaluate these benefits given limitations with existing analytical models (GAC, 2020).
Advancing broader policy priorities in FTAs
Countries continue to seek opportunities for FTAs to support the development of coherent, mutually supportive policies to underpin competitive, sustainable, productive and resilient economies. The most notable policy areas include environmental and labour standards, which have seen a rapid expansion in scope, depth of coverage and enforceability in FTAs over the past 20 to 25 years (Monteiro, 2016). Provisions in these areas are broadening and deepening as countries put forth new and innovative mechanisms to protect the environment and mitigate climate change, advance human rights, level the economic playing field and more.
Environmental protection and the advancement of international labour standards are pillars of Canada’s policy agenda, pursued multilaterally at the UN and OECD and bilaterally through additional cooperation and technical assistance mechanisms.
Canadian FTA provisions include the following:
| Environment | Labour |
|---|---|
|
|
Measuring effectiveness of advancing broader policy priorities in FTAs
Environment
In light of the proliferation of environmental provisions in FTAs, studies increasingly seek to quantify the effectiveness of different approaches at achieving their targeted outcomes. This work remains nascent, however, and often coarse in its analysis. That said, early research suggests that environmental provisions can contribute meaningfully to broader environmental goals. As economies increasingly innovate to address urgent global issues, such as climate change and biodiversity loss, additional research on the factors that best contribute to targeted outcomes will be helpful to ensure commitments are as effective as possible (Berger et al., 2017).
Research indicates that, in the absence of FTA provisions that aim to protect forests or preserve biodiversity to mitigate the impacts of trade liberalization, there was a “large, significant net increase [of 23%] in annual forest loss” (Abman et al., 2021). When FTAs included forest-related provisions, however, such provisions entirely offset the net increase in forest loss observed for FTAs without them. The research also suggested that, while there may be a negotiating “cost” to include environmental provisions, such provisions appear to provide an institutional framework that allows countries to commit to policies that encourage sustainable patterns of trade.
A recent study found that the design of FTAs can contribute to reducing the export of environmentally harmful goods and to increasing so-called “green” goods, particularly for developing countries with strong environmental performance (Brandi et al., 2020). This suggests that FTA provisions can be used as targeted policy tools to encourage greener trade and will be an important area of future research as this issue becomes more important.
The Brandi study builds on earlier research indicating that environmental provisions in FTAs have the potential to contribute to environmental sustainability both by promoting domestic environmental legislation (Bastiaens and Postnikov, 2017; Brandi, Bruhn and Morin, 2019) and by reducing air pollution and carbon dioxide emissions (Martinez-Zarzoso and Oueslati, 2016; Baghdadi, Martinez-Zarzoso and Zitouna, 2013).
A study of governmental compliance with environmental provisions found a lack of public information on the extent to which these provisions have been implemented for the majority of FTAs (George and Yamaguchi, 2018). The study’s findings drew largely on a qualitative survey of governments. Based largely on their analysis of anecdotal evidence, the researchers suggested potentially powerful approaches to ensuring implementation of environmental provisions: public accountability mechanisms (e.g. submissions, complaints, dispute settlement process), strong mechanisms for public involvement and clear institutional mechanisms that specify monitoring and reporting requirements.
The OECD noted the imperative need for additional data, analysis and policy proposals in this field in light of heightened public and policy attention at a time of major transformation at the trade policy and environment nexus (OECD, 2020).
Labour
The North American Agreement on Labour Cooperation (NAALC), a side agreement to the original North American Free Trade Agreement (NAFTA), was the first FTA to include labour standards. Since the agreement was introduced, Canada and others have intensified efforts to advance human rights and level the economic playing field by including labour provisions in FTAs. Despite these ongoing efforts, relatively few studies have sought to empirically analyze the effectiveness of such provisions, and data limitations remain, especially with regard to observing and quantifying labour standards.
Looking broadly at human rights, 1 study found countries that commit to enforceable human rights agreements and FTA provisions are likely to decrease state repression of human rights (Hafner-Burton, 2005). Where commitments are aspirational, the positive effect is lost.
Looking specifically at labour standards, some large-scale studies empirically evaluate the effectiveness of FTA provisions. An assessment of numerous FTAs containing labour provisions showed FTAs partially improve labour conditions in participating countries (Martinez-Zarzoso and Kruse, 2019).
Looking across countries, there is evidence that labour provisions can support non-discrimination in the workplace and encourage more women to join the labour force (Aissi et al., 2016). Considering FTAs involving the United States, negotiating partners have been found to improve their labour standards (Kim, 2012). One study found that this effect occurred during negotiations rather than after an agreement was completed (Kim, 2012). This indicates that countries may improve their labour protection in order to secure a trade agreement with the U.S. However, another study of only Latin American countries found that an agreement with the U.S. led to an increased number of labour inspectors and inspections, likely due to the stringency of the provisions and U.S. enforcement capabilities (Dewan and Ronconi, 2018).
A study of EU FTAs found EU trading partners also improve their labour rights when entering into trade agreements with the EU (Postnikov and Bastiaens, 2014). However, this effect occurs after an agreement has come into force. The difference between the results of this study and that involving the U.S. is likely due to differences between U.S. and EU trade agreements. Specifically, while U.S. FTAs typically include coercive economic sanctions to deter violations, EU labour provisions tend to create institutions for collaboration and education that generate gradual learning once the agreement is in force.
Finally, an extensive study found an important role for capacity-building, monitoring mechanisms and legal reforms, including the involvement of civil society, in improving labour-related outcomes (Aissi et al., 2016). This is an important finding for Canada, whose approach largely relies on such mechanisms to improve labour standards among trading partners.
2.5 Free trade agreements, diplomacy and governance
Free trade agreements (FTAs) have been used for centuries to enhance diplomatic ties and economic growth among all signatories. As international engagement deepens as a result of FTAs, including by introducing new issue areas and broadening regional coverage, governments and researchers are increasingly interested in the impact of these arrangements on wider diplomatic relations and governance (Figure 2.12).
Figure 2.12: The interconnectedness of FTAs and other elements become self-reinforcing

Text version - Figure 2.12
A diagram shows 5 circles, each connected to each other. Each of the circles contains 1 word, as follows: diplomacy, security, FTAs, governance, and society.
Source: Global Affairs Canada.
Under Canada’s inclusive approach to trade, recent FTAs and agreements currently being negotiated reflect an understanding that the benefits of trade and investment must be shared more widely, including with traditionally under-represented groups, such as small and medium-sized enterprises (SMEs), women and Indigenous peoples, and that trade agreements should help advance other economic, social and environmental policy priorities. In FTAs, for example, this includes strengthened provisions on labour rights, the environment, anti-corruption, and responsible business conduct, in addition to new provisions to facilitate greater participation of and benefits for workers, SMEs, women, and Indigenous peoples in international trade.
FTAs and diplomacy
Extensive research has been conducted on the impact of diplomatic and political ties on the negotiation of FTAs (Grossman and Helpman, 1995; Plouffe and Van der Sterren, 2016). Recently, a smaller but growing body of research has begun to examine the impact of trade and FTAs on international relations. While we can expect this field of research to expand over the coming years, in part due to modernized FTAs and enhanced government data collection and reporting, academic research on this question remains nascent for a number of methodological reasons. As the number of high-quality and comparable FTAs grows, we can expect further research to emerge on:
- quantifying and measuring diplomatic outcomes relative to economic and welfare outcomes
- identifying causal relationships between FTAs, other agreements, and diplomatic events or trends
- comparing the effects of diverse types of FTAs and their broader diplomatic contexts
- examining the impacts of the relatively recent deepening FTA measures beyond purely economic provisions (including those addressing labour and environmental governance)
The proliferation of FTAs and other forms of international cooperation agreements in recent decades, including immigration, transport, international assistance, and non-proliferation agreements, has provided new ways to analyze, measure, and describe different international relationships between governments, businesses, organizations and people.
By comparing the timing and content of FTAs alongside the same for other international agreements, actions, and trends, research has begun to outline how FTAs spur the creation of other forms of government cooperation. Key findings include:
- increases in the number of FTAs are closely related to the increases in other types of agreements such as those on investment, infrastructure, and transportation (Estevadeordal and Suominen, 2009)
- long-lasting effects can occur between entering into an FTA and subsequent cooperation agreements (Estevadeordal and Suominen, 2007)
- FTAs and other agreements can foster links that extend to multilateral forums, including common voting patterns at the United Nations General Assembly (Sokolova and DiCaprio, 2018)
- FTAs are important to increase trust among countries that have previously been hostile or have had limited partnerships with each other (Ravenhill, 2020)
FTAs also appear to increase familiarity and people-to-people ties between countries. In 1 novel study, researchers found that FTA provisions facilitating business travel were successful in increasing business travel between signatories, which ultimately led to increases in trade flows (Mayer et al., 2021).
Research on members of the Organisation for Economic Co-operation and Development (OECD) suggests that FTAs in general increase bilateral migration flows, with further increases when labour, visa, and asylum provisions are included in FTA provisions (Orefice, 2015). Recent research has also found that FTAs increase bilateral tourism flows between signatories (Khalid et al., 2021), with greater benefits accruing in the earliest years of the agreement and to earlier signatories (Saayman et al., 2016).
FTAs and security
There is growing recognition that FTAs can be important tools for international security and conflict resolution or prevention, though not infallibly, as recent events have shown. Several of Canada’s FTAs, such as the Canada-Jordan FTA, explicitly recognize the importance of FTAs to the promotion of peace and security. There is a limited, but growing, body of research on how FTAs affect global security.
Several studies have found that increased trade between countries with FTAs significantly reduced the likelihood of conflict between or within them (Calì, 2015; Martin et al., 2012; Rohner et al., 2013). This research indicates that FTAs can reduce the prevalence of military disputes by increasing the economic cost of conflict, by providing conflict resolution mechanisms (Mansfield, 2000), and by increasing familiarity between countries’ institutions and populations through the introduction of new or increased engagement mechanisms (Hoekman and Schiff, 2002; Hafner-Burton and Montgomery, 2012).
Yet research also suggests that the interplay between FTAs and security is more complex: trade agreements reduce the risk of conflict by raising the opportunity cost of disputes, but FTAs often rely on existing peace and political decisions as pre-conditions; FTAs can also distort trade and discriminate against countries not party to the agreement and create new risks (Martin et al., 2010).
FTAs, domestic governance and society
In addition to the effects of FTAs on international diplomacy, security and cooperation, research across several fields of study has indicated that FTAs can positively impact domestic institutions and people’s day-to-day lives.
At the institutional level, one study found that FTAs can lead to changes in the governance and structure of domestic institutions, with FTA negotiations and signatures contributing to subsequent economic reforms (Baccini and Urpelainen, 2014). During FTA negotiations and within 5 years of their signing, the authors observed increases in privatization, investor perceptions, and protections for intellectual property rights—although the authors stressed that these economic reforms resulted in trade-offs impacting other parts of society. A study of government relations with business found that the inclusion of regulatory frameworks in trade negotiations contributes to a shift from businesses simply trying to exert pressure on government to a working relationship based on information sharing and technical expertise (Woll and Artigas, 2007).
There is also evidence that FTAs, and trade openness more broadly, can have beneficial impacts on governance beyond the business community. International trade openness has been found to support the process of building and consolidating democracy (Lopez-Cordova and Meissner, 2005; Milner and Kubota, 2005), with evidence that movements toward democratization were supported by preceding efforts to open up economies to international trade. This process of democratization is also reflected in evidence that the greater the participation in FTAs, the lower the likelihood of democratic failures in countries (Liu and Orlenas, 2014).
However, not all democratic rights are enhanced by participating in the international trading system, and moves toward democratization have not been universal (Aaronson and Abouharb, 2010). In other words, rights such as free and fair elections are positively associated with the participation in rules-based international trade, but not in every country. One study suggests that FTA provisions that liberalize trade, open government procurement to competition and increase transparency can diminish the ability of firms to influence the domestic regulatory environment (Mungiu-Pippidi, 2018).
As part of the Government of Canada’s trade diversification agenda, Canada is implementing an inclusive approach to trade, which involves seeking gender responsive and inclusive provisions across FTAs, supported by Gender-based Analysis Plus (GBA Plus) and standalone chapters on trade and gender, SMEs, and trade and Indigenous peoples (Box 2.5).
Box 2.5: Gender-based Analysis Plus in free trade agreements
Canada’s approach aims to ensure that the benefits and opportunities that flow from trade are more widely shared, including with equity deserving groups such as women, small and medium-sized enterprises, and Indigenous peoples.
To deliver on our inclusive approach to trade, Canada is conducting a comprehensive and dynamic Gender-based Analysis Plus (GBA Plus) of our trade agreements on an ongoing basis. GBA Plus is an analytical process the Government of Canada uses to assess how domestic and international policies may affect diverse groups of women, men and non-binary people. The “plus” of GBA Plus aims to ensure that policy-makers consider identity factors of the Canadian population that overlap sex and gender, such as Indigenous identity, race, disability, sexual orientation, and geographic region of residence (urban, rural, remote, coastal or northern). The aim is to put people and their lived experience at the heart of decision making and ensure that policies do not perpetuate or exacerbate existing inequalities.
Figure 2.13: Some intersectionality considerations in GBA Plus
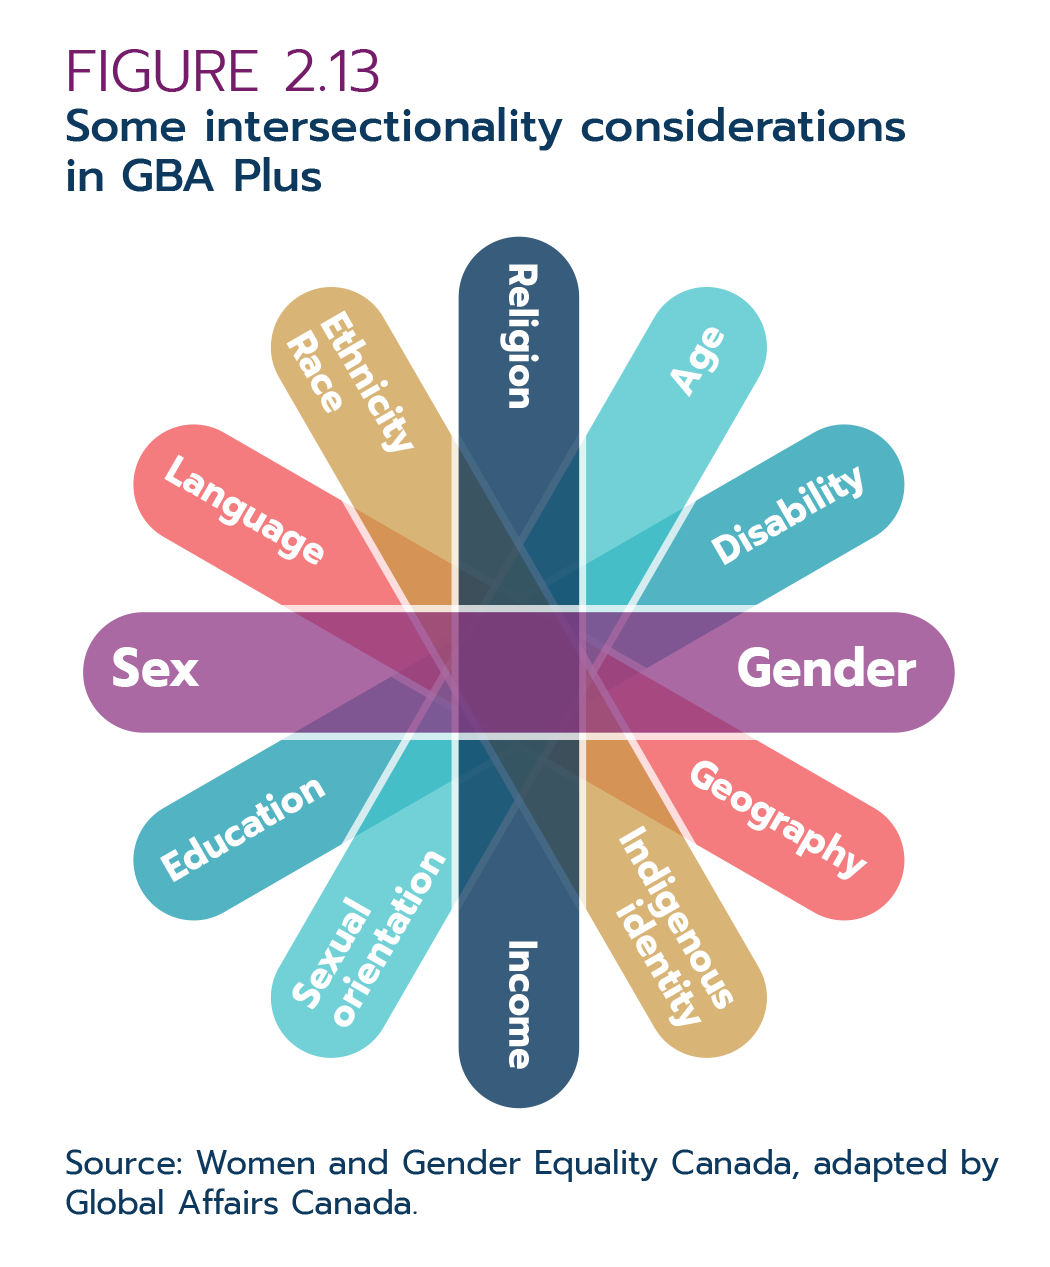
Text version - Figure 2.13
In this figure, 6 coloured oblongs radiate like hands on a clock to illustrate key considerations that can intersect with sex and gender. The oblongs are semi-transparent and presented in layers. The factors are written on opposite ends of each oblong. On the top layer, a purple horizontal oblong displays the word “sex” on 1 end and the word “gender” on the other. The words are in a larger font. On the next layer, a yellow oblong displays the words “ethnicity” and “race” on 1 end and “Indigenous identity” on the other. On the next layer, a light blue oblong displays the words “sexual orientation” on 1 end and “age” on the other. On the next layer, a blue oblong displays the word “education” on 1 end and “disability” on the other. On the next layer, a red oblong displays the word “language” on 1 end and the word “geography” on the other. On the bottom layer, a dark blue vertical oblong displays the word “religion” on 1 end and the word “income” on the other.
Source: Women and Gender Equality Canada, adapted by Global Affairs Canada.
The GBA Plus of trade policy comprises both quantitative and qualitative dimensions. The quantitative analysis component is focused both on women as exporters and women as workers. Global Affairs Canada’s Office of the Chief Economist has published a few papers on the topic of women-owned SME exporters. These papers use a combination of administrative and survey data to better understand the characteristics of women-owned SME exporters (Bélanger Baur, 2019), the challenges and barriers they face when exporting (Sekkel, 2020), and the business decisions that are particularly important for women who export such as e-commerce and innovation (Sekkel and Wang, forthcoming).
For the labour force, Global Affairs Canada expands upon the traditional modelling for the economic impact assessment of trade agreements using the Office of the Chief Economist’s computable general equilibrium model by
- adding an innovative labour market module that takes into account gender, age, income and the distribution of Canadian workers across 8 different occupational groups and 65 sectors of the economy
- assessing the potential impact on our economy following the full implementation of a potential free trade agreement
- allowing estimates of the number of jobs created for women, youth and others in various sectors and occupational groups arising from a trade agreement (see GAC, 2020a, as an example)
The qualitative analysis component of the GBA Plus is conducted by the lead negotiators of each trade agreement chapter on an ongoing basis during negotiations and takes into account the data and evidence, economic modelling and analysis. Many elements are considered, including:
- effects that are direct and indirect, intended and unintended, and positive and negative
- effects on diverse groups of Canadian men and women in their roles as workers, business owners, and consumers and in various sectors
Findings are addressed through trade policy such as by developing a new gender responsive provision or modifying an existing provision to ensure that women benefit, that the negative effects are not exacerbated, or that job losses are mitigated. Changes to domestic policies or programs are also considered potential solutions to a GBA Plus finding.
The GBA Plus process is part of Canada’s standard approach. It is dynamic; it continually realizes benefits to negotiations and allows for tabling of new provisions in real time. GBA Plus is under way for the FTA negotiations with Mercosur (GAC, 2019), the United Kingdom (GAC, forthcoming 2022a), and Indonesia (GAC, forthcoming 2022b).
GBA Plus is also conducted on a final agreement as was the case for the Canada-United States-Mexico Agreement (see summary of findings in GAC, 2020b). In this case, lead negotiators conduct GBA Plus on the final FTA chapter and consider 2 main lines of enquiry:
- what domestic policies and programs need to be developed or redesigned to address risks or enhance opportunities
- how could committee work under each chapter address GBA Plus findings from a review of the final chapter text
Canada’s customized GBA Plus process for FTAs, both ex ante and ex post, includes opportunities for stakeholders to review published summaries and a commitment by GAC to publish What We Heard reports from these consultations and integrate considerations into negotiation, as appropriate (GAC, 2020c).
This groundbreaking approach of applying GBA Plus to trade agreements ultimately changes the way we do trade policy because it helps both negotiators and policy-makers find the best ways to address gender and diversity considerations in the negotiation and implementation of FTAs.
There is evidence that including high standards tied to specific commitments can influence issue areas such as human rights and civil liberties. Research indicates that states that are signatories to FTAs are less likely to repress human rights if the FTA includes enforceable conditions tied to specific human rights principles, as FTAs with sufficiently high standards offer a way to withhold economic benefits in cases where conditions are breached (Hafner-Burton, Emilie, 2005). The same study noted that FTAs with higher human rights standards encouraged better protections of civil liberties such as freedom of expression, the rule of law, and freedom from political terror.
Gender equality, that is, avoiding discrimination based on gender is one of the priorities pursued by Canada during trade negotiations, notably through language regarding the elimination of employment discrimination in labour cooperation agreements and labour chapters in FTAs. More recently, Canada has sought to mainstream gender considerations throughout its FTAs by working to include a standalone chapter on trade and gender and mainstreaming inclusive trade and gender-responsive provisions across FTAs supported by a comprehensive GBA Plus.
Canada’s approach reflects the findings of several empirical evaluations of FTAs and the impacts of trade openness across gender. Increases in international trade are associated with increases in women’s formal employment, greater choice and decision-making autonomy for women, and improved access to education across generations of women (Klugman and Gamberoni, 2012; Higgins, 2012). These benefits increased in countries where women-labour intensive industries are a country’s comparative advantage (Do et al., 2011; Li, 2021). By advancing women’s economic empowerment and ensuring the full inclusion of women in the economy, it is estimated that Canada could add up to $150 billion to its economy by 2026; these advancements in all countries could result in $12 trillion added to the global economy (McKinsey, 2017). In turn, many of these increases in employment, autonomy, and education are associated both with broad-based increases in human rights and equality and more specifically with positive increases in women’s rights and gender equality. Canada looks forward to supporting further academic research to evaluate the gender-related tools in its FTAs.
Conclusion
FTAs have a broad range of effects, including significant positive effects that go beyond immediate economic outcomes or issue areas that are specifically addressed by including non-tariff provisions. Increased research focus, GBA Plus, gender disaggregated data and resources dedicated to ex ante analyses of FTAs have increased our understanding of these effects, which range from enhanced diplomacy, to increased security, and include strengthened domestic institutions and laws as well as gender equality. These impacts better position future FTAs to be tailored to maximize their positive effects and address other issue areas as they arise.
Bibliography
Aaronson, Susan Ariel, and M. Rodwan Abouharb. June 2011. “Unexpected Bedfellows: The GATT, the WTO and Some Democratic Rights.” International Studies Quarterly 55, 2: 379-408.
Abbyad, Nabil, and Peter Herman. 2017. “How much do non-tariff measures cost? A survey of quantification methods.” U.S. International Trade Commission. Retrieved from https://www.usitc.gov/publications/332/abbyad_and_herman_2017_ntm_quantification_survey.pdf
Abman, Ryan, et al. 2021. “The Effectiveness of Environmental Provisions in Regional Trade Agreements.” World Bank Group policy research working paper 9601.
Aissi, Jonas, et al. 2016. Assessment of Labour Provisions in Trade and Investment Arrangements. Geneva: International Labour Organization.
Autor, D. H., D. Dorn, G. H. Hanson and J. Song. 2014. Trade adjustment: Worker-level evidence. The Quarterly Journal of Economics 129, 4: 1799-1860.
Baccini, Leonardo, and Johannes Urpelainen. 2014. “International Institutions and Domestic Politics: Can Preferential Trading Agreements Help Leaders Promote Economic Reform?” The Journal of Politics 76, 1.
Baier, S. L., and J. H. Bergstrand. 2007. “Do free trade agreements actually increase members’ international trade?” Journal of International Economics 71, 1: 72-95.
Baghdadi, L., I. Martinez-Zarzoso and H. Zitouna. 2013. “Are RTA agreements with environmental provisions reducing emissions?” Journal of International Economics 90, 2: 378-390.
Bartelsman, E., J. Haltiwanger and S. Scarpetta. 2009. “Measuring and analyzing cross-country differences in firm dynamics.” Producer Dynamics: New evidence from micro data, Dunne, T., J. B. Jensen and M.J. Roberts (eds), pp. 15-76.
Bastiaens, I., and E. Postnikov. 2017. “Greening up: The effects of environmental standards in EU and US trade agreements.” Environmental Politics 26, 5: 847-869.
Beamish, P. W., and N. Celly. 2003. “Vincor and the New World of Wine.” Case Study. Harvard Business Review.
Bélanger Baur, Audrey Ann. 2019. “Women-owned exporting small and medium enterprises—Descriptive and comparative analysis.” Global Affairs Canada. Retrieved from http://www.international.gc.ca/trade-commerce/economist-economiste/analysis-analyse/women_owned-export-entreprises_femmes.aspx?lang=eng
Benz, Sebastian, and Inese Rozensteine. 2021. “Services Trade Restrictiveness Index (STRI): Measuring services liberalisation and commitments in the GATS and RTAs.” OECD trade policy paper 250. Paris: OECD Publishing. https://doi.org/10.1787/fee5c901-en
Berger, A., et al. 2017. “Environmental Provisions in Trade Agreements: Promises at the Trade and Environment Interface”. German Development Institute / Deutsches Institut für Entwicklungspolitik (DIE). https://www.die-gdi.de/uploads/media/BP_16.2017.pdf
Bernard, A. B., et al. 2003. “Plants and productivity in international trade.” American Economic Review 93, 4: 1268-1290.
Bernard, A. B., and J. B. Jensen. 2004. “Why some firms export.” Review of Economics and Statistics 86, 2: 561-569.
Bhagwati, J., and T. N. Srinivasan. 2002. “Trade and poverty in the poor countries.” American Economic Review 92, 2: 180-183.
Bloom, N., M. Draca and J. Van Reenen. 2011. “Trade Induced Technical Change? The Impact of Chinese Imports on Innovation, IT and Productivity.” Centre for Economic Performance discussion paper 1000.
Borchert, Ingo, and Mattia Di Ubaldo. 2021. “Deep Services Trade Agreements and their Effect on Trade and Value Added.” World Bank policy research working paper 9608. https://openknowledge.worldbank.org/handle/10986/35403
Brown, Chad P., and Douglas A. Irwin. 2017. “The GATT’s Starting Point: Tariff Levels circa 1947” in Assessing the World Trade Organization: Fit for Purpose?. Elsig, Manfred, Bernard Hoekman and Joost Pauwelyn (eds). Cambridge University Press: 45-74.
Brandi, C., D. Blümer and J.-F. Morin. 2019. “When do international treaties matter for domestic environmental legislation?” Global Environmental Politics 19, 4: 14-44.
Brandi, C., et al. 2020. “Do environmental provisions in trade agreements make exports from developing countries greener?” World Development 129, 104899.
Bustos, P. 2011. “Trade liberalization, exports, and technology upgrading: Evidence on the impact of MERCOSUR on Argentinian firms.” American Economic Review 101, 1: 304-40.
Canadian Pacific Railway. 2021. "Canadian Pacific and Kansas City Southern Close Into Voting Trust." Retrieved from https://www.cpr.ca/en/media/canadian-pacific-and-kansas-city-southern-close-into-voting-trust
Cadot, O.J., and J. Gourdon. 2016. “Non-tariff measures, preferential trade agreements, and prices: new evidence.” Review of World Economics.
Cadot, O., J. Gourdon and F. van Tongeren. 2018. “Estimating Ad Valorem Equivalents of Non-tariff measures: Combining Price-based and Quantity-based Approaches.” OECD trade policy paper. https://doi.org/10.1787/f3cd5bdc-en
Calì, Massimiliano. 2015. “How Trade Can Affect Conflict.” Trading Away from Conflict: Using Trade to Increase Resilience in Fragile States. World Bank Group.
Ciuriak, Dan, Ali Dadkhah and Dmitry Lysenko. 2020. "The Effect of Binding Commitments on Services Trade." World Trade Review 19, 3: 365-78. Retrieved from https://www.cambridge.org/core/journals/world-trade-review/article/effect-of-binding-commitments-on-services-trade/0F35120043766FCB49F0953F857692D3
Dent, Christopher M. 2021. “Trade, Climate and Energy: A New Study on Climate Action through Free Trade Agreements.” energies 14, 14: 4363. https://doi.org/10.3390/en14144363
Dewan, Sabina, and Lucas Ronconi. 2018. “U.S. free trade agreements and enforcement of labor law in Latin America.” Industrial Relations 57, 1: 35–56.
Do, Quy-Toan, et al. 2011. “Engendering Trade.” World Bank.
Duval, Yann, Nora Neufeld and Chorthip Utoktham. 2016. “Do trade facilitation provisions in regional trade agreements matter? Impact on trade costs and multilateral spillovers.” ARTNet working paper 164. Economic and Social Commission for Asia and the Pacific.
Estevadeordal, Antoni, and Kati Suominen. 2007. “Sequencing regional trade integration and cooperation agreements. Describing a dataset for a new research agenda.” Economie Internationale CEPII research center 1, 109: 53-82.
---. 2009. “Cooperating to Trade, Trading to Cooperate.” The Sovereign Remedy?: Trade Agreements in a Globalizing World. Oxford University Press.
Fernandes, Ana Margarida, et al. 2021. “Heterogeneous impacts of sanitary and phyto-sanitary and technical barriers to trade regulations: Firm-level evidence from deep trade agreements” in The Economics of Deep Trade Agreements [ebook]. World Bank Group. Centre for Economic Policy Research.
George, C., and S. Yamaguchi. 2018. “Assessing Implementation of Environmental Provisions in Regional Trade Agreements.” OECD trade and environment working paper 2018/01. OECD Publishing.
Global Affairs Canada (GAC), Office of the Chief Economist. 2012. “International Trade and Its Benefits to Canada.” Retrieved from https://www.international.gc.ca/trade-commerce/economist-economiste/state_of_trade-commerce_international/special_feature-2012-article_special.aspx?lang=eng
---. 2013. “The Economic Impact of the Canada-Chile Free Trade Agreement.” Foreign Affairs and International Trade Canada. Retrieved from https://www.international.gc.ca/trade-commerce/economist-economiste/analysis-analyse/studies-etudes/econ_impact_cc-retombees_econom_cc.aspx?lang=eng
---. 2019. “Summary of Initial Gender-based Analysis Plus for Canada Mercosur Free Trade Agreement Negotiations.” Retrieved from https://www.international.gc.ca/trade-commerce/gender_equality-egalite_genres/gba_plus_summary-acs_plus_resume.aspx?lang=eng
---. 2020. "The Canada-United States-Mexico Agreement (CUSMA)." Retrieved from https://www.international.gc.ca/trade-commerce/trade-agreements-accords-commerciaux/agr-acc/cusma-aceum/index.aspx?lang=eng
---. 2020a. “The Canada-United States-Mexico Agreement: Economic Impact Assessment.” Retrieved from www.international.gc.ca/trade-commerce/assets/pdfs/agreements-accords/cusma-aceum/CUSMA-impact-repercussion-en.pdf
---. 2020b. “GBA+ of the Canada-United States-Mexico Agreement.” Retrieved from https://www.international.gc.ca/trade-commerce/trade-agreements-accords-commerciaux/agr-acc/cusma-aceum/gba-plus_acs-plus.aspx?lang=eng
---. 2020c. “What we heard? Consultations on Summary of Initial GBA+ for Canada-Mercosur FTA.” Retrieved from https://www.international.gc.ca/trade-commerce/gender_equality-egalite_genres/heard-appris.aspx?lang=eng
---. 2021. “Canada’s State of Trade 2021.” Retrieved from https://www.international.gc.ca/transparency-transparence/state-trade-commerce-international/2021.aspx?lang=eng
---. 2022. "Canada-Indonesia Comprehensive Economic Partnership Agreement: Initial Economic Impact Assessment." Retrieved from https://www.international.gc.ca/trade-commerce/trade-agreements-accords-commerciaux/agr-acc/indonesia-indonesie/cepa-apeg/cepa_assessment-apeg_evaluation.aspx?lang=eng
---. forthcoming 2022a. “Summary of the Initial GBA Plus on the Canada-UK FTA Negotiations”
---. forthcoming 2022b. “Summary of the Initial GBA Plus on the Canada-Indonesia CEPA Negotiations”
Grossman, Gene M., and Elhanan Helpman. 1995. “The Politics of Free-Trade Agreements.” The American Economic Review 85, 4: 667-690.
Hafner-Burton, Emilie. 2005. “Trading Human Rights: How Preferential Trade Agreements Influence Government Repression.” International Organization 59, 3: 593-629.
Hafner-Burton, Emilie, and Alexander Montgomery. 2012. “War, Trade, and Distrust: Why Trade Agreements Don’t Always Keep the Peace.” Conflict Management and Peace Science 29, 3: 257-278.
Handley, Kyle. 2011. “Exporting Under Trade Policy Uncertainty: Theory and Evidence.” World Trade Organization staff working paper. Retrieved from https://www.wto.org/english/res_e/reser_e/ersd201120_e.pdf
Handley, Kyle, and Nuno Limão. 2015. “Trade and Investment under Policy Uncertainty: Theory and Firm Evidence.” American Economic Journal: Economic Policy 7, 4: 189-222.
---. 2017. “Policy Uncertainty, Trade, and Welfare: Theory and Evidence for China and the United States.” American Economic Review 107, 9: 2731-83.
Head, C. K., J. C. Ries and D. L. Swenson. 1999. “Attracting foreign manufacturing: Investment promotion and agglomeration.” Regional Science and Urban Economics 29, 2:197-218.
Higgins, Kate. 2012. Gender Dimensions of Trade Facilitation and Logistics: A Guidance Note. Washington, D.C.: World Bank.
---. 2013. Gender and Free Trade Agreements: Best Practices and Policy Guidance. The North-South Institute.
Hoekman, Bernard, and Maurice Schiff. 2002. “Benefiting from Regional Integration.” Development, Trade, and the WTO: A Handbook. World Bank. Retrieved from https://documents1.worldbank.org/curated/en/805981468763835259/pdf/297990018213149971x.pdf
Hsieh, C.-T., and P. J. Klenow. 2009. “Misallocation and manufacturing TFP in China and India.” The Quarterly Journal of Economics 124, 4: 1403-1448.
Irwin, Douglas A. 2007. “GATT Turns 60”. Wall Street Journal.
Jiang, K., 2022. "Highlights of Canada's Merchandise Trade Performance in 2021." Global Affairs Canada, Office of the Chief Economist. Retrieved from https://www.international.gc.ca/trade-commerce/economist-economiste/analysis-analyse/merchandise_trade-commerce_marchandises-2021.aspx?lang=eng
Khalid, Usman, et al. 2021. “Do Regional Trade Agreements Enhance International Tourism Flows? Evidence from a Cross-Country Analysis.” Journal of Travel Research 61, 6: 1391-1408.
Kim, Moonhawk. 2012. “Ex Ante Due Diligence: Formation of PTAs and Protection of Labor Rights.” International Studies Quarterly 56, 4: 704-719.
Klugman, Jeni, and Elisa Gamberoni. 2012. “Gender and trade: A fresh look at the evidence.” International Trade Forum. Retrieved from https://www.tradeforum.org/article/Gender-and-trade-A-fresh-look-at-the-evidence/
Kovak, B. K., and P. M. Morrow. 2022. The Long-Run Labor Market Effects of the Canada-US Free Trade Agreement. National Bureau of Economic Research. No. w29793. Retrieved from https://www.andrew.cmu.edu/user/bkovak/KM_CUSFTA_short.pdf
KPMG. 2021. Going digital, faster in Canada: Accelerating the digital maturity of your organization. Retrieved from https://home.kpmg/ca/en/home/insights/2021/05/going-digital-faster-in-canada.html
Lejárraga, Iza, and Ben Shepherd. 2013. “Quantitative Evidence on Transparency in Regional Trade Agreements.” OECD trade policy paper 153. OECD Publishing, Paris. http://dx.doi.org/10.1787/5k450q9v2mg5-en
Li, Jie. 2021. “Women hold up half the sky? Trade specialization patterns and work-related gender norms.” Journal of International Economics 128. https://doi.org/10.1016/j.jinteco.2020.103407
Lileeva, A., and D. Trefler. 2010. “Improved access to foreign markets raises plant-level productivity… for some plants.” The Quarterly Journal of Economics 125, 3: 1051-1099.
Limão, Nuno, and Giovanni Maggi. 2015. “Uncertainty and Trade Agreements.” American Economic Journal: Microeconomics 7, 4: 1–42. Doi: 10.1257/mic.20130163. Retrieved from https://www.aeaweb.org/articles?id=10.1257/mic.20130163
Liu, Xuepeng and Emanuel Orlenas. 2014. “Free Trade Agreements and the Consolidation of Democracy.” American Economic Journal: Macroeconomics 6, 2: 29-70.
Lopez Cordova, Ernesto, and Christopher Meissner. 2005. “The Globalization of Trade and Democracy, 1870-2000.” NBER Working Paper w11117. National Bureau of Economic Research.
Mansfield, Edward, et al. 2000. “Preferential Trading Arrangements and Military Disputes.” Security Studies 9, 1-2: 92-118.
Martin, Philippe, et al. 2010. “The economics and politics of free trade agreements.” VOXEU. Retrieved from https://voxeu.org/article/free-trade-agreements-do-they-help-keep-peace
---. 2012. “The Geography of Conflicts and Regional Trade Agreements.” American Economic Journal: Macroeconomics 4, 4: 1-35.
Martínez-Zarzoso, I. 2018. “Assessing the Effectiveness of Environmental Provisions in Regional Trade Agreements: An Empirical Analysis.” OECD trade and environment working paper 2018/02. OECD Publishing, Paris.
Martínez-Zarzoso, I., and Walid Oueslati. 2016. “Do Deep and Comprehensive Regional Trade Agreements Help to Reduce Air Pollution?.” CEGE discussion paper 292.
Martinez-Zarzoso, I., and Hendrik Kruse. 2019. “Are labour provisions in free trade agreements improving labour conditions?” Open Economies Review 30, 5: 975–1003.
Mayer, Thierry, et al. 2021. “Free Trade Agreements and the Movement of Business People.” Working paper 2021-10. CEPII research center.
Mayer, Thierry, and G. I. P. Ottaviano. 2008. “The Happy Few: The Internationalisation of European Firms.” Intereconomics 43, 3: 135-148.
Melitz, M. J. 2003. The impact of trade on intra‐industry reallocations and aggregate industry productivity. Econometrica 71, 6: 1695-1725.
Melitz, M. J., and D. Trefler. 2012. Gains from trade when firms matter. Journal of Economic Perspectives 26, 2: 91-118.
McKinsey Global Institute. 2017. “The Power of Parity: Advancing Women’s Equality in Canada.” Retrieved from https://www.mckinsey.com/~/media/McKinsey/Featured%20Insights/Women%20matter/The%20power%20of%20parity%20
Advancing%20womens%20equality%20in%20Canada/MGI-The-power-of-parity-Advancing-womens-equality-in-Canada-Executive-summary.pdf
Milner, Helen V., and Keiko Kubota. 2005. “Why the Move to Free Trade? Democracy and Trade Policy in the Developing Countries.” International Organization 59, 1: 107-143.
Monteiro, José-Antonio. 2016. “Typology of Environment-related Provisions in Preferential Trade Agreements.” WTO. Research and analysis: working papers. Retrieved from https://www.wto.org/english/res_e/reser_e/ersd201613_e.pdf
Monteiro, J.-A., and J. P. Trachtman. 2020. “Environmental laws” in Handbook of Deep Trade Agreements. Mattoo, A., N. Rocha and M. Ruta (eds). World Bank. Retrieved from https://www.ceintelligence.com/files/documents/Deep%20Trade%20Agreements.pdf
Mungiu-Pippidi, Alina. 2018. Fostering good governance through trade agreements: An evidence-based review. [Workshop] Anti-corruption provisions in EU free trade and investment agreements: Delivering on clean trade. European Parliament. Retrieved from https://www.againstcorruption.eu/events/anti-corruption-provisions-in-eu-free-trade-and-investment-agreements-delivering-on-clean-trade/
Novy, Dennis, and Alan Taylor. 2020. "Trade and Uncertainty." The Review of Economics and Statistics 102, 4: 749–765. Doi: https://doi.org/10.1162/rest_a_00885
OECD. N.D. Keys to Resilient Supply Chains: International policy tools. “Keep markets open: Predictability and transparency.” Retrieved from https://www.oecd.org/trade/resilient-supply-chains/predictability-and-transparency
Office of the Chief Economist, Global Affairs Canada and the European Commission. 2021. "An overview of Canada-EU trade performance under CETA." Retrieved from https://www.international.gc.ca/trade-commerce/economist-economiste/statistics-statistiques/overview_canada_eu-apercu_canada_ue.aspx?lang=eng
Orefice, Gianluca. 2015. “International migration and trade agreements: The new role of PTAs.” The Canadian Journal of Economics 48, 1: 310-334.
Osnago, Alberto, Roberta Piermartini and Nadia Rocha. 2015. “Trade policy uncertainty as barrier to trade.” World Trade Organization working paper. Retrieved from https://www.wto.org/english/res_e/reser_e/ersd201505_e.pdf
Pavcnik, N. 2002. Trade liberalization, exit, and productivity improvements: Evidence from Chilean plants. The Review of Economic Studies 69, 1: 245-276.
Plouffe, Michael, and Roos Van der Sterren. 2016. “Trading representation: Diplomacy’s influence on preferential trade agreements.” The British Journal of Politics and International Relations 18, 4: 889-911.
Policy Options. 2007. “The Long Road to Free Trade.” Retrieved from https://policyoptions.irpp.org/magazines/free-trade-20/the-long-road-to-free-trade
Postnikov, Evgeny, and Ida Bastiaens. 2014. “Does Dialogue Work? The Effectiveness of Labor Standards in EU Preferential Trade Agreements.” Journal of European Public Policy 21, 6: 923-940.
Ravenhill, John. 2020. “Regional Trade Agreements.” Global Political Economy (6th ed.). Oxford University Press.
Rohner, Dominic, et al. 2013. “War Signals: A Theory of Trade, Trust, and Conflict.” Review of Economic Studies 80, 3: 1114-1147.
Saayman, Andrea, et al. 2016. “The influence of formal trade agreements and informal economic cooperation on international tourism flows.” Tourism Economics 22, 6: 1274-1300.
Scarffe, Colin. 2022. “Price or quantity effect? The impacts of the pandemic on Canadian trade.” Global Affairs Canada. Retrieved from https://www.international.gc.ca/trade-commerce/economist-economiste/price-quantity_report-rapport_prix-volume.aspx?lang=eng
Sekkel, Julia V. 2020. “Women-Owned SMEs and Trade Barriers.” Global Affairs Canada. Retrieved from http:// www.international.gc.ca/trade-commerce/economist-economiste/analysis-analyse/women_owned_smes_trade-pme_commerce_appartenant_femmes.aspx?lang=eng
Sekkel, Julia V., and Weimin Wang. forthcoming. "Closing the gender gap in exporting: identifying women's exporting successes using firm-level data in Canada." Global Affairs Canada.
Shen, L. 2016. Product Restructuring, Exports, Investment, and Growth Dynamics. Exports, Investment, and Growth Dynamics. Retrieved from https://papers.ssrn.com/sol3/papers.cfm?abstract_id=2869977
Shikher, Serge, and Mihir Torsekar. 2019. “U.S.-Mexico-Canada Trade Agreement: Likely Impact on the U.S. Economy and on Specific Industry Sectors.” United States International Trade Commission Report. Retrieved from https://www.usitc.gov/publications/332/pub4889.pdf
Sokolova, Maria V., and Alisa DiCaprio. 2018. “Agree to Disagree: The Spillover of Trade Policy into United Nations General Assembly Voting.” UNCTAD research paper 28. Retrieved from https://unctad.org/system/files/official-document/ser-rp-2018d10_en.pdf
Stolper, W. F., and P. A. Samuelson. 1941. “Protection and Real Wages.” The Review of Economic Studies 9, 1: 58-73.
Trefler, D. 2004. The long and short of the Canada-U.S. free trade agreement. American Economic Review 94, 4: 870-895.
UNCTAD. 2020. “World Investment Report 2020.” United Nations Publications. Retrieved from https://unctad.org/webflyer/world-investment-report-2020
---. 2022. “Investment Trends Monitor.” Issue 40, United Nations Publications. Retrieved from https://unctad.org/system/files/official-document/diaeiainf2021d3_en.pdf
---. N.D. Non-tariff measures. Retrieved from https://unctad.org/topic/trade-analysis/non-tariff-measures
UNCTAD and World Bank. 2018. “The Unseen Impact of Non-Tariff Measures: Insights from a New Database.” Retrieved from https://unctad.org/system/files/official-document/ditctab2018d2_en.pdf
Viner, J. 1950. Full employment at whatever cost. The Quarterly Journal of Economics 64, 3: 385-407.
Woll, Cornelia, and Alvaro Artigas. 2007. “When trade liberalization turns into regulatory reform: The impact on business–government relations in international trade politics.” Regulation and Governance 1, 2: 121-138.
Women and Gender Equality Canada. “Introduction to GBA Plus” course. Retrieved from https://women-gender-equality.canada.ca/gbaplus-course-cours-acsplus/eng/mod00/mod00_01_01.html on May 9, 2022
WTO. 2021. “Special Topic: Non-tariff measures: Estimating analytical indicators using UNCTAD’s Trade Analysis Information System (TRAINS).” World Tariff Profiles 2021.
---. 2022. “Russia-Ukraine conflict puts fragile global trade recovery at risk.” [press release]. Retrieved from https://www.wto.org/english/news_e/pres22_e/pr902_e.htm
- Date modified: