
Achieving growth that works for everyone
Table of Contents
- Introduction from 2018 G7 President, Prime Minister Justin Trudeau
- Our common challenge – inequality and growth
- Why does this matter?
- Helping workers adapt to the changing world of work
- Delivering strong growth by investing in people
- Building strong communities and economies
- Ensuring that everyone pays their fair share by tackling international tax avoidance and evasion
- Measuring growth that works for everyone
- Conclusion
Introduction from 2018 G7 President, Prime Minister Justin Trudeau
Canadians are honoured to host the Group of Seven (G7) countries this year. These are among the most advanced economies in the world. Together, we represent a significant share of global wealth and income. We are united by shared values and institutions – democracy, the rule of law, social safety nets, and economic and individual freedoms. They anchor our societies and ensure our citizens can thrive. Indeed, this common ground is a large part of what has made our economies and societies so successful.
At the same time, we also face a common challenge that goes to the heart of how citizens measure progress in their daily lives – namely, whether the benefits of economic growth are fairly distributed. We need to ensure that growth works for everyone, so that all can benefit from their hard work, and so that all are able to enjoy a higher quality of life. In Canada, we have been making steady progress towards this goal, through efforts designed to strengthen and grow the middle class, and offer real help to people working hard to join it.
As G7 President in 2018, Canada has set the challenge of achieving growth that works for everyone at the heart of this year’s agenda. We know that no one has all the answers; rather, it is by working together to share ideas that we can best make progress against this pressing challenge. We know there are other, increasingly authoritarian models elsewhere in the world. As leaders of the G7, we share an urgent responsibility to ensure the principles that unite our countries remain the bedrock of economic and social prosperity around the world.
Canada has prepared this short report to highlight this common challenge and to identify some of the ways we can work together to address it. We believe the best path forward is to address the following issues:
- Helping workers adapt to the changing world of work;
- Delivering strong growth by investing in people;
- Building strong communities and economies;
- Ensuring that everyone pays their fair share by tackling international tax avoidance and evasion; and,
- Measuring growth that works for everyone.
We anticipate significant consensus will emerge with respect to the problems our citizens face, but we welcome different perspectives on the measures needed to solve those problems. I look forward to this candid and important discussion, which must continue beyond Charlevoix as we work together to improve the lives of the citizens we serve.
With that commitment underpinning all of our work, I look forward to welcoming fellow leaders to Charlevoix this week.
Justin Trudeau
Prime Minister of Canada
Our common challenge – inequality and growth
Over the last half century, the world’s leading economies have succeeded in large part due to the efforts of a large and growing global middle class – optimistic women and men who believed that with hard work they could get an education, find a good job, and build a better life for themselves and their families.
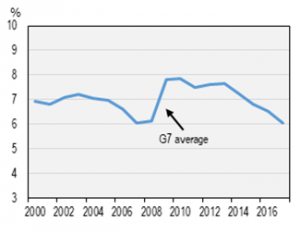
As a result of the hard work of citizens, bolstered by supportive government policies, the global economy has, after 10 years, mostly recovered from the global economic downturn of 2008. Growth is strengthening in G7 economies, with real GDP now advancing well beyond pre-recession levels in most of our countries and unemployment on a clear downward path.
G7 economies are doing well
Unemployment rate
Text version
This line chart shows the average unemployment rate among G7 countries from 2000 to 2017. It shows that the average unemployment rate was lowest between 2007 and 2008 (at approximately 6 per cent), highest from 2009 to 2010 (at approximately 8 per cent) and trended downward steadily from 7.3 per cent in 2014 to 6 per cent in 2017.
| Year | Unemployment rate |
|---|---|
| 2000 | 6.9 |
| 2001 | 6.8 |
| 2002 | 7.1 |
| 2003 | 7.2 |
| 2004 | 7.1 |
| 2005 | 7.0 |
| 2006 | 6.6 |
| 2007 | 6.1 |
| 2008 | 6.2 |
| 2009 | 7.8 |
| 2010 | 7.9 |
| 2011 | 7.5 |
| 2012 | 7.6 |
| 2013 | 7.7 |
| 2014 | 7.3 |
| 2015 | 6.8 |
| 2016 | 6.5 |
| 2017 | 6.0 |
Note: G7 is an unweighted average of harmonized unemployment rates.
Sources: Department of Finance Canada calculations based on OECD Main Economic Indicators Database.
Despite this robust recovery, G7 economies continue to face many of the challenges that existed in the decades leading up to the crisis – in particular, the failure of advanced economies to ensure that the benefits of economic growth accrue equally to all.
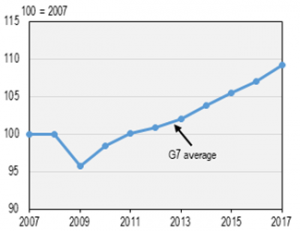
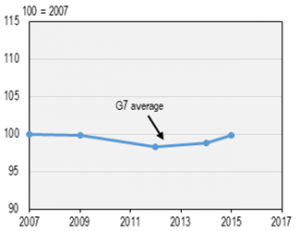
We can see this in median income growth, which has not kept up with GDP gains in most G7 economies since 2007.
Median income growth lags GDP growth
Panel A: Average real GDP growth, 2007 to 2017
Text version
This line chart shows average real GDP growth among G7 countries from 2007 to 2017. Using the average real GDP in 2007 as a baseline, average real GDP across G7 countries decreased by approximately 5 per cent in 2009 and steadily increased until 2017. The average real GDP across G7 countries in 2017 was approximately 10 per cent higher than it was in 2007.
| Year | G7 real GDP |
|---|---|
| 2007 | 100 |
| 2008 | 100 |
| 2009 | 96 |
| 2010 | 98 |
| 2011 | 100 |
| 2012 | 101 |
| 2013 | 102 |
| 2014 | 104 |
| 2015 | 105 |
| 2016 | 107 |
| 2017 | 109 |
Panel B: Median income growth, 2007 to 2015
Text version
This line chart shows median income growth among G7 countries from 2007 to 2015. The average median income across G7 countries did not change significantly from 2007 to 2009 but decreased by approximately 2 per cent from 2009 to 2012 and began increasing again from 2012 to 2015. The average median income in 2015 is the same as it was in 2007 to 2009.
| Year | G7 and GDP |
|---|---|
| 2007 | 100 |
| 2009 | 100 |
| 2012 | 98 |
| 2014 | 99 |
| 2015 | 100 |
Note: G7 is an unweighted average. Panel B – Data are real median disposable household income adjusted for household size.
Sources: Panel A – Department of Finance Canada calculations based on OECD Main Economic Indicators Database. Sources: Panel B – OECD calculations based on OECD Income Distribution and Poverty Database.
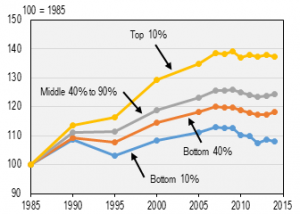
Over the longer term, inequality can also be seen in the widening income gaps that exist between different groups of individuals.
Widening income gaps over the last three deacades
Trends in household incomes at the bottom, the middle and the top, 1985 to 2014
Text version
This chart shows trends in real disposable household incomes among G7 countries for households in the bottom 10 per cent, the bottom 40 per cent, the middle 40 to 90 per cent and the top 10 per cent from 1985 to 2014. It shows household incomes trended upward by 8 to 14 per cent across all households from 1985 to 1990. From 1990 to 1995, household incomes among the bottom 10 and 40 per cent thresholds trended downward by 6 per cent and 1 per cent, respectively, while those of the middle thresholds remained nearly unchanged and those of the top 10 per cent threshold increased by 3 per cent. While real disposable household incomes have gradually trended upwards across all thresholds since 1995, the increase in household incomes has increased most significantly for households in the top 10 per cent threshold (an increase of 20.8 per cent) and least significantly for households in the bottom 10 per cent (an increase of 5 per cent).
| Year | Bottom 10% | Bottom 40% | Middle 40% to 90% | Top 10% |
|---|---|---|---|---|
| 1985 | 100 | 100 | 100 | 100 |
| 1990 | 109 | 109 | 111 | 114 |
| 1995 | 103 | 108 | 111 | 116 |
| 2000 | 108 | 114 | 119 | 129 |
| 2005 | 111 | 118 | 123 | 135 |
| 2007 | 113 | 120 | 126 | 139 |
| 2008 | 113 | 120 | 126 | 138 |
| 2009 | 113 | 120 | 126 | 139 |
| 2010 | 110 | 119 | 125 | 137 |
| 2011 | 110 | 118 | 124 | 138 |
| 2012 | 107 | 117 | 123 | 137 |
| 2013 | 109 | 117 | 124 | 138 |
| 2014 | 108 | 118 | 124 | 137 |
Note: Data are real disposable household income adjusted for household size.
Source: OECD calculations based on OECD Income Distribution Database.
Across the G7, over the past 30 years, those in the top 10 per cent of earners have seen their incomes rise by an average 40 per cent, while those in the bottom 40 per cent have seen incomes grow at less than half this rate. Growth has also lagged for the broader middle-class, as measured by the middle 40 to 90 per cent of income earners. And the difference is even more stark when income gains of the top 1 per cent are considered. Between the mid 1970s and the late 2000s, the top 1 per cent saw their incomes grow by more than 150 per cent on average in Canada, France, Italy, the U.K. and the U.S.
Income inequality in G7 countries by the numbers
- In 2014, the richest 20 per cent earned almost six times more than the poorest 20 per cent across G7 countries.
- In terms of wealth, the bottom 40 per cent of the wealth distribution held 3 per cent of total household wealth in G7 countries in 2014, while the top 10 per cent held 54 per cent of total wealth.
- From a global standpoint, inequality is staggering: 42 individuals held as much wealth as the 3.7 billion people who make up the poorer half of the world’s population in 2017.
- Gender income gaps in G7 countries have decreased but remain at 43 per cent.
- The gap in life expectancy at the age of 30 between high and low-educated people is estimated at 7 years for men and 4 years for women. These gaps have increased in some countries.
- On average, a child of someone who earned twice the average income 40 years ago still earns 40 per cent more than a child whose parent earned an average income.
- Students from poor families in G7 economies score 39 points lower in mathematics – equivalent to an entire year of schooling – than students from relatively wealthier backgrounds.
Note: Figures represent G7 average where not otherwise indicated.
When metrics beyond income are considered, our countries still struggle to deliver broadly shared prosperity. In the 2018 edition of the World Economic Forum’s Inclusive Development Index – an annual assessment of 103 countries’ performance on eleven dimensions of economic progress in addition to GDP – none of the G7 economies placed in the top 10, despite our relative economic strength.
Ensuring the benefits of growth are widely shared is essential to our continued prosperity. So too is the confidence that, over time citizens have a realistic and fair chance to achieve their dreams and make life better for their families and communities. Over the long run, citizens need to know their hope and hard work will be rewarded. This is a particularly important challenge for the G7, where despite immense wealth, the degree of social mobility remains lower than in best performing OECD countries.
Why does this matter?
Persistent inequality presents many challenges. As we have seen repeatedly historically, when prosperity is not broadly shared and felt, people lose faith in the growth agenda, and its sustainability is jeopardized.
Inequality and the durability of growth
Duration of growth spells versus net income inequality, 1960 to 2010
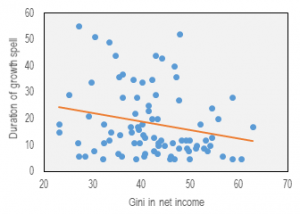
Text version
The chart shows that most countries experience shorter growth spells, from 5 to 20 years in duration, which are associated with higher inequality—particularly concentrated in the range of 38 to 55 on the Gini index, which measures inequality (0 is no equality, 100 is full inequality).
| Gini in net income | Duration of growth spell |
|---|---|
| 40 | 18 |
| 43 | 7 |
| 48 | 9 |
| 34 | 15 |
| 23 | 15 |
| 47 | 36 |
| 53 | 8 |
| 42 | 13 |
| 43 | 29 |
| 40 | 34 |
| 40 | 11 |
| 42 | 35 |
| 30 | 34 |
| 54 | 13 |
| 51 | 9 |
| 27 | 11 |
| 44 | 43 |
| 50 | 8 |
| 53 | 12 |
| 38 | 15 |
| 38 | 35 |
| 46 | 5 |
| 46 | 6 |
| 47 | 5 |
| 30 | 8 |
| 59 | 5 |
| 51 | 10 |
| 41 | 7 |
| 32 | 11 |
| 52 | 18 |
| 45 | 10 |
| 42 | 20 |
| 54 | 24 |
| 50 | 12 |
| 32 | 18 |
| 35 | 44 |
| 33 | 12 |
| 57 | 6 |
| 36 | 6 |
| 43 | 20 |
| 33 | 49 |
| 35 | 7 |
| 59 | 28 |
| 39 | 17 |
| 25 | 29 |
| 43 | 10 |
| 48 | 27 |
| 39 | 28 |
| 36 | 37 |
| 32 | 5 |
| 36 | 28 |
| 56 | 20 |
| 39 | 16 |
| 41 | 25 |
| 44 | 12 |
| 48 | 12 |
| 30 | 51 |
| 48 | 52 |
| 53 | 9 |
| 54 | 10 |
| 28 | 6 |
| 38 | 17 |
| 49 | 12 |
| 43 | 44 |
| 29 | 21 |
| 27 | 55 |
| 60 | 5 |
| 49 | 9 |
| 23 | 18 |
| 39 | 5 |
| 35 | 14 |
| 47 | 40 |
| 46 | 11 |
| 39 | 22 |
| 40 | 14 |
| 38 | 11 |
| 27 | 6 |
| 41 | 23 |
| 41 | 6 |
| 41 | 13 |
| 43 | 8 |
| 35 | 36 |
| 43 | 11 |
| 50 | 5 |
| 63 | 17 |
Note: Dots represent countries. The minimun length of a spell is 5 years. The Gini index measures inequality: 0 is no inequality, 100 is full inequality. Higher inequality is associated with shorter high-growth spells, as shown by the orange line.
Source: Ostry, Berg and Tsangarides (2014) “Redistribution, Inequality and Growth.”
These indicators do not exist in a vacuum. Inequality and low social mobility threaten social cohesion, leading to frustration and worry, and ultimately erode support for the very things that helped deliver strong and sustained growth in the past, such as resource development and international trade.
A growing sense of frustration can be seen in the declining number of people who have confidence in government, and in the declining numbers of people who believe today’s children will be better off than their parents. Despite the relative economic strength of G7 countries, on average, only one quarter of G7 citizens are optimistic about their children’s future.
Confidence and optimism on the decline
Average share of OECD country population reporting confidence in the national government, 2006 to 2016
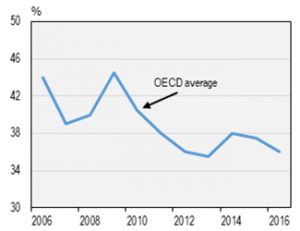
Text version
The chart shows that the average share of the population across 29 OECD countries reporting confidence in the national government decreased from approximately 44 per cent to 39 per cent from 2006 to 2007. It then increased to 40 per cent in 2008 and approximately 45 per cent in 2009. From 2009 to 2013, the average share of OECD country population reporting confidence in the national government decreased steadily from approximately 45 per cent to a low of 35.5 per cent in 2013. It then increased to 38 per cent in 2014, decreased slightly to 37.5 per cent in 2015 and more significantly to approximately 36 per cent in 2016.
| Year | OECD |
|---|---|
| 2006 | 44 |
| 2007 | 39 |
| 2008 | 40 |
| 2009 | 45 |
| 2010 | 41 |
| 2011 | 38 |
| 2012 | 36 |
| 2013 | 36 |
| 2014 | 38 |
| 2015 | 38 |
| 2016 | 36 |
Note: The OECD average is based on 29 countries, and it is population-weighted.
Source: Gallup World Poll (2017).
As we enter a new period of technological change, driven by further automation and potential disruption to jobs, it is imperative that citizens know their governments and economies are working for them.
There is reason to be hopeful. Collectively, G7 countries represent nearly two-thirds of global net wealth. Decisions made by G7 leaders make a difference in the lives of hundreds of millions of our own citizens and, in turn, the world over.
For these reasons, the challenges of inequality, wellbeing and social mobility – and the opportunities that come with economic growth that works for everyone – will be a central focus of our meetings in Charlevoix. If we meet these challenges head-on, we can improve the quality of people’s lives while securing long-term growth that works for everyone.
Helping workers adapt to the changing world of work
“Long-term economic growth depends mainly on nonmonetary factors such as population growth and workforce participation, the skills and aptitudes of our workforce, the tools at their disposal, and the pace of technological advance.”
– Jerome Powell, The US Federal Reserve (2017)
Technological advances and innovations such as increased automation have the potential to boost productivity, create new jobs, raise incomes and deliver a better standard of living for the world’s citizens.
History has shown, however, that transitions to new worlds of work can leave many behind. The speed with which automation is advancing, and the potential of automation to displace workers, may be without precedent in the post-war era. All G7 economies will experience this transformation in profound ways. The question is whether we are adequately prepared to ensure workers have the skills and supports they need to thrive. Canada believes that, by working together, government, employers and educational institutions can and must make a major shift toward a comprehensive model of life-long learning.
All G7 countries will face considerable change in jobs and tasks
Workers at risk of being affected by automation
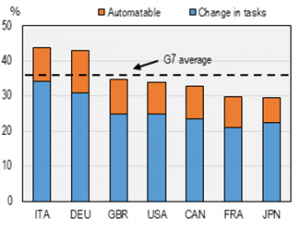
Text version
The chart shows the share of workers in G7 countries in ‘automatable’ jobs (for which at least 70 per cent of tasks are expected to be automatable) ranges from approximately 5 per cent in Japan to 13 per cent in Germany. The chart also shows the share of workers in G7 countries at risk of a ‘change in tasks’ (in jobs for which 50 to 70 per cent of tasks are expected to be automatable) ranges from approximately 21 per cent in France to approximately 34 per cent in Italy. Across G7 countries, the average share of workers at risk of being affected by automation is approximately 36 per cent. G7 countries whose workers are most at risk of being affected by automation include Italy (43.6 per cent) and Germany (43 per cent). Those least at risk are in France (29.7 per cent) and Japan (29.5 per cent).
| G7 country | Change in tasks | Automatable |
|---|---|---|
| Italy | 34 | 10 |
| Germany | 31 | 12 |
| Great Britain | 25 | 10 |
| United States | 25 | 9 |
| Canada | 24 | 9 |
| France | 21 | 9 |
| Japan | 22 | 7 |
| G7 country | Below upper secondary | Tertiary |
|---|---|---|
| Japan | 83 | |
| Italy | 51 | 80 |
| France | 51 | 85 |
| Canada | 55 | 82 |
| United States | 57 | 82 |
| Germany | 59 | 88 |
| Great Britain | 62 | 85 |
Note: ‘Change in tasks’ refers to the share of workers in jobs for which 50 to 70 per cent of tasks are expected to be automatable. ‘Automatable’ refers to the share of workers in jobs for which at least 70 per cent of tasks are expected to be automatable. Data for the United Kingdom correspond to England and Northern Ireland.
Source: OECD (2016) “Automation and Independent Work in a Digital Economy.”
We know that accelerating automation will affect different workers in different ways. One expected outcome is increased skills polarization in the labour market, where highly skilled workers who have experience working with technology will benefit, while lower-skilled workers are more likely to experience job loss, wage stagnation and tougher competition for remaining jobs.
In 2017, the difference in the rate of employment experienced by G7 workers who had completed higher learning (tertiary) and those with less than upper-secondary education was 27 percentage points. Unless there is a concerted effort to ensure all workers are able to adapt and keep up with technological change, this gap could grow over time, reinforcing social and economic division within our societies.
Digital technologies provide opportunities for greater flexibility and productivity, and can help overcome barriers to labour market participation – but can also contribute to growing concern about job quality and security. Will new forms of work include good, well-paying jobs? Will temporary work, involuntary part-time work, independent work and self-employment continue to represent a sizable and growing proportion of jobs? And what does the changing world of work mean for people with differing skills and levels of education?
Addressing these challenges requires active collaboration between businesses, labour organizations, women’s rights organizations and educational partners. It requires that we put in place policies that promote well-paying jobs, and support for workers when they need it.
Involuntary part-time work has increased over time
Incidence of involuntary part-time work, 2002 to 2016
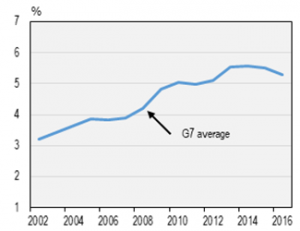
Text version
The chart shows the incidence of involuntary part-time work among G7 countries has risen from approximately 3.2 per cent in 2002 to approximately 5.2 per cent in 2016. It shows that the incidence of involuntary part-time work rose from approximately 3.2 per cent to 3.9 per cent from 2002 to 2005 and remained at that level until 2007, when it began to increase. From 2007 to 2011, incidence of involuntary part-time work increased from approximately 3.9 per cent to 5 per cent, and remained around that level until around 2013. From 2013 to 2014, it increased to approximately 5.5 per cent, remained around that level until 2015. From 2015 to 2016, the incidence of involuntary part-time work decreased from approximately 5.5 per cent to 5.2 per cent.
| Year | Involuntary |
|---|---|
| 2002 | 3.20 |
| 2003 | 3.42 |
| 2004 | 3.64 |
| 2005 | 3.86 |
| 2006 | 3.85 |
| 2007 | 3.91 |
| 2008 | 4.22 |
| 2009 | 4.84 |
| 2010 | 5.05 |
| 2011 | 4.98 |
| 2012 | 5.11 |
| 2013 | 5.53 |
| 2014 | 5.58 |
| 2015 | 5.50 |
| 2016 | 5.29 |
Note: Involuntary part-time work is based on national definitions.
Sources: Department of Finance Canada calculations based on OECD Labour Force Statistics Database.
We know one thing is clear: helping workers adapt to the changing world of work – whether through new programs that support life-long learning, or other measures aimed at helping people transition to new work – is critical to reducing inequality and generating long term growth that benefits everyone. How to achieve these shifts will be a key focus of our discussions at this year’s G7.
Delivering strong growth by investing in people
“We cannot all succeed when half of us are held back.”
– Malala Yousafzai (United Nations, 2013)
By investing in people and giving them the help they need to succeed, we can give citizens greater confidence about the future, as we grow our economies.
This starts with giving more people more opportunities to learn and work. Although unemployment rates are at or near multi-decade lows in a number of G7 countries, access to good, well-paying jobs remains unequal across different groups. More must be done to encourage underrepresented groups – including women, Indigenous peoples, older workers, recent immigrants and people with disabilities – to join or stay in the workforce.
The future prosperity of advanced economies depends on this. With more people aged 65 and older than aged under 15 across the G7, each of our countries will be challenged to fill the gap left by seniors as they leave the workforce.
Aging population to create worforce pressures
Total G7 population aged 0 to 14 years and 65+ years, 1950 to 2050
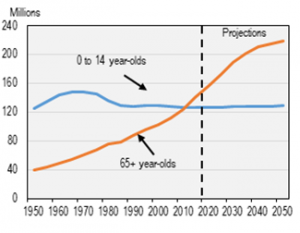
Text version
The chart shows the population aged 65+ years has steadily increased from approximately 39 million in 1950 to 141 million in 2015 and is projected to increase to approximately 219 million by 2050. The chart also shows the population aged 0 to 14 years increased from approximately 125 million in 1950 to approximately 148 million at its peak in 1970, at which point it steadily decreased to approximately 130 million in 1985 with only slight fluctuations until 2015. The population aged 0 to 14 years is projected to remain stable in the 126 to 128 million range from 2020 to 2050.
| Year | 0-14 | 65+ |
|---|---|---|
| 1950 | 125 | 39 |
| 1955 | 135 | 44 |
| 1960 | 144 | 48 |
| 1965 | 147 | 54 |
| 1970 | 148 | 60 |
| 1975 | 145 | 68 |
| 1980 | 136 | 75 |
| 1985 | 130 | 79 |
| 1990 | 128 | 87 |
| 1995 | 129 | 95 |
| 2000 | 129 | 103 |
| 2005 | 127 | 112 |
| 2010 | 127 | 124 |
| 2015 | 126 | 141 |
| 2020 | 126 | 156 |
| 2025 | 126 | 173 |
| 2030 | 128 | 189 |
| 2035 | 128 | 202 |
| 2040 | 128 | 211 |
| 2045 | 128 | 215 |
| 2050 | 129 | 219 |
Note: Data available only in 5 year intervals. Population estimates from 1950 to 2015 and projections from 2020 to 2050.
Sources: Department of Finance Canada calculations based on UN World Population Prospects 2017.
But solutions lie within our reach
First, we must ensure that citizens have the tools they need to succeed in the jobs of today and tomorrow. All G7 countries have made significant progress in recent decades in raising levels of education, which has helped spur economic growth and encourage greater innovation. This includes a wide range of educational and training opportunities, including vocational learning and apprenticeship, and various forms of college and university learning. Closing gaps in access to learning among under-represented groups is vital for promoting a real and fair chance at success for all.
Second, G7 countries have a responsibility to do more to help advance gender equality and women’s empowerment. This is not simply the right thing to do – it is the smart thing to do for our shared prosperity. McKinsey Global Institute estimates that women already generate nearly 40 per cent of the global Gross Domestic Product, and it is estimated that reducing the gender gap in labour-force participation by half would increase GDP by 6 per cent on average, across our economies, by 2030.
Gender equality benefits us all
GDP impact of 50% reduction in gender gap by 2030
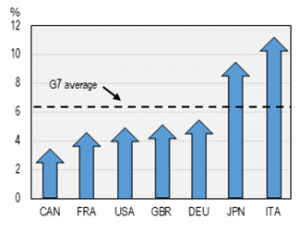
Text version
The chart shows the increase in GDP that each G7 country would experience if the gender gap were reduced by 50 per cent by 2030. Canada’s GDP would increase by upwards of 2 per cent. France’s GDP would increase by upwards of 3 per cent. The U.S.A.’s GDP would increase by upwards of 4 per cent. The U.K.’s GDP would increase by upwards of 4 per cent. Germany’s GDP would increase by upwards of 4.5 per cent. Japan’s GDP would increase by upwards of 8.5 per cent. Italy’s GDP would increase by upwards of 10 per cent. If the gender gap were reduced by 50 per cent, GDP would increase by an average of 6.2 per cent across all G7 countries.
| G7 country | Tertiary | Secondary | Below secondary |
|---|---|---|---|
| Italy | 25.6 | 48.3 | 26.1 |
| Germany | 30.5 | 56.5 | 13.0 |
| France | 44.0 | 42.6 | 13.3 |
| Unites States | 47.5 | 44.0 | 8.5 |
| Great Britain | 52.0 | 35.5 | 12.5 |
| Japan | 60.1 | 39.9 | 0.0 |
| Canada | 60.6 | 32.5 | 6.9 |
Sources: OECD (2012) “Closing the Gender Gap: Act Now.”
As important as this progress is, it may well remain beyond our reach as long as:
- women continue to bear a disproportionate burden of unpaid caregiving responsibilities;
- women are denied their sexual and reproductive health rights;
- families do not have access to parental leave and caregiving supports, ensuring it pays to work;
- job opportunities, financing, and leadership positions are not equally available to women, particularly in high-growth areas of the economy; and,
- the gender wage gap persists.
Making progress on these fronts is critical. It will require, among other things, efforts to improve access to affordable and high quality early learning and child care, parental benefits, and family leave.
Investing in families is also key. Even with good, well-paying jobs, the high cost of raising kids can make it tough for families to make ends meet. Ensuring children have a real chance to succeed is important. One answer to this has been our own Canada Child Benefit (CCB), which provides more tax-free, monthly support to nine out of ten families, lifting 300,000 kids out of poverty. This has helped create a foundation for strong economic growth today, and sustained economic growth over the long term. As the International Monetary Fund has noted, the CCB has had a major impact in supporting growth. With more money to save, invest and spend in their communities, middle-class families have contributed to and benefited from increased growth.
Building strong communities and economies
Poverty rates, 2015 (or the latest year)
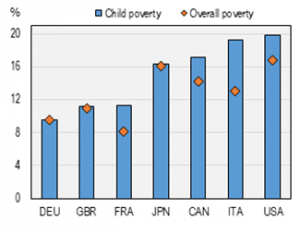
Text version
This chart shows child poverty ranges from 9.5 per cent in Germany to 11 per cent in the UK and France; from 16 per cent in Japan to 17 per cent in Canada; and from 19 per cent in Italy to 20 per cent in the USA. The rates of overall poverty match or closely resemble the rates of child poverty in Germany (9.5 per cent), the UK (11 per cent), and Japan (16 per cent). The rate of overall poverty is lower than the rate of child poverty in France (8 per cent versus 11 per cent), Canada (14 per cent versus 17 per cent), Italy (13 per cent versus 19 per cent) and the USA (17 per cent versus 20 per cent).
| G7 country | 2016 |
|---|---|
| Italy | 73.0 |
| Japan | 81.3 |
| United States | 86.1 |
| Great Britain | 88.7 |
| France | 89.5 |
| Germany | 90.6 |
| Canada | 92.5 |
| G7 country | Gender gaps reduce by 50% |
|---|---|
| Canada | 3.5 |
| France | 4.7 |
| United States | 5.0 |
| Great Britain | 5.2 |
| Germany | 5.6 |
| Japan | 9.5 |
| Italy | 11.3 |
Note: Data are based on disposable household income adjusted for family size. For select countries, 2015 values are from 2012 (Japan), 2013 (Italy – overall) and 2014 (Germany and Italy – child).
Source: OECD Income Distribution and Poverty Database.
Together, G7 leaders will examine ways to ensure the equal of participation and success of all our citizens.
Building strong communities and economies
“Right now, infrastructure investment tops out at around 3.4 trillion dollars annually, but the need is more like 6 trillion dollars a year. And all of this must be climate-smart, low-carbon, resilient infrastructure.”
– Jim Yong Kim, World Bank (2017)
Investing in infrastructure creates the good, well-paying jobs that middle-class families need today.
These investments can also deliver sustained economic growth for years to come, especially when we invest in the infrastructure – such as public transit, better roads, and more efficient ports – that makes it easier to move the people and the products that help grow our economy. The impacts of not investing in infrastructure are also well known: lost productivity, and added stress for families.
Whether designed to combat congestion, protect against climate change, or help with the transition to a clean growth economy, well-planned infrastructure can help keep our communities accessible, safe, and resilient places to live, work and do business.
Investing in infrastructure now – in the projects people need, and in the people who can build them – will help people today, while securing a better quality of life for our children and grandchildren.
A healthy infrastructure landscape can yield high dividends for citizens
Panel A: Congestion in the two most congested city in each G7 country
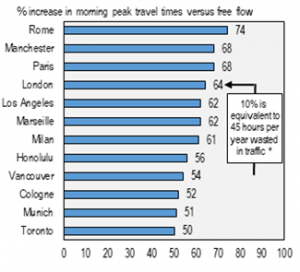
Text version
This bar chart shows per cent increase in morning peak travel times versus free flow in the two most congested cities in each of the G7 countries. This increase is highest in Rome (74 per cent), Manchester (68 per cent) and Paris (68 per cent) and lowest in Cologne (52 per cent), Munich (51 per cent) and Toronto (50 per cent). In Vancouver (54 per cent) and London (64 per cent), a 10 per cent increase in morning peak travel times versus free flow is equivalent to 45 hours per hear wasted in traffic.
| City | 2016 |
|---|---|
| Toronto | 50 |
| Munich | 51 |
| Cologne | 52 |
| Vancouver | 54 |
| Honolulu | 56 |
| Milan | 61 |
| Marseille | 62 |
| Los Angeles | 62 |
| London | 64 |
| Paris | 68 |
| Manchester | 68 |
| Rome | 74 |
Panel B: Long-term productivity impact per $1 invested in infrastructure
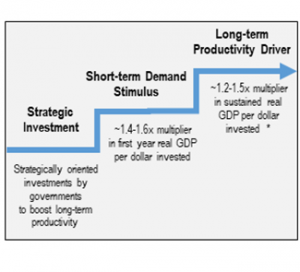
Text version
This Infographic describing long-term productivity impact per $1 invested in infrastructure in three stages: Strategic investment, short-term demand stimulus, and long-term productivity driver. The infographic explains that, when governments make strategically oriented investments in infrastructure to boost long-term productivity, each dollar invested yields a net economic return of $1.40 to $1.60 in the first year and a sustained economic return of $1.20 to $1.50 per dollar thereafter.
Note: Panel A – The TomTom Traffic Index shows the per cent increase in morning peak travel times versus a free flow situation. Country index shown reflects the index of the two worst performing large cities in each G7 country. Data for Japan are unavailable.
* According to McKinsey estimates which assume a 60-minute one-way commute and 220 work days per year.
Sources: Panel A – TomTom Traffic Index, 2016. Panel B – McKinsey & Company.
Together, G7 leaders will consider how to promote smart, sustainable and high-quality infrastructure investments.
Ensuring that everyone pays their fair share by tackling international tax avoidance and evasion
“The taxes we pay … are a commitment to one another, and the price we pay for a free society.”
– Justin Trudeau, (2013)
Governments around the world – including those in the G7 countries – rely on taxation to fund the programs and services citizens rely on.
Taxes pay for the infrastructure that helps get our goods to market and make our communities better places to live; for the hospitals and medical experts that help set broken bones and push cancer into remission; and for the education that gives every generation a greater chance at success than the previous one.
But economies can’t work for everyone when some don’t pay their fair share. Tax avoidance and tax evasion cost us all. Together we have a responsibility to ensure that everyone respects the rule of law, and honours our commitment to one another. Today, as the OECD has estimated, billions in potential taxes go uncollected around the world because some companies and wealthy individuals avoid paying what they owe.
In recent years, member countries of the G7 and the OECD have taken important steps to bolster cooperation on this common problem. But as we know, there are always new schemes being conceived. To stay ahead of efforts to avoid and evade paying taxes, the countries of the G7 must continue to work together to share information and collaborate on enforcement.
Addressing tax evasion
- In 2017, the Global Forum on Transparency and Exchange of Information for Tax Purposes (150 countries) completed peer reviews of exchange of information on request
- To shed light on offshore accounts, more than 100 countries have committed to implement automatic exchange of financial account information by 2018
Addressing tax avoidance
- 116 countries have joined the OECD’s Inclusive Framework on Base Erosion and Profit Shifting
- 2018 will see the first automatic exchanges of country-by-country reports on the activities of large multinational enterprises
- Close to 80 jurisdictions have signed a multilateral instrument which will allow for the rapid amendment of bilateral tax treaties to toughen protections against treaty shopping and other forms of avoidance
Together, G7 leaders will discuss how to create a level playing field so that everyone pays their fair share. At the heart of this is important work to advance the global implementation of standards to fight tax evasion and avoidance, increase transparency in tax collection and enhance capabilities for enforcement.
Measuring growth that works for everyone
“We need a new model for growth. Just as we’re reinventing business, we need to reinvent the way we measure the economy.”
– Erik Brynjolfsson, MIT (2018)
Traditionally, the health of economies has been measured by looking at GDP growth, the extent to which a country’s economic activity increases over time.
Increasingly, however, experts agree GDP may not be the best way to assess the health of a country’s economy, and may often in fact be a poor measure of economic and social progress. While it accurately measures the value of the goods and services that are produced and sold, GDP cannot – and was never intended to – measure how well people are doing.
We need new and better ways to measure economic and social progress. In particular, we need to capture a more comprehensive picture of the challenges facing people in their daily lives. Are they equipped to keep up with the demands of a changing labour market? Are we effectively removing barriers to employment so that everyone who wants a job can get one? And is available work well-paying, with equal opportunity for women and men?
There is no perfect set of indicators. What is important is that, together, we take a broad enough view of the challenges facing people. This could include:
- the level and growth of median income between women and men as indicators of the sharing of growth and its benefits;
- the incidence of involuntary part-time work, the gender wage gap, and the employment-to-population ratio as measures of full economic participation;
- the persistence of earnings and education within families across generations as indicators of opportunity for all;
- the distribution of educational attainment and the employment to population ratio by skill level as measures of skills development; and,
- the child poverty rate, and access to affordable, high-quality early learning and child-care, and benefits, as measures of support for families.
Recognizing that equality and growth are linked, it is important this work be guided by an attention to gender-based analysis and the potential intersectionalities that exist in people’s lives.
With better ways to measure growth, we can make better policy decisions – ones that make a real difference in the lives of people – while holding governments accountable for putting people first.
As a starting place for further work, we will discuss in Charlevoix how best to track and report on measures of economic prosperity that reflect broader and more complete aspects of well-being. How we get there may vary. But in the end, the goal we must all strive toward is clear: growth that works for everyone.
Conclusion
As leaders of the G7, we share a fundamental responsibility to create growth that benefits everyone, and in particular those most at risk of being left behind. We face this common economic problem in a world that is more complex than at any other point in history, at a time when global institutions we’ve taken for granted for seventy years have come into question as never before.
Solutions must flow from these institutions – free and fair trade, international cooperation, and liberal democracy itself. They have formed the bedrock of our economic and social prosperity, and offered unprecedented stability – an essential ingredient for growth and progress.
In Charlevoix, we must stand up for the rules-based international order, remain beacons of democratic principles and human rights, and work together to remove the barriers that keep people – particularly women, girls, and marginalized individuals – from participating fully in the global economy.
We must ensure that new challenges, put up by the rapidly changing, increasingly digital economy, do not result in people being left behind. By helping people adapt to the changing world of work, fostering a culture of lifelong learning, and investing in what helps them get ahead, we can make sure people benefit from technological change and see the fruits of economic growth reflected in their lives—in the quality of jobs they hold, the wages they earn, and the success of their kids and families.
If we meet these challenges head-on, and together, I am confident we can strengthen the middle class, and deliver the broad-based, healthy, and sustained growth our citizens were promised and expect.
- Date modified: