
2. Assessing the economic impact of international students in Canada
The economic impact assessment of international education involved first collecting data and information on the number of international students by level of study, and on the type of student expenditures incurred.
These values were adjusted when necessary to arrive at the amount of overall spending by international students on educational fees and living expenditure. These spending values were then applied to Statistics Canada’s Input-Output Expenditure Model to generate estimates of the impact that international students’ total spending had on Canada’s gross output, GDP, household income, employment and tax revenues. In this Chapter we present the analysis and resulting estimates.
2.1. Overall spending
Table 2.1 shows the total number of international students studying in Canada, with provincial and territorial distribution. The student numbers have also been broken down to show students that are “long-term” (greater than six months) and those who are considered “short-term” (less than six months).
| Region | 2017 Long-Term Students | 2017 Short-Term Students | 2017 All Students | 2018 Long-Term Students | 2018 Short-Term Students | 2018 All Students |
|---|---|---|---|---|---|---|
| Newfoundland and Labrador | 3,609 | n/a | 3,609 | 4,047 | n/a | 4,047 |
| Prince Edward Island | 2,447 | 320 | 2,767 | 3,194 | 278 | 3,472 |
| Nova Scotia | 13,230 | 2,183 | 15,413 | 16,094 | 2,441 | 18,535 |
| New Brunswick | 4,745 | 938 | 5,683 | 5,748 | 1,025 | 6,773 |
| Quebec | 60,963 | 11,333 | 72,296 | 69,704 | 10,732 | 80,436 |
| Ontario | 233,537 | 45,917 | 279,454 | 273,773 | 55,884 | 329,657 |
| Manitoba | 15,868 | 1,639 | 17,507 | 18,596 | 1,304 | 19,900 |
| Saskatchewan | 7,802 | 607 | 8,409 | 9,322 | 633 | 9,955 |
| Alberta | 24,913 | 5,101 | 30,015 | 28,586 | 5,064 | 33,651 |
| British Columbia | 117,626 | 37,518 | 155,144 | 132,790 | 47,411 | 180,201 |
| Territories | 210 | n/a | 210 | 229 | n/a | 229 |
| Canada | 484,951 | 105,556 | 590,506 | 562,084 | 124,772 | 686,855 |
The number of international students studying in Canada continues to grow steadily. In fact, the increase between 2017 and 2018 was substantial, from approximately 590,506 to 686,855, an increase of 16.32%.
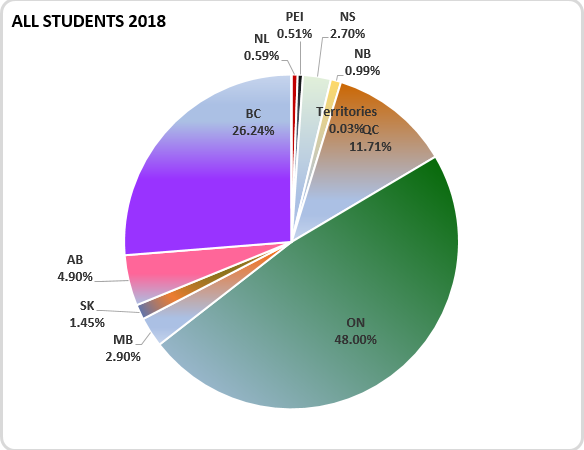
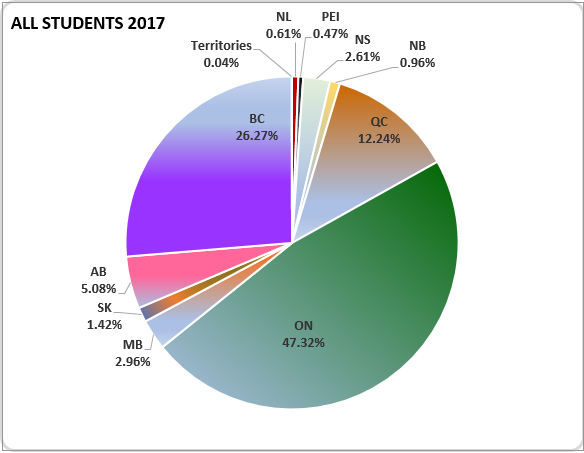
Figure 2.1 shows the distribution of the total number of international students in Canada by province and territory, Ontario has the largest share of the international student population (47.32% in 2017, which increased to 48.00% in 2018). The province with the second-largest share of international students is British Columbia, which accounted for 26.27% of the total in 2017, though its share decreased slightly to 26.24% in 2018. When compared with British Columbia’s population share in Canada, its share in the international student service market is much higher. Quebec has the third-largest market share in international education services, accounting for 12.24% of the number of students in 2017 (and 11.71% in 2018). All other provinces and territories also hosted the increasing number of international students: Alberta had 5.08% of all international students in 2017 (4.90% in 2018); Nova Scotia had 2.61% of all students in 2017 (2.70% in 2018); Manitoba had 2.96% of students in 2017 (which decreased to 2.90% in 2018); Saskatchewan had 1.42% of students in 2017 (1.45% in 2018); New Brunswick had 0.96% of all students in 2017 (0.99% in 2018); Newfoundland and Labrador had 0.61% of all students in 2017 (0.59% in 2018); and Prince Edward Island had 0.47% of all students in 2017 (0.51% in 2018). The three territories also took in a very small number of international students, 0.04% in 2017 and 0.03% in 2018.
Table 2.2 shows the annual spending incurred by these international students, including the additional tourism activities associated with visiting family and friends. The data sources and adjustments to raw data to derive estimates of international student expenditures are detailed in Appendix 1 and Appendix 3.
Figure 2.1 – Number of international students by province 2017, 2018
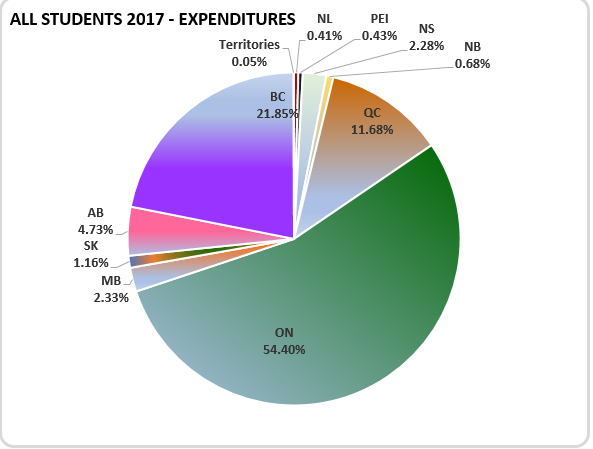
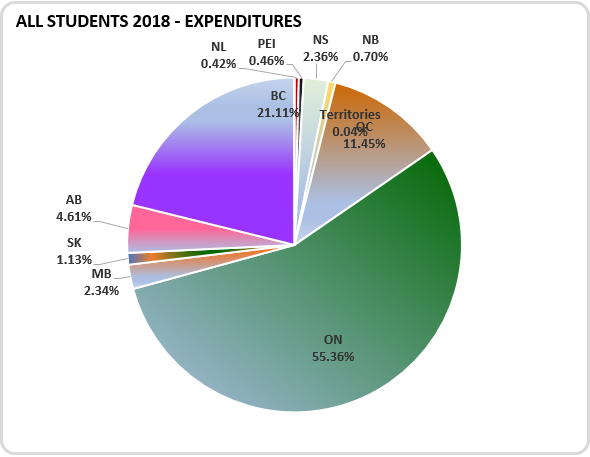
In total, $18.4 billion was put into the Canadian economy in 2017 by international student expenditures across the country. The comparable number in 2018 was $22.3 billion. This represents a 21.2% increase in international student spending between 2017 and 2018.
Figure 2.2 illustrates the distribution of the total amount of international student expenditures in 2017 and 2018 by province and territory. In line with Figure 2.1, Ontario accounts for the largest share of total student expenditures of all provinces and territories in Canada, followed by British Columbia. The data in this figure also indicates that Ontario accounts for an even higher expenditure share than its student share (54.4% in 2017, which increased to 55.4% in 2018), which reflects the tuition fees of students studying in university programs.
Figure 2.2 – Total expenditures of international students by province 2017, 2018
| Region | 2017 Long-term Students | 2017 Short-term Students | 2017 All Students | 2018 Long-term Students | 2018 Short-term Students | 2018 All Students |
|---|---|---|---|---|---|---|
| Newfoundland and Labrador | $76,065,475 | $0.00 | $76,065,475 | $92,775,232 | $0.00 | $92,775,232 |
| Prince Edward Island | $78,161,695 | $1,940,180 | $80,101,875 | $101,450,076 | $2,185,191 | $103,635,267 |
| Nova Scotia | $395,167,577 | $24,757,252 | $419,924,829 | $501,347,606 | $25,265,210 | $526,612,816 |
| New Brunswick | $123,077,242 | $3,233,206 | $126,310,449 | $153,151,754 | $3,919,952 | $157,071,706 |
| Quebec | $2,082,173,520 | $71,273,597 | $2,153,447,117 | $2,452,969,912 | $101,660,524 | $2,554,630,436 |
| Ontario | $9,694,522,870 | $339,530,209 | $10,034,053,079 | $11,874,213,307 | $473,231,108 | $12,347,444,415 |
| Manitoba | $420,124,153 | $10,456,853 | $430,581,006 | $515,680,244 | $7,177,555 | $522,857,799 |
| Saskatchewan | $209,630,830 | $4,323,905 | $213,954,735 | $245,000,477 | $7,421,940 | $252,422,417 |
| Alberta | $826,038,495 | $45,924,386 | $871,962,881 | $969,361,646 | $57,774,166 | $1,027,135,812 |
| British Columbia | $3,777,841,362 | $251,445,960 | $4,029,287,321 | $4,391,362,855 | $316,816,000 | $4,708,178,855 |
| Territories | $8,538,711 | $0.00 | $8,538,711 | $9,820,215 | $0.00 | $9,820,215 |
| Canada | $17,691,341,929 | $752,885,548 | $18,444,227,477 | $21,307,133,324 | $995,451,647 | $22,302,584,971 |
2.2. Economic impact
As we pointed out in the methodology section, when a person spends money on a product (goods and/or services), that amount creates a direct requirement for the production of that product. The economic impact, however, does not end there. The increased production of the product leads to increased production of all the intermediate goods and services that are used to make that product, which in turn generates more demand for other goods and services that are used to produce these intermediate products. As such, the initial demand for a product creates a chain effect down the production process. This is referred to as the combined direct and indirect impact.
To produce these impact values, we used Statistics Canada’s economic impacts simulation model to estimate international students’ contribution to each province’s GDP and employment.
The following sections present the combined direct and indirect impacts, first for the aggregate of all students, followed by the analysis for long-term students, then short-term students.
2.2.1. Combined direct and indirect impacts
2.2.1.1 Aggregate for all students
Table 2.3 below presents the results of the combined direct and indirect economic impacts associated with all students in Canada, by province and territory, in 2017 and 2018.
In 2017, the total GDP contribution of all student expenditures amounted to $16.2 billion in Canada, when both direct and indirect impacts were considered. Directly and indirectly, the international education sector supported over 180,041 jobs.
In 2018, the combined direct and indirect GDP contribution of all student expenditures amounted to $19.7 billion in Canada, when we take into account not only the sectors directly impacted by international student spending, but also the many other industries in the supply chain of those directly impacted. In terms of employment, 218,577 jobs.
| Region | 2017 Output | 2017 GDP | 2017 Labour Income | 2017 Employment | 2018 Output | 2018 GDP | 2018 Labour Income | 2018 Employment |
|---|---|---|---|---|---|---|---|---|
| Newfoundland and Labrador | $109,853 | $68,127 | $40,405 | 793 | $131,955 | $83,134 | $50,015 | 972 |
| Prince Edward Island | $95,751 | $61,346 | $38,160 | 751 | $123,995 | $79,599 | $49,469 | 971 |
| Nova Scotia | $513,289 | $334,300 | $209,721 | 4,564 | $641,804 | $421,594 | $265,381 | 5,732 |
| New Brunswick | $194,653 | $114,281 | $69,411 | 1,519 | $240,422 | $142,375 | $86,619 | 1,882 |
| Quebec | $3,064,845 | $1,967,561 | $1,124,384 | 22,978 | $3,637,038 | $2,351,332 | $1,346,632 | 27,324 |
| Ontario | $12,802,039 | $8,727,941 | $5,396,947 | 95,596 | $15,787,177 | $10,854,670 | $6,715,564 | 118,206 |
| Manitoba | $587,930 | $376,805 | $220,787 | 4,400 | $713,057 | $460,082 | $269,459 | 5,340 |
| Saskatchewan | $334,713 | $206,529 | $118,936 | 2,209 | $394,079 | $245,361 | $142,713 | 2,628 |
| Alberta | $1,540,106 | $927,831 | $538,090 | 8,640 | $1,814,962 | $1,106,277 | $641,361 | 10,228 |
| British Columbia | $4,948,021 | $3,370,592 | $2,081,856 | 38,478 | $5,797,280 | $3,988,723 | $2,458,329 | 45,164 |
| Territories | $25,702 | $13,412 | $8,102 | 112 | $28,777 | $15,261 | $9,169 | 130 |
| Canada | $24,216,902 | $16,168,725 | $9,846,798 | 180,041 | $29,310,546 | $19,748,407 | $12,026,088 | 218,577 |
Figure 2.3 – Economic impact by province, 2017


View accessible version of figure 2.3
| Region | Output | GDP | Labour Income | Employment | All Students |
|---|---|---|---|---|---|
| Newfoundland and Labrador | 0.45% | 0.42% | 0.41% | 0.44% | 0.61% |
| Prince Edward Island | 0.40% | 0.38% | 0.39% | 0.42% | 0.47% |
| Nova Scotia | 2.12% | 2.07% | 2.13% | 2.53% | 2.61% |
| New Brunswick | 0.80% | 0.71% | 0.41% | 0.84% | 0.96% |
| Quebec | 12.66% | 12.17% | 11.42% | 12.76% | 12.24% |
| Ontario | 52.86% | 53.98% | 54.81% | 53.10% | 47.32% |
| Manitoba | 2.43% | 2.33% | 2.24% | 2.44% | 2.96% |
| Saskatchewan | 1.38% | 1.28% | 1.21% | 1.23% | 1.42% |
| Alberta | 6.36% | 5.74% | 5.46% | 4.80% | 5.08% |
| British Columbia | 20.43% | 20.85% | 21.14% | 21.37% | 26.27% |
| Territories | 0.11% | 0.08% | 0.08% | 0.06% | 0.04% |
| Canada | 100.00% | 100.00% | 100.00% | 100.00% | 100.00% |
Figure 2.4 – Economic impact by province, 2018


View accessible version of figure 2.4
| Region | Output | GDP | Labour Income | Employment | All Students |
|---|---|---|---|---|---|
| Newfoundland and Labrador | 0.45% | 0.42% | 0.42% | 0.44% | 0.59% |
| Prince Edward Island | 0.42% | 0.40% | 0.41% | 0.44% | 0.51% |
| Nova Scotia | 2.19% | 2.13% | 2.21% | 2.62% | 2.70% |
| New Brunswick | 0.82% | 0.72% | 0.72% | 0.86% | 0.99% |
| Quebec | 12.41% | 11.91% | 11.19% | 12.50% | 11.71% |
| Ontario | 53.86% | 54.96% | 55.80% | 54.08% | 48.00% |
| Manitoba | 2.43% | 2.33% | 2.24% | 2.44% | 2.90% |
| Saskatchewan | 1.34% | 1.24% | 1.19% | 1.20% | 1.45% |
| Alberta | 6.19% | 5.60% | 5.33% | 4.68% | 4.90% |
| British Columbia | 19.78% | 20.20% | 20.43% | 20.66% | 26.24% |
| Territories | 0.00% | 0.08% | 0.08% | 0.06% | 0.03% |
| Canada | 100.00% | 100.00% | 100.00% | 100.00% | 100.00% |
2.2.1.2. Long-term students
Table 2.4 presents the direct and indirect impacts of international students who stay in Canada for more than six months on the province or territory’s output, GDP, employment and labour income.
The values show that the total GDP contribution of students who stayed for more than six months during the year amounted to almost $15.4 billion in 2017 in Canada. In terms of employment, international education services supported almost 170,347 jobs in Canada.
The comparable values show that the combined direct and indirect GDP contribution of expenditures incurred by long-term students amounted to over $18.7 billion in 2018 in Canada. In terms of employment, international education services and the goods and services in its supply chain supported 206,088 jobs.
| Region | 2017 Output | 2017 GDP | 2017 Labour Income | 2017 Employment | 2018 Output | 2018 GDP | 2018 Labour Income | 2018 Employment |
|---|---|---|---|---|---|---|---|---|
| Newfoundland and Labrador | $107,754 | $67,007 | $39,731 | 778 | $127,823 | $80,815 | $48,594 | 945 |
| Prince Edward Island | $94,554 | $60,795 | $37,859 | 733 | $115,411 | $74,227 | $46,320 | 896 |
| Nova Scotia | $482,434 | $316,358 | $199,328 | 4,275 | $607,528 | $399,534 | $252,562 | 5,405 |
| New Brunswick | $190,920 | $112,588 | $68,380 | 1,482 | $226,022 | $133,448 | $81,425 | 1,759 |
| Quebec | $2,984,526 | $1,925,827 | $1,100,743 | 22,241 | $3,412,521 | $2,205,585 | $1,266,319 | 25,481 |
| Ontario | $13,540,732 | $9,302,503 | $5,750,178 | 100,905 | $14,981,076 | $10,315,984 | $6,407,693 | 112,079 |
| Manitoba | $585,838 | $377,831 | $221,160 | 4,363 | $670,754 | $433,538 | $254,417 | 5,011 |
| Saskatchewan | $330,261 | $204,868 | $118,038 | 2,167 | $369,806 | $230,392 | $134,963 | 2,459 |
| Alberta | $1,506,376 | $914,288 | $531,031 | 8,402 | $1,663,281 | $1,009,440 | $587,706 | 9,272 |
| British Columbia | $4,755,578 | $3,274,472 | $2,029,487 | 36,899 | $5,204,925 | $3,589,428 | $2,235,298 | 40,534 |
| Territories | $16,923 | $9,253 | $5,816 | 86 | $19,461 | $10,641 | $6,689 | 99 |
| Canada | $24,595,896 | $16,565,790 | $10,101,751 | 182,331 | $27,398,608 | $18,483,032 | $11,321,986 | 203,940 |
2.2.1.3. Short-term students
When we take into account the spending of short-term language students who are studying in Languages Canada’s member schools, these international students directly and indirectly contributed an additional $0.720 billion to GDP and supported 9,695 jobs in 2017. The comparable values in 2018 were $4.068 billion in GDP contributions and 12,489 jobs supported. This is represented in Table 2.5.
| Region | 2017 Output | 2017 GDP | 2017 Labour Income | 2017 Employment | 2018 Output | 2018 GDP | 2018 Labour Income | 2018 Employment |
|---|---|---|---|---|---|---|---|---|
| Newfoundland and Labrador | $1,332 | $636 | $347 | n/a | $3,142 | $1,502 | $824 | 12 |
| Prince Edward Island | $1,542 | $862 | $516 | 14 | $3,034 | $1,666 | $991 | 28 |
| Nova Scotia | $8,205 | $4,587 | $2,745 | 69 | $32,050 | $18,158 | $11,007 | 299 |
| New Brunswick | $5,528 | $2,762 | $1,658 | 40 | $9,982 | $4,613 | $2,695 | 68 |
| Quebec | $95,336 | $52,305 | $29,394 | 729 | $194,323 | $105,339 | $58,728 | 1,468 |
| Ontario | $309,269 | $178,680 | $103,781 | 2211 | $725,223 | $420,968 | $242,184 | 5,227 |
| Manitoba | $12,309 | $6,420 | $3,619 | 84 | $23,144 | $11,693 | $6,707 | 155 |
| Saskatchewan | $6,481 | $3,115 | $1,543 | 34 | $19,475 | $9,908 | $5,077 | 120 |
| Alberta | $64,235 | $33,612 | $18,506 | 339 | $146,128 | $76,255 | $43,009 | 828 |
| British Columbia | $230,955 | $134,498 | $76,694 | 1760 | $446,094 | $258,515 | $146,843 | 3,433 |
| Territories | $0.00 | $0.00 | $0.00 | n/a | $0.00 | $0.00 | $0.00 | n/a |
| Canada | $735,192 | $417,477 | $238,803 | 5280 | $1,602,595 | $908,617 | $518,065 | 11,638 |
2.2.1.4. Government tax revenue
In this subsection, we further demonstrate the importance of total spending by international students in terms of its contribution to government revenue. In general, government revenues come from personal income taxes, indirect taxes less subsidies, corporate income taxes and natural resource royalties. In this study, we were able to estimate personal income taxes and indirect taxes.
Indirect taxes incurred in the process of producing outputs and services include both indirect taxes on production (such as property taxes) and indirect taxes on products (such as federal and provincial sales taxes).
Government revenue can be derived by Statistics Canada’s expenditure model to calculate the amount of indirect taxes incurred in the process of producing an industry’s outputs and services. It should be noted that Statistics Canada’s model estimates tax revenue impacts for the combined direct and indirect impacts, and total (direct, indirect and induced impacts) scenarios only.
In addition to indirect taxes, another type of tax revenue generated is income taxes associated with labour income. Statistics Canada’s expenditure model did not automatically estimate personal income taxes. Instead, we derived the values by applying the average personal income tax rates in each province and territory to labour income, which is generated in Statistics Canada’s expenditure model.
The following three tables show our estimates of the tax revenue impacts, first for all international student spending in a year, and then for annual spending by long-term students and short-term students, respectively.
The total tax revenue generated by indirect taxes and personal income taxes associated with international student spending in 2017 was estimated to be $3.1 billion, when direct and indirect impacts were combined.
The total tax revenue contributed to all levels of government as a result of international student expenditures was more than $3.7 billion in Canada in 2018, when direct and indirect impacts were combined.
| Region | 2017 Indirect Taxes | 2017 Personal Income Taxes | 2017 Total Tax Revenue | 2018 Indirect Taxes | 2018 Personal Income Taxes | 2018 Total Tax Revenue |
|---|---|---|---|---|---|---|
| Newfoundland and Labrador | $7,132 | $7,334 | $14,466 | $8,253 | $9,235 | $17,488 |
| Prince Edward Island | $5,705 | $6,083 | $11,787 | $7,060 | $7,759 | $14,819 |
| Nova Scotia | $26,591 | $35,293 | $61,884 | $35,919 | $45,818 | $81,736 |
| New Brunswick | $11,592 | $10,651 | $22,243 | $13,754 | $12,988 | $26,742 |
| Quebec | $230,384 | $210,091 | $440,476 | $268,287 | $249,997 | $518,284 |
| Ontario | $795,406 | $1,060,483 | $1,855,889 | $896,041 | $1,211,937 | $2,107,977 |
| Manitoba | $38,856 | $38,206 | $77,062 | $44,527 | $45,678 | $90,205 |
| Saskatchewan | $12,419 | $18,595 | $31,014 | $14,267 | $22,316 | $36,583 |
| Alberta | $50,945 | $97,541 | $148,486 | $59,019 | $115,286 | $174,305 |
| British Columbia | $219,486 | $341,586 | $561,072 | $252,521 | $392,907 | $645,428 |
| Territories | $14,813 | $10,213 | $25,026 | $55,280 | $11,908 | $67,187 |
| Canada | $1,413,329 | $1,836,076 | $3,249,405 | $1,654,928 | $2,125,829 | $3,780,754 |
| Region | 2017 Indirect Taxes | 2017 2Personal Income Taxes | 2017 Total Tax Revenue | 2018 Indirect Taxes | 2018 Personal Income Taxes | 2018 Total Tax Revenue |
|---|---|---|---|---|---|---|
| Newfoundland and Labrador | $7,132 | $7,334 | $14,466 | $8,253 | $9,235 | $17,488 |
| Prince Edward Island | $5,566 | $5,936 | $11,502 | $6,911 | $7,595 | $14,506 |
| Nova Scotia | $25,022 | $33,211 | $58,233 | $34,195 | $43,618 | $77,813 |
| New Brunswick | $11,295 | $10,379 | $21,674 | $13,411 | $12,663 | $26,074 |
| Quebec | $222,758 | $203,137 | $425,896 | $257,609 | $240,047 | $497,656 |
| Ontario | $768,521 | $1,024,639 | $1,793,160 | $861,722 | $1,165,519 | $2,027,242 |
| Manitoba | $37,912 | $37,278 | $75,189 | $43,917 | $45,052 | $88,969 |
| Saskatchewan | $12,168 | $18,220 | $30,388 | $13,847 | $21,660 | $35,508 |
| Alberta | $48,260 | $92,401 | $140,661 | $55,702 | $108,807 | $164,509 |
| British Columbia | $205,790 | $320,271 | $526,061 | $235,527 | $366,464 | $601,991 |
| Territories | $14,813 | $10,213 | $25,026 | $55,280 | $11,908 | $67,187 |
| Canada | $1,359,237 | $1,763,019 | $3,122,256 | $1,586,374 | $2,032,568 | $3,618,943 |
| Region | 2017 Indirect Taxes | 2017 Personal Income Taxes | 2017 Total Tax Revenue | 2018 Indirect Taxes | 2018 Personal Income Taxes | 2018 Total Tax Revenue |
|---|---|---|---|---|---|---|
| Newfoundland and Labrador | $0.00 | $0.00 | $0.00 | $0.00 | $0.00 | $0.00 |
| Prince Edward Island | $138 | $147 | $285 | $149 | $164 | $313 |
| Nova Scotia | $1,569 | $2,082 | $3,651 | $1,724 | $2,199 | $3,923 |
| New Brunswick | $297 | $273 | $569 | $344 | $325 | $669 |
| Quebec | $7,626 | $6,954 | $14,580 | $10,678 | $9,950 | $20,628 |
| Ontario | $26,885 | $35,844 | $62,729 | $34,318 | $46,417 | $80,736 |
| Manitoba | $944 | $928 | $1,873 | $610 | $626 | $1,236 |
| Saskatchewan | $251 | $376 | $626 | $419 | $656 | $1,076 |
| Alberta | $2,685 | $5,140 | $7,825 | $3,317 | $6,479 | $9,796 |
| British Columbia | $13,696 | $21,315 | $35,011 | $16,995 | $26,443 | $43,437 |
| Territories | $0.00 | $0.00 | $0.00 | $0.00 | $0.00 | $0.00 |
| Canada | $54,091 | $73,059 | $127,149 | $68,554 | $93,259 | $161,814 |
Report a problem on this page
- Date modified: