
Canada’s export diversity by product
Colin Scarffe
2019-02-25
Table of Contents
1. Summary
- It is important to think of export diversity not just geographically, but also by product.
- Canada’s merchandise exports to the world are diversified by product at the HS2 level.
- Canadian merchandise exports to the majority of destination countries are concentrated by product, but are generally diversified for the larger markets.
- Almost all Canadian export products are heavily dependent on the United States.
2. Non-technical summary
This study focuses on the diversity of merchandise exports by product. Export diversity by product is important to hedge against price shocks and sector-specific drops in demand. Product diversity is also important for ensuring that a positive shock in demand or price for a given product does not appreciate the currency to the point it reduces the competitiveness of other industries.
While Canada is known to be as a large exporter of energy and autos, its overall exports are diversified by product. This does not mean that Canada is immune to shocks in key industries, but rather that the Canadian economy should be able to adjust in the event of a product-specific downturn.
Generally, the mix of products Canada exports to a given country is not diversified. However, Canada’s exports are diversified toward most of its largest trading partners. An increase in distance to a destination country is correlated with exports to that country becoming more concentrated, but an increase in economic size is correlated with higher export diversity to a destination country. In many cases, economic size is the dominant effect leading Canadian exports to be diverse to many large partner economies despite substantial distance.
Canadian exports dependence on the United States is not a narrative limited to the energy and auto industries. Of the 99 export categories (96 HS2 products, unspecified products, aggregate merchandise, and commercial services), the U.S. is the largest destination for 91 of them, and has a share over half for 83 categories.
3. Introduction
A previous report looked at the geographic concentration of Canadian exports while this paper will assess the diversity of Canadian exports by product. Product or industry concentration is normally an issue for small developing countries that have a comparative advantage in a product—usually a natural resource—and that industry ends up dominating the country’s exports.Footnote 1 There are two challenges with having a dominant export; first, analogous to a financial portfolio, it is risky to have a single product make up a large share of exports as it leaves the country exposed to changes in the price or demand for this commodity. It is preferable to have diversified assets, or exports, to hedge against sector-specific shocks—if the price of a commodity decreases, the effects on the economy will be much different whether that commodity makes up 1% or 50% of overall exports. The second problem is known as Dutch disease. If a commodity makes up a large portion of exports, an increase in external demand for that commodity may appreciate the country’s currency, making imports cheaper and exports more expensive—both of which reduce the competitiveness of other industries, further concentrating the economy.
Most of the focus on export diversification has dealt with geographic diversification, or diversification away from the United States, but examining concentration by industry may provide additional insights. It is well known that Canadian exports are dependant on the United States. However, diversifying away from the U.S. market can have different implications and may require a different strategy depending on whether the source of the concentration is a limited number of products or is broad-based, and whether it’s realistic for Canadian firms in some industries to export their products globally. This paper is focused on the diversity of Canadian merchandise exports by product, but will also look at export diversity for various product-country combinations.
4. Product diversity
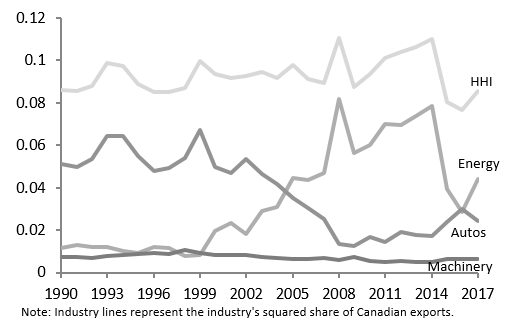
As was done in Canada’s Geographic Export Diversity, concentration will be measured by the Herfindahl-Hirschman Index (HHI).Footnote 2 The HHI, a sum of squared shares, is the most commonly used measure of export concentration; an HHI below 0.15 is considered diversified and an HHI above 0.25 is considered concentrated.Footnote 3 Using the two digit HS level (96 product categories), the HHI was 0.085 in 2017, indicating that Canadian exports are diversified by product.Footnote 4 This might not have been the ex-ante expectation, as Canada is known for its high share of energy and auto exports. Energy exports and auto exports are both critical to the Canadian economy, but because Canada’s exports are so substantial, these products make up relatively modest shares of overall exports; in 2017, their respective shares were 21% and 16%. The impact of the United States on Canadian exports is clear as Canada sends over 90% of both auto and energy sector exports to that country.
Figure 1: HHI by Product
Text version
| HHI | Énergie | Autos | Machines | |
|---|---|---|---|---|
| 1990 | 0.085804 | 0.011433 | 0.050964 | 0.007453 |
| 1991 | 0.085699 | 0.013042 | 0.049668 | 0.007083 |
| 1992 | 0.088105 | 0.011981 | 0.053712 | 0.007036 |
| 1993 | 0.098579 | 0.011981 | 0.064282 | 0.007758 |
| 1994 | 0.097177 | 0.009999 | 0.064182 | 0.00809 |
| 1995 | 0.088767 | 0.009052 | 0.054743 | 0.008846 |
| 1996 | 0.084931 | 0.011992 | 0.048083 | 0.009251 |
| 1997 | 0.085016 | 0.011454 | 0.049209 | 0.008939 |
| 1998 | 0.087137 | 0.0076 | 0.053904 | 0.010435 |
| 1999 | 0.099813 | 0.008133 | 0.067274 | 0.009212 |
| 2000 | 0.093579 | 0.019583 | 0.049731 | 0.008324 |
| 2001 | 0.091871 | 0.023183 | 0.046835 | 0.008357 |
| 2002 | 0.092462 | 0.018175 | 0.053343 | 0.008144 |
| 2003 | 0.094337 | 0.029137 | 0.046237 | 0.007251 |
| 2004 | 0.091717 | 0.030689 | 0.041879 | 0.006973 |
| 2005 | 0.0978 | 0.044675 | 0.035363 | 0.006557 |
| 2006 | 0.091415 | 0.043383 | 0.030369 | 0.006475 |
| 2007 | 0.08921 | 0.046721 | 0.025097 | 0.006843 |
| 2008 | 0.110617 | 0.081934 | 0.013373 | 0.006082 |
| 2009 | 0.087603 | 0.056548 | 0.012378 | 0.007497 |
| 2010 | 0.093442 | 0.059915 | 0.016868 | 0.005536 |
| 2011 | 0.100909 | 0.06987 | 0.014563 | 0.005148 |
| 2012 | 0.104009 | 0.069368 | 0.019232 | 0.005511 |
| 2013 | 0.106437 | 0.073726 | 0.017848 | 0.004909 |
| 2014 | 0.110203 | 0.078644 | 0.017058 | 0.00505 |
| 2015 | 0.08045 | 0.039291 | 0.023727 | 0.006321 |
| 2016 | 0.076752 | 0.028372 | 0.030193 | 0.00653 |
| 2017 | 0.085475 | 0.044339 | 0.024085 | 0.006451 |
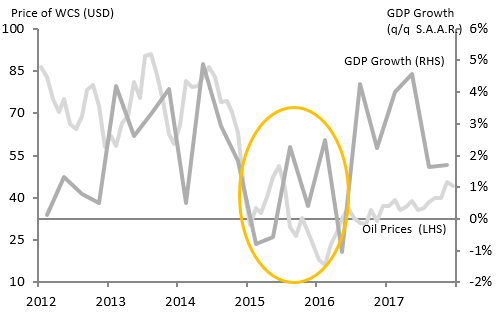
An HHI indicating that Canadian exports are diversified by product does not mean that Canada is immune to industry-specific shocks. The price of Western Canadian Select crude oil went from 86.56 (USD/bbl) in June 2014 to 16.30 (USD/bbl) in February 2016 causing a shallow recession that lasted two quarters at the beginning of 2015 and led the Bank of Canada to cut interest rates twice.Footnote 5 Yet, Canada’s export diversity by product meant that the oil price shock only triggered a modest economic contraction and the Canadian economy was able to adjust and resume growing despite the continuing decrease in oil prices.
Figure 2: Oil Prices and GDP Growth
Text version
| GDP Dates | GDP Growth |
|---|---|
| Q1 2012 | 0.001894 |
| Q2 2012 | 0.013499 |
| Q3 2012 | 0.005296 |
| Q4 2012 | 0.008211 |
| Q1 2013 | 0.036064 |
| Q2 2013 | 0.023529 |
| Q3 2013 | 0.032742 |
| Q4 2013 | 0.042784 |
| Q1 2014 | 0.005677 |
| Q2 2014 | 0.037619 |
| Q3 2014 | 0.038757 |
| Q4 2014 | 0.028487 |
| Q1 2015 | -0.02159 |
| Q2 2015 | -0.01074 |
| Q3 2015 | 0.014103 |
| Q4 2015 | 0.002705 |
| Q1 2016 | 0.023953 |
| Q2 2016 | -0.01806 |
| Q3 2016 | 0.044094 |
| Q4 2016 | 0.023455 |
| Q1 2017 | 0.040936 |
| Q2 2017 | 0.04401 |
| Q3 2017 | 0.013258 |
| Q4 2017 | 0.017048 |
| Oil Prices | Oil Prices dates |
|---|---|
| 86.47 | Jan-12 |
| 83.04 | Feb-12 |
| 75.01 | Mar-12 |
| 70.4 | Apr-12 |
| 75.1 | May-12 |
| 66.37 | Jun-12 |
| 64.28 | Jul-12 |
| 69.03 | Aug-12 |
| 78.17 | Sep-12 |
| 79.88 | Oct-12 |
| 72.47 | Nov-12 |
| 57.87 | Dec-12 |
| 62.11 | Jan-13 |
| 58.4 | Feb-13 |
| 66.72 | Mar-13 |
| 68.87 | Apr-13 |
| 80.93 | May-13 |
| 75.39 | Jun-13 |
| 90.5 | Jul-13 |
| 90.97 | Aug-13 |
| 83.57 | Sep-13 |
| 74.21 | Oct-13 |
| 62.62 | Nov-13 |
| 58.95 | Dec-13 |
| 65.69 | Jan-14 |
| 81.54 | Feb-14 |
| 79.42 | Mar-14 |
| 79.56 | Apr-14 |
| 82.72 | May-14 |
| 86.56 | Jun-14 |
| 82.73 | Jul-14 |
| 73.89 | Aug-14 |
| 74.35 | Sep-14 |
| 70.6 | Oct-14 |
| 62.87 | Nov-14 |
| 43.24 | Dec-14 |
| 30.43 | Jan-15 |
| 36.52 | Feb-15 |
| 34.76 | Mar-15 |
| 40.26 | Apr-15 |
| 47.5 | May-15 |
| 51.29 | Jun-15 |
| 43.49 | Jul-15 |
| 29.48 | Aug-15 |
| 26.5 | Sep-15 |
| 32.78 | Oct-15 |
| 27.78 | Nov-15 |
| 22.51 | Dec-15 |
| 17.88 | Jan-16 |
| 16.3 | Feb-16 |
| 23.46 | Mar-16 |
| 27.88 | Apr-16 |
| 32.52 | May-16 |
| 36.47 | Jun-16 |
| 32.8 | Jul-16 |
| 30.9 | Aug-16 |
| 30.62 | Sep-16 |
| 35.83 | Oct-16 |
| 31.89 | Nov-16 |
| 37.18 | Dec-16 |
| 37.19 | Jan-17 |
| 39.14 | Feb-17 |
| 35.68 | Mar-17 |
| 36.84 | Apr-17 |
| 38.84 | May-17 |
| 35.8 | Jun-17 |
| 36.37 | Jul-17 |
| 38.5 | Aug-17 |
| 39.93 | Sep-17 |
| 39.87 | Oct-17 |
| 45.52 | Nov-17 |
| 44.02 | Dec-17 |
5. Product diversity by destination
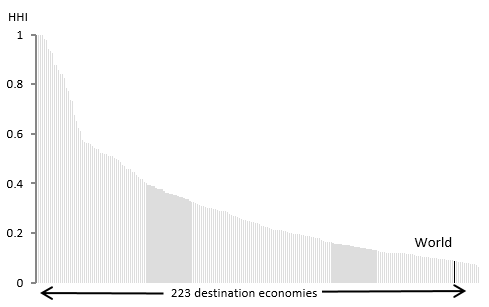
Product diversity by destination economy is important as it is one aspect of bargaining power when it comes to tariffs and free trade agreements. If, for example, Canada’s exports to a given economy are concentrated, the prospect of a tariff on the concentrated industry is a much bigger threat than if Canadian exports are diversified. Based on Canada’s exports to 223 destinations in 2017, Canadian exports were concentrated by product (HHI>0.25) for 106 destinations and they were diversified by product (HHI<0.15) for 65 destinations.
Figure 3: Product Diversity by Destination
Text version
| Rank | HHI | Country |
|---|---|---|
| 1 | 1 | Bouvet Island |
| 2 | 1 | Cocos (Keeling) Islands |
| 3 | 1 | Nauru |
| 4 | 1 | Niue |
| 5 | 0.981196 | Botswana |
| 6 | 0.978847 | Gibraltar |
| 7 | 0.941163 | Malta |
| 8 | 0.935354 | Korea, Dem. Rep. |
| 9 | 0.925399 | Latvia |
| 10 | 0.879343 | Lesotho |
| 11 | 0.876948 | Seychelles |
| 12 | 0.855421 | Antarctica |
| 13 | 0.84285 | Heard Island and McDonald Isla |
| 14 | 0.842392 | Fr. So. Ant. Tr |
| 15 | 0.82621 | Solomon Islands |
| 16 | 0.785951 | British Indian Ocean Ter. |
| 17 | 0.771926 | Cook Islands |
| 18 | 0.737633 | Somalia |
| 19 | 0.731819 | Bahamas, The |
| 20 | 0.67737 | Malawi |
| 21 | 0.653002 | Falkland Island |
| 22 | 0.624439 | Tonga |
| 23 | 0.611806 | Kiribati |
| 24 | 0.575831 | Cambodia |
| 25 | 0.566741 | Sao Tome and Principe |
| 26 | 0.562806 | United Kingdom |
| 27 | 0.561825 | Cameroon |
| 28 | 0.559919 | Central African Republic |
| 29 | 0.550635 | Bulgaria |
| 30 | 0.5421 | Zimbabwe |
| 31 | 0.539427 | Guinea-Bissau |
| 32 | 0.537329 | Angola |
| 33 | 0.523132 | Turkmenistan |
| 34 | 0.522615 | Mozambique |
| 35 | 0.520208 | Kyrgyz Republic |
| 36 | 0.519197 | Lao PDR |
| 37 | 0.512152 | Montenegro |
| 38 | 0.511805 | Fiji |
| 39 | 0.509658 | Wallis and Futura Isl. |
| 40 | 0.503721 | Macedonia, FYR |
| 41 | 0.497405 | Burundi |
| 42 | 0.494974 | Ethiopia(excludes Eritrea) |
| 43 | 0.485931 | Nigeria |
| 44 | 0.474148 | Ukraine |
| 45 | 0.468573 | Maldives |
| 46 | 0.459759 | Afghanistan |
| 47 | 0.458899 | Equatorial Guinea |
| 48 | 0.456933 | Morocco |
| 49 | 0.446538 | Norfolk Island |
| 50 | 0.445013 | Pitcairn |
| 51 | 0.432854 | Yemen |
| 52 | 0.426327 | Bhutan |
| 53 | 0.419259 | Algeria |
| 54 | 0.416504 | Georgia |
| 55 | 0.404014 | Tajikistan |
| 56 | 0.401112 | Sudan |
| 57 | 0.392137 | New Caledonia |
| 58 | 0.392014 | Cape Verde |
| 59 | 0.389397 | Slovenia |
| 60 | 0.388351 | Congo, Dem. Rep. |
| 61 | 0.382569 | Pakistan |
| 62 | 0.378183 | Trinidad and Tobago |
| 63 | 0.376178 | Rwanda |
| 64 | 0.37615 | Eritrea |
| 65 | 0.367654 | Ecuador |
| 66 | 0.361926 | Libya |
| 67 | 0.359811 | Tanzania |
| 68 | 0.358087 | Kazakhstan |
| 69 | 0.356644 | Bangladesh |
| 70 | 0.352224 | Guam |
| 71 | 0.352068 | Peru |
| 72 | 0.348588 | American Samoa |
| 73 | 0.343916 | Syrian Arab Republic |
| 74 | 0.343914 | Austria |
| 75 | 0.343127 | Greenland |
| 76 | 0.338117 | Sri Lanka |
| 77 | 0.336194 | Sierra Leone |
| 78 | 0.330995 | Mali |
| 79 | 0.325363 | Myanmar |
| 80 | 0.325253 | Bolivia |
| 81 | 0.321417 | Montserrat |
| 82 | 0.317926 | Mongolia |
| 83 | 0.314005 | Iran, Islamic Rep. |
| 84 | 0.309023 | Togo |
| 85 | 0.306855 | Luxembourg |
| 86 | 0.303388 | Switzerland |
| 87 | 0.302515 | Samoa |
| 88 | 0.302341 | Mauritania |
| 89 | 0.30029 | Kenya |
| 90 | 0.297446 | Venezuela |
| 91 | 0.294905 | Lithuania |
| 92 | 0.294294 | Benin |
| 93 | 0.290534 | United States Minor Outlying I |
| 94 | 0.288515 | Saudi Arabia |
| 95 | 0.287781 | Tunisia |
| 96 | 0.287522 | Madagascar |
| 97 | 0.285439 | Gabon |
| 98 | 0.276457 | Gambia, The |
| 99 | 0.270573 | Saint Helena |
| 100 | 0.269191 | Western Sahara |
| 101 | 0.268671 | Armenia |
| 102 | 0.262849 | Senegal |
| 103 | 0.259811 | Bahrain |
| 104 | 0.257181 | Iraq |
| 105 | 0.253478 | Burkina Faso |
| 106 | 0.251754 | Christmas Island |
| 107 | 0.247101 | Nepal |
| 108 | 0.247034 | Faeroe Islands |
| 109 | 0.245745 | Norway |
| 110 | 0.244344 | Iceland |
| 111 | 0.241999 | Ghana |
| 112 | 0.241544 | Chad |
| 113 | 0.234461 | Congo, Rep. |
| 114 | 0.229556 | Indonesia |
| 115 | 0.228072 | Uzbekistan |
| 116 | 0.225179 | French Polynesia |
| 117 | 0.222558 | Bonaire |
| 118 | 0.221554 | Cote d'Ivoire |
| 119 | 0.217885 | Finland |
| 120 | 0.212939 | Cayman Islands |
| 121 | 0.212807 | Poland |
| 122 | 0.212768 | Uganda |
| 123 | 0.210382 | Denmark |
| 124 | 0.210286 | Guinea |
| 125 | 0.206305 | Vanuatu |
| 126 | 0.206134 | British Virgin Islands |
| 127 | 0.20503 | Zambia |
| 128 | 0.20178 | Papua New Guinea |
| 129 | 0.200532 | Portugal |
| 130 | 0.197351 | Albania |
| 131 | 0.196727 | Belgium |
| 132 | 0.196255 | Paraguay |
| 133 | 0.195574 | Djibouti |
| 134 | 0.193586 | Colombia |
| 135 | 0.192984 | Haiti |
| 136 | 0.186997 | Swaziland |
| 137 | 0.186693 | Croatia |
| 138 | 0.185965 | Moldova |
| 139 | 0.181931 | Suriname |
| 140 | 0.181922 | East Timor |
| 141 | 0.180157 | Ireland |
| 142 | 0.178946 | Niger |
| 143 | 0.17803 | Oman |
| 144 | 0.172332 | Comoros |
| 145 | 0.167545 | Lebanon |
| 146 | 0.165194 | Macao |
| 147 | 0.162748 | Azerbaijan |
| 148 | 0.162727 | Uruguay |
| 149 | 0.162697 | Belarus |
| 150 | 0.15863 | Brazil |
| 151 | 0.157073 | Czech Republic |
| 152 | 0.156 | Andorra |
| 153 | 0.154249 | South Sudan |
| 154 | 0.154116 | Argentina |
| 155 | 0.152935 | Sweden |
| 156 | 0.152011 | Romania |
| 157 | 0.151801 | Greece |
| 158 | 0.151034 | Bosnia and Herzegovina |
| 159 | 0.14952 | Saint Pierre and Miquelon |
| 160 | 0.148338 | United Arab Emirates |
| 161 | 0.142673 | Liberia |
| 162 | 0.14214 | Estonia |
| 163 | 0.142117 | Nicaragua |
| 164 | 0.139335 | Qatar |
| 165 | 0.138825 | Dominican Republic |
| 166 | 0.137944 | Russian Federation |
| 167 | 0.136195 | St. Vincent and the Grenadines |
| 168 | 0.135012 | Hungary |
| 169 | 0.134733 | Mauritius |
| 170 | 0.133036 | Anguila |
| 171 | 0.131426 | Korea, Rep. |
| 172 | 0.130154 | Belize |
| 173 | 0.126205 | Costa Rica |
| 174 | 0.124733 | India |
| 175 | 0.123035 | Guatemala |
| 176 | 0.121913 | Cyprus |
| 177 | 0.121242 | Singapore |
| 178 | 0.121118 | United States |
| 179 | 0.12061 | Vietnam |
| 180 | 0.12017 | Jordan |
| 181 | 0.11992 | Brunei |
| 182 | 0.118947 | Spain |
| 183 | 0.118852 | Kuwait |
| 184 | 0.118518 | South Africa |
| 185 | 0.117973 | St. Lucia |
| 186 | 0.117502 | Turks and Caicos Isl. |
| 187 | 0.116688 | Guyana |
| 188 | 0.115894 | Serbia, FR(Serbia/Montenegro) |
| 189 | 0.114622 | El Salvador |
| 190 | 0.113392 | Grenada |
| 191 | 0.11097 | Italy |
| 192 | 0.108196 | Philippines |
| 193 | 0.106621 | Honduras |
| 194 | 0.106054 | Aruba |
| 195 | 0.102906 | Malaysia |
| 196 | 0.102237 | Türkiye |
| 197 | 0.101844 | France |
| 198 | 0.101217 | Netherlands |
| 199 | 0.101109 | Australia |
| 200 | 0.101098 | Dominica |
| 201 | 0.098961 | Slovak Republic |
| 202 | 0.097827 | Egypt, Arab Rep. |
| 203 | 0.096838 | Antigua and Barbuda |
| 204 | 0.096141 | Jamaica |
| 205 | 0.094113 | Namibia |
| 206 | 0.093188 | Bermuda |
| 207 | 0.092859 | Israel |
| 208 | 0.092049 | Japan |
| 209 | 0.089887 | Cuba |
| 210 | 0.089214 | Thailand |
| 211 | 0.087245 | All countries All --- All |
| 212 | 0.085564 | Other Asia, nes |
| 213 | 0.083876 | Saint Maarten (Dutch part) |
| 214 | 0.082837 | Hong Kong, China |
| 215 | 0.081238 | Curaçao |
| 216 | 0.077597 | Panama |
| 217 | 0.077495 | China |
| 218 | 0.077037 | Germany |
| 219 | 0.073765 | Barbados |
| 220 | 0.073505 | Mexico |
| 221 | 0.072999 | New Zealand |
| 222 | 0.072713 | Chile |
| 223 | 0.064242 | St. Kitts and Nevis |
As mentioned in Canada’s Geographic Export Diversity, the gravity model of trade can be useful for explaining trade flows. The farther away a country is from Canada, the more costly it makes trade. A reasonable hypothesis derived from the observed cross-section of data is that transport costs differ by industry, making it unfeasible to export some products over long distances, thus concentrating Canada’s exports on products with relatively low transport costs. A linear regression of export concentration on distance shows that distance enters positively (an increase in distance is correlated with an increase in concentration).
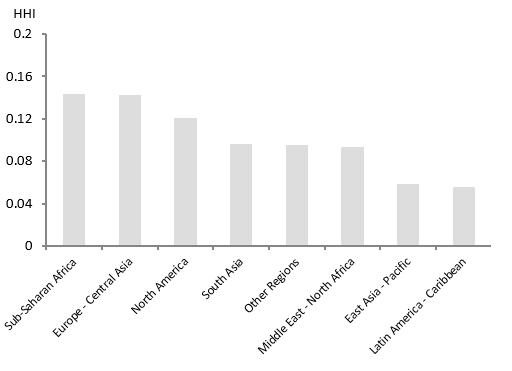
However, economic size also matters. Of Canada’s top 10 trading partners (by export value, accounting for 91% of total exports), 8 can be classified as diversified by product (HHI<0.15), one is moderately diversified (Belgium, HHI=0.19), and only one is classified as concentrated (the U.K., HHI=0.56), suggesting that where there is sufficient demand, Canadian exports are diversified by product.Footnote 6 One way to separate distance from demand is by aggregating countries into regions—it’s more likely that a region will have demand for every product while still displaying variation in distance. By region, Canada’s exports are diversified and, interestingly, the second and third most concentrated regions are Europe and North America. Footnote 7
Figure 4: Canada's Region-Product Diversity
Text version
| Afrique subsaharienne | Europe -Asie centrale | Amérique du Nord | Asie du Sud | Autres régions | Moyen-Orient – Afrique du Nord | Asie de l’Est – Pacifique | Amérique latine – Caraïbes | |
|---|---|---|---|---|---|---|---|---|
| HHI | 0.143514 | 0.142575 | 0.121107 | 0.096232 | 0.095027 | 0.093301 | 0.058203 | 0.055833 |
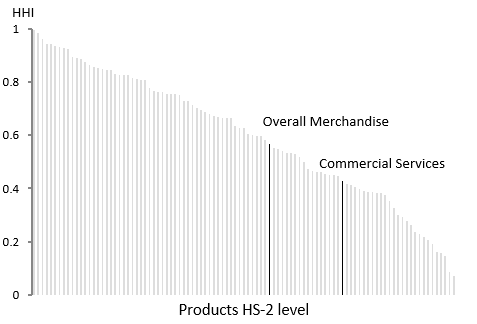
A simple linear regression of concentration on distance and GDP (by country) can be used to determine the correlation between concentration and the two explanatory variables, formally:Footnote 8
Text version
The HHI to country i is equal to a constant plus beta one times the natural log of distance to country i, plus beta two times the natural log of the gdp of country i, plus an error term.
| Variable | Coefficient | T-statistic |
|---|---|---|
| Constant | -0.745 | -2.40 |
| Distance | 0.127 | 3.74 |
| GDP | -0.032 | -5.46 |
The regression shows that Canadian exports become more concentrated the further away an economy is located, but become more diversified as the size of the partner economy increases. Again, the interpretation is that where there is sufficient demand for Canadian products, Canadian exporters are able to overcome the higher transport (or fixed) costs associated with greater distance. An example is Türkiye and Bulgaria, both located far away (7993 km for Bulgaria, and 8626 km for Türkiye); however, Türkiye’s GDP is 20 times that of Bulgaria. Consequently, the HHI of exports to Türkiye is 0.1 (diversified), while the HHI of exports to Bulgaria is 0.55 (highly concentrated).
The regression has an R2 of only 0.21, which means that there are certainly other factors involved in determining concentration. Common confounders could be things such as free-trade agreements, whether or not the partner is a market economy, a common language, and having similar cultures. An argument could be made that if one or more of these variables are correlated with market size or distance, not accounting for them in the above regression would produce biased results.
Figure 5: HHI by Product
Text version
| Date Series | HHI China | HHI U.S. by product |
|---|---|---|
| 1990 | 0.269681 | 0.123348 |
| 1991 | 0.252699 | 0.121125 |
| 1992 | 0.337575 | 0.121327 |
| 1993 | 0.135149 | 0.127544 |
| 1994 | 0.14366 | 0.1247 |
| 1995 | 0.164057 | 0.115002 |
| 1996 | 0.168767 | 0.10782 |
| 1997 | 0.091155 | 0.106441 |
| 1998 | 0.099654 | 0.10627 |
| 1999 | 0.103159 | 0.119772 |
| 2000 | 0.079576 | 0.111038 |
| 2001 | 0.070851 | 0.109025 |
| 2002 | 0.075411 | 0.109859 |
| 2003 | 0.083696 | 0.114306 |
| 2004 | 0.075358 | 0.114043 |
| 2005 | 0.062184 | 0.121994 |
| 2006 | 0.068907 | 0.11859 |
| 2007 | 0.072391 | 0.121904 |
| 2008 | 0.063479 | 0.151869 |
| 2009 | 0.078093 | 0.120951 |
| 2010 | 0.071059 | 0.133312 |
| 2011 | 0.076556 | 0.144404 |
| 2012 | 0.083001 | 0.148874 |
| 2013 | 0.07961 | 0.15242 |
| 2014 | 0.079211 | 0.156445 |
| 2015 | 0.072937 | 0.112726 |
| 2016 | 0.072206 | 0.104253 |
| 2017 | 0.075706 | 0.116787 |
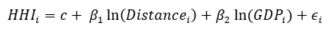
However, very few (if any) of these confounders apply to China, which has a very large economy and is far away. China was Canada’s second largest trading partner in 2017 (third if the EU is counted as a whole), with exports to China totaling $23.6 billion. The narrative surrounding Canadian exports to China is generally that due to distance and other barriers, they are concentrated in specific industries—namely natural resources. Canada’s exports to China are actually rather diversified. No industry contributes more than 20% of Canada’s exports to China, and only two, oil seeds (16.3%) and wood pulp (15.5%), represent more than 10%. Based on the HHI for 2017, Canada’s exports to China are actually more diversified than its exports to the United States. China provides an example that Canada is able to export in a wide array of industries despite existing barriers. Further, the diversity of products exported to China leaves Canada less exposed to a potential increase in China’s tariffs on any individual industry, or to a demand by China to reduce exports of any individual product, as it would only represent a small proportion of total exports to that country.
6. Destination diversity by product
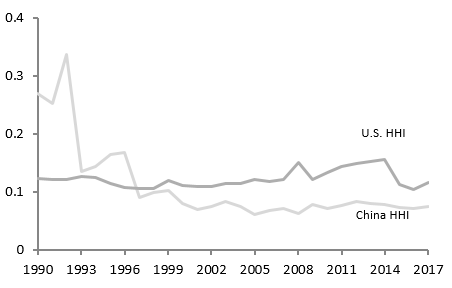
The complementary approach to examining the concentration of products toward each destination is to examine the concentration of destinations for each product. Of the 96 HS2 export products, plus a category for unclassified goods, the overall aggregate, and commercial services, only three are classified as geographically diversified by the HHI guidelines (HHI<0.15).Footnote 9 Of these 99 categories, the United States holds the largest share for 91 of them and makes up over half in 83 categories. This illustrates that Canada’s export reliance on the United States is not a feature exclusive to a few industries, but is a characteristic of almost all Canadian export industries. To illustrate, autos and energy exports are thought to be two of the most concentrated, and almost exclusively destined for the United States; however, autos are only the 12th most concentrated industry while energy is the 20th, despite U.S. shares of 94% and 91%, respectively. At the other end of the spectrum, ores, slag and ash is the second most diversified industry with a U.S. share of only 5%.
Figure 6: Canada's Product-Country Diversity
Text version
| Rank | HHI | HS code |
|---|---|---|
| 1 | 0.993413 | 46 |
| 2 | 0.984516 | 6 |
| 3 | 0.959174 | 18 |
| 4 | 0.941822 | 9 |
| 5 | 0.940506 | 19 |
| 6 | 0.935025 | 57 |
| 7 | 0.930297 | 1 |
| 8 | 0.925603 | 52 |
| 9 | 0.924686 | 78 |
| 10 | 0.892722 | 94 |
| 11 | 0.88859 | 96 |
| 12 | 0.886588 | 87 |
| 13 | 0.875025 | 68 |
| 14 | 0.861763 | 14 |
| 15 | 0.856009 | 56 |
| 16 | 0.853982 | 70 |
| 17 | 0.846604 | 54 |
| 18 | 0.84648 | 80 |
| 19 | 0.846176 | 60 |
| 20 | 0.828674 | 27 |
| 21 | 0.826435 | 39 |
| 22 | 0.825357 | 51 |
| 23 | 0.824802 | 86 |
| 24 | 0.816104 | 32 |
| 25 | 0.8092 | 55 |
| 26 | 0.808414 | 40 |
| 27 | 0.807116 | 73 |
| 28 | 0.775606 | 16 |
| 29 | 0.764885 | 76 |
| 30 | 0.762427 | 79 |
| 31 | 0.761183 | 83 |
| 32 | 0.753583 | 34 |
| 33 | 0.753535 | 37 |
| 34 | 0.752763 | 22 |
| 35 | 0.749566 | 20 |
| 36 | 0.729857 | 74 |
| 37 | 0.727997 | 24 |
| 38 | 0.714823 | 48 |
| 39 | 0.700661 | 64 |
| 40 | 0.694108 | 17 |
| 41 | 0.688787 | 72 |
| 42 | 0.679735 | 89 |
| 43 | 0.672951 | 21 |
| 44 | 0.669212 | 33 |
| 45 | 0.664803 | 59 |
| 46 | 0.663437 | 25 |
| 47 | 0.66282 | 69 |
| 48 | 0.634281 | 38 |
| 49 | 0.628566 | 28 |
| 50 | 0.627705 | 99 |
| 51 | 0.602618 | 84 |
| 52 | 0.601555 | 44 |
| 53 | 0.597189 | 62 |
| 54 | 0.595122 | 91 |
| 55 | 0.582211 | 67 |
| 56 | 0.568236 | Grand Total |
| 57 | 0.553464 | 29 |
| 58 | 0.54989 | 85 |
| 59 | 0.541803 | 11 |
| 60 | 0.534476 | 53 |
| 61 | 0.532708 | 65 |
| 62 | 0.530024 | 97 |
| 63 | 0.518296 | 49 |
| 64 | 0.499221 | 15 |
| 65 | 0.47205 | 58 |
| 66 | 0.464135 | 66 |
| 67 | 0.462502 | 42 |
| 68 | 0.461364 | 61 |
| 69 | 0.452922 | 35 |
| 70 | 0.450106 | 8 |
| 71 | 0.449181 | 23 |
| 72 | 0.448056 | 82 |
| 73 | 0.42786 | Commercial Services |
| 74 | 0.415226 | 30 |
| 75 | 0.413503 | 93 |
| 76 | 0.407441 | 95 |
| 77 | 0.399733 | 50 |
| 78 | 0.389254 | 31 |
| 79 | 0.387099 | 90 |
| 80 | 0.386985 | 3 |
| 81 | 0.383212 | 41 |
| 82 | 0.381604 | 71 |
| 83 | 0.374825 | 92 |
| 84 | 0.352904 | 45 |
| 85 | 0.325499 | 63 |
| 86 | 0.298678 | 2 |
| 87 | 0.294589 | 47 |
| 88 | 0.278028 | 5 |
| 89 | 0.264668 | 88 |
| 90 | 0.236523 | 36 |
| 91 | 0.228239 | 4 |
| 92 | 0.218725 | 7 |
| 93 | 0.205546 | 81 |
| 94 | 0.192502 | 12 |
| 95 | 0.160338 | 75 |
| 96 | 0.15877 | 43 |
| 97 | 0.145628 | 13 |
| 98 | 0.08759 | 26 |
| 99 | 0.072054 | 10 |
If only a few industries were concentrated, it could be concluded that Canada simply needs to focus on different industries as some products cannot be exported beyond the United States. However, as concentration is broad based, it is consistent with the previous assertion that concentration is not caused by an inability of Canadian exporters; instead, it is the strength of the attraction toward the United States that leads firms across all industries to naturally export to that country, which is the source of the concentration. This also implies that export diversification will be difficult to achieve. In order for exports to become more diversified, the natural choice, not of a single firm but of thousands of firms simultaneously, must be overcome. This is not to say that the goal of diversification should be that Canadian firms cease to export to the United States; rather, it is simply suggesting that it will be difficult to divert even partially the flow of exports toward other countries.
7. Conclusion
Canadian exports are diversified by product. This does not mean that Canada’s economy is immune to industry-specific shocks, but this diversification means that Canada’s economy should be able to adjust to an industry-specific downturn. Canadian exports are concentrated in many countries, but this appears more likely to be the result of a lack of demand from these countries rather than an inability of exporters to reach their market. Additionally, across almost all industries, the natural choice is to export to the United States, and thus export diversification may prove difficult as it will have to work against natural economic forces.
8. References
Government of Canada, Trade Data Online. Retrieved from https://www.ic.gc.ca/app/scr/tdst/tdo/crtr.html?&productType=HS6&lang=eng.
Head, Keith, and Thierry Mayer. “Gravity equations: Workhorse, toolkit, and cookbook.” In Handbook of International Economics, 4:131–195. Elsevier, 2014.
Head, Keith, Thierry Mayer and John Ries. “The erosion of colonial trade linkages after independence.” Journal of International Economics, 81, no. 1 (2010): 1–14.
IMF. “A Weakening Global Expansion,” World Economic Outlook, Update, January 2019.
Scarffe, Colin. Canada’s Geographic Export Diversity, Global Affairs Canada, 2019.
Statistics Canada. Table 36-10-0104-01: Gross domestic product, expenditure-based, Canada, quarterly (x 1,000,000).
Statistics Canada. Measuring Canadian Export Diversification. Catalogue no. 13-605-X, ISSN: 1705-9658, 2018.
United Nations Statistics Division. UN Comtrade. New York: United Nations. Retrieved from: https://comtrade.un.org/data/.
WCS Source: Alberta Energy (Jan 2009 to present). Retrieved from: https://economicdashboard.alberta.ca/OilPrice.
9. Appendix: Measurement
Measuring export concentration raises an issue because no tools have been developed exclusively to measure trade concentration. All existing tools borrow from other branches of economics that deal with concentration—portfolio theory, income inequality, and competition economics. As a result, these tools provide some guidance, but the economic or axiomatic justification for the choice of an index is lacking in the trade concentration field. Fortunately, the measures available tell the same story about Canada’s export concentration, and thus the discussion of the best measure is somewhat superfluous in the Canadian context. The measure selected for this analysis was the Herfindahl-Hirschman Index (HHI), defined below:
The closer to 1, the more the market is concentrated, and the closer to 0, the more it is diversified. For example, if Canada exported one product, the index would be 1, and if Canada’s exports were divided evenly between 100 different products, the index would be 0.01. As an approximate guideline, an HHI above 0.25 is considered concentrated and an HHI below 0.15 is considered diversified (internationally accepted guidelines taken from Statistics Canada). These are of course just guidelines, but the advantage of the HHI is that it is simple to decompose it into parts and to pursue the reasoning further. As the analysis of Canadian exports was insensitive to the selected measure, the HHI was chosen due to its relative simplicity.
One drawback of the HHI is that it is sensitive to the level of disaggregation. Because the shares in the index are squared, the more disaggregated the data, the lower the level of the index. As the number of products affects the level of the index (if there were only two products the least the index could be is 0.5), a normalized HHI can be calculated to solve this issue; however, there are 96 categories at the HS2 level and therefore the normalized index is unnecessary.
When examining products, the sensitivity to the level of aggregation can potentially raise issues. When assessing geography, it is easier to argue that categories are independent from size. There are large and small countries; size does not determine whether it is a distinct country or a part of another country. At a more disaggregated level, size again does not determine the number of states or provinces. However, with products, size may well determine whether some products get their own category at a given level of aggregation—in economics terms, product groupings may be endogenous to their size. At the lowest level of aggregation, the idea is that every product has its own classification, but at any higher level of aggregation, product groupings are somewhat arbitrary. For example, should rear-wheel drive cars be split from front-wheel drive cars at the same level that distinguishes between different grades of crude oil?
Only at the most disaggregated level, where every product has its own code, does the classification not suffer from the arbitrariness (or endogeneity) of product groupings. However, choosing the lowest level would cause the concentration index to be very close to zero. The highest level of aggregation still raises problems but the arbitrariness of distinctions is hopefully less important than at any lower level of aggregation. For more on how aggregation affects the HHI and other concentration indices, see Canada’s Geographic Export Diversity.
- Date modified: