
Adàwe: export experiences of Indigenous entrepreneurs
A joint report by the Canadian Council for Aboriginal Business and Global Affairs Canada
September 2023
Table of contents
- Key messages
- Executive summary
- Chapter 1: Introduction
- Chapter 2: Indigenous Peoples and trade
- Chapter 3: Destination markets and expansion plans
- Special feature: firms without employees
- Chapter 4: Indigenous SMEs’ export odds – an econometric approach
- Conclusions
- Bibliography
- Appendix
About the title
Adàwe is an Algonquin word meaning “to trade” or “exchange.” Algonquian is the parent language of many other Indigenous languages in Canada, such as Cree, Ojibwa, Blackfoot, Cheyenne, Mi'kmaq, Arapaho, and Fox-Sauk-Kickapoo.
Our usage of the Algonquin word for trade aims to be inclusive of Indigenous cultures while recognizing that no single word can capture all the diversity that exists within Indigenous languages in Canada.
Above all, we use the Algonquin word Adàwe to pay homage to the fact that Indigenous trade has existed since time immemorial.Footnote 1
Acknowledgements
This study was co-authored by the Canadian Council for Aboriginal Business (CCAB) and the Office of the Chief Economist of Global Affairs Canada (GAC) and funded by GAC.
The authors are indebted to all the Indigenous entrepreneurs, communities and councils who invested valuable time to share their experiences with us. We hope the products of our collaborative work will allow them to view these investments as ultimately beneficial to Indigenous economies.
The authors thank the project’s Indigenous advisory committee, made up of First Nations, Métis and Inuit leaders who provided guidance, advice, and feedback at every stage of the project.
This report was authored by Lucas Alexiou, Cody Lewis, Kaira Jakobsh, and Andy Avgerinos from CCAB, and Jacqueline Palladini and Michelle Zilbergerts from GAC. Any errors or omissions are the authors’.
We are thankful for contributions from Big River Analytics and their expertise in weighting the national survey data and their feedback on the survey design, Environics Research Group, who administered the national survey, and the Bank of Canada for their contributions to the survey questionnaire and project funding.
We would also like to thank officials at Indigenous Services Canada and Crown-Indigenous Relations and Northern Affairs Canada for their review of earlier drafts of sections in the report and for providing thoughtful input.
Graphic design and layout were developed by Saltmedia, and copy editing was completed by Kaitlin Littlechild.
As nationwide organizations, both GAC and the CCAB acknowledge that our project was undertaken on many Indigenous lands. We hope to honour this through our work to support the Indigenous Peoples who live, work and do business on this land.
This work is published under the joint responsibility of Global Affairs Canada and the Canadian Council for Aboriginal Business. The opinions and arguments expressed thus do not necessarily reflect the official views of the Government of Canada.
Canadian Council for Aboriginal Business
Canadian Council for Aboriginal Business (CCAB) is committed to the full participation of Indigenous Peoples in Canada’s economy. As a national, non-partisan association, CCAB has a mission to promote, strengthen and enhance a prosperous Indigenous economy through the fostering of business relationships, opportunities, and awareness. CCAB offers knowledge, resources, and programs to its members to foster economic opportunities for Indigenous Peoples and businesses across Canada.
CCAB’s work is dedicated to supporting Indigenous economies across Canada and bolstering meaningful and mutually beneficial relationships between Indigenous and non-Indigenous peoples, businesses and communities. CCAB does this through diverse programming, providing tools, training, network building, major business awards and national events.
CCAB's research shows that Indigenous entrepreneurs are motivated by a desire to innovate, expand and profit from their businesses, with many giving back to their communities. However, they also face unique challenges to their growth and development. A better understanding of these realities by businesses and governments, combined with the skills of Indigenous business owners, creates opportunities for everyone.
For more information visit www.ccab.com
Office of the Chief Economist, Global Affairs Canada
The Office of the Chief Economist at Global Affairs Canada (GAC) is comprised of a team of economists who research and advise on international commerce topics for the benefit of Canadians.
The team provides advice to policymakers and research on current issues such as:
- supply chains
- inclusive trade
- impacts of trade agreements
- foreign direct investment
- performance of Canadian exporting firms
The Office of the Chief Economist supports GAC’s inclusive trade mandate to ensure that the benefits of trade flow to all segments of society.
Our inclusive trade research evaluates impacts of trade on traditionally underrepresented groups such as women, Indigenous Peoples, and racialized people. This includes understanding the export activities of Indigenous entrepreneurs and the challenges they face.
Our work informs GAC trade policies, including the negotiations of free trade agreements, as well as our Trade Commissioner Service programs which help Canadian businesses succeed in international markets.
Key messages
- The Canadian Council for Aboriginal Business (CCAB) and Global Affairs Canada (GAC) have partnered to better understand the experiences of Indigenous exporters and the challenges they face.
- This is the first of two reports that present the results of our collaboration, which includes a national survey of 2,603 Indigenous businesses and case studies in three Indigenous communities.
- Recognizing the prosperity and growth that come from trade, this report provides a portrait of Indigenous exporters, including their characteristics and their export markets of interest. It also quantifies the extent to which these factors are associated with their likelihood of exporting using an econometric approach. The second report will focus on business and exporting challenges.
- Indigenous-owned small and medium enterprises (SMEs) tend to be slightly larger than the Canadian average and more concentrated in natural resources, accommodation, arts, and other services.
- In 2020, 7.2% of Indigenous SMEs exported, which was lower than the Canadian SME average of 12.1%.Footnote 2 This difference is partially explained by the different industry mix, though it does not account for the entirety of the gap.
- Remoteness is a major factor that is negatively associated with exporting. Firms in remote areas are associated with having a 65% reduction in their odds of exporting. On the other hand, virtual sales are a prominent factor empowering firms to export: firms that offer virtual sales are associated with having 6 times higher odds of exporting compared to firms without virtual sales.
- Majority women-owned Indigenous businesses represent 39.3% of all Indigenous exporters, which is over double the percentage of women-owned exporters out of all Canadian SMEs (14.5%).
- While the U.S. is the market of choice for the majority of SME exporters (Indigenous and non-Indigenous alike), Indigenous businesses tend to be more interested in doing business in Oceanic destinations (e.g., Australia and New Zealand) relative to the Canadian average.
Executive summary
This project comes from a desire to deepen knowledge of the Indigenous economy in Canada and better understand the barriers to expansion that it often faces. Indigenous Peoples established and employed extensive trade networks long before European settlers arrived, but very little research has been done to understand the current-day experiences of Indigenous exporters, including the difficulties they experience.
The Canadian Council for Aboriginal Business (CCAB) and Global Affairs Canada (GAC) have partnered together to deepen our understanding of specific challenges faced by Indigenous exporters with a goal of improving policy and programming to help Indigenous businesses succeed internationally, and to ultimately support the equitable inclusion and participation of Indigenous Peoples in Canada’s shared prosperity.
As part of this collaboration, we have conducted what may be the largest Indigenous business survey in Canada, hearing from more than 2,600 First Nation, Métis, and Inuit-owned businesses in every province and territory.
Our national Indigenous survey found that only 7.2% of Indigenous small and medium enterprises (SMEs) export, compared to the Canadian SME average of 12.1%.Footnote 3 Footnote 4 Given the productivity gains, technology transfer, and growth that trade can bring to SMEs, our project sheds light on the business operating environment for Indigenous firms and communities and identifies specific challenges that they face in order to enhance our understanding of the causes of this export gap.
This first paper bolsters our understanding of Indigenous exporting activity, including firm characteristics (e.g., size, industry, location), business activities (e.g., virtual sales), and export trends in existing markets and those targeted for international expansion. Our second paper will dive deeper into identifying and understanding the challenges that Indigenous businesses and exporters experience.
Indigenous SMEs have a slightly different industry mix than the Canadian average. While the top three industries are the same (construction; retail trade; and professional, scientific and technical services), Indigenous firms tend to be comparatively overrepresented in natural resource industries and services, including accommodation, food, art, entertainment and recreation, and information and cultural industries.
These SMEs are also less prevalent in some traditionally export-intensive industries, particularly wholesale trade and transportation and warehousing, which both can require high costs to enter.
Women are well-represented in the Indigenous business landscape, with 39% of Indigenous SMEs owned by women. This is more than twice the national average of less than 17% of Canadian SMEs being majority-owned by women.
Indigenous SMEs tend to be slightly larger than the Canadian average in terms of how many employees they have.
Indigenous-owned SME export activity is primarily focused on the U.S. and, to a lesser extent, European markets. However, there is a strikingly high interest in Oceanic markets (i.e., Australia and New Zealand), considering they are not among Canada’s main export markets. These markets were named both as top current export markets (Australia was the third most popular market after the U.S. and the United Kingdom) and targeted markets for expansion by the Indigenous SMEs surveyed. This may be due to an interest in those markets for Indigenous products or in establishing Indigenous-to-Indigenous business partnerships.
There is a broad interest in starting an export journey among Indigenous SMEs who do not currently do so. SMEs that do not currently export are over 4 times more likely to report plans to start exporting (16.3%) compared to the Canadian SME average (3.8%).
Using a statistical model, we found that geography plays a large role in Indigenous firms’ export activities. Indigenous SMEs located in remote regions experience 65% lower odds of exporting compared to urban-based Indigenous SMEs. This may be a result of infrastructure gaps (both physical and digital) or the great distance to international markets that many Indigenous entrepreneurs based in remote areas contend with.
To a lesser degree, being in an Indigenous community (e.g., on reserve) was associated with a 42% reduction in the odds of exporting. However, e-commerce can help Indigenous firms mitigate these and other factors. Virtual sales were associated with 6 times higher odds of exporting.
The findings in this report emphasize the need to:
- Continue to promote exporting as a viable means of growing Indigenous economies in Canada and support Indigenous businesses that are already engaged in international markets to close the export gap.
- Consider the unique industry and size distribution of Indigenous SMEs when designing policies and programs.
- Work with Indigenous businesses and communities to establish meaningful market integration in countries indicated as regions of interest, leveraging existing trade agreements and programs.
- Better understand the unique needs of Indigenous businesses located in remote areas and in Indigenous communities.
- Learn from the successes of Indigenous women-owned SMEs and their prominence in the Indigenous export landscape.
Our goal is to widely communicate the findings of this research project so it can be used by Indigenous Peoples, businesses, communities, governments and by the broader business sector to develop tools, initiatives and policies that enable the full potential of Indigenous business in Canada.
Chapter 1: Introduction
Indigenous Peoples have a long and rich history of trade across Turtle Island.Footnote 5 Long before the arrival of European colonizers, Indigenous communities acquired goods and knowledge through extensive trade networks, especially those along coastal and mountainous interior regions.Footnote 6
These same networks were later used by both Indigenous Peoples and European settlers in the establishment of the fur trade — an intensely competitive trade that played a formative role in the creation and development of what is now known as Canada.Footnote 7
Throughout history, the relationship between Indigenous and settler economies has often been strained, with the forces of colonization and assimilation suppressing Indigenous economic and social vitality. This is why economic reconciliation is important for fostering mutually respectful relationships between Indigenous and settler societies and governments. It is critical to keep this historical backdrop and its ongoing ramifications in mind when working with Indigenous organizations, communities, and firms because, as this study shows, there is still much work to be done on the path to long-term economic reconciliation.
Entrepreneurship and trade continue to be important economic drivers for Indigenous communities across Turtle Island. Today, Indigenous entrepreneurs trade internationally from Canada’s provinces and territories across a wide range of industries. This dynamic economic activity is bringing wealth and economic empowerment to Indigenous communities.
However, important gaps remain and there are many opportunities for governments and communities to further support Indigenous entrepreneurs as they venture into globalized markets.
This report presents the findings from a large national Indigenous business survey to understand the exporting experiences of Indigenous businesses. It begins with a description of the project and data used, followed by a descriptive analysis of the survey results. We conclude with an econometric analysis that quantifies the extent to which various characteristics and activities are statistically associated with the likelihood of an Indigenous business to export. This strengthens our understanding of export drivers beyond simple correlations.
Increasing market access is an important step to closing the economic gaps between Indigenous Peoples and the non-Indigenous population in Canada. Economic analysis conducted by the National Indigenous Economic Development Board (2016) has shown that closing the gaps in economic outcomes (e.g., education and employment) would grow the Canadian economy by $27.7 billion annually.Footnote 8
Mainstream Canadian economics has not properly considered the unique circumstances of Indigenous businesses and how difficult it is for them to succeed in a market established for settler economies.Footnote 9 The focus on Indigenous businesses' capacity to export will ideally promote increased collaboration between governments and Indigenous businesses to create more mutually beneficial economic relationships.
This project works towards economic reconciliation and is part of the broader movement towards an equitable economy and society for Indigenous Peoples.
The research parallels and takes steps toward implementing the United Nations Declaration on the Rights of Indigenous Peoples (UNDRIP/UN Declaration).Footnote 10 Throughout its various articles, the UN Declaration acts as a constitution for good relations and governance with Indigenous Peoples, communities, and businesses. Specifically, articles 3, 20, 21, 32 and 36 are concerned with ensuring Indigenous Peoples have equal access to economic development, self-determination, freedom to pursue economic prosperity through international trade, and sustainability.
Ground-breaking documents like the UN Declaration offer a guide for properly promoting reconciliation, especially toward Indigenous economies. As governments and corporations move into the recovery phase of the COVID-19 pandemic, it is important to use data-driven findings and recommendations to continue championing the provisions set out in documents like the UN Declaration and progress towards a more inclusive and reciprocal economic relationship.
This project also supports the strengthened capacity of Indigenous entrepreneurs in accessing relevant data and insights, as emphasized in the National Indigenous Economic Strategy (NIES) for Canada 2022.Footnote 11
The Indigenous-led and driven NIES is designed to mobilize positive change, address long-standing inequities, and achieve inclusive growth for and with Indigenous communities by guiding governments, industry and institutions in their reconciliation work and collaboration in rebuilding Indigenous economies.
This work supports several NIES Calls to Economic Prosperity, including #28 on measuring Indigenous economic contributions, #74 on conducting Indigenous research, and #90 on research and action to stimulate Indigenous prosperity and helps to inform work related to Calls 102 to 107 that deal specifically with enhancing Indigenous international trade.
1.1 Project approach
The CCAB and GAC have partnered on this project to deepen our understanding of Indigenous exporting experiences and challenges. The goals are to improve policy and programming to help Indigenous businesses succeed internationally and ultimately support the equitable inclusion and participation of Indigenous Peoples in Canada’s shared prosperity.
With a focused national survey on exporting, complemented by community case studies, this project helps us better understand:
- The characteristics of Indigenous exporters (e.g., industries, size, location, gender of ownership, Indigenous identity)
- Firm behaviour (e.g., exporting, virtual sales)
- Export markets of interest
- Export challenges that Indigenous exporters experience
This is the second research project that GAC and CCAB have partnered on. The 2019 GAC-CCAB report, Indigenous-Owned Exporting Small and Medium Enterprises in Canada, investigated the export experiences of Indigenous businesses and provided an initial understanding of the characteristics and challenges of these exporters.Footnote 12
The findings from the 2019 report set the stage for this project, which examines these experiences in more depth with focused survey questions, a larger sample and an enhanced survey weighting approach, making it an improvement over the 2019 project.
According to one of the 2019 report’s main findings, approximately 24.4% of Indigenous SMEs were participating in exporting.Footnote 13 As impressive as this finding is, we feel this may have been an overstated outlook for several reasons.
The 2019 report was based on data collected in 2015 using CCAB’s internal Indigenous business list. These businesses were checked to be in operation, easily located, and well-established, with many having an online presence. Most importantly, these business owners had achieved a level of business acumen that may have made them more likely to be involved in exporting. As a result, the participating businesses may have been more likely to export than the average Indigenous firm, creating a selection bias problem in the research.
A second factor was the way the export question was positioned. The 2019 study asked respondents whether they had clients outside of Canada (without specifying a reference year), whereas this latest survey asked respondents whether they exported in 2020 specifically (to allow for more precise comparisons to the average SME in Canada).
Thirdly, an enhanced survey weighting technique was used in this latest iteration, fully maximizing the use of this larger sample size by weighting it according to region and industry.
Finally, the new research provides a more robust overview of the Indigenous economy in Canada with a larger sample size (2,603 Indigenous businesses compared to the 2019 sample of 1,101 businesses).
While the client database of Indigenous businesses from CCAB’s 2015 National Aboriginal Business Survey served as the foundation for the current sample frame, additional participants were recruited from community-based resources, such as business registries and other local directories, as well as through social media campaigns.
The methodology used in the current report allowed for a more complete assessment of the Indigenous economy by including businesses at the grassroots level, or in the early stages of their entrepreneurial journeys instead of focusing primarily on those found in government or more widely publicized directories.
A comparison of the research approaches for both papers can be found in section 1A of the appendix.
COVID-19 impacts
COVID-19 had enormous impacts on global trade in 2020. During the pandemic, borders were closed, international trade slowed, and supply chains that used to engage many Indigenous businesses collapsed.
Many Indigenous businesses went into “survival mode” and reoriented their business to stimulate local markets in lieu of the economic opportunity they were previously pursuing abroad.Footnote 14 The economic outlook for many of the businesses that participated in the most recent installation of our work with Indigenous SMEs more frequently included a focus on supporting the local economy than expanding their presence in export markets.
1.2 About the data
This CCAB-GAC project includes several components that attempt to capture as many Indigenous business voices as possible. It consists of an in-depth national survey of 2,603 Indigenous businesses in Canada and case studies in three Indigenous communities that include extensive community businesses surveys and interviews with Economic Development Officers.
Telephone interviews for the national survey were conducted between May 10 and September 22, 2021, and asked about experiences and business performance in 2020. There were 2,603 Indigenous-owned businesses that participated in the survey, including First Nations, Inuit and Métis business owners across Canada. The survey had an effective response rate of 26%.Footnote 15
This sample was drawn from CCAB’s Internal Business List of over 20,000 Indigenous-owned enterprises, which was enhanced as a part of this project through active community and social media recruitment and research. No further qualification was required to maximize survey participation beyond being a majority-owned Indigenous business.
The national survey questionnaire was designed by CCAB and GAC, with input from the Bank of Canada and support from Big River Analytics (BRA). The survey was conducted by Environics Research. The survey results are accurate within plus or minus 1.9 percentage points at the 95% confidence level. The margin of error is larger for subsample results (e.g., business size or type) than for the entire sample.
The national survey was weighted by BRA using a raking method. Raking adjusts the weights in an iterative process so that the weighted distributions for selected variables agree with population distributions for those same variables. (For more information on weighting, please see section 4A in the appendix).
The sample was weighted on several variables, including North American industry classifications, region, firm size and presence on or off an Indigenous community using the Canadian Business Register (Indigenous communities are First Nations census subdivisions as defined by Statistics Canada and all census subdivisions in Inuit Nunangat).Footnote 16 Footnote 17
Of the 2,603 participating businesses, almost two-thirds of the (unweighted) sample were SMEs with 1 to 499 employees (1,671 firms), one-third were businesses without employees (864 firms), 0.3% were large firms with 500 or more employees (7 firms), and the remaining 2.3% (61 firms) did not report how many employees their business had.
The survey sample size is quite large. While the total number of Indigenous businesses in Canada is unknown, Statistics Canada estimates that 11,900 Indigenous-owned businesses had employees in Canada in 2018.Footnote 18 Based on this estimate, the CCAB-GAC survey heard from more than 14% of the entire Indigenous-owned business population in Canada that have employees.

Alternative text:
Survey responses by firm size
| Firm size | Survey responses |
|---|---|
| SMEs | 1671 |
| Sole entrepreneurs (0 employees) | 864 |
| Large (500+ employees) | 7 |
| Unreported | 61 |
Source: Survey of Indigenous Firms, Global Affairs Canada & Canadian Council for Aboriginal Business, 2021.
| Firm size distribution of SMEs | # of firms |
|---|---|
| 1-4 employees | 519 |
| 5-19 employees | 735 |
| 20-99 employees | 356 |
| 100-499 employees | 61 |
Figure 1: Survey responses by firm size
Source: Survey of Indigenous Firms, Global Affairs Canada & Canadian Council for Aboriginal Business, 2021.
Most of the results reported in this paper are focused on the experiences of SMEs, consistent with the GAC-CCAB 2019 study and many of the business surveys undertaken by Statistics Canada and by international organizations, allowing for comparisons with the Canadian average.
The CCAB-GAC national Indigenous survey included 210 Indigenous exporting firms in total, of which 111 were SMEs.
Research ethics
The project follows best practices in research ethics, including the principles described in Chapter 9 of the Tri-Council Policy Statement on Research Involving the First Nations, Inuit and Métis Peoples of Canada.Footnote 19 Specifically, efforts were made to take into consideration different subgroups and recognize diverse interests, respect community customs, institute research agreements with communities, collaborate on the research and interpretation of the findings, and ensure that the research benefits Indigenous Peoples, communities and leaders as well as government policymakers and researchers.
Additionally, the joint work was guided by First Nations principles of data ownership, control, access and possession — more commonly known as OCAP.
The data used in this project are not owned or held by the government. GAC and Bank of Canada officials accessed the data for quantitative analysis through a secure online portal hosted by CCAB that had been stripped of identifying information.
The communities that participated in the community case studies (results will be published in a second report) retain control over their data, including who accesses it and how it is used; they can also review the results before they are published.
An Indigenous business and academic advisory committee was created for this project and advised on the work throughout each phase, including the questionnaire creation and interpretation of research results. This committee is comprised of Indigenous men and women of First Nation, Inuit and Métis identity.
Chapter 2: Indigenous Peoples and trade
Key messages
- Despite the advantages that international markets offer, Indigenous-owned SMEs export at lower rates compared to the average Canadian SME (7.2% vs. 12.1%).
- Indigenous-owned SMEs generally have a similar industry mix to the Canadian average, with some notable differences; Indigenous firms are comparatively more likely to be found in the arts, entertainment and recreation, accommodation and food services, information and cultural, mining and oil extraction, utilities, and public administration sectors and are notably less present in traditionally export-intensive wholesale and retail and transportation and warehousing industries. However, this differing industry mix alone does not appear to play a major role in the export gap.
- Indigenous SMEs tend to be larger than the Canadian average. While larger firms are more likely to export, this is not the case for Indigenous SMEs. Smaller Indigenous SMEs are more likely to export than larger firms, as evidenced by their higher export propensity.
- Geography plays a role in firms’ abilities to reach foreign markets. Indigenous SMEs located in remote areas are much less likely to export (2.6%) compared to urban-based firms (11.7%).
- Women are highly represented in the Indigenous entrepreneurship population. Some 39% of Indigenous SME are majority-owned by women compared to the Canadian average of less than 17%.
- Virtual sales are important for Indigenous exporters, with 80.3% of exporting firms having online sales compared to 27.5% of non-exporting Indigenous SMEs. Remotely located firms were a little more likely to offer virtual sales (34.2%) compared to Indigenous SMEs in urban areas (28.0%).
Indigenous entrepreneurs are underrepresented within Canada’s business population. While Indigenous Peoples account for 5.0% of Canada’s population (and growing), only around 1% to 1.5% of all SMEs in Canada were majority-owned by Indigenous Peoples in 2020.Footnote 20 Footnote 21
Drilling down to the exporting businesses, the Indigenous share drops further; only about 0.8% of Canada’s exporting SMEs are majority-owned by Indigenous Peoples.Footnote 22 Given that exporting firms can reap the benefits of an expanded customer base and increased economies of scale, it is important to better understand the factors that account for the lower representation of Indigenous entrepreneurs among Canada’s exporters.
Understanding the gaps in Indigenous entrepreneurship and exporting is still in the early stages. A wide variety of societal, economic, and other factors are likely driving these outcomes.
The focus of this section is to share the export experiences of Indigenous business owners as reported by the owners in the CCAB-GAC survey, including their characteristics and export markets.
Note that all the data reported in chapters 2 and 3 use the weighted data from the CCAB-GAC survey.
Key definitions
- Indigenous Peoples: People who identify as being First Nations, Métis and/or Inuit
- Indigenous majority-owned business: A firm is considered Indigenous majority-owned if Indigenous Peoples own 51% or more of the business
- Small and Medium Enterprises (SMEs): This paper defines SMEs as businesses that employ 1 to 499 people
- Exporter: Any firm that sells goods or services to customers, clients or partners outside of Canada
- Export propensity: The share of businesses that export expressed as a percentage of the total businesses. It is otherwise known as the likelihood of exportingFootnote 23
2.1 Likelihood of SMEs to export
Indigenous-owned SMEs are less likely to export than the average Canadian SME. In 2020, 7.2% of Indigenous SMEs exported goods or services, compared to the Canadian SME average of 12.1%. The various factors that contribute to this lower export propensity will be explored in greater depth throughout this report.Footnote 24

Alternative text:
Export propensity of Indigenous SMEs and all Canadian SMEs in 2020
| Firms | Export propensity (%) |
|---|---|
| Indigenous SMEs | 7.2 |
| All Canadian SMEs | 12.1 |
Figure 2: Export propensity of Indigenous SMEs and all Canadian SMEs in 2020
Source: Canadian Council for Aboriginal Business & Global Affairs Canada’s Survey of Indigenous Firms, 2021; Statistics Canada. Table 33-10-0449-01 Exports made by small and medium enterprises, 2022.
2.2 Industry concentrations and export experiences
Indigenous-owned SMEs are similar to all Canadian SMEs in terms of their industry breakdown: construction, retail trade, and professional, scientific and technical services are the top three industries for both Indigenous SMEs and average Canadian SMEs.


Alternative text:
Industry concentrations of Indigenous and all Canadian SMEs
| Industry | Indigenous SMEs (% of firms) | All Canadian SMEs (% of firms) |
|---|---|---|
| Construction | 13.2 | 12.1 |
| Retail trade | 12.8 | 11.8 |
| Professional, scientific and technical services | 12.0 | 12.2 |
| Other services (except public administration) | 10.9 | 9.2 |
| Accommodation and food services | 8.7 | 6.9 |
| Arts, entertainment and recreation | 5.0 | 1.6 |
| Health care and social assistance | 4.7 | 10.2 |
| Manufacturing | 4.3 | 4.2 |
| Transportation and warehousing | 4.2 | 5.9 |
| Agriculture, forestry, fishing, and hunting | 4.0 | 4.0 |
| Public administration | 3.4 | 0.7 |
| Information and cultural industries | 3.1 | 1.5 |
| Mining, quarrying and oil and gas extraction | 2.7 | 0.7 |
| Finance and insurance | 2.4 | 3.5 |
| Educational services | 2.1 | 1.2 |
| Utilities | 1.8 | 0.1 |
| Real estate and rental and leasing | 1.5 | 4.7 |
| Management of companies and enterprises | 1.4 | 0.5 |
| Administrative and support, waste management and remediation services | 1.3 | 4.4 |
| Wholesale trade | 0.6 | 4.6 |
Figure 3: Industry concentrations of Indigenous and all Canadian SMEs
Source: Canadian Council for Aboriginal Business & Global Affairs Canada’s Survey of Indigenous Firms, 2021; Table 33-10-0267-01 Canadian Business Counts, with employees, June 2020
Despite sharing the top three most represented industries, there are notable differences that set Indigenous SMEs apart from the average Canadian firm.
Indigenous SMEs are almost 3 times more concentrated in the arts, entertainment and recreation industry and twice as concentrated in the information and cultural industry compared to the Canadian SME average.
Natural resource industries (e.g., forestry, mining) also have higher concentrations of Indigenous-owned SMEs. Indigenous SMEs are also more concentrated in retail trade, as well as some service-based industries such as public administration, accommodation and food services, as well as “other” services.
Some of the industries where Indigenous SMEs are concentrated are less export intensive; for example, 1.8% of Indigenous firms are in the utilities industry compared to only 0.1% of all Canadian SMEs.
On the other hand, Indigenous SMEs are less concentrated in some of the industries that are known to be highly conducive to exporting. For example, only 0.6% of Indigenous SMEs are in wholesale trade compared to the Canadian average of 4.6%.
Transportation and warehousing accounts for 4.2% of Indigenous SMEs, which is 1.7 percentage points lower than the Canadian average. In some cases, there are high barriers to entry in these industries, which require businesses to overcome a myriad of administrative, economic, financial, and social challenges.
Industry composition alone does not explain the observed export gap. Notably, there are integral differences in the export propensities of Indigenous SMEs and the Canadian SME average at the industry level, which further explain the lower overall export propensity of Indigenous SMEs.

Alternative text:
Export propensities of Indigenous and all Canadian SMEs at the industry level
| Industry | Export propensity of Indigenous SMEs | Export propensity of all Canadian SMEs |
|---|---|---|
| Manufacturing | 55.0 | 38 |
| Wholesale trade | 15.5 | 28.1 |
| Transportation and warehousing | 4.4 | 26.7 |
| Professional, scientific and technical services | 7.1 | 20.6 |
| Resource-based industries** | 3.9 | 10.7 |
| Retail trade | 11.7 | 10.5 |
| Other industries* | 8.3 | 6.8 |
| Accommodation and food services | 2.1 | 3.9 |
| Other services | 0.8 | 3 |
| Construction | 0 | 1.1 |
Figure 4: Export propensities of Indigenous and all Canadian SMEs at the industry level
Notes:* The “Other industries” grouping includes the following industries: information and cultural industries; real estate and rental and leasing; administrative and support; waste management and remediation services; health care and social assistance; and arts, entertainment and recreation.
** Resource-based industries include agriculture, forestry, fishing and hunting as well as mining and oil and gas extraction.
Source: Canadian Council for Aboriginal Business & Global Affairs Canada’s Survey of Indigenous Firms, 2021; Statistics Canada. Table 33-10-0449-01 Exports made by small and medium enterprises, 2022.
In many industries, Indigenous SMEs are less likely to export compared to the Canadian average. Wholesale, transportation and warehousing, resource-based industries, professional services, accommodation and food, and other services are some examples of industries where Indigenous SMEs have a lower export propensity than the Canadian industry averages.
Indigenous firms in these sectors may instead be serving local economies, or they may be serving larger firms that export, which still makes them an important part of Canada’s international landscape (e.g., SMEs that provide services to forestry or mining companies that export abroad). Moreover, even though they do not export directly, these firms are still impacted by external factors such as commodity price swings and international investment.
While this makes Indigenous firms more vulnerable to market shocks, it also allows them to benefit from international trade indirectly. This situation also points to the importance of subcontracting requirements for Indigenous businesses involved in these supply chains and procurement opportunities of large exporting firms and multinationals.
A notable exception is manufacturing, where Indigenous SMEs are 1.4 times more likely to export; retail trade is another industry with a slightly higher export propensity among Indigenous SMEs (11.7% vs. 10.5%).
Differences in industry composition and industry export propensity partially explain the discrepancy between the overall export propensities of Indigenous SMEs and the Canadian average. If Indigenous SMEs had the same industry concentrations as the average Canadian SME, overall Indigenous SME export propensity would be only slightly higher, at 8.3% compared to the 7.2% we currently observe. This means that more of the export gap is explained by differing export behaviours for SMEs in the same industry and less by the different industry mix.

Alternative text:
Scenario: If Indigenous firms had same industry mix as Canadian average
| Scenario | Percent |
|---|---|
| Indigenous SMEs | 7.2 |
| Indigenous export propensity using average Canadian industry distributions | 8.3 |
| All Canadian SMEs | 12.1 |
Figure 5: Scenario: If Indigenous firms had same industry mix as Canadian average
Source: Canadian Council for Aboriginal Business & Global Affairs Canada’s Survey of Indigenous Firms, 2021; Statistics Canada. Table 33-10-0449-01 Exports made by small and medium enterprises, 2022; Statics Canada Table 33-10-0267-01 Canadian Business Counts, with employees, June 2020. Authors’ calculations.
2.3 Firm size
Indigenous SMEs tend to be somewhat larger than the Canadian average. Notably, Indigenous SMEs are 1.8x more represented in the 100 to 499 employee firm size grouping (considered “medium sized”) than Canadian SMEs on average and have a lower concentration in firms with 1 to 4 employees.

Alternative text:
Distribution of firm sizes for all Canadian SMEs and Indigenous SMEs
| Firm size | Indigenous SMEs (% of firms) | All Canadian SMEs (% of firms) |
|---|---|---|
| 100 to 499 employees | 3.3 | 1.8 |
| 20 to 99 employees | 14.9 | 10.9 |
| 5 to 19 employees | 31.2 | 30.2 |
| 1 to 4 employees | 50.5 | 57.1 |
Figure 6: Distribution of firm sizes for all Canadian SMEs and Indigenous SMEs
Source: Survey of Indigenous Firms, Global Affairs Canada & Canadian Council for Aboriginal Business, 2021; Statistics Canada. Table 33-10-0267-01 Canadian Business Counts, with employees, June 2020
The likelihood of an Indigenous firm exporting tends to be higher among smaller SMEs. This finding stands in direct contrast to both economic theory and the experiences of the average Canadian SME.
Exporting comes with inherent fixed costs, ranging from logistical to market research to completing customs declarations. These costs are generally more easily borne by larger SMEs who can sell larger volumes of goods and services abroad. Therefore, it is striking to see such a strong tendency for export propensity to be higher among smaller Indigenous SMEs.

Alternative text:
Export propensity by firm size, Indigenous SMEs and all Canadian SMEs
| Firm size | Export propensity of Indigenous firms (%) | Export propensity of all Canadian firms (%) |
|---|---|---|
| 100 to 499 employees | 5.4 | 36.1 |
| 20 to 99 employees | 3.2 | 17 |
| 5 to 19 employees | 7.2 | 11.7 |
| 1 to 4 employees | 8.5 | 10.7 |
Figure 7: Export propensity by firm size, Indigenous SMEs and all Canadian SMEs
Source: Survey of Indigenous Firms, Global Affairs Canada & Canadian Council for Aboriginal Business, 2021; Statistics Canada. Table 33-10-0449-01 Exports made by small and medium enterprises, 2022.
2.4 Geography
Geography can play a big role in a firm’s exporting ability. Being physically close to borders and ports, having the ability to access transportation infrastructure such as rail and highways, and possessing technical infrastructure such as stable and high-quality internet connections can be critical for exporting firms.
Moreover, urban centres can allow businesses to tap into larger labour pools. While remote firms may face some lower costs (e.g., property), they pay a premium to access distant markets, which can limit their economic activity.Footnote 25
Remoteness
The more remote a business location, the more difficult it can be for that business to export. Using Statistics Canada’s Index of Remoteness, we created groupings of remoteness for the Indigenous businesses in our survey by linking business postal codes to census subdivisions.Footnote 26
The Index of Remoteness provides a value between 0 (least remote) to 1 (most remote) for each census subdivision, which is determined by the distance from population centres and the population size of these centres.
We grouped Indigenous businesses into 3 categories of remoteness (with corresponding ranges in the remoteness index values):
- Urban (0-0.15): for example, Toronto, Vancouver, Edmonton, Winnipeg
- Semi-connected (0.15-0.4): for example, Belleville, Thunder Bay, Whitehorse, Nanaimo
- Remote (0.4-1.0): for example, Igloolik, Yellowknife, Iqaluit, Arctic Bay
The businesses in urban and semi-connected areas have access to larger labour markets compared to those in remote areas. These businesses are generally located closer to the Canada-U.S. border and/or substantial transportation infrastructure, making it easier to export.
Unsurprisingly, Indigenous SME exporters are much more likely to be in urban and semi-connected regions, with only 11.6% of exporters being in remote areas. Comparatively, Indigenous non-exporters are more evenly distributed across different areas, with more than one-third located in remote regions.
As such, export propensities are much higher for urban-based Indigenous SMEs (11.7%) relative to Indigenous SMEs in semi-connected regions (8.2%) and remote areas where only 2.6% of Indigenous SMEs export. (A comparative distribution for the Canadian SME average is not available.)

Alternative text:
Indigenous SME distribution across different areas
| Remoteness status | Exporters (%) | Non-exporters (%) |
|---|---|---|
| Urban | 40.5 | 24.0 |
| Semi-connected | 47.9 | 42.0 |
| Remote | 11.6 | 34.0 |
Figure 8: Indigenous SME distribution across different areas
Source: Survey of Indigenous Firms, Global Affairs Canada & Canadian Council for Aboriginal Business, 2021.
The role of Indigenous communities in export activity
Around 750,000 Indigenous Peoples in Canada live on a First Nations reserve, a Métis community, or a community in Inuit Nunangat. These Indigenous communities have an average population of 407 people.Footnote 27
The CCAB-GAC survey found that 56.9% of Indigenous SMEs are in Indigenous communities. Almost 43% of these community-based businesses are also located in remote areas, while only around 17% of the community-based businesses are in urban areas.

Alternative text:
Breakdown of Indigenous SMEs by location within Indigenous community and remoteness
| Location | Percent (%) |
|---|---|
| Outside Indigenous community | 43.1 |
Within Indigenous community | 56.9 |
Figure 9: Breakdown of Indigenous SMEs by location within Indigenous community and remoteness
Source: Survey of Indigenous Firms, Global Affairs Canada & Canadian Council for Aboriginal Business, 2021.
Indigenous SMEs located in Indigenous communities are less likely to export (3.9%) compared to those living outside of Indigenous communities (11.7%). Nearly 81% of the firms located within Indigenous communities identify as being First Nations owned. Thus, a significant portion of the community-based firms in our study could be impacted by on-reserve legislation such as the Indian Act.
On-reserve property rights have been subject to the provisions of the Indian Act, which have limited land management and ownership rights for First Nations Peoples. While there have been some policies and government-to-government agreements to progressively transfer some semblance of land management responsibility back to First Nations, much work remains .Footnote 28,Footnote 29
By default, the federal government oversees land and natural resources administration on reserves, which interferes with Indigenous ownership and rights on traditional lands. This situation has created governance challenges, including gaps in infrastructure, investments, service delivery, and development strategies and uncoordinated or inconsistent federal-provincial engagement with communities on environmental licencing, to name a few.Footnote 30 The Indian Act has, and continues to, limit the capacity of Indigenous businesses by hindering economic participation.Footnote 31, Footnote 32
Another aspect that affects the business operations of firms in Indigenous communities is the existence of infrastructure gaps.Footnote 33 According to a report by the Canadian Council for Public-Private Partnerships, the infrastructure gap for First Nations communities is estimated to be around $30 billion.Footnote 34
Furthermore, a recent study by Statistics Canada and Indigenous Services Canada finds that Indigenous census subdivisions have, on average, lower broadband availability compared to non-Indigenous census subdivisions in Canada.Footnote 35
A 2020 study by the Organization for Economic Cooperation and Development (OECD) reported that many of the businesses located in these communities had a strong social licence to operate, largely because many of the land rights (including hunting, fishing, territorial land, etc.) are held by the community, and not individuals. Therefore, operations that draw on these resources must be either communal (e.g., cooperatives or economic development corporations) or have the blessing of the community to do business.
Enterprises located in Indigenous communities often demonstrate a commitment to financial, social, environmental, and cultural goals, with mandates that go beyond profits.Footnote 36 As such, they may operate differently compared to businesses outside of Indigenous communities. In our study, we find that 42.3% of the firms in Indigenous communities are owned by a First Nations band or Indigenous community, which may influence the intended outcomes of the business.
Provincial distributions
Nearly two-thirds of all Indigenous SMEs are in the provinces of British Columbia (26.0%), Ontario (22.5%), and Québec (16.2%). Indigenous SMEs have higher representation in the Western provinces (apart from Alberta), the three territories, and Newfoundland and Labrador, and are less represented in Ontario, Quebec, and the Maritime provinces relative to the Canadian average.

Alternative text:
Provincial and territorial concentrations of Indigenous and all Canadian SMEs
| Province or territory | Indigenous SMEs (% of firms) | All Canadian SMEs (% of firms) |
|---|---|---|
| British Columbia | 26 | 15.7 |
| Ontario | 22.5 | 37 |
| Québec | 16.2 | 20.6 |
| Alberta | 9.6 | 13.3 |
| Manitoba | 8 | 3.3 |
| Saskatchewan | 5.1 | 3.3 |
| Nunavut | 3.9 | 0.1 |
| Newfoundland & Labrador | 3.2 | 1.5 |
| Nova Scotia | 1.9 | 2.4 |
| New Brunswick | 1.8 | 2 |
| Northwest Territories | 1.2 | 0.1 |
| Yukon | 0.3 | 0.2 |
| Prince Edward Island | 0.3 | 0.5 |
Figure 10: Provincial and territorial concentrations of Indigenous and all Canadian SMEs
Source: Survey of Indigenous Firms, Global Affairs Canada & Canadian Council for Aboriginal Business, 2021; Statistics Canada. Table 33-10-0267-01 Canadian Business Counts, with employees, June 2020.
When it comes to export propensity at the provincial level, Indigenous SMEs in Ontario had the highest export propensity (12.6%), followed by Nova Scotia (8.9%) and Alberta (7.0%).Footnote 37
A notable difference exists in the export propensity of British Columbia and the territories: the export propensity for Indigenous SMEs located in that region was only 7.0%, compared to 14.6% for all Canadian SMEs.

Alternative text:
Export propensities at the regional level, Indigenous and all Canadian SMEs
| Region | Export propensity of Indigenous SMEs (%) | Export propensity of all Canadian SMEs (%) |
|---|---|---|
| Ontario region | 12.6 | 14.6 |
| British Columbia and territories region | 7.0 | 14.6 |
| Prairies region | 6.1 | 8.8 |
| Quebec region | 5.4 | 9.7 |
| Atlantic region | 4.4 | 8.4 |
Figure 11: Export propensities at the regional level, Indigenous and all Canadian SMEs
Source: Survey of Indigenous Firms, Global Affairs Canada & Canadian Council for Aboriginal Business, 2021; Statistics Canada. Table 33-10-0449-01 Exports made by small and medium enterprises, 2022
2.5 Ownership characteristics: gender and Indigenous identity
The experiences of Indigenous SMEs are not uniform across owner characteristics. In this section, we will delve into how exporting differs among Indigenous SMEs with varying ownership characteristics, particularly Indigenous identity and gender.
First Nations are the most populous Indigenous group in Canada, followed by Métis and Inuit.Footnote 38 There is much diversity among Indigenous Peoples in Canada, including within First Nations, Métis, and Inuit identities. These include different histories, languages, systems of governance, economies and cultures. As an example, there are over 60 unique Indigenous languages spoken in Canada.Footnote 39 Therefore, where possible and applicable, it is important to understand these nuances as a means of better informing interactions, research/policy initiatives, and relationship development with Indigenous Peoples and the communities they inhabit. This research heard from Indigenous Peoples across what is now known as Canada and attempted to capture different experiences. However, results are reported from a high-level.
When it comes to Indigenous exporters, the First Nations are also the most represented group. Over half of all exporting SMEs are First Nations-owned, 40% are Métis and a small but important 8% of exporting Indigenous SMEs are Inuit-owned.

Alternative text:
Indigenous identities of SME exporters
| Indigenous identity | Percent (%) |
|---|---|
| First Nations | 52 |
| Métis | 40 |
| Inuit | 8 |
Figure 12: Indigenous identities of SME exporters
Source: Survey of Indigenous Firms, Global Affairs Canada & Canadian Council for Aboriginal Business, 2021.
In terms of export propensities, Métis-owned SMEs top the chart with an export propensity of 15.1%, followed by Inuit (6.9%), and then First Nations-owned SMEs (5.2%).

Alternative text:
Export status by Indigenous identity of ownership for Indigenous SMEs
| Indigenous identity of ownership | Non-exporter (%) | Exporter (%) |
|---|---|---|
| First Nations | 94.8 | 5.2 |
| Inuit | 93.1 | 6.9 |
| Métis | 84.9 | 15.1 |
Figure 13: Export status by Indigenous identity of ownership for Indigenous SMEs
Source: Survey of Indigenous Firms, Global Affairs Canada & Canadian Council for Aboriginal Business, 2021.
With an export propensity of 15.1%, Métis-owned SMEs export at more than twice the rates of the Indigenous SME average. The geographic locations of Métis-owned SMEs could play a role in this as they are less likely to be in remote areas (22.3%) and Indigenous communities (less than one-quarter). Industry composition is also important, as there is a larger concentration in the manufacturing industry.
Nearly two-thirds of First Nations-owned SMEs are located within Indigenous communities, and almost 30% are in remote areas. Thus, while First Nations-owned SMEs are prominent in industries with high export propensities like retail trade and professional services, the costs of exporting could be more prohibitive due to remoteness and other barriers associated with operating on reserve.
Inuit-owned SMEs offer a unique exception to the trends observed in exporting by geographic location. The percentage of Inuit-owned SMEs located within Indigenous communities is almost 80%, which is the highest of all Indigenous groups. Moreover, almost 85% of Inuit-owned SMEs are in remote areas. Yet, the export propensity of Inuit SMEs is 1.7 percentage points higher than the export propensity of First Nations-owned SMEs.
Industry concentration helps contextualize this observation; a significant share of Inuit-owned SMEs are in the professional services industry, which has a higher export propensity. This observation may also be contextualised by the fact that Inuit have never been subject to the Indian Act and, as such, have not had to navigate the barriers that First Nations experience when operating businesses in their communities, such as on-reserve property rights. The small population and limited market of Inuit communities may also necessitate exporting to sustain business operations and growth.
Indigenous women
Indigenous women play an integral role in shaping the Canadian entrepreneurship landscape. A 2020 study by the Atlantic Aboriginal Economic Development and Integrated Research Program found that Indigenous women are starting businesses at twice the rate of Canadian women.Footnote 40
The data in our study further showcases the prevalence of Indigenous women in the economy: 39% of Indigenous SMEs identify as being majority women owned. This is a stark contrast to the fact that less than 17% of all Canadian SMEs are majority owned by women.
The number of Indigenous women-owned businesses in the Canadian economy continues to climb. According to a Statistics Canada study, from 2005 to 2018, the number of women-owned Indigenous businesses had grown an average of 3.3% and outpaced the growth rate of men-owned Indigenous businesses by 1.5 times.Footnote 41
Not only are majority women-owned Indigenous SMEs major players in the domestic economy, but they are also significant contributors to Canada’s international business activities. In 2020, 39.3% of all exporting Indigenous SMEs were majority women-owned SMEs. That is 24.8 percentage points more than the Canadian average.
Majority men-owned SMEs still represented most exporting Indigenous SMEs (48.0%), while equal-ownership SMEs represented the smallest percentage of exporters (12.6%).

Alternative text:
Dominant gender of firm ownership for Indigenous and all Canadian SME exporters
| Gender of ownership | Indigenous SME exporters (% of firms) | All Canadian SME exporters (% of firms) |
|---|---|---|
| Majority women-owned | 39.3 | 14.5 |
| Equal ownership | 12.6 | 14.5 |
| Majority men-owned | 48.0 | 70.9 |
Figure 14: Dominant gender of firm ownership for Indigenous and all Canadian SME exporters
Source: Survey of Indigenous Firms, Global Affairs Canada & Canadian Council for Aboriginal Business, 2021; Statistics Canada. Table 33-10-0459-01 Ownership characteristics of small and medium enterprises.
Women-owned Indigenous SMEs are concentrated in industries with high export potential.Footnote 42 Previous studies have found that the most common types of businesses owned by Indigenous women are in arts and retail-related industries.Footnote 43 Our study finds that almost 1 in 5 majority women-owned SMEs are in the professional services industry, while retail trade (14.9%) and arts, entertainment and recreation (7.0%) remained important industries for majority women-owned SMEs.
2.6 Virtual sales
Digitization has been a pivotal force in empowering SMEs to reach international markets. Previous studies have shown that there are over 9 times the amount of Canadian small business exporters that are technology-enabled compared to SMEs that are not.Footnote 44
Like other Canadian SMEs, Indigenous SMEs have innovated and embraced online platforms to expand their sales. For exporting Indigenous SMEs, digital platforms are a much more integral component in their business strategy: 80.3% of exporting SMEs report having online sales compared to just 27.5% of non-exporting SMEs.
The disparity in the use of online sales between exporters and non-exporters is unsurprising, as digitization is a key factor that allows SMEs to overcome geographical barriers to reach international clientele. Especially for remote SMEs, e-commerce platforms can open a world of new markets that expand past the local region where the firm is located. We see this in the digital behaviour of Indigenous SMEs, with remote-based firms being a little more likely to utilize virtual sales (34.2%) compared to the share of urban Indigenous SMEs’ use of virtual sales (28.0%).
However, firms located within Indigenous communities tend to have a much lower likelihood of using virtual sales. Only 23.9% of firms located within Indigenous communities offer virtual sales, compared to 41.6% of firms outside of Indigenous communities.

Alternative text:
Use of online sales by export status for Indigenous SMEs
| Online sales for SMEs | Exporters (% of firms) | Non-exporters (% of firms) |
|---|---|---|
| Online sales | 80.3 | 27.5 |
| No online sales | 19.7 | 72.5 |
Figure 15: Use of online sales by export status for Indigenous SMEs
Source: Survey of Indigenous Firms, Global Affairs Canada & Canadian Council for Aboriginal Business, 2021.
Indigenous SMEs in remote communities may face infrastructure barriers that hamper their ability to participate in the digital economy. Canada faces a national connectivity gap where rural and remote communities lack access to high-speed, affordable internet.
The connectivity gap is also pronounced within First Nations reserves. In 2019, only 34.8% of households in First Nations reserves had access to 50 Mbps download and 10 Mbps (50/10) upload unlimited internet coverage — the minimum internet speed required for regular internet use according to the Canadian Radio-television and Telecommunications Commission.Footnote 45 In more remote parts of Canada, the connectivity gap is even more staggering. 0% of residents in Nunavut, Yukon and the Northwest Territories had access to 50/10 unlimited internet in 2019.Footnote 46
Chapter 3: Destination markets and expansion plans
Key messages
- While the U.S. is the market of choice for most Canadian exporters, Indigenous and non-Indigenous alike, Indigenous exporters tend to be slightly more interested in Oceanic destinations (e.g. Australia and New Zealand) relative to the Canadian average.
- More than 60% of Indigenous SME exporters report plans to expand their international markets, particularly those in the manufacturing, retail trade, and arts, entertainment and recreational industries.
- Indigenous SMEs who do not currently export are 4 times more likely to report plans to start exporting (16.3%) compared to the average Canadian SME (3.8%). Again, many of the target markets are similar (e.g. U.S., United Kingdom), but there was higher interest in Oceanic destinations.
- Almost one-quarter of non-exporting Indigenous SMEs sell products and services to other provinces. In theory, these products and services could be exported but are not due to lack of interest or the presence of challenges or barriers; about 30% of these firms expressed plans to expand internationally.
3.1 Destination markets
Indigenous SMEs export to markets all over the world. The U.S. was the most popular export destination with over 90% of Indigenous exporters reporting selling goods or services there (this is similar to the Canadian average with 83.7% of all Canadian SMEs exporting there in 2020).Footnote 47
This strong Indigenous focus on the U.S. market was featured in our 2019 report and may reflect historical and Indigenous-to-Indigenous links in addition to the fact that it is a large market right at our doorstep. Footnote 48 There are more than 7 million Indigenous Peoples in the U.S., accounting for around 2% of the American population.Footnote 49 ,Footnote 50,Footnote 51 Many of these groups share ethnic, language, and cultural ties with Indigenous Peoples in Canada, simply divided by an international border.
The United Kingdom was the second most popular destination, with 21.5% of respondents exporting goods or services there, followed by Australia (16.1%), France (14.0%) and Germany (10.1%).

Alternative text:
Top 12 destination markets for Indigenous SME exporters
| Country | Indigenous SME exporters (% of firms) |
|---|---|
| United States | 90.5 |
| United Kingdom | 21.5 |
| Australia | 16.1 |
| France | 14.0 |
| Germany | 10.1 |
| Japan | 4.9 |
| Europe (other or unspecified) | 4.7 |
| Switzerland | 4.7 |
| China | 2.7 |
| Belgium | 2.7 |
| Spain | 2.3 |
| Other | 18.8 |
Figure 16: Top 12 destination markets for Indigenous SME exporters
Source: Survey of Indigenous Firms, Global Affairs Canada & Canadian Council for Aboriginal Businesses, 2021
Note: This was an open-ended survey question and respondents could name as many destinations as they choose.
One notable divergence between the top export markets for Indigenous and average Canadian SMEs is that Australia is a destination market of greater interest to Indigenous exporters, possibly due to placing a high value on Indigenous products or a shared interest in supporting Indigenous businesses.
Australia is an especially popular destination for Indigenous SMEs engaged in the arts, entertainment and recreation, retail trade, and professional, scientific and technical services industries. Oceanic markets like Australia and Aotearoa (modern-day New Zealand) have large Indigenous populations. As of the last Australian national census in 2021, there were 984,000 Aboriginal and Torres Strait Islander people, representing 3.8% of the total Australian population, while Māori accounted for 16.5% of Aotearoa’s population in the 2018 census.Footnote 52 Footnote 53 These countries are also focused on supporting Indigenous economies and businesses (see text box on the Indigenous Peoples Economic and Trade Cooperation Arrangement).
A lower share of Indigenous SMEs report exporting to Mexico, despite the preferential trade relations granted through the Canada, U.S., and Mexico (CUSMA) free trade agreement and locational advantages of being a continental trading partner.
Canada’s objectives for CUSMA were informed by an Indigenous working group with considerations for Indigenous Peoples embedded within multiple sections of the agreement, including a provision under which handcrafted Indigenous textile and apparel goods are eligible for duty-free treatment (a first for Canada’s FTAs). Footnote 54 However, while 6.4% of all Canadian SMEs report exporting to Mexico, only 1.1% of Indigenous SMEs listed Mexico as a destination market. This is an opportunity to support Indigenous exporters in exploring opportunities in Mexico.
3.2 Export expansion plans
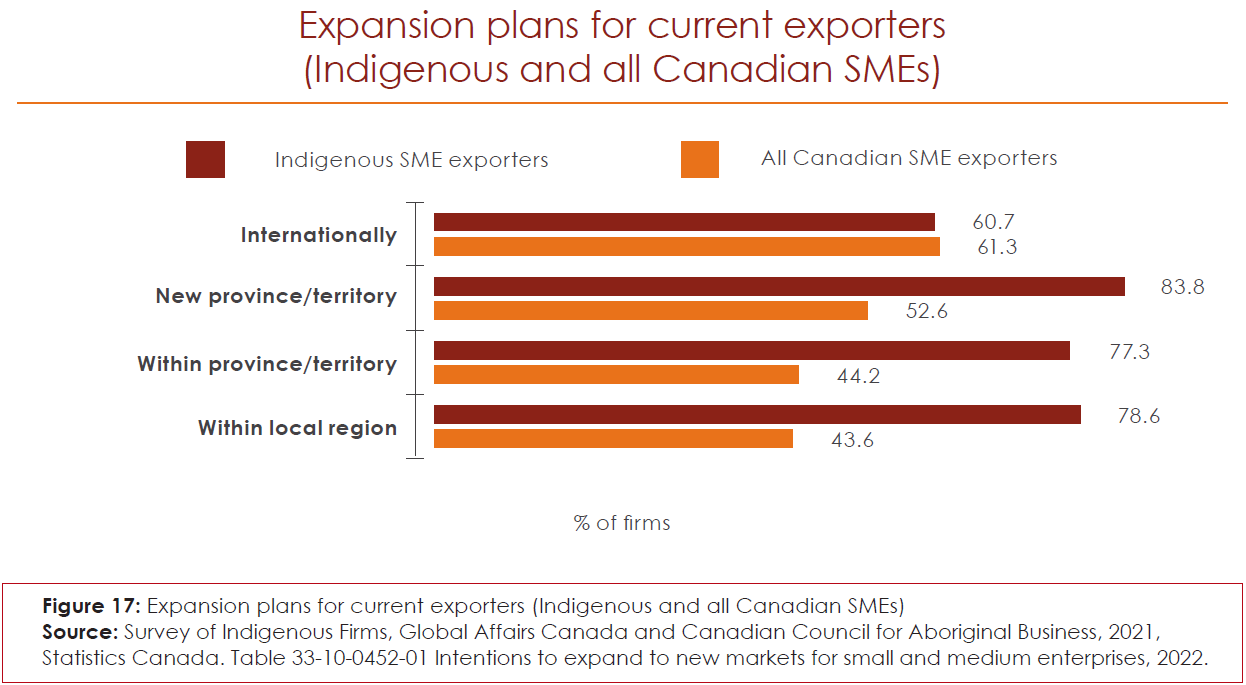
A significant percentage of SMEs in our survey express plans to expand their business both domestically and internationally. When it comes to reaching new international markets, the Indigenous exporters we surveyed report expansion plans at a similar rate to the average exporting Canadian SME. Notably, 61% of Indigenous exporters indicate plans to further expand internationally, similar to the Canadian average. The Indigenous SMEs that we surveyed who are already exporting are significantly more comfortable with expanding to new markets within Canada compared to the average Canadian exporter.
With 83.8% of Indigenous exporters reporting inter-provincial or inter-territorial expansion plans, current Indigenous exporters are especially keen on reaching new provinces or territories.
Alternative text:
Expansion plans for current exporters (Indigenous and all Canadian SMEs)
| Location of expansion | Indigenous SME exporters(% of firms) | All Canadian SMEs (% of firms) |
|---|---|---|
| Internationally | 60.7 | 61.3 |
| New province/territory | 83.8 | 52.6 |
| Within province/territory | 77.3 | 44.2 |
| Within local region | 78.6 | 43.6 |
Figure 17: Expansion plans for current exporters (Indigenous and all Canadian SMEs)
Source: Survey of Indigenous Firms, Global Affairs Canada & Canadian Council for Aboriginal Business, 2021, Statistics Canada. Table 33-10-0452-01 Intentions to expand to new markets for small and medium enterprises, 2022.
Prominent industries for Indigenous exporters that intend to reach new international markets are:
- manufacturing (27.7%)
- retail trade (23.6%)
- arts, entertainment and recreation (11.6%)
The Indigenous SMEs surveyed that currently export in these industries are especially oriented towards reaching new customers in untapped international markets.
Indigenous SME exporters were also asked which markets they are targeting in their international expansion plans.
The U.S. (88.4%) proved to be the most popular destination. Manufacturing, retail trade, arts, entertainment and recreation, as well as professional services, were key industries for this demographic. The United Kingdom was the second most popular market of interest among Indigenous exporters (20.2% of respondents), followed by Germany (18.6%) and Australia (16.1%).
The top international markets of interest are similar for both Indigenous exporters and the average Canadian exporter, as the U.S., Europe and the United Kingdom also make up the top target markets for international expansion plans for the average exporting Canadian SME.Footnote 55 However, Australia stands out once again as a market that is uniquely of focus to Indigenous exporters.

Alternative text:
Top intended markets for current Indigenous exporters (SMEs)
| Country | Indigenous SME exporters who intend to expand (%) |
|---|---|
| United States | 88.4 |
| United Kingdom | 20.2 |
| Germany | 18.6 |
| Australia | 16.1 |
| France | 12.2 |
| Switzerland | 8.5 |
| Spain | 7.9 |
| Europe (other or unspecified) | 7.4 |
| Japan | 6.5 |
| Sweden | 5.8 |
| China | 3.8 |
| Mexico | 3.4 |
| Brazil | 2.6 |
| Italy | 1.8 |
| Columbia | 1.8 |
| New Zealand | 1.8 |
| Other or unspecified | 19.1 |
Figure 18: Top intended markets for current Indigenous exporters (SMEs)
Source: Survey of Indigenous Firms, Global Affairs Canada & Canadian Council for Aboriginal Business, 2021.
Note: This was an open-ended survey question and respondents could name as many destinations as they choose.
Our survey shows that Indigenous SMEs who do not currently export are 4 times more likely to report plans to start exporting (16.3%) compared to the average Canadian SME (3.8%).
Indigenous non-exporting SMEs are also more interested in domestic expansion than the average Canadian SMEs. A higher percentage of non-exporting Indigenous SMEs intend to expand within and outside their province or territory (34.5%) compared to the Canadian average SME (12.2%).

Alternative text:
Expansion plans for current non-exporters (Indigenous and all Canadian SMEs)
| Expansion plans | Non-exporting Indigenous SMEs (% of firms) | Non-exporting Canadian SMEs (% of firms) |
|---|---|---|
| Internationally | 16.3 | 3.8 |
| New province/territory | 34.5 | 12.2 |
| Within province/territory | 46.1 | 25.7 |
| Within local region | 60.9 | 64.9 |
Figure 19: Expansion plans for current non-exporters (Indigenous and all Canadian SMEs)
Source: Survey of Indigenous Firms, Global Affairs Canada & Canadian Council for Aboriginal Business, 2021, Statistics Canada. Table 33-10-0452-01 Intentions to expand to new markets for small and medium enterprises, 2022.
The top three industries for Indigenous SMEs that currently do not export but plan to start are:
- accommodation and food services (17.6%)
- professional, scientific and technical services (17.4%)
- arts, entertainment and recreation (13.2%)
Despite being an industry with high export potential, very few non-exporting Indigenous SMEs in manufacturing indicate an interest in starting to export — of all the current non-exporting SMEs that indicate plans to start exporting, only 2.6% were in manufacturing.
On the other hand, for current non-exporting Indigenous SMEs that do not plan to export, the largest percentages are construction firms (17.3%) and firms in retail trade (13.1%), the latter being unexpected given the high export propensity of the industry. The export challenges facing firms will be explored in greater depth in a second report.
The U.S. is the most popular market for Indigenous SMEs planning to start exporting, followed by Germany, the United Kingdom, France and Europe (unspecified markets). These are in line with the target markets named among the average non-exporting Canadian SME.Footnote 56
However, unlike the average Canadian SME, Australia is also a significantly more popular target market for Indigenous SMEs that wish to start exporting. 18.8% of respondents listed Australia as an intended destination market. New Zealand also appeared in the top 10 target markets, with 9.6% of firms reporting interest in expanding there.

Alternative text:
Top intended markets for current Indigenous non-exporters (SMEs)
| Country | Indigenous SME non-exporters who intend to expand internationally (%) |
|---|---|
| United States | 80.8 |
| Germany | 26.3 |
| United Kingdom | 20.9 |
| France | 19.2 |
| Europe (other or unspecified) | 19.1 |
| Australia | 18.8 |
| Mexico | 11.4 |
| China | 10.4 |
| New Zealand | 9.6 |
| Asia (other or unspecified) | 4.5 |
| Japan | 4.4 |
| Sweden | 4.0 |
| Belgium | 3.2 |
| Africa (other or unspecified) | 2.4 |
| Other or unspecified | 13.1 |
Figure 20: Top intended markets for current Indigenous non-exporters (SMEs)
Source: Survey of Indigenous Firms, Global Affairs Canada & Canadian Council for Aboriginal Business, 2021.
Note: This was an open-ended survey question and respondents could name as many destinations as they choose.
In theory, if an SME can sell products and services across Canada, it should be well-positioned to further expand and reach international markets. These potential exporters represent 24.8% of all non-exporting Indigenous SMEs in our study and are represented across industries that are conducive to exporting. Notably, nearly 21% of these Indigenous “potential exporters” are in the professional services industry and 16.1% are in retail trade. Almost 30% of these “potential exporter” firms report plans to export.
Special feature: firms without employees
Our report has focused on SMEs, or “employer businesses.” Also of interest, however, are firms without employees, or “solo entrepreneurs.” These firms can consist of entrepreneurs, consultants, and self-employed individuals and represent a key component of Canada’s business landscape.
In our survey, over a third of all Indigenous firms report having no employees. Of the solo entrepreneurs surveyed, a sizeable 11.6% report exporting in 2020.Footnote 57 This is over 1.6 times as large as the export propensity of the Indigenous SMEs in our survey.
Industry mix
Indigenous solo entrepreneurs are heavily concentrated in the professional services industry. Almost a quarter of all firms with no employees are in this industry. In contrast, only 12% of Indigenous SMEs report being in the professional services industry. This industry, in which human capital is a major input, lends itself well to smaller firms as it is more reliant on intangible knowledge and skills rather than scalability and mass production.
They are also less reliant on physical modes of transport to facilitate trade compared to goods-based industries. Thus, the ability to transfer knowledge across borders, including through digital modes, enables firms in this industry to export their services.


Alternative text:
Industry breakdown of Indigenous SMEs and solo Indigenous entrepreneurs
| Industry | Solo Indigenous entrepreneurs (%) | Indigenous SMEs (%) |
|---|---|---|
| Construction | 10.6 | 13.2 |
| Retail trade | 7.5 | 12.8 |
| Professional, scientific and technical services | 24.2 | 12.0 |
| Other services (except public administration) | 5.3 | 10.9 |
| Accommodation and food services | 2.9 | 8.7 |
| Arts, entertainment and recreation | 4.8 | 5.0 |
| Health care and social assistance | 1.9 | 4.7 |
| Manufacturing | 3.1 | 4.3 |
| Transportation and warehousing | 2.4 | 4.2 |
| Agriculture, forestry, fishing and hunting | 7.0 | 4.0 |
| Public administration | 0.6 | 3.4 |
| Information and cultural industries | 6.7 | 3.1 |
| Mining, quarrying, and oil and gas extraction | 6.3 | 2.7 |
| Finance and insurance | 2.4 | 2.4 |
| Educational services | 1.1 | 2.1 |
| Utilities | 2.3 | 1.8 |
| Real estate and rental and leasing | 5.9 | 1.5 |
| Management of companies and enterprises | 2.9 | 1.4 |
| Administrative and support, waste management and remediation services | 2.0 | 1.3 |
| Wholesale trade | 0.2 | 0.6 |
Figure 21: Industry breakdown of Indigenous SMEs and solo Indigenous entrepreneurs
Source: Survey of Indigenous Firms, Global Affairs Canada & Canadian Council for Aboriginal Business, 2021.
The characteristics of Indigenous solo entrepreneurs also have some notable differences.
Solo entrepreneurs that export are more likely to be owned by women (44.7%) compared to their SME counterparts (39.3%) and are more likely to be First Nations.
Solo Indigenous entrepreneurs that export are also slightly more likely to use virtual sales than Indigenous SMEs (87.6% vs. 80.3%). Unfortunately, no comparisons to the Canadian averages exist for solo entrepreneurs.
Export markets and expansion plans
Indigenous solo entrepreneurs export to similar destinations as their SME counterparts such that the top 4 destination markets are identical: U.S. (87.7%), United Kingdom (18.7%), Australia (11.1%), and France (8.4%).
India and New Zealand stood out as popular destination markets specifically for Indigenous solo entrepreneurs, with 6.3% and 2.7% of survey respondents listing these respective markets.

Alternative text:
Top 12 destination markets for solo Indigenous entrepreneurs
| Country | Solo Indigenous entrepreneur exporters (%) |
|---|---|
| United States | 87.7 |
| United Kingdom | 18.7 |
| Australia | 11.1 |
| France | 8.4 |
| India | 6.3 |
| Spain | 3.4 |
| Germany | 3.0 |
| New Zealand | 2.7 |
| Belgium | 2.4 |
| Switzerland | 2.1 |
| Norway | 1.5 |
| Other | 8.2 |
Figure 22: Top 12 destination markets for solo Indigenous entrepreneurs
Source: Survey of Indigenous Firms, Global Affairs Canada & Canadian Council for Aboriginal Business, 2021
Note: This was an open-ended survey question and respondents could name as many destinations as they choose.
While many of the target markets for expansion plans are similar for Indigenous solo entrepreneurs and SMEs, solo entrepreneurs tend to target more diverse markets.
New Zealand stands out as a destination that is notably more popular amongst exporting solo entrepreneurs, with a 6.1 percentage points higher share of respondents than for exporting SMEs.
Countries within Africa also landed in the top 10 most desired new expansion markets for Indigenous solo entrepreneurs, rendering this continent more popular among solo Indigenous entrepreneurs than among Indigenous SMEs.
Chapter 4: Indigenous SMEs’ export odds – an econometric approach
Key messages
- In chapter 4, we employ a logistic regression model with controls for firm characteristics and activities to identify the factors associated with Indigenous SMEs’ export odds.
- Our model finds that Indigenous SMEs with virtual sales are associated with having significantly higher odds of exporting. So much so, that Indigenous firms with virtual sales are associated with having over 6 times the odds of exporting compared to firms without virtual sales.
- In our initial model, SMEs located within Indigenous communities are associated with having a 58% reduction in the odds of exporting compared to firms located outside of Indigenous communities.
- However, remoteness explains a lot of this effect. When we control for remoteness in our model, the significance and magnitude of the Indigenous community factor are reduced. We find that SMEs in remote communities are associated with having 65% lower odds of exporting, reflective of distances to markets, transportation costs, and potential infrastructure gaps.
- Unsurprisingly, industry is an important factor in exporting activity. Indigenous SMEs in manufacturing, arts, entertainment and recreation, and professional scientific, and technical services have considerably higher odds of exporting than our comparison group (Indigenous firms in accommodation and food services).
- SME size is not found to be an important factor in the odds of exporting. While this finding stands in contrast to economic theory and other empirical work on firm export behaviour, it is not surprising given the unusual trend uncovered in chapter 2 with larger Indigenous SMEs having lower export propensities.Footnote 58
- Women-owned Indigenous SMEs do not have higher or lower odds of exporting compared to men-owned Indigenous SMEs.
4.1 The model
In chapter 2, we found that Indigenous SMEs participate less in exporting than Canadian SMEs overall. This chapter uses econometric techniques to identify the factors behind the likelihood of Indigenous-owned SMEs exporting. By uncovering factors of statistical significance, this chapter distinguishes between trends in exporting that arise from mere chance and the factors that are integral in empowering firms to export.
Our analysis is motivated by the finding that Indigenous SMEs are almost 1.7 times less likely to export than the average Canadian SME. While data limitations preclude us from testing the reasons Indigenous SMEs have a lower export propensity than Canadian SMEs, it is possible to unearth what factors are important in enabling Indigenous SMEs to export. To achieve this, we investigate the odds of exporting for Indigenous SMEs using a logistic regression.Footnote 59
The variable of interest in our analysis, which we refer to as the dependent variable, is a binary variable indicating whether an Indigenous SME exported in 2020 or not. Previous literature has found that industry and firm size play key roles in determining whether a firm will export.Footnote 60
In chapter 2, we observed that firms in industries like manufacturing and retail trade have a higher likelihood to export than the Indigenous SME average. We have also observed an unusual increased likelihood to export among smaller firms. To control for industry and size-specific differences in exporting, our logistic model includes categorical variables for the industry in which the firm operates and the size of the firm by number of employees.
Chapter 2 reported disparities in exporting for Indigenous SMEs based on whether the firm is located within an Indigenous community and whether they offer virtual sales. Thus, our model includes binary variables for these two factors.
Remoteness was another factor of relevance that distinguished exporting and non-exporting SMEs in chapter 2, with urban firms being more likely to export than their non-urban counterparts. Coupled with the awareness that proximity to centres of economic activity and population agglomerations are associated with improved labour access, lower transport costs and overall ease of access to trade infrastructure, we include Statistics Canada’s Index of Remoteness in our analysis to determine its impact on exporting.Footnote 61
Combining all the variables, we arrive at the following equation:

Alternative text:
log ((Pr(exporter=1|Xi))/(1-Pr (exporter=1│Xi )))=β0+βiIndustry+ βjSMESize+βk Community+βlVirtualSales+βmRemoteness+ℇ
In this model, Industry represents a categorical variable for the industry in which the firm operates, SMESize represents a categorical variable for the numerical range of employees, Community is a binary variable indicating whether the firm is located within an Indigenous community, VirtualSales is a binary variable for online sales, and Remoteness is a categorical variable for the level of remoteness.Footnote 62
For information on the number of observations for each characteristic in the total sample and the number of observations by export status, please see tables 1A-2A in the appendix.
4.2 Results
Table 1 reports the results of the statistical analysis using several different model structures. The results are reported as odds ratios, which express the odds of exporting for an Indigenous SME with a given characteristic. Footnote 63Standard errors are provided in the parenthesis of Table 1.
An odds ratio equal to 1 means that the characteristic or factor does not change the likelihood of exporting, while an odds ratio of less than 1 means that the factor is associated with a lower likelihood of exporting, and more than 1 is associated with a higher likelihood of exporting.
Column 1 reports the results for a model containing only the industry and firm size characteristics, column 2 includes location within an Indigenous community, column 3 introduces virtual sales and column 4 features the full model, including an indicator for remoteness.
Multiple model specifications are presented in the table to ensure the robustness of the results. Featuring multiple regressions allows us to witness the impact of new factors on the existing variables, which confirms the robustness of the results across different model specifications and different numbers of observations.
Industry plays a crucial role in the odds of exporting. Compared to firms in the accommodation and food services industry, Indigenous SMEs in arts, entertainment and recreation; manufacturing; professional, scientific and technical services; and retail trade have significantly higher odds of exporting — a robust finding across all models.Footnote 64,Footnote 65
The likelihood of exporting is especially magnified for Indigenous SMEs in manufacturing, so much so that firms in this industry have 19 times the odds of exporting compared to firms in the accommodation and food services industry in the full model specification (column 4).
SMEs in arts, entertainment and recreation follow behind manufacturing in terms of the magnitude of effect on exporting, boasting a relationship with the odds of exporting that is 5 times higher than firms in the accommodation and food services industry.
In some, but not all, of our model specifications, SMEs in agriculture, forestry, fishing and hunting as well as mining, quarrying, and oil and gas extraction, are associated with higher odds of exporting compared to SMEs in the base industry grouping, although this finding is weaker.
Table 1: Results of logistic model on likelihood of exporting for Indigenous SMEs, reported in odds ratios (where the dependent variable is whether the firm exported in 2020)
| (1) Industry & firm size | (2) Industry, firm size, & community | (3) Industry, firm size, community & virtual sales | (4) All characteristics | |
|---|---|---|---|---|
| (Intercept) | 0.04*** | 0.06*** | 0.02*** | 0.03*** |
| (0.47) | (0.48) | (0.54) | (0.56) | |
| Industry | ||||
| Administration and provision of public goods and services | 1.45 | 1.58 | 1.49 | 1.44 |
| (0.65) | (0.65) | (0.70) | (0.70) | |
| Agriculture, forestry, fishing, and hunting | 2.71 | 2.94· | 3.65* | 4.76* |
| (0.62) | (0.63) | (0.65) | (0.66) | |
| Arts, entertainment and recreation | 6.20*** | 7.04*** | 5.3** | 5.07** |
| (0.54) | (0.55) | (0.57) | (0.58) | |
| Health care and social assistance | 1.53 | 1.71 | 2.60 | 2.61 |
| (0.69) | (0.69) | (0.71) | (0.72) | |
| Logistic and infrastructure intensive industries | 0.54 | 0.51 | 0.67 | 0.70 |
| (0.64) | (0.64) | (0.69) | (0.69) | |
| Management and other knowledge-based services | 0.84 | 0.85 | 1.02 | 1.00 |
| (0.64) | (0.64) | (0.65) | (0.66) | |
| Manufacturing | 21.53*** | 21.07*** | 20.25*** | 18.67*** |
| (0.53) | (0.53) | (0.55) | (0.55) | |
| Mining, quarrying, and oil and gas extraction | 1.80 | 1.56 | 3.44· | 3.89· |
| (0.69) | (0.69) | (0.71) | (0.72) | |
| Professional, scientific and technical services | 3.42* | 3.10* | 3.79* | 3.40* |
| (0.56) | (0.56) | (0.58) | (0.58) | |
| Retail trade | 2.39· | 2.78· | 2.76· | 2.87· |
| (0.52) | (0.53) | (0.54) | (0.54) | |
| Firm size | ||||
| 5-19 employees | 0.70 | 0.74 | 0.84 | 0.82 |
| (0.24) | (0.25) | (0.26) | (0.27) | |
| 20-99 employees | 0.46* | 0.52· | 0.62 | 0.62 |
| (0.34) | (0.35) | (0.36) | (0.37) | |
| 100-499 employees | 0.76 | 0.83 | 1.19 | 1.23 |
| (0.58) | (0.60) | (0.59) | (0.60) | |
| Other firm characteristics | ||||
| Within Indigenous community | 0.42*** | 0.51** | 0.58* | |
| (0.23) | (0.25) | (0.25) | ||
| Virtual sales | 6.01*** | 6.26*** | ||
| (0.26) | (0.26) | |||
| Remoteness | ||||
| Semi-connected | 0.57* | |||
| (0.28) | ||||
| Remote | 0.35** | |||
| (0.33) | ||||
| Observations | 1527 | 1517 | 1467 | 1457 |
| McFadden's adjusted R-squared | 0.15 | 0.17 | 0.27 | 0.29 |
| Signif. levels in percentages 0.1% ‘***’ 1% ‘**’ 5%‘*’ 10% ‘•’ | ||||
Firm size was not found to be a significant factor in exporting for Indigenous firms in the full model in column 4. This result stands in contrast to the findings of previous literature that states that larger firms are more likely to export.Footnote 66
Despite lacking significance in the all characteristics model (column 4), a negative but weakly significant relationship between firm size and exporting was revealed in the models in columns 1 and 2.
According to these initial models, firms with 20 to 99 employees are associated with around a 50% reduction in the odds of exporting when compared to firms with 1 to 4 employees; however, the significance disappears once the impact of virtual sales is controlled for. This suggests that variations in the use of virtual sales by firm size could be one of the contributors to this negative association.
A firm’s location within an Indigenous community (such as on a reserve) is associated with lower odds of exporting in our model, though ultimately this is not a particularly strong association as the effect weakens when indicators of virtual sales or remoteness are included.
Being located within an Indigenous community is associated with lower odds of exporting, and this remains weakly statistically significant across all 4 models. This suggests that there may be other factors at play for these community-based businesses in explaining their decision or ability to export.
In the industry and firm size model (column 2), SMEs located within Indigenous communities are associated with 58% lower odds of exporting compared to firms located outside of Indigenous communities. When an indicator for virtual sales is included in column 3, the association between being located within an Indigenous community and exporting is slightly reduced, both in magnitude and significance. This suggests that the association between firms in Indigenous communities and lower odds of exporting in model 2 could be in part related to access to virtual sales. Thus, when the effect of virtual sales is controlled for in model 3, we find that the odds of exporting for firms with an Indigenous community narrow to 49% lower odds.
We find that virtual sales have an overwhelmingly positive relationship with exporting. All else constant, Indigenous SMEs with virtual sales are associated with having nearly 6 times higher odds of exporting. This result emphasizes that there is a pivotal relationship between access to virtual sales and exporting.
There are two critical observations stemming from the results of the fourth model when the remoteness indicator is included. First, firms in both semi-connected and remote areas have lower odds of exporting compared to firms in urban areas. Firms in semi-connected areas are associated with 43% lower odds of exporting when compared to urban SMEs, while remote firms are associated with 65% lower odds of exporting compared to urban SMEs. The reduction in the odds of exporting for firms in remote areas is so large that remoteness is associated with the largest drop in the odds of exporting of any of the indicators in our model.
The second notable observation appears in the indicator for business location within an Indigenous community. When remoteness is controlled for, the relationship between location within an Indigenous community and exporting drops in both significance and magnitude.
Notably, location within an Indigenous community is associated with a 42% reduction in the odds of exporting. This represents a 7-percentage point increase in the odds of exporting when compared to the results in column 3. Moreover, the factor is only significant at the 5% level. The drop in significance and magnitude suggests that remoteness could have been partly driving the negative association between location within an Indigenous community and exporting. Thus, when the impacts of remoteness are controlled for, being located within an Indigenous community is not as significant of a factor in explaining the odds of exporting.
Table 2 presents the results in odds ratios for the logistic regressions on the odds of exporting with additional controls for region (province/territory) and gender of ownership:
- Column 1 presents the “all characteristics” model
- Column 2 introduces a regional control
- Column 3 introduces a variable for the gender of firm ownership
- Column 4 combines all these predictors into a model with both regional and gender predictors
We find that there are no statistically meaningful differences between men- and women-owned firms when it comes to exporting — a result that holds true for both models that solely include the gender predictor as well as the model with both regional and gender controls.Footnote 67
The lack of significance was expected as our descriptive analysis found minimal gender disparities in exporting for Indigenous SMEs. This is in line with research done by GAC’s Office of the Chief Economist using firm-level data that found that women-owned SMEs in Canada exported at the same rates as men- and equally owned SMEs when characteristics such as industry and size are controlled for.Footnote 68
The region in which the SME is located is also not found to be a significant factor in exporting in any of the models. Upon the inclusion of the gender and regional controls, we find that the main results still hold. Namely, manufacturing remains the industry that is associated with the highest odds of exporting, virtual sales are significantly and positively related to exporting and remote firms are linked to having significantly lower odds of exporting when compared to urban firms.
It is important to note that the relationship between export activity and being located within an Indigenous community remains negative but drops in significance once region and gender are controlled for.
Table 2: Results of logistic model on likelihood of exporting for Indigenous SMEs, with regional and gender predictors, reported in odds ratios (where the dependent variable is whether the firm exported in 2020)
| (1) All characteristics model | (2) All characteristics with regional predictor | (3) All characteristics with gender predictor | (4) All characteristics with regional & gender predictors | |
|---|---|---|---|---|
| (Intercept) | 0.03*** | 0.02*** | 0.05*** | 0.04*** |
| (0.56) | (0.63) | (0.58) | (0.65) | |
| Industry | ||||
| Administration and provision of public goods and services | 1.44 | 1.57 | 0.88 | 0.95 |
| (0.70) | (0.71) | (0.77) | (0.78) | |
| Agriculture, forestry, fishing, and hunting | 4.76* | 4.81* | 3.33· | 3.31· |
| (0.66) | (0.67) | (0.70) | (0.71) | |
| Arts, entertainment and recreation | 5.07** | 5.37** | 4.81** | 4.97** |
| (0.58) | (0.58) | (0.59) | (0.6) | |
| Health care and social assistance | 2.61 | 2.65 | 1.48 | 1.49 |
| (0.72) | (0.72) | (0.9) | (0.9) | |
| Logistic and infrastructure intensive industries | 0.70 | 0.71 | 0.39 | 0.40 |
| (0.69) | (0.7) | (0.76) | (0.77) | |
| Management and other knowledge-based services | 1.00 | 1.02 | 0.61 | 0.63 |
| (0.66) | (0.66) | (0.76) | (0.77) | |
| Manufacturing | 18.67*** | 19.09*** | 13.62*** | 13.83*** |
| (0.55) | (0.56) | (0.57) | (0.57) | |
| Mining, quarrying, and oil and gas extraction | 3.89· | 3.94· | 3.37· | 3.46· |
| (0.72) | (0.73) | (0.74) | (0.75) | |
| Professional, scientific and technical services | 3.40* | 3.58* | 2.59 | 2.70· |
| (0.58) | (0.58) | (0.59) | (0.59) | |
| Retail trade | 2.87· | 3.02* | 2.19 | 2.28 |
| (0.54) | (0.55) | (0.56) | (0.57) | |
| Firm size | ||||
| 5-19 employees | 0.82 | 0.79 | 0.87 | 0.84 |
| (0.27) | (0.27) | (0.28) | (0.29) | |
| 20-99 employees | 0.62 | 0.60 | 0.51 | 0.51 |
| (0.37) | (0.37) | (0.42) | (0.43) | |
| 100-499 employees | 1.23 | 1.16 | 0.81 | 0.77 |
| (0.60) | (0.6) | (0.81) | (0.82) | |
| Other firm characteristics | ||||
| Within Indigenous community | 0.58* | 0.60· | 0.59· | 0.60· |
| (0.25) | (0.27) | (0.27) | (0.30) | |
| Virtual sales | 6.26*** | 6.38*** | 5.65*** | 5.75*** |
| (0.26) | (0.27) | (0.29) | (0.29) | |
| Remoteness | ||||
| Semi-connected | 0.57* | 0.59· | 0.54* | 0.57· |
| (0.28) | (0.29) | (0.29) | (0.30) | |
| Remote | 0.35** | 0.36** | 0.31** | 0.33** |
| (0.33) | (0.36) | (0.38) | (0.41) | |
| Region | ||||
| Québec | 1.32 | 1.22 | ||
| (0.43) | (0.48) | |||
| Atlantic | 0.74 | 0.55 | ||
| (0.62) | (0.70) | |||
| Territories | 1.52 | 1.45 | ||
| (0.68) | (0.79) | |||
| Prairies | 1.32 | 1.15 | ||
| (0.35) | (0.37) | |||
| British Columbia | 1.44 | 1.32 | ||
| (0.41) | (0.43) | |||
| Majority women owned (51%+) | 0.82 | 0.84 | ||
| (0.28) | (0.28) | |||
| Observations | 1457 | 1457 | 1095 | 1095 |
| McFadden's adjusted R-squared | 0.29 | 0.29 | 0.40 | 0.40 |
| Signif. levels in percentages 0.1% ‘***’ 1% ‘**’ 5%‘*’ 10% ‘•’ | ||||
4.3 Discussion
Numerous studies have found that across countries, exporters tend to be more productive, larger, more skill- and capital-intensive firms.Footnote 69
Manufacturing is an industry that tends to boast high productivity in part due to increasing returns to scale through capital-intensive production, so it comes as no surprise that our study confirms manufacturing to be an industry that is largely associated with higher odds of exporting for Indigenous firms.Footnote 70
However, despite the notion that larger firms tend to be more likely to export, our study does not find that this notion holds for Indigenous SMEs. One caveat to note, is that the regression compares the likelihood of exporting for Indigenous firms with sizes ranging from 1 to 499 employees, which does not capture differences in firms with no employees and larger enterprises.
E-commerce is widely recognized as a ground-breaking force that empowers firms to engage in international markets. A study by the OECD finds that in some cases, smaller firms can outperform larger firms if the firm experiences a competitive advantage in their information and communications technology.Footnote 71 Our study finds that virtual sales are indeed an integral factor in empowering Indigenous firms to export.
The association between Indigenous community-based businesses and exporting merits further investigation. There is a statistically significant and negative correlation between virtual sales and location within an Indigenous community, providing evidence of the digital connectivity gap that may affect firms’ abilities to export.
When virtual sales are included in the model, the negative association between exporting and location within an Indigenous community diminishes, implying that differences in virtual sales may contribute to the lower odds of exporting among businesses located within Indigenous communities.
Even though virtual sales explain some of this lower odds ratio, the Indigenous community indicator remains significant, which suggests that there are other factors driving this relationship.
One of the key factors influencing the likelihood of Indigenous community-based businesses to export is remoteness. We saw in chapter 2 that many Indigenous community-based firms were in remote areas (43%). Thus, it is possible that firms located within Indigenous communities could be especially susceptible to barriers in exporting tied to remoteness.
When remoteness is directly controlled for in the econometric model, it has a strongly negative association with exporting, and it lessens the relationship between location within Indigenous communities and exporting.
The negative association between remoteness and exporting is unsurprising as firms in remote communities are less connected to trade infrastructure, have a greater distance to markets and higher transportation costs, and experience greater difficulty accessing labour due to lower population densities.
What remains intriguing, is that though reduced, the association between community-based firms and lower odds of exporting persist even after controlling for remoteness, virtual sales, and region and gender.
In chapter 2, we discussed some of the features of Indigenous community-based businesses that might further explain this gap, including infrastructure challenges, different business models and motivations, and property rights under the Indian Act. Some of these challenges associated with Indigenous community-based businesses and exporters will be further explored in our second paper.
The drivers of the negative relationship between location within an Indigenous community and exporting remain speculative, which highlights the gap in the literature on the challenges faced by firms in Indigenous communities. For instance, these factors could be related to lower incomes and difficulties accessing financing, which could be exacerbated in Indigenous communities.Footnote 72 One other factor could be that Indigenous firms may have mandates that go beyond profits and, as a result, may be less export driven.Footnote 73
In an upcoming report, we seek to contribute to this understanding by focusing on the challenges — export challenges in particular — faced by Indigenous firms.
Conclusions
Despite a long history of Indigenous trade, few researchers have conducted in-depth analyses of the unique characteristics of Indigenous firms in Canada, and even fewer have looked specifically at exporting behaviour.
Global Affairs Canada and the Canadian Council for Aboriginal Business’ Survey of Indigenous Firms is one of the first of its kind to investigate the exporting and business experiences of over 2,600 Indigenous firms.
After completing the survey and analyzing the data, we find that Indigenous businesses are regularly engaging in export and making this practice a prominent part of their operations and economic expansion.
This report identified characteristics and activities that influenced the likelihood of Indigenous SMEs to export. Virtual sales are associated with 6 times higher odds of exporting. At the same time, being in remote regions is associated with a 65% reduction in the odds of exporting compared to urban-based businesses.
While Indigenous SMEs operating in Indigenous communities are less likely to export, this characteristic is not as prominent when controlling for virtual sales and remoteness.
The findings of this report emphasize the following needs:
- Continue to promote exporting as a viable means of growing Indigenous economies in Canada and support Indigenous businesses that are already engaged in international markets to close the export gap.
This study uncovered a sizeable export gap with 7.2% of Indigenous SMEs exporting compared to the national SME average of 12.1%. Given the benefits that flow from exporting, there needs to be a greater understanding of the causes of that gap and the policy and program action that is needed to close it.
The interest in exporting is there. This report found that Indigenous SMEs who do not currently export are 4 times more likely to report plans to start exporting (16.3%) compared to the average Canadian SME (3.8%). This interest needs to be harnessed, and barriers need to be tackled to close the gap. - Consider the unique industry and size distribution of Indigenous SMEs when designing policies and programs.
The results of the national survey depict some key divergences in the characteristics of Indigenous SMEs compared to average SMEs in Canada. Special attention should be given to understanding exporting realities in industries where Indigenous SMEs are concentrated, such as natural resource industries and services such as arts, entertainment and recreation, and information and cultural industries.
A few industries that are generally key Canadian export industries had much lower export propensities among Indigenous businesses, including wholesale trade and transportation and warehousing.
Our work found that larger Indigenous firms were less likely to export, which stands in contrast to the experiences of Canadian SMEs overall. Important next steps would be to increase our understanding of the nature of these differences. - Work with Indigenous businesses and communities to establish meaningful market integration in countries indicated as regions of interest.
Participants in this research expressed interest in expanding and continuing to entrench their operations in new markets abroad. Many of the countries cited by respondents are places where Canada already has established trade and even free trade agreements.
These existing agreements can be further leveraged with trade promotion approaches to better support Indigenous businesses who are looking to markets in the United States, Europe, Australia and others as untapped potential for economic growth and prosperity. - Better understanding of the needs of Indigenous businesses located in remote areas and Indigenous communities.
Many Indigenous SMEs are in remote areas far from international markets, large labour markets, transportation, and in some cases digital infrastructure. This study has uncovered that businesses in those regions export less, even when factors like industry and size are controlled for.
Our next study will dive into some of the obstacles remote firms face in more detail, but we already know geography plays an important role in Indigenous business and export activity. - Learn from the successes of Indigenous women-owned SMEs and their prominence in the Indigenous export and business landscape.
Majority women-owned Indigenous SMEs are leading the way for Canada when it comes to breaking down the gender gaps in entrepreneurship and exporting engagement. 39.3% of all Indigenous SME exporters are majority-women owned compared to only 14.5% of SME exporters in Canada overall.
The success of Indigenous women in international markets is an example to learn from when it comes to developing policies to close Canada’s gender gap in exporting and promoting entrepreneurship among women.
While this report sheds light on the characteristics and export activity of Indigenous businesses, further research is required to build a deeper understanding of the challenges facing Indigenous SMEs.
Our report sets the foundation for our second study on Indigenous SMEs, which will delve into the unique barriers they face when seeking to export. As previously mentioned, this is the first of two reports that present the results of our collaboration, including a national survey of 2,603 Indigenous businesses and community case studies in three Indigenous communities, supplemented by interviews with Economic Development Officers.
The subsequent report will be dedicated to analyzing data collected from interviews conducted with Indigenous-owned businesses through the lens of the findings presented in this report.
The second report will also be accompanied by policy-oriented recommendations, which will help put some of the survey findings and data collected from community interviews into actionable material to be utilized by governments and private corporations.
Bibliography
AFN Special Chiefs Assembly. (2021, December). Support for Closing the Infrastructure Gap by 2030. Retrieved from Assembly of First Nations: https://www.afn.ca/wp-content/uploads/2021/12/DR-12-Support-for-Closing-the-Infrastructure-Gap-by-2030.pdf
Ahmed, U., & Melin, H. (2017). Technology-enabled Small Business Trade in Canada: New Evidence from eBay Marketplaces. (S. Tapp, A. V. Assche, & R. Wolfe, Eds.) Redesigning Canadian Trade Policies for New Global Realities,, VI.
Alasia, A., Bédard, F., Bélanger, J., & Guimond, E. (2017, May 9). Measuring remoteness and accessibility: A set of indices for Canadian communities. Retrieved from Statistics Canada : https://www150.statcan.gc.ca/n1/pub/18-001-x/18-001-x2017002-eng.html
Australian Bureau of Statistics . (2022, June 21). Estimates of Aboriginal and Torres Strait Islander Australians. Retrieved from https://www.abs.gov.au/statistics/people/aboriginal-and-torres-strait-islander-peoples/estimates-aboriginal-and-torres-strait-islander-australians/latest-release
Balcom, A., & Odunade, S. (2022). The Index of Broadband Availability for Indigenous Communities in Canada . Ottawa: Statistics Canada & Indigenous Services Canada .
Bassirou, G., Lafrance-Cooke, A., & Oyarzun, J. (2022, December 22). Characteristics of Indigenous-owned businesses. Retrieved from Statistics Canada: https://www150.statcan.gc.ca/n1/en/pub/36-28-0001/2022012/article/00004-eng.pdf?st=vvmLWxyK
Bassirou, G., Lafrance-Cooke, A., & Oyarzun, J. (2022, November 24). Identifying Indigenous Business Owners and Indigenous-Owned Businesses. Retrieved from Statistics Canada: https://www150.statcan.gc.ca/n1/daily-quotidien/221124/dq221124e-eng.htm
Bélanger Baur, A. (2019). Indigenous-Owned Exporting Small and Medium Enterprises in Canada, Global
Affairs Canada & Canadian Council for Aboriginal Business. https://www.international.gc.ca/trade-commerce/inclusive_trade-commerce_inclusif/indigenous-autochtone/indigenous_sme-pme_autochtones.aspx?lang=eng
Bernard, A. B., Jensen, B., Redding, S. J., & Schott, P. K. (2007). Firms in International Trade. Journal of Economic Perspectives.
Bressette, C. R. (2018, September 25). Trade. Retrieved from Indigenous Peoples Atlas of Canada : https://indigenouspeoplesatlasofcanada.ca/article/trade/
Canadian Council for Aboriginal Business (2022, December 15). “Leading Transformations: Indigenous Economic Development Corporations and the Post-COVID Recovery.” . Retrieved from https://www.ccab.com/wp-content/uploads/2022/12/EDCs-Leading-Transformation-2022.pdf
Canadian Council for Public-Private Partnerships. (2016). P3's: Bridging the First Nations Infrastructure Gap. Retrieved from http://www.pppcouncil.ca/web/pdf/first_nations_p3_report.pdf
Canadian Museum of History. “An Aboriginal Presence: Naming the land.” Accessed on April 24, 2023. https://www.historymuseum.ca/cmc/exhibitions/aborig/fp/fpz2d_1e.html.
Diochon, M., Mathie, A., Alma, E., & Issac, S. (2014). Entrepreneurship among First Nations Women in the Atlantic Region. Retrieved from https://www.apcfnc.ca/wp-content/uploads/2020/06/FINALREPORT-EntrepreneurshipamongFirstNationsWomenApril2014.pdf
Durand-Moreau, Q., Lafontaine, J., & Ward , J. (2022). Work and health challenges of Indigenous people in Canada. The Lancet.
Flanagan, T., & Alcantara, C. (2002, July ). Individual Property Rights on Canadian Indian Reserves. Retrieved from The Fraser Institute: https://www.fraserinstitute.org/sites/default/files/PropertyRightsonIndianReserves.pdf
Foster, J. E., & Eccles, J. W. (2013, July 23). Fur Trade in Canada . Retrieved from The Canadian Encyclopedia: https://www.thecanadianencyclopedia.ca/en/article/fur-trade
Government of Canada. (2018). TCPS 2 (2018) – Chapter 9: Research Involving the First Nations, Inuit and Métis Peoples of Canada. Retrieved from Panel on Research Ethics : https://ethics.gc.ca/eng/tcps2-eptc2_2018_chapter9-chapitre9.html
Government of Canada. (2019, July 11). Trade and Indigenous peoples summary. Retrieved from Canada-United States-Mexico Agreement (CUSMA) - Trade and indigenous peoples provisions summary: https://www.international.gc.ca/trade-commerce/trade-agreements-accords-commerciaux/agr-acc/cusma-aceum/indigenous-autochtones.aspx?lang=eng
Hanson, E. (2009). The Indian Act . Retrieved from Indigenous foundations UBC: https://indigenousfoundations.arts.ubc.ca/the_indian_act/#:~:text=The%20Indian%20Act%20is%20a%20part%20of%20a%20long%20history,mainstream%20Canadian%20life%20and%20values.
Hensher, D. A., & Stopher, P. R. (1979). Behavioural Travel Modelling. Routledge Library Editions.
Hilton, C. A. (2021). Indigenomics Taking a Seat at the Economic Table. Gabriola Island : New Society Publishers .
Indigenous Corporate Training Inc. (2017, July 5). Indigenous Trade Networks Thrived Long Before the Arrival of Europeans. Retrieved from https://www.ictinc.ca/blog/indigenous-trade-networks-thrived-long-before-the-arrival-of-europeans
Johnson, D. R. (2008, November). Using Weights in the Analysis of Survey Data . Retrieved from The Pennsylvania State University: https://pages.nyu.edu/jackson/design.of.social.research/Readings/Johnson%20-%20Introduction%20to%20survey%20weights%20%28PRI%20version%29.pdf
Joseph, B. (2018). 21 Things You May Not Know About the Indian Act: Helping Canadians Make Reconciliation with Indigenous Peoples a Reality. Indigenous Relations Press.
Lands Advisory Board. (1996). Framework Agreement. Retrieved from https://labrc.com/framework-agreement/
National Aboriginal Economic Development Board. (2019, June 10). The National Aboriginal Economic Development Board. Retrieved from http://www.naedb-cndea.com/wp-content/uploads/2019/06/NIEDB-2019-Indigenous-Economic-Progress-Report.pdf
National Indigenous Economic Strategy. (2022). National Indigenous Economic Strategy for Canada. Retrieved from https://niestrategy.ca/
Organisation for Economic Cooperation and Development . (2020, January 21). Linking Indigenous Communities with Regional Development in Canada. Retrieved from OECD Rural Policy Reviews: https://www.oecd-ilibrary.org/urban-rural-and-regional-development/linking-indigenous-communities-with-regional-development-in-canada_fa0f60c6-en
Organisation for Economic Cooperation and Development. (2021). Productivity in SMEs and large firms. Retrieved from OECDilibrary: https://www.oecd-ilibrary.org/sites/54337c24-en/index.html?itemId=/content/component/54337c24-en
Oxner, M., LaBillois, T., McMillan, J., Price, S., & Weaving, C. (2020). Indigenous Women in Business in Atlantic Canada. Retrieved from https://www.apcfnc.ca/wp-content/uploads/2020/12/Indigenous-Women-in-Business-in-Atlantic-Canada-October-31-2020-FINAL_compressed.pdf
Pew Research Centre. (2018, January 26). Retrieved from How different weighting methods work : https://www.pewresearch.org/methods/2018/01/26/how-different-weighting-methods-work/
Sekkel, J., & Wang, W. (2023). Summary of "Closing the gender gap in exporting: identifying women’s exporting successes using firm-level data for Canada", a presentation at the WTO World Trade Congress on Gender (December 2022). Ottawa: Global Affairs Canada. Retrieved from https://www.international.gc.ca/trade-commerce/economist-economiste/analysis-analyse/executive-summary-resume.aspx?lang=eng
Statistics Canada. (2018, July 23). “Aboriginal Languages in Canada”. Retrieved from
https://www12.statcan.gc.ca/census-recensement/2011/as-sa/98-314-x/98-314-x2011003_3-eng.cfm
Statistics Canada. (2018, June 21). Aboriginal Population Profile, 2016 Census. Retrieved from https://www12.statcan.gc.ca/census-recensement/2016/dp-pd/abpopprof/about-apropos/tab-inuit-inuite.cfm?LANG=E
Statistics Canada. (2020, April 3). Index of Remoteness. Retrieved from https://www150.statcan.gc.ca/n1/en/catalogue/17260001
Statistics Canada. (2021, November 17). Residence on or off reserve. Retrieved from https://www12.statcan.gc.ca/census-recensement/2021/ref/dict/az/Definition-eng.cfm?ID=pop167
Statistics Canada. (2022, September 21). First Nations people, Métis and Inuit in Canada. Retrieved from https://www150.statcan.gc.ca/n1/pub/11-627-m/11-627-m2022057-eng.htm
Statistics Canada. (2022). Survey of Financing and Growth of SMEs. Retrieved from https://www150.statcan.gc.ca/n1/daily-quotidien/220302/dq220302b-cansim-eng.htm
Statistics Canada. (2022, March 2). Table 33-10-0449-01. Exports made by small and medium enterprises. Retrieved from https://www150.statcan.gc.ca/t1/tbl1/en/tv.action?pid=3310044901
Statistics Canada. (2022, March 2). Table: 33-10-0452-01. Intentions to expand to new markets for small and medium enterprises. Retrieved from https://www150.statcan.gc.ca/t1/tbl1/en/tv.action?pid=3310045201
Statistics Canada. (2022, September 21). The Daily — Indigenous population continues to grow and is much younger than the non-Indigenous population, although the pace of growth has slowed. Retrieved from https://www150.statcan.gc.ca/n1/daily-quotidien/220921/dq220921a-eng.htm
Stats NZ Tatauranga Aotearoa (2020, September). https://www.stats.govt.nz/news/ethnic-group-summaries-reveal-new-zealands-multicultural-make-up/
The Canadian Radio-television and Telecommunications Commission (CRTC). (2020). Communications Monitoring Report. Retrieved from CRTC: https://crtc.gc.ca/pubs/cmr2020-en.pdf
The Indian Act. (1876).
The National Aboriginal Economic Development Board. (2019, June 10). The National Aboriginal Economic Development Board. Retrieved from http://www.naedb-cndea.com/reports/naedb_report_reconciliation_27_7_billion.pdf
United Nations. (2007). United Nations Declaration on the Rights of Indigenous Peoples . Retrieved from United Nations For Indigenous Peoples: https://www.un.org/development/desa/indigenouspeoples/wp-content/uploads/sites/19/2018/11/UNDRIP_E_web.pdf
U.S. Census Bureau (November 2022) https://www.census.gov/newsroom/stories/native-american-heritage-day.html
Wagner, J. (2007). Exports and productivity: a survey of the evidence. The World Economy.
Appendix
Section 1A: Comparison of 2019 study and current project
How the 2 surveys were designed and how their aims and objectives differ is worthy of consideration.
The chart below provides some of the key differences and constraints in the research methodology for the 2019 and 2023 reports.
| Data source | Impact on data collection | ||
|---|---|---|---|
| 2019 report characteristics | 2023 report characteristics | ||
| Sample size | Approximately 1,100 respondents, including nearly 650 SMEs (based on survey data collected in 2015). | Approximately 2,600 respondents, including 1,670 SMEs (based on survey data collected in 2021). | Our efforts to provide more precise estimates on Indigenous businesses are reflected in the larger sample size. |
| Sampling frame | The survey was primarily distributed to publicized business registries that tended to contain mature, well-established businesses with an online presence. | The survey was distributed to a broader range of Indigenous business owners at all stages of their entrepreneurial development. In addition, Indigenous-owned exporters were specifically targeted. | The sample for the 2021 survey included 2 additional databases prepared by CCAB to supplement our list of the available population. This included smaller and community-based public sources and directories. |
| Question wording | The question we used to evaluate export propensity was ambiguous regarding “in which of the following places did your business have clients” and “in countries other than Canada,” which could have led to different interpretations and outcomes as to what constituted exporting. It should be noted that Indigenous-owned exporters were not the primary focus of this survey. | This survey asked respondents more specific questions about their export activity in 2020 specifically. | It is common for Indigenous and non-Indigenous businesses alike to answer “no” when asked whether they export, even when they do in fact sell goods and services abroad; this can lower export propensity estimates. However, the benefit of including specific questions on exporting in the 2021 survey is that they were crafted to allow for national comparisons with overall Canadian averages, which provides us with a clearer understanding of Indigenous export experience within the Canadian context. |
Section 2A: Robustness and fit
Several approaches to ensuring robustness and goodness of fit are applied throughout this study. First, the variance of inflation factor (VIF) is determined to uncover instances of multicollinearity between the independent variables in the complete model.Footnote 74
Generally, a VIF factor above 5 is considered problematic as it suggests multicollinearity in the model. For all the independent variables in the full model, a VIF below 5 is observed. Thus, multicollinearity is not determined to be a significant issue in the regression model.
Unlike in the descriptive analysis conducted in chapter 2, survey weights are not applied to the regression model in our main findings.Footnote 75 This is because weighing datasets runs the risk of reducing the accuracy of the results and that risk is more prominent for datasets with a modest sample size.
To ensure robustness of results, Table 4A in the appendix presents the findings of the full regression model with survey weights applied. The results of the weighted full model are similar to that of the unweighted full model in that key findings still hold.
To measure model fit, McFadden’s adjusted R-squared is calculated in the model.Footnote 76 It is generally accepted that McFadden’s R-squared values between 0.2 and 0.4 indicate excellent model fit for logistic regressions.Footnote 77 In the all-characteristics model in Table 1, we observe a McFadden’s adjusted R-squared value of 0.29, which indicates a very good model fit. Furthermore, we observe that the value of McFadden’s R-squared increases as more regressors are added into the model from columns 1-4.
This suggests that each new regressor improves the explanatory power of the model and is thus justified in the regression.Footnote 78
Section 3A: Remoteness indicator methodology
To capture the effects of geographic proximity and population density on socio-economic and health outcomes, Statistics Canada developed an Index of Remoteness of communities. The Index of Remoteness is constructed at the census subdivision level.Footnote 79
To link the remoteness indices to the firms in our survey, we use the Postal Code Conversion File by Canada Post and Statistics Canada. This allows us to link the postal codes in our survey to census subdivisions and ultimately to the index of remoteness.
To mitigate situations when postal codes fall into more than one census subdivision, we calculate and assign the average index of remoteness across all relevant census subdivisions to the firm in question.
Section 4A: Use of weighted data
Throughout the descriptive analysis of this report, survey weights are applied to the data. Weighting is a statistical technique that aims to mitigate selection bias by modifying raw survey data so that it more closely aligns with the characteristics of the population studied.
Unless there is a perfect case of random sampling, survey research can introduce selection bias into the data set, which poses a problem in accurately understanding the target population.
An example of selection bias in survey research would be if a business council conducts a survey, and the businesses involved with the council tend to be larger firms in the community. Then, the data would inaccurately depict that the average firm size of the group is larger than the average of the true population.
In our research, survey participants were drawn from CCAB’s client database of Indigenous businesses and recruited from community-based resources, such as business registries, other local directories and social media campaigns.
While this approach aims to reach a diverse range of Indigenous businesses by recruiting participants from various sources, harder to reach businesses (such as remote firms) may have not been adequately captured and selection bias may still arise.
Ultimately, if weights are properly estimated, more accurate estimates of the true population can be ascertained from the survey.
One risk of weighting the data is if the survey weights are improperly estimated, which can cause various problems to arise. For instance, inaccurate weighting may over-represent certain demographics and can inadvertently introduce additional bias into the dataset.
As the true population and distribution of Indigenous businesses in Canada is unknown, there is a risk that the weighting methodology may over or underrepresent the characteristics of Indigenous firms. Big River Analytics has taken much care by using a best-in-class weighting approach. The survey results are accurate within plus or minus 1.9 percentage points at the 95% confidence level.
The national survey was weighted by Big River Analytics using a raking method. Raking uses variables with known population distributions and iteratively adjusts the weights for each observation until the survey sample distribution aligns with the population for those variables. The process is repeated until all the weighted distributions of the survey observations align with the distributions of the known variables.Footnote 80 The weighting design in our survey utilizes the known population parameters for North American industry classifications, region, firm size and presence on or off an Indigenous community using the Canadian Business Register.
One shortcoming of this approach is that there is currently no complete register of Indigenous businesses in Canada so we cannot ensure that the data have been weighted according to the Indigenous business population.
Following our weighting exercise, Statistics Canada released estimates of the Indigenous business population using administrative data and imputations for 30% of the population.Footnote 81 Further analysis would need to be done to compare our weightings against the results of this study.
Unlike in the descriptive analysis conducted in chapters 2 and 3, survey weights are not applied to the regression model in chapter 4. This is because weighing datasets in statistical regressions runs the risk of reducing the efficiency of the results, and can lead to increases in the sampling variances, standard deviations and standard errors.
An alternative approach to controlling for bias in unweighted analysis is to include independent variables in the models that account for the disproportionate sample design, such as firm size.Footnote 82 Thus, we decide to reduce the risk of efficiency losses in the econometric work by using the unweighted sample and aim to minimize bias by controlling for factors which could drive disproportionate distributions in the sample.
Section 5A: Tables and figures
Table 1A: Firm sizes by total sample and export status (number of observations & percent)Footnote 83
| Firm size | Total sample | Non-exporters | Exporters | |||
|---|---|---|---|---|---|---|
| Count | % of all firms; % of SMEs* | Count | % of sample | Count | % of sample | |
| All firms** | 2381 | 100 | 2188 | 91.9 | 193 | 8.1 |
| Zero employees | 783 | 33.6 | 693 | 88.5 | 90 | 11.5 |
| 500+ employees | 7 | 0.3 | 6 | 85.7 | 1 | 14.3 |
| SMEs | 1537 | 64.6 | 1436 | 93.4 | 101 | 6.6 |
| 1-4 employees | 467 | 30.4 | 424 | 90.8 | 43 | 9.2 |
| 5-19 employees | 681 | 44.3 | 641 | 94.1 | 40 | 5.9 |
| 20-99 employees | 332 | 21.6 | 318 | 95.8 | 14 | 4.2 |
| 100-499 employees | 57 | 3.7 | 53 | 93.0 | 4 | 7.0 |
*The percentages for zero employee firms, 500+ firms, and SMEs are represented as a percent of total firms. The percentages for the employee ranges of 1 - 499 are represented as a percentage of all SMEs.
**Please note there are 2,381 firms in total in the sample; however totals by firm size do not equal this number as 53 observations are missing due to unrecorded firm size
Table 2A: SME characteristics by total sample and export status (number of observations and percent)
| Firm characteristics | Total sample | Non-exporters | Exporters | |||
|---|---|---|---|---|---|---|
| Count | % of total respondents for each characteristic | Count | % of non-exporters in category | Count | % of exporters in category | |
| Industry* | 1527 | 1427 | 93.5 | 100 | 6.5 | |
| Accommodation and food services | 163 | 10.7 | 158 | 96.9 | 5 | 3.1 |
| Administrative and support, waste management and remediation services | 19 | 1.2 | 17 | 89.5 | 2 | 10.5 |
| Agriculture, forestry, fishing, and hunting | 76 | 5.0 | 70 | 92.1 | 6 | 7.9 |
| Arts, entertainment and recreation | 86 | 5.6 | 72 | 83.7 | 14 | 16.3 |
| Construction | 221 | 14.5 | 221 | 100.0 | 0 | 0.0 |
| Educational services | 50 | 3.3 | 49 | 98.0 | 1 | 2.0 |
| Finance and insurance | 20 | 1.3 | 18 | 90.0 | 2 | 10.0 |
| Health care and social assistance | 99 | 6.5 | 95 | 96.0 | 4 | 4.0 |
| Information and cultural industries | 39 | 2.6 | 37 | 94.9 | 2 | 5.1 |
| Management of companies and enterprises | 17 | 1.1 | 17 | 100.0 | 0 | 0.0 |
| Manufacturing | 61 | 4.0 | 36 | 59.0 | 25 | 41.0 |
| Mining, quarrying, and oil and gas extraction | 84 | 5.5 | 80 | 95.2 | 4 | 4.8 |
| Other services (except public administration) | 90 | 5.9 | 88 | 97.8 | 2 | 2.2 |
| Professional, scientific and technical services | 106 | 6.9 | 95 | 89.6 | 11 | 10.4 |
| Public administration | 24 | 1.6 | 23 | 95.8 | 1 | 4.2 |
| Real estate and rental and leasing | 20 | 1.3 | 20 | 100.0 | 0 | 0.0 |
| Retail trade | 235 | 15.4 | 219 | 93.2 | 16 | 6.8 |
| Transportation and warehousing | 67 | 4.4 | 64 | 95.5 | 3 | 4.5 |
| Utilities | 38 | 2.5 | 38 | 100.0 | 0 | 0.0 |
| Wholesale trade | 12 | 0.8 | 10 | 83.3 | 2 | 16.7 |
| Firm size | 1537 | 1436 | 93.4 | 101 | 6.6 | |
| 1-4 employees | 467 | 30.4 | 424 | 90.8 | 43 | 9.2 |
| 5-19 employees | 681 | 44.3 | 641 | 94.1 | 40 | 5.9 |
| 20-99 employees | 332 | 21.6 | 318 | 95.8 | 14 | 4.2 |
| 100-499 employees | 57 | 3.7 | 53 | 93.0 | 4 | 7.0 |
| Indigenous community* | 1527 | 1426 | 93.4 | 101 | 6.6 | |
| Outside | 662 | 43.4 | 598 | 90.3 | 64 | 9.7 |
| Within | 865 | 56.6 | 828 | 95.7 | 37 | 4.3 |
| Virtual sales* | 1486 | 1389 | 93.5 | 97 | 6.5 | |
| No online sales | 1058 | 71.2 | 1031 | 97.4 | 27 | 2.6 |
| Yes online sales | 428 | 28.8 | 358 | 83.6 | 70 | 16.4 |
| Remoteness indicator* | 1526 | 1427 | 93.5 | 99 | 6.5 | |
| Urban | 345 | 22.6 | 305 | 88.4 | 40 | 11.6 |
| Semi-connected | 619 | 40.6 | 582 | 94.0 | 37 | 6.0 |
| Remote | 562 | 36.8 | 540 | 96.1 | 22 | 3.9 |
| Region | 1537 | 1436 | 93.4 | 101 | 6.6 | |
| Atlantic | 130 | 8.5 | 125 | 96.2 | 5 | 3.8 |
| British Columbia | 219 | 14.2 | 202 | 92.2 | 17 | 7.8 |
| Ontario | 284 | 18.5 | 265 | 93.3 | 19 | 6.7 |
| Prairies | 541 | 35.2 | 500 | 92.4 | 41 | 7.6 |
| Québec | 268 | 17.4 | 253 | 94.4 | 15 | 5.6 |
| Territories | 95 | 6.2 | 91 | 95.8 | 4 | 4.2 |
| Gender of ownership* | 1156 | 1065 | 92.1 | 91 | 7.9 | |
| Majority men-owned or equally-owned | 786 | 68.0 | 728 | 92.6 | 58 | 7.4 |
| Majority women-owned (51%+) | 370 | 32.0 | 337 | 91.1 | 33 | 8.9 |
*Please note category totals do not add up to the total number of SMEs due to missing data
Table 3A: Examples of remoteness indicator categories
| Remoteness indicator | Remoteness percent* | Examples |
|---|---|---|
| Urban | [0-15] | Toronto, Montréal, Vancouver, Ottawa, Calgary, Winnipeg |
| Semi-connected | (15-40] | Belleville, Saskatoon, Timmins, Thunder Bay, Whitehorse |
| Remote | (40-100] | Yellowknife, Gander, Happy Valley-Goose Bay, Iqaluit, Igloolik, Arctic Bay |
* Curly bracket indicates that percentage is excluded from range, while square bracket indicates that percentage falls within range
Table 4A: Results of weighted logistic regression model on likelihood of exporting for Indigenous SMEs, reported in odds ratios (where the dependent variable is whether the firm exported in 2020)
| (1) Weighted all characteristics model | |
|---|---|
| (Intercept) | 0.01*** |
| (0.71) | |
| Industry | |
| Administration and provision of public goods and services | 3.97· |
| (0.75) | |
| Agriculture, forestry, fishing, and hunting | 8.06* |
| (0.89) | |
| Arts, entertainment and recreation | 6.92* |
| (0.75) | |
| Health care and social assistance | 4.57· |
| (0.91) | |
| Logistic and infrastructure intensive industries | 0.97 |
| (0.85) | |
| Management and other knowledge-based services | 0.88 |
| (0.86) | |
| Manufacturing | 39.21*** |
| (0.71) | |
| Mining, quarrying, and oil and gas extraction | 1.61 |
| (1.97) | |
| Professional, scientific and technical services | 2.66 |
| (0.72) | |
| Retail trade | 5.92* |
| (0.70) | |
| Firm size | |
| 5-19 employees | 1.10 |
| (0.30) | |
| 20-99 employees | 0.36· |
| (0.58) | |
| 100-499 employees | 0.91 |
| (0.77) | |
| Other firm characteristics | |
| Within Indigenous community | 0.54* |
| (0.30) | |
| Virtual sales | 8.36*** |
| (0.30) | |
| Remoteness | |
| Semi-connected | 0.86 |
| (0.31) | |
| Remote | 0.28** |
| (0.44) | |
| Observations | 1457 |
| McFadden's adjusted R-squared | n.a |
| Signif. levels in percentages 0.1% ‘***’ 1% ‘**’ 5%‘*’ 10% ‘•’ | |
- Date modified: