
State of Trade 2024: Supply chains
ISSN 2562-8321
Table of contents
- Message from the Minister
- Executive summary
- Part 1: 2023 in review
- Part 2: Supply chains
- Bibliography
Message from the Minister
It gives me great pleasure to present Canada’s 2024 State of Trade Report, which offers a comprehensive snapshot of Canada’s economy and international trade in 2023.
Trade is an integral part of the Canadian economy. It represents two-thirds of Canada’s GDP and exports alone support nearly 3.3 million – or 1 in 6 – Canadian jobs. Despite a challenging global environment, 2023 showcased the resilience of Canadian trade. Our exports expanded by 1.4%, with imports following suit at 3.1%, a testament to the tenacity of Canadian importers and exporters.
These numbers underscore the world's continued confidence in Canadian goods, services, talent, and innovation. The world also continues to see Canada as a sound investment destination – our businesses and industries attracted over $60 billion in foreign direct investment in 2023.
All of this bodes well for Canadian businesses and investors looking to expand into new markets abroad. When they do, they create more good jobs, better opportunities, and a more robust economy here at home.
This is why Canada remains committed to strengthening rules-based international trade through our work with the World Trade Organization and, specifically, the Ottawa Group on WTO Reform, which Canada leads. Moreover, we remain committed to creating new opportunities in new markets – like the growing and dynamic economies of the Indo-Pacific region – through targeted Team Canada Trade Missions.
I invite you to explore this year's special feature on global supply chains, which highlights remarkable resilience in the face of challenges. Canada’s integration in global supply chains fosters productivity in Canadian businesses, diversifies consumer choice, and contributes to lower prices – undeniable benefits that call for ongoing innovation and adaptation as the global environment evolves.
Looking ahead, we will continue to promote Canadian businesses, industries, and innovation to the world while attracting foreign talent, capital and investment here. We will also continue to create opportunities to expand trade so that it benefits a wider range of entrepreneurs, consumers, and industries.
We continue these efforts knowing that robust trade leads to strong economies and a brighter future for Canadians from coast to coast to coast. I look forward to sharing the results of these successful efforts in future State of Trade reports.
The Honourable Mary Ng
Minister of International Trade, Export Promotion, Small Business and Economic Development
Executive summary
The global and Canadian economies slowed again in 2023 but were nonetheless resilient in the face of headwinds. After reaching record levels in 2022, inflation came down in several economies, but not without a cost. Monetary policy in many countries was restrictive, leading to a slowdown in investment and spending. Advanced economies saw a slowdown in growth to 1.6% in 2023, as weak growth in the European Union and a recession in the United Kingdom outweighed strength in the United States (U.S.) and Japan. In emerging markets and developing economies, growth picked up to 4.3% despite a weaker-than-expected reopening of the Chinese economy and ongoing conflict in Ukraine and the Middle East.
The global trade and investment landscape encountered obstacles such as heightened protectionism, maritime disruptions such as those in the Panama Canal and the Red Sea, and geopolitical tensions. Consequently, global trade volumes dipped notably, and preliminary data indicates subdued global investment for 2023. Overall, global economic growth slowed from 3.5% in 2022 to 3.2% in 2023.
The Canadian economy fared worse but managed to avoid a recession, with growth slowing from 3.8% in 2022 to 1.2% in 2023. Inflation eased from a 40-year peak of 6.8% in 2022 to 3.9% in 2023, slowing further in the first several months of 2024. However, as the Bank of Canada’s policy interest rates reached a 23-year high in 2023, investment and household spending were constrained throughout the year and the effects of higher rates are expected to linger. Household spending supported growth overall but decreased on a per-person basis. Net exports, supported by a strong U.S. economy, were the greatest contributor to growth in 2023.
Services led growth in 2023, expanding by 2.0%, while goods industries contracted by 1.2%. Transportation and warehousing services and public administration, driven largely by gains in local, municipal, regional, provincial, and territorial administrations, contributed the most to services growth. As the post-pandemic expansion in travel continued, and as more workers returned to the office, air travel and urban transit services drove the increase in transportation and warehousing. Conversely, the contraction in goods sectors was widespread, with the interest-rate-sensitive construction and agriculture sectors being significant detractors.
Despite another year of slow global growth and a contraction in global commodity prices, Canada’s international trade posted new records again in 2023. However, growth was much slower compared to the strength seen in 2022. Goods and services exports increased by 1.4% to reach $965.1 billion in 2023. This growth was entirely driven by services as goods exports contracted due to a decline in commodity prices, particularly for energy products. A robust increase in motor vehicle exports, supported by the continued improvement in international supply chains, partially offset the goods contraction. Meanwhile, travel exports drove services trade and finally surpassed their pre-pandemic levels. Goods and services imports increased by 3.1% to reach $978.2 billion, with goods and services advancing. As with exports, motor vehicles and travel drove import growth.
In another demonstration of resilience, Canada's flows of foreign direct investment returned to growth in 2023, after declining in 2022. More specifically, after declining 17.8% in 2022, Canadian direct investment abroad flows increased by 1.8% in 2023, while foreign direct investment flows in Canada increased by 3.7% (compared to -20.6% in 2022).
Despite yet another challenging year for global and Canadian economic growth, international trade and the supply chains underlying these transactions continued to hold up well. The State of Trade 2024 provides a comprehensive overview of the evolution of supply chains from before, during, and after the COVID-19 pandemic. International supply chains provide many benefits to Canadians and the Canadian economy. For Canadians, international supply chains help lower prices and increase choice, stability, and variety of products available. For Canadian firms, the benefits can be boiled down to increased productivity. International supply chains allow firms to specialize on core tasks, gain access to specialized inputs, create knowledge spillovers, and increase competition.
Supply chains held up well in the wake of the COVID-19 pandemic. The pandemic caused a shift in demand from services to consumer durables, which in turn put pressure on transportation infrastructure, causing delays at ports and rising costs in maritime shipping. However, world trade volumes rebounded quickly and were already at their pre-COVID-19 levels by November 2020. During the pandemic, Canadians were able to access most of the goods and services they needed. However, there were some notable disruptions, for example in microchips, which are an important input in many Canadian industries such as automotive manufacturing and are looked at more closely in the special feature.
Looking ahead, international supply chains face uncertainty stemming from climate change, human and organizational risks, environmental, social and governance concerns, and geopolitical shifts. There are many ways Canadian firms can bolster their resilience to these challenges, including through supplier diversification, inventory management, process innovation, or supply chain reconfiguration, including reshoring or nearshoring.
Reshoring is a possible response to the current risks facing international supply chains, but it is a costly endeavor for businesses that forgoes benefits provided by international supply chains to consumers and businesses alike. At the time of writing of the State of Trade, there is little evidence of Canadian firms reshoring. However, there is some indication that international supply chains are restructuring and changing the locations of some input sources (nearshoring). Businesses may find relocating to another country to be preferable to reshoring as they can address risks and/or vulnerabilities while continuing to profit from other countries’ comparative advantages.
The future of international supply chains and the challenges they pose to firms remain uncertain. However, their enduring benefits and the need for companies to adapt and innovate are clear. Canadian businesses must confront these challenges, fortify their supply chains, and integrate further into global trade networks to remain competitive.
Part 1: 2023 in review
At a glance
Global economic growth slowed in 2023 amidst still elevated inflation, tight financial conditions, and heightened geopolitical fragmentation.
- Global growth slows: The global economy was more resilient than expected but growth still slowed from 3.5% in 2022 to 3.2% in 2023. Growth in advanced economies (1.6%) slowed significantly while emerging markets and developing economies (4.3%) picked up slightly.
- The International Monetary Fund (IMF) expects global growth to hold at 3.2% in 2024.
- Trade struggles: World goods and services trade volumes slowed sharply, from 5.6% in 2022 to 0.3% in 2023, as the war in Ukraine, high inflation and tightened financial conditions all weighed on growth.
- World trade is forecasted to pick up to 3.0% in 2024 as inflation and financial conditions ease.
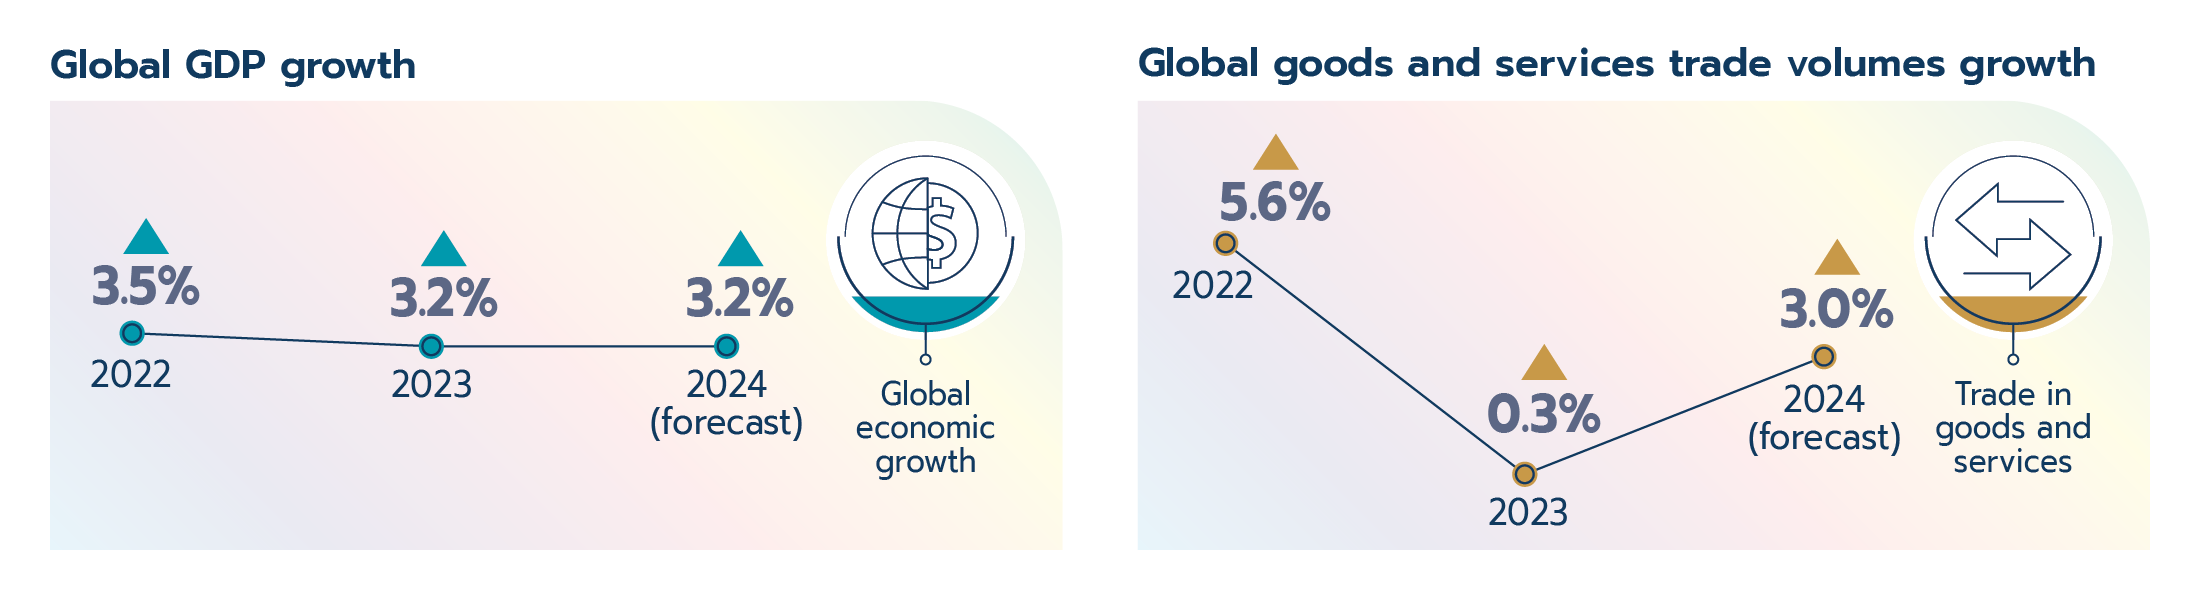
At a glance figure 1: Global GDP growth and Global goods and services trade volumes growth
Text version - At a glance figure 1
- Global GDP growth 2022: 3.5%
- Global GDP growth 2023: 3.2%
- Global GDP growth 2024 (forecast): 3.2%
- Global goods and services trade volumes growth 2022: 5.6%
- Global goods and services trade volumes growth 2023: 0.3%
- Global goods and services trade volumes growth 2024 (forecast): 3.0%
Canadian economic performance slowed sharply to 1.2% in 2023 – nonetheless, Canada saw the third strongest growth among G7 economies, behind the U.S. and Japan.
- Services led growth: Services industries (2.0%) led growth again in 2023, with transportation and warehousing services and public administration driving growth.
- Goods contract: Goods industries declined by 1.2% in 2023. The contraction was widespread, led by the interest-rate-sensitive construction industry.
- Inflation eases: Inflation slowed from a 40-year high of 6.8% in 2022 to 3.9% in 2023, supported by decreasing energy prices and tight monetary policy.
- Labour markets ease: Unemployment increased slightly to 5.4% in 2023 overall and ended the year at 5.8% in December. Job vacancies decreased while labour force participation was essentially unchanged.
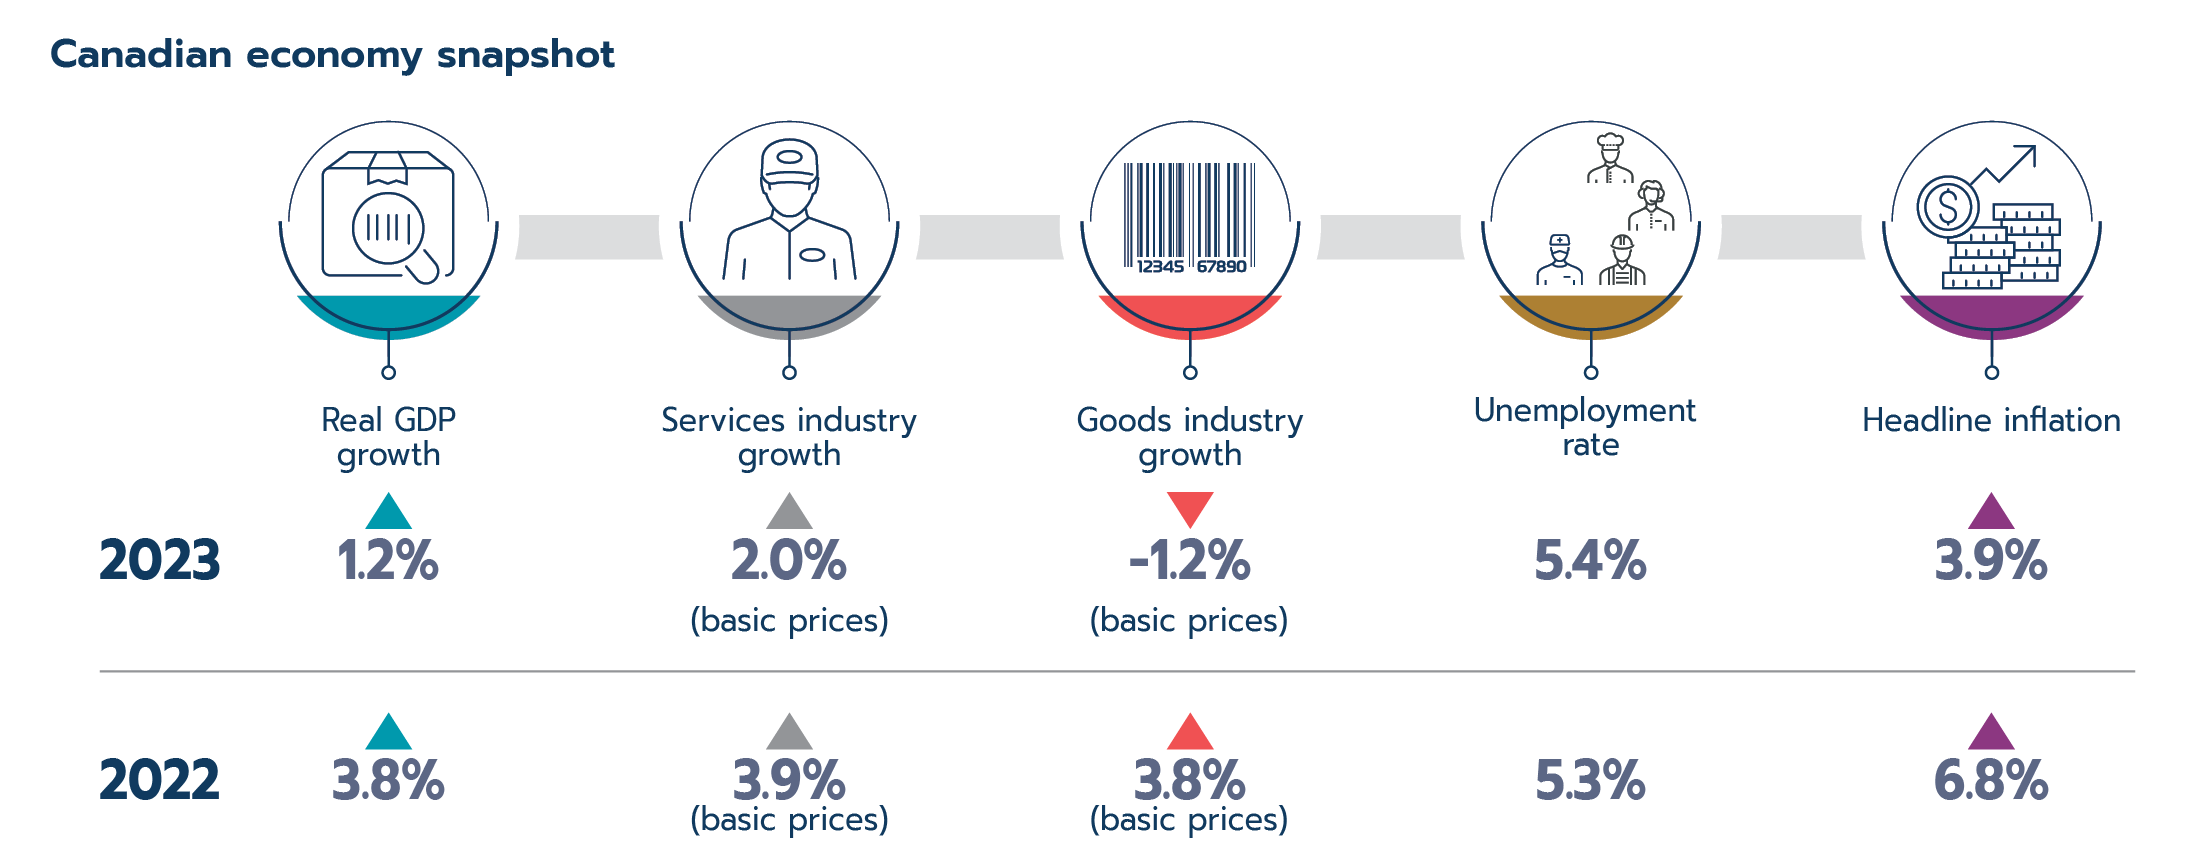
At a glance figure 2: Canadian economy snapshot
Text version - At a glance figure 2
- Canadian real GDP growth 2022: 3.8%
- Canadian real GDP growth 2023: 1.2%
- Services industry growth (basic prices) 2022: 3.9%
- Services industry growth (basic prices) 2023: 2.0%
- Goods industry growth (basic prices) 2022: 3.8%
- Goods industry growth (basic prices) 2023: -1.2%
- Unemployment rate 2022: 5.3%
- Unemployment rate 2023: 5.4%
- Headline inflation 2022: 6.8%
- Headline inflation 2023: 3.9%
Canadian exports and imports expanded despite a challenging global environment – two-way goods and services trade totalled $1.9 trillion in 2023.
- Trade growth moderates: Canadian goods and services export growth slowed markedly from 21.2% in 2022 to 1.4% in 2023. Growth was driven by services exports (13.8%) as goods (-1.4%) contracted. Travel services and motor vehicles and parts products posted strong gains.
- Goods and services imports growth (3.1%) outpaced export growth, with both services imports (10.1%) and goods imports (1.4%) advancing. As with exports, travel services and motor vehicles and parts products were the greatest contributors to import growth in 2023.
- As COVID-19-related restrictions were lifted, travel services exports and imports surpassed their pre-pandemic 2019 levels for the first time in 2023.
- Investment growth returns: After declining in 2022, Canada’s two-way international investment flows increased in 2023. Finance and insurance drove the increase in Canadian investment abroad, while manufacturing led foreign investment growth in Canada.
- In 2023, international investment inflows and outflows were higher than their respective historical averages (2010 – 2019) but remained below their 2021 levels.
At a glance figure 3: Canadian international trade and investment snapshot
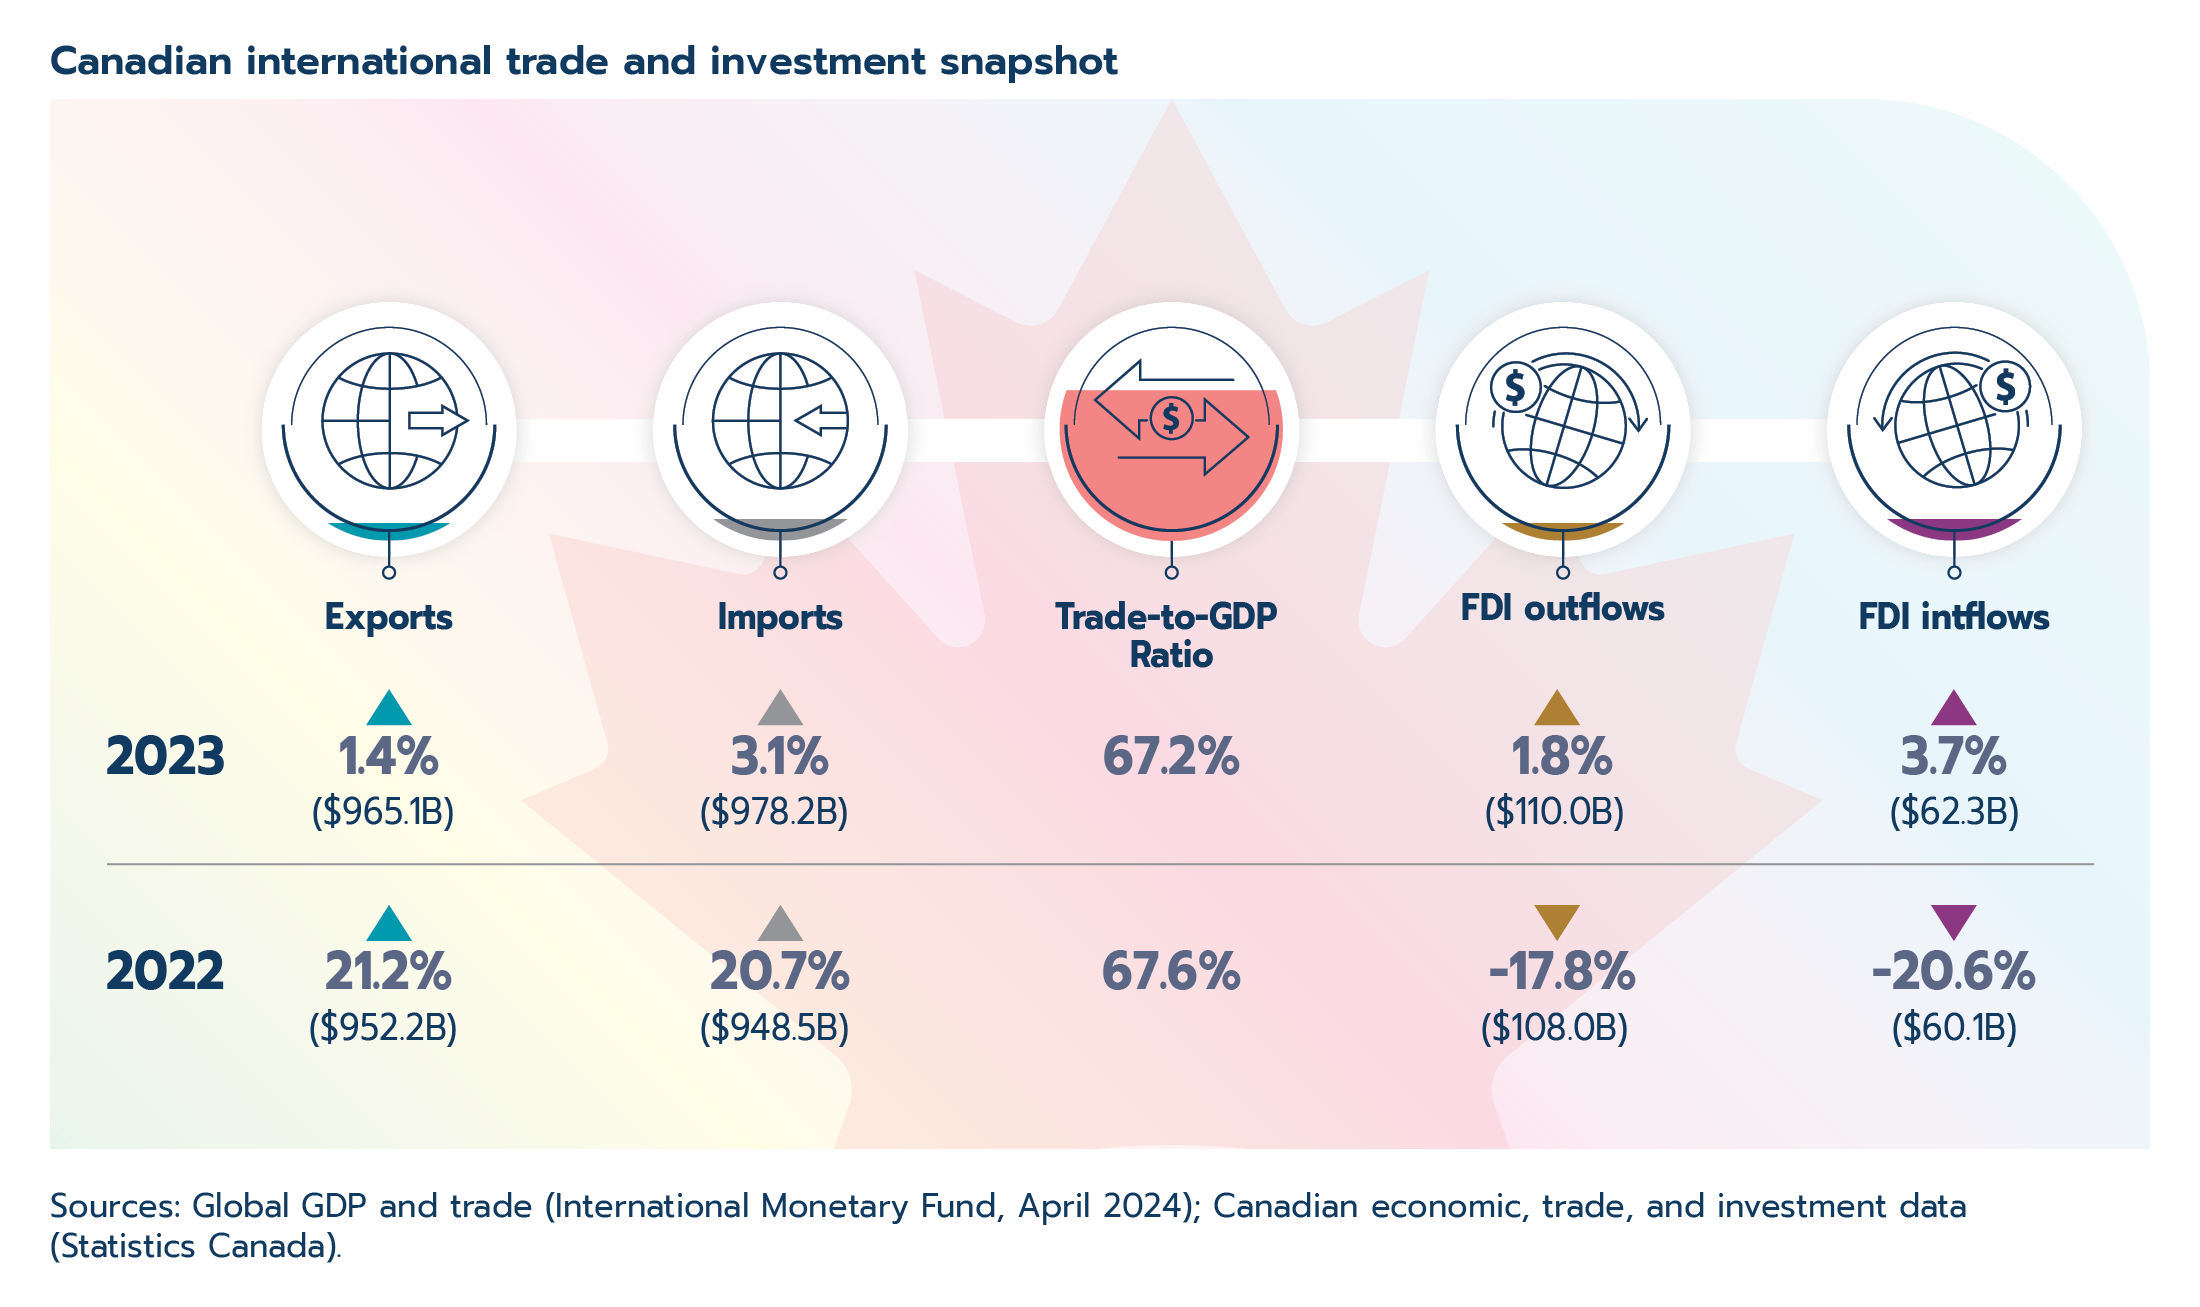
Sources: Global GDP and trade (International Monetary Fund, April 2024); Canadian economic, trade, and investment data (Statistics Canada).
Text version - At a glance figure 3
- Goods and services exports 2022: 21.2% ($952.2 billion)
- Goods and services exports 2023: 1.4% ($965.1 billion)
- Goods and services imports 2022: 20.7% ($948.5 billion)
- Goods and services imports 2023: 3.1% ($978.2 billion)
- Trade-to-GDP ratio 2022: 67.6%
- Trade-to-GDP ratio 2023: 67.2%
- Canadian FDI Outflows 2022: -17.8% ($108.0 billion)
- Canadian FDI Outflows 2023: 1.8% ($110.0 billion)
- Canadian FDI Inflows 2022: -20.6% ($60.1 billion)
- Canadian FDI Inflows 2023: 3.7% ($62.3 billion)
1.1 Introduction
After seeing historic inflation, the outbreak of war in Europe, and synchronized monetary policy tightening in 2022, prospects for 2023 were gloomy. Yet, resilience emerged as the prevailing narrative. While growth slowed, most advanced economies avoided recession territory, and growth in emerging markets and developing economies picked up. Inflation slowed in most regions, prompting rate cuts in some economies and talks of cuts in others, while labour markets remained relatively robust in the process.
Despite the overall resilience, the year had its fair share of trials—conflict in the Middle East, a weaker-than-expected Chinese economic reopening, struggling European growth, and rising geopolitical tensions all weighed on growth. Meanwhile, many low-income economies have yet to recover to their pre-pandemic output levels. Global trade and investment struggled amidst these challenges. For 2024, governments are expected to curtail spending, tightened monetary policy will continue to constrain growth, and underlying productivity growth is expected to be weak. As such, another year of sluggish economic performance is expected. In Part 1 of the State of Trade 2024, we look at the drivers of economic, trade and investment performance in the global and Canadian economies for 2023 and expectations for 2024.
1.2 Global context
At the start of 2023, economies around the world were scrambling to deal with record inflation. Whispers of stagflation, recessions, and general doom and gloom were commonplace. In a positive turn of events, the global economy was resilient in 2023: growth slowed, but the global economy still expanded, as growth in the United States (U.S.) and Japan surpassed expectations.
Several positive developments supported global growth in 2023. Inflation slowed in advanced economies, as well as in emerging markets and developing economies, which averaged 4.6% and 8.3% respectively. A contraction in global energy prices by roughly 29.9% certainly helped (World Bank Group, 2024), as did tighter monetary policy in many economies. Labour markets remained relatively robust in advanced economies, with lower-than-expected unemployment helping consumption spending tick along. Importantly, supportive fiscal policy, particularly in advanced economies, contributed to the 2023 expansion. Indeed, in some major markets, government spending outpaced economic growth.
Yet 2023 was not without its share of challenges. War raged on in Ukraine, and renewed conflict broke out in the Middle East, with devastating human costs and subsequent consequences for global growth. Despite inflation declining, food inflation is still high in many countries, with the greatest impacts faced by vulnerable populations. Higher interest rates have also placed more than half of all low-income economies at risk of financial distress (IMF, 2023).
Overall, global economic growth slowed from 3.5% in 2022 to 3.2% in 2023, remaining below pre-pandemic global growth (3.7%). Advanced economies led the slowdown, with growth slowing significantly from 2.6% in 2022 to 1.6% in 2023. Meanwhile, emerging markets and developing economies exceeded expectations, with growth picking up to 4.3% in 2023.
Figure 1.1: Advanced economies drove slowdown while emerging markets picked up
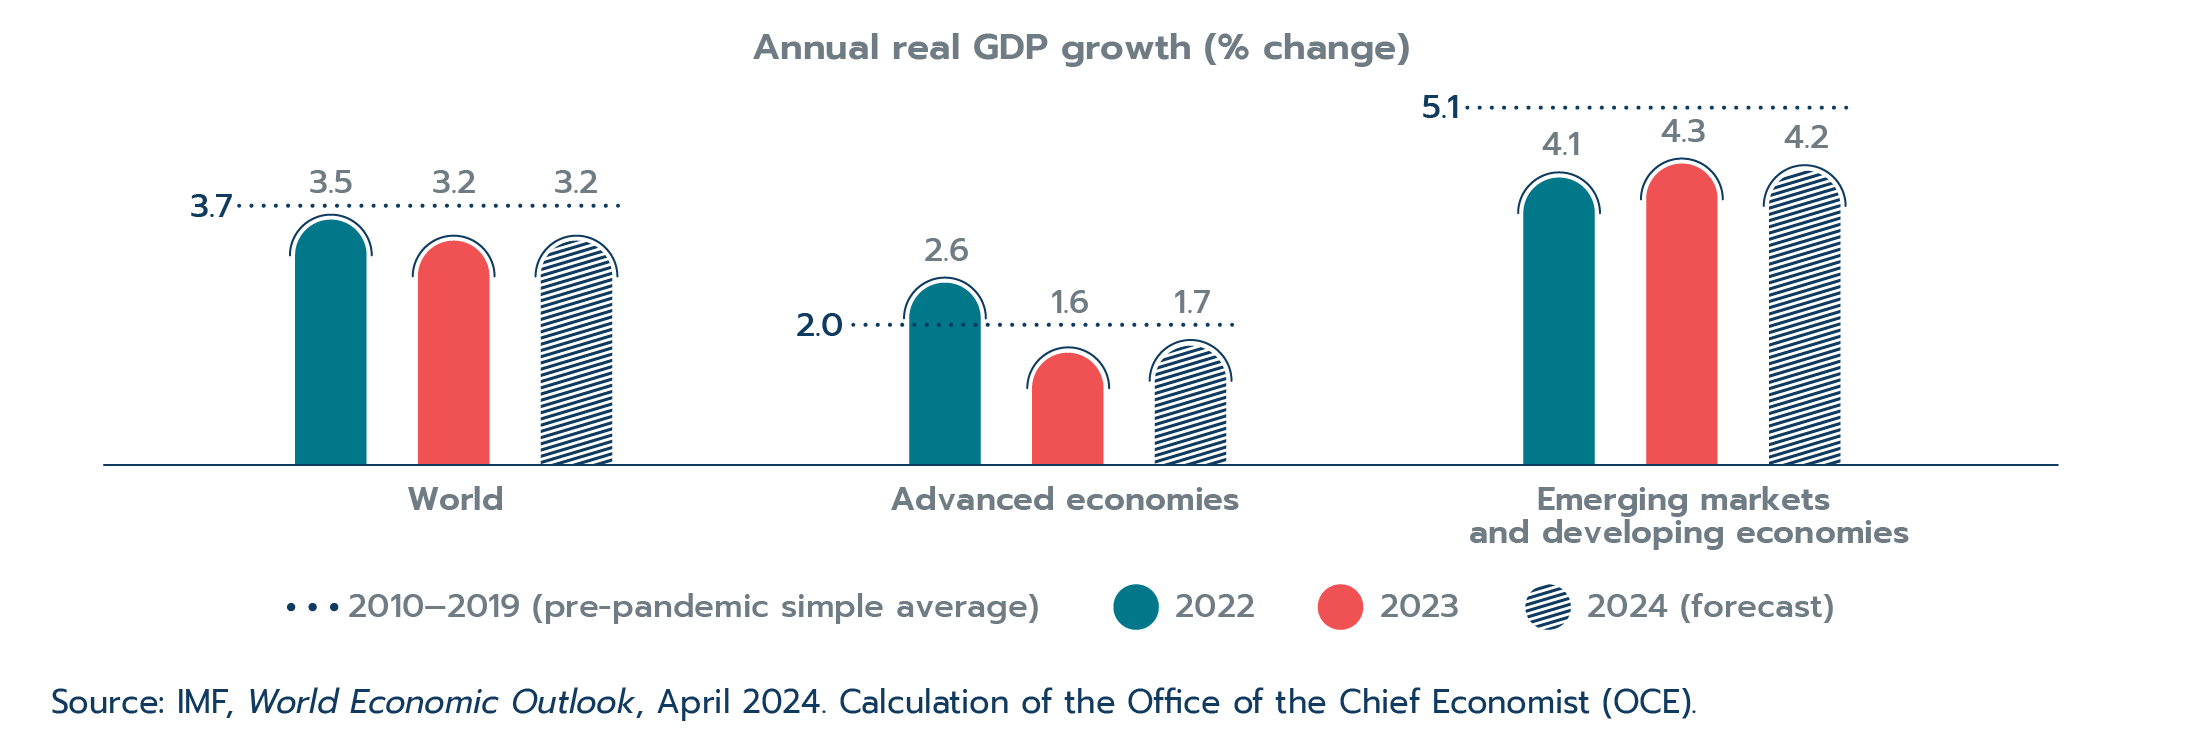
Source: IMF, World Economic Outlook, April 2024. Calculation of the Office of the Chief Economist (OCE).
Text version - Figure 1.1
| GDP growth | 2010-2019 (pre-pandemic simple average) | 2022 | 2023 | 2024 (forecast) |
|---|---|---|---|---|
| World | 3.7 | 3.5 | 3.2 | 3.2 |
| Advanced economies | 2.0 | 2.6 | 1.6 | 1.7 |
| Emerging markets and developing economies | 5.1 | 4.1 | 4.3 | 4.2 |
The U.S. led growth in advanced economies, despite a historically rapid rise in interest rates, consumer spending, supported by a still healthy labour market, and robust government spending supported growth. U.S. economic growth surpassed expectations by accelerating from 1.9% in 2022 to 2.5% in 2023. A rebound in fixed investment and net exports helped economic growth in Japan increase from roughly 1.0% in 2022 to 1.9%. Nonetheless, a marked slowdown in the euro area, the United Kingdom (U.K.), and Canada outweighed faster growth in the U.S. and Japan.
The ongoing war in Ukraine, inflation, and high interest rates took their toll on euro area economic growth, which fell sharply from 3.4% in 2022 to 0.4% in 2023. Germany stands out within the euro area as the economy experienced a full-year recession (-0.3%) in 2023. Similar challenges plagued the U.K.; the economy advanced by only 0.1% in 2023 after entering a technical recession with negative growth during the third and fourth quarters of the year.
In emerging markets, a growth rebound in China and Russia was offset by a slowdown in Latin America, the Middle East, and Africa. The rapid and unexpected removal of China’s COVID-19-related restrictions did not produce the economic boom that many expected. China also faced significant issues in its property sector throughout the year. Even so, China managed growth of 5.2% in 2023, an improvement from the 20-year low growth seen in 2022 (excluding 2020). Despite posting slower growth in 2023, India (7.8%) and Indonesia (5.0%), the second and sixth largest emerging markets, grew faster than other emerging markets and developing economies. Tight global financial conditions and inflation continued to pull down growth in other emerging markets and developing economies overall. Meanwhile, Saudia Arabia (-0.8%) dipped into a recession as global energy prices fell.
Global trade and investment
Global goods and services trade volumes slowed markedly, from 5.6% in 2022 to 0.3% in 2023. Advanced economies (0.3%) and emerging markets and developing economies (0.6%) saw trade growth slow significantly. While further improvement in global supply chains and the removal of pandemic-related restrictions in China supported trade, the lingering effects of the war in Ukraine, high inflation and tightened financial conditions all weighed on growth in 2023. Moreover, attacks on ships travelling through the Red Sea decreased trade volumes in the final few weeks of the year. Beyond these challenges, geopolitical fragmentation is working against trade growth: in 2023, roughly 3,388 new trade restrictions were imposed globally (Global Trade Alert, 2024).
Figure 1.2: Goods and services trade volumes growth halted in 2023
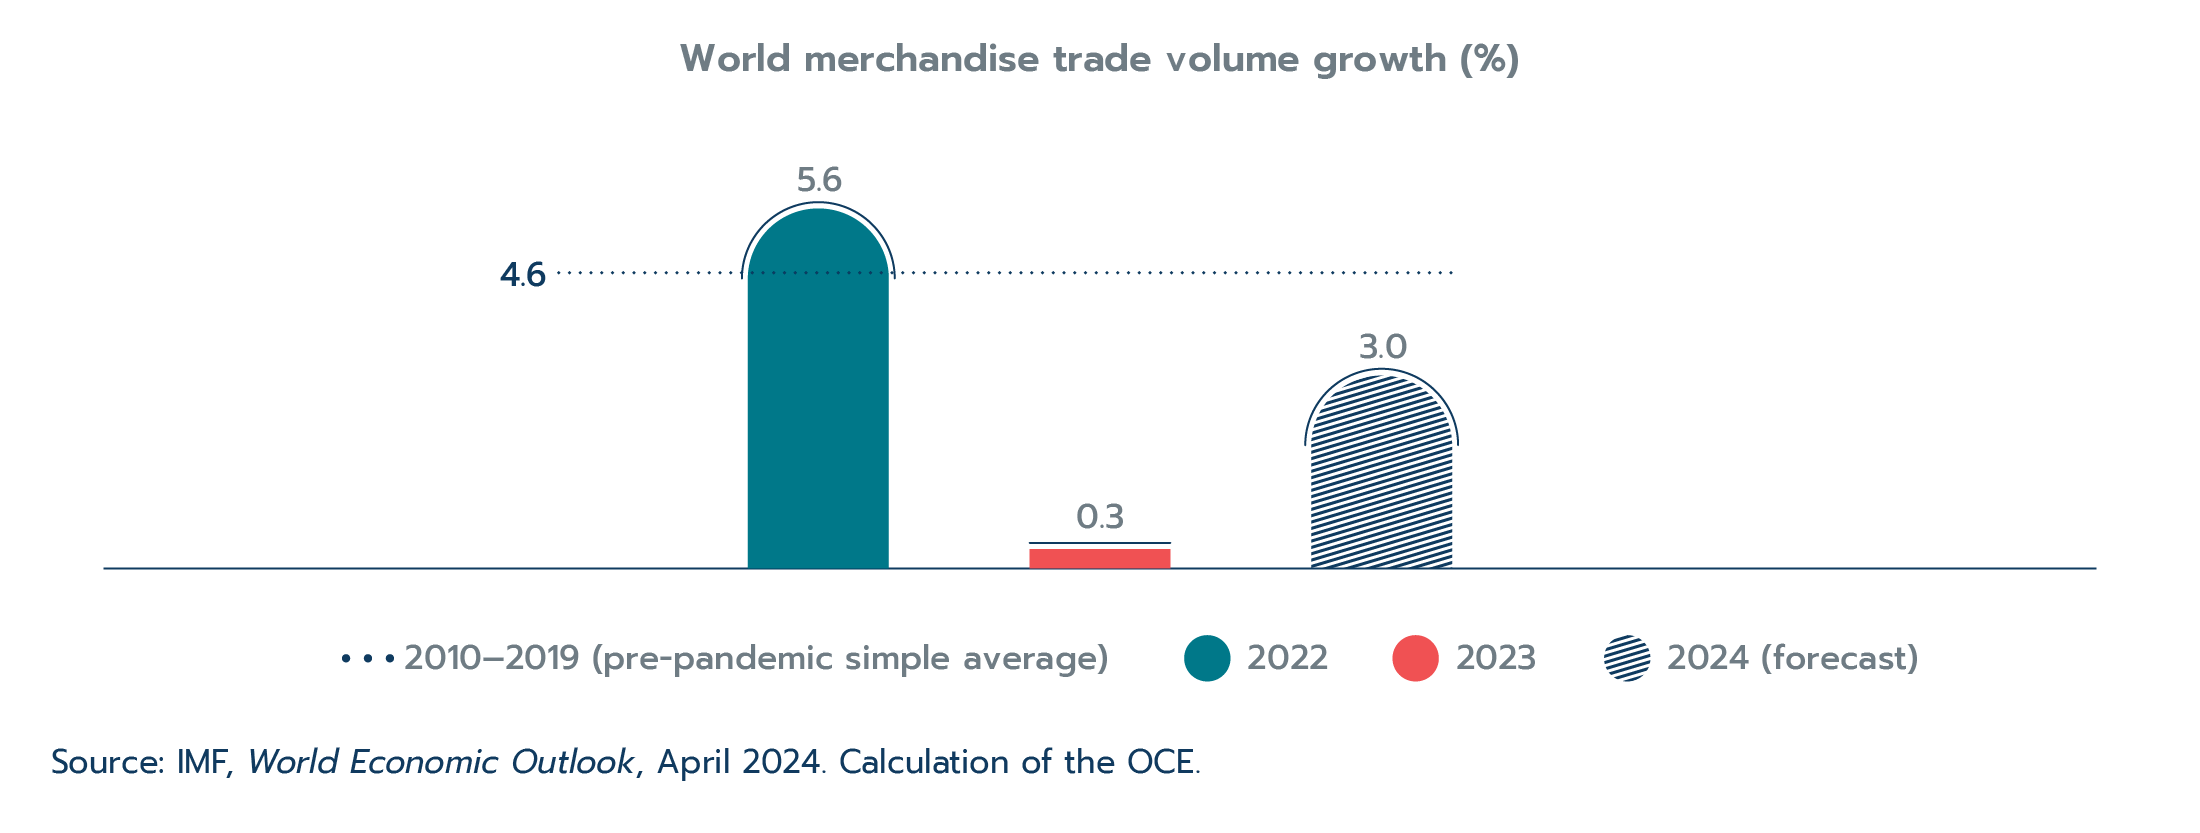
Source: IMF, World Economic Outlook, April 2024. Calculation of the OCE.
Text version - Figure 1.2
| Pre-pandemic simple average 2010 ‒ 2019 | 2022 | 2023 | 2024 (forecast) | |
|---|---|---|---|---|
| Goods and services trade volumes (year-over-year % change) | 4.6% | 5.6% | 0.3% | 3.0% |
Box 1.1: Maritime trade disruptions in 2023
Thanks to the size of modern ships, the creation of key infrastructure, and the dominance of container shipping, transporting goods by water is far cheaper than it is by plane, train, or truck. In fact, the efficiency of shipping products internationally was an important driver of the rise in international supply chains (see the special feature on supply chains). Today, over 80% of goods traded globally travel by water – equivalent to over $20 trillion in 2023, or roughly seven times Canada’s GDP.Footnote 1 However, recent events have highlighted the multiple factors that can adversely impact maritime trade.
Historic drought conditions driven by climate change in the Panama Canal left canal authorities with no choice but to implement transit caps—the number of ships passing through the canal was gradually reduced from a pre-drought average of 36 ships to just 18 ships in February 2024 (Panama Canal Authority, 2024). While the number of ships able to transit the canal has since increased, the canal was operating well below historic capacity for over four months, and as of March 2024, it was still operating at about 70% capacity. Consequently, trade volumes in the Panama Canal were 32% lower in the first two months of 2024 compared to the first two months of 2023.
Meanwhile, halfway across the world, 2023 ended with a Yemeni militant group attacking ships travelling the Red Sea. The Red Sea fared worse than the Panama Canal, with trade volumes down 59% in the first two months of 2024 compared to the first two months of 2023. As of May 2024, trade volumes in both transit ways were still suppressed.
Figure 1.3: Trade volumes decline in Red Sea and Panama Canal
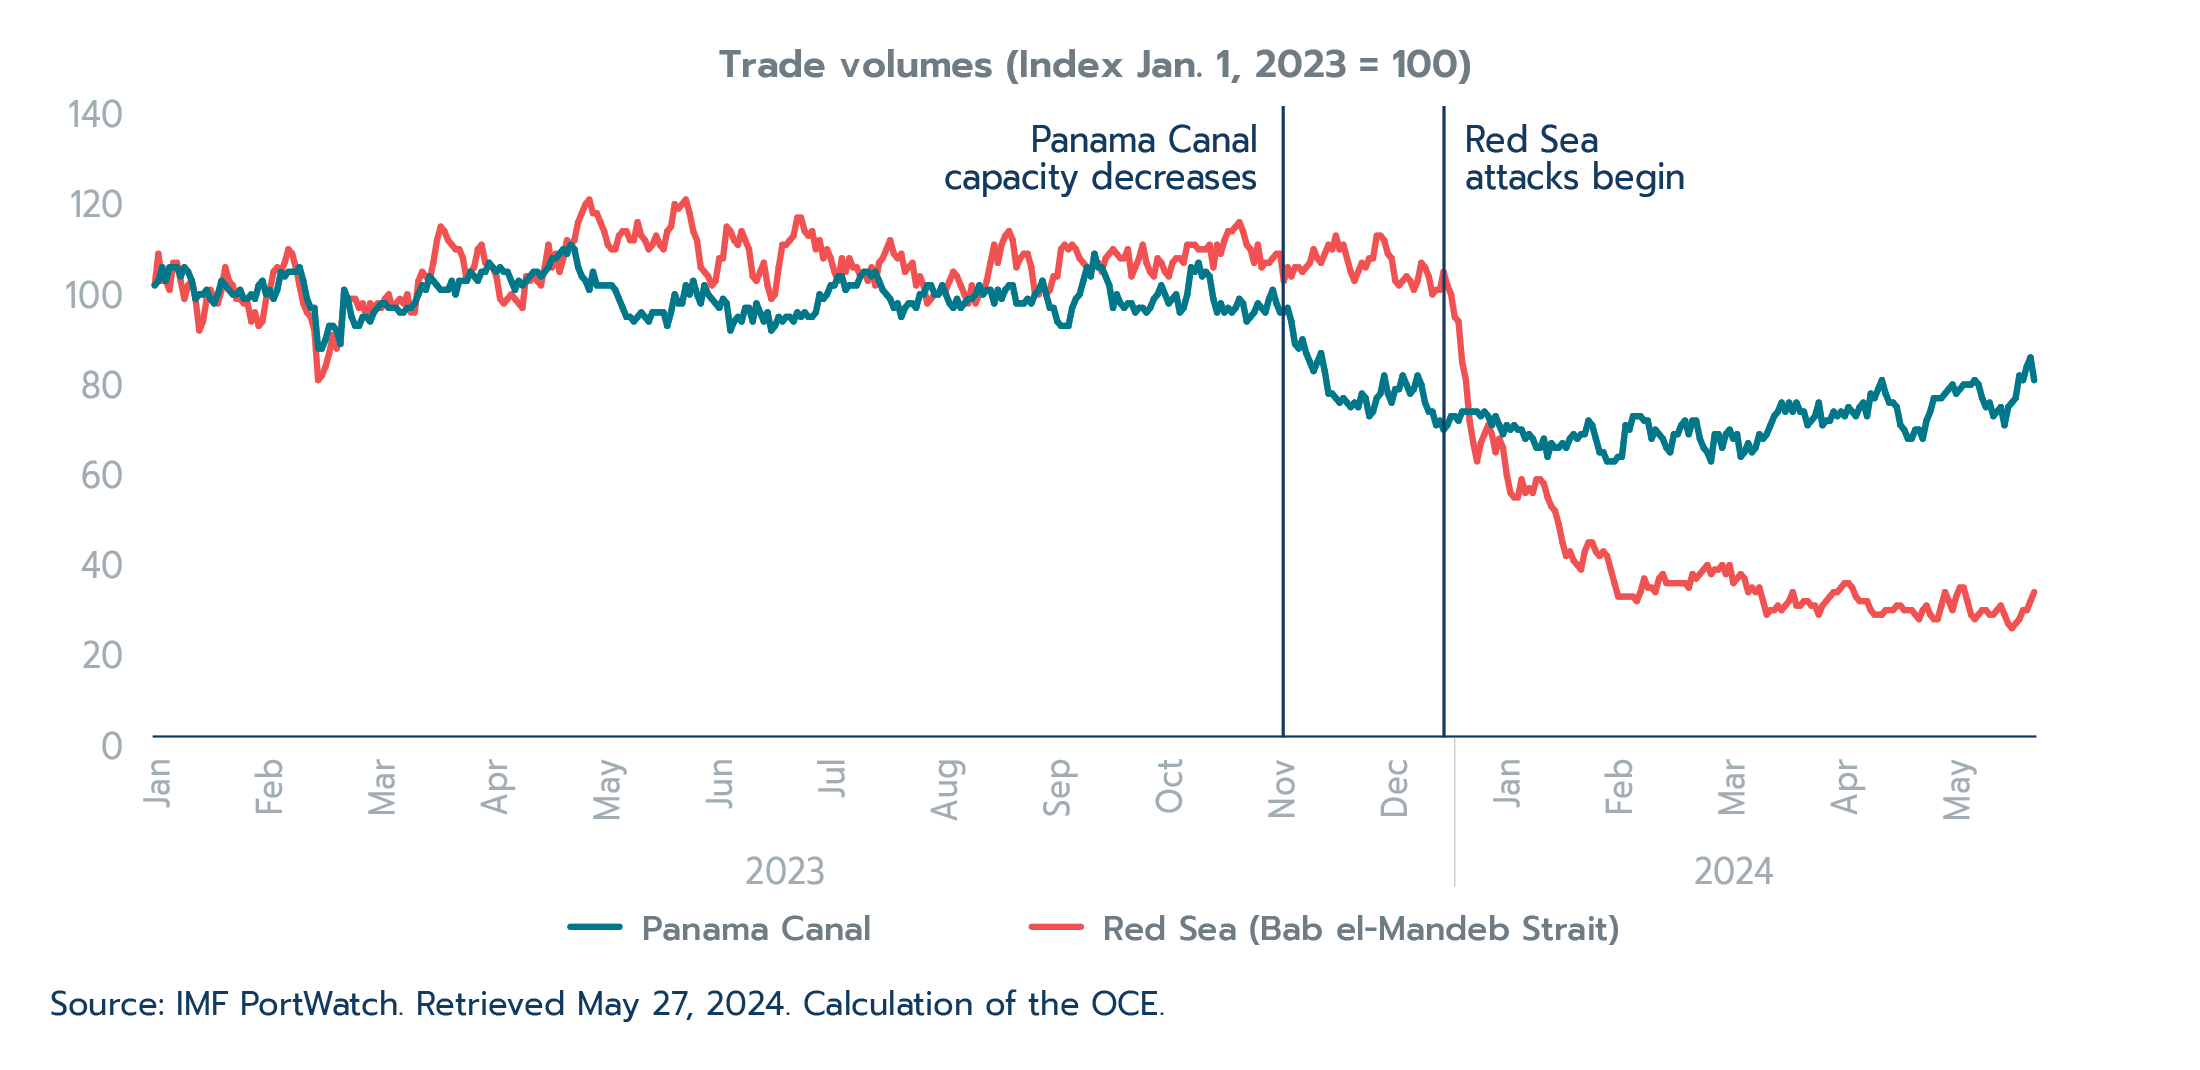
Source: IMF PortWatch. Retrieved May 27, 2024. Calculation of the OCE.
Text version - Figure 1.3
| Trade volumes (index January 1, 2023 = 100) | Panama Canal | Red Sea (Bab el-Mandeb Strait) |
|---|---|---|
| 2023-01-01 | 100 | 100 |
| 2023-01-01 | 100 | 100 |
| 2023-01-02 | 101 | 107 |
| 2023-01-03 | 104 | 101 |
| 2023-01-04 | 101 | 101 |
| 2023-01-05 | 104 | 99 |
| 2023-01-06 | 104 | 105 |
| 2023-01-07 | 104 | 105 |
| 2023-01-08 | 102 | 101 |
| 2023-01-09 | 104 | 97 |
| 2023-01-10 | 103 | 100 |
| 2023-01-11 | 101 | 101 |
| 2023-01-12 | 97 | 97 |
| 2023-01-13 | 98 | 90 |
| 2023-01-14 | 98 | 92 |
| 2023-01-15 | 99 | 97 |
| 2023-01-16 | 97 | 99 |
| 2023-01-17 | 96 | 97 |
| 2023-01-18 | 98 | 96 |
| 2023-01-19 | 101 | 99 |
| 2023-01-20 | 100 | 104 |
| 2023-01-21 | 99 | 101 |
| 2023-01-22 | 98 | 100 |
| 2023-01-23 | 98 | 97 |
| 2023-01-24 | 99 | 97 |
| 2023-01-25 | 97 | 96 |
| 2023-01-26 | 97 | 96 |
| 2023-01-27 | 98 | 92 |
| 2023-01-28 | 97 | 94 |
| 2023-01-29 | 100 | 91 |
| 2023-01-30 | 101 | 92 |
| 2023-01-31 | 98 | 97 |
| 2023-02-01 | 99 | 99 |
| 2023-02-02 | 97 | 103 |
| 2023-02-03 | 99 | 104 |
| 2023-02-04 | 103 | 103 |
| 2023-02-05 | 102 | 105 |
| 2023-02-06 | 103 | 108 |
| 2023-02-07 | 103 | 107 |
| 2023-02-08 | 103 | 104 |
| 2023-02-09 | 104 | 100 |
| 2023-02-10 | 101 | 96 |
| 2023-02-11 | 97 | 94 |
| 2023-02-12 | 95 | 93 |
| 2023-02-13 | 95 | 90 |
| 2023-02-14 | 86 | 79 |
| 2023-02-15 | 86 | 80 |
| 2023-02-16 | 88 | 82 |
| 2023-02-17 | 91 | 85 |
| 2023-02-18 | 91 | 89 |
| 2023-02-19 | 90 | 86 |
| 2023-02-20 | 87 | 89 |
| 2023-02-21 | 99 | 97 |
| 2023-02-22 | 97 | 97 |
| 2023-02-23 | 93 | 97 |
| 2023-02-24 | 91 | 97 |
| 2023-02-25 | 91 | 95 |
| 2023-02-26 | 93 | 96 |
| 2023-02-27 | 93 | 93 |
| 2023-02-28 | 92 | 96 |
| 2023-03-01 | 94 | 95 |
| 2023-03-02 | 95 | 96 |
| 2023-03-03 | 96 | 95 |
| 2023-03-04 | 96 | 97 |
| 2023-03-05 | 95 | 98 |
| 2023-03-06 | 95 | 95 |
| 2023-03-07 | 95 | 96 |
| 2023-03-08 | 94 | 97 |
| 2023-03-09 | 94 | 96 |
| 2023-03-10 | 95 | 98 |
| 2023-03-11 | 95 | 94 |
| 2023-03-12 | 96 | 94 |
| 2023-03-13 | 98 | 101 |
| 2023-03-14 | 100 | 103 |
| 2023-03-15 | 99 | 102 |
| 2023-03-16 | 102 | 101 |
| 2023-03-17 | 101 | 105 |
| 2023-03-18 | 100 | 110 |
| 2023-03-19 | 99 | 113 |
| 2023-03-20 | 99 | 112 |
| 2023-03-21 | 99 | 110 |
| 2023-03-22 | 101 | 109 |
| 2023-03-23 | 98 | 108 |
| 2023-03-24 | 101 | 108 |
| 2023-03-25 | 101 | 106 |
| 2023-03-26 | 101 | 101 |
| 2023-03-27 | 103 | 103 |
| 2023-03-28 | 102 | 104 |
| 2023-03-29 | 101 | 108 |
| 2023-03-30 | 103 | 109 |
| 2023-03-31 | 103 | 105 |
| 2023-04-01 | 105 | 105 |
| 2023-04-02 | 104 | 104 |
| 2023-04-03 | 103 | 102 |
| 2023-04-04 | 104 | 97 |
| 2023-04-05 | 103 | 96 |
| 2023-04-06 | 103 | 97 |
| 2023-04-07 | 101 | 98 |
| 2023-04-08 | 99 | 97 |
| 2023-04-09 | 101 | 96 |
| 2023-04-10 | 100 | 95 |
| 2023-04-11 | 101 | 102 |
| 2023-04-12 | 102 | 101 |
| 2023-04-13 | 103 | 102 |
| 2023-04-14 | 103 | 101 |
| 2023-04-15 | 102 | 100 |
| 2023-04-16 | 103 | 104 |
| 2023-04-17 | 104 | 109 |
| 2023-04-18 | 106 | 104 |
| 2023-04-19 | 106 | 107 |
| 2023-04-20 | 107 | 103 |
| 2023-04-21 | 108 | 106 |
| 2023-04-22 | 107 | 110 |
| 2023-04-23 | 109 | 109 |
| 2023-04-24 | 108 | 110 |
| 2023-04-25 | 104 | 114 |
| 2023-04-26 | 102 | 116 |
| 2023-04-27 | 101 | 118 |
| 2023-04-28 | 99 | 119 |
| 2023-04-29 | 103 | 116 |
| 2023-04-30 | 100 | 116 |
| 2023-05-01 | 100 | 114 |
| 2023-05-02 | 100 | 112 |
| 2023-05-03 | 100 | 109 |
| 2023-05-04 | 100 | 108 |
| 2023-05-05 | 99 | 108 |
| 2023-05-06 | 97 | 111 |
| 2023-05-07 | 95 | 112 |
| 2023-05-08 | 93 | 112 |
| 2023-05-09 | 93 | 110 |
| 2023-05-10 | 92 | 110 |
| 2023-05-11 | 93 | 114 |
| 2023-05-12 | 94 | 111 |
| 2023-05-13 | 93 | 110 |
| 2023-05-14 | 92 | 108 |
| 2023-05-15 | 94 | 109 |
| 2023-05-16 | 94 | 111 |
| 2023-05-17 | 94 | 109 |
| 2023-05-18 | 94 | 108 |
| 2023-05-19 | 91 | 112 |
| 2023-05-20 | 94 | 113 |
| 2023-05-21 | 98 | 118 |
| 2023-05-22 | 96 | 117 |
| 2023-05-23 | 96 | 118 |
| 2023-05-24 | 100 | 119 |
| 2023-05-25 | 98 | 116 |
| 2023-05-26 | 101 | 112 |
| 2023-05-27 | 98 | 110 |
| 2023-05-28 | 96 | 104 |
| 2023-05-29 | 100 | 103 |
| 2023-05-30 | 98 | 102 |
| 2023-05-31 | 97 | 100 |
| 2023-06-01 | 96 | 101 |
| 2023-06-02 | 95 | 106 |
| 2023-06-03 | 97 | 106 |
| 2023-06-04 | 96 | 113 |
| 2023-06-05 | 90 | 112 |
| 2023-06-06 | 92 | 110 |
| 2023-06-07 | 93 | 109 |
| 2023-06-08 | 92 | 112 |
| 2023-06-09 | 95 | 110 |
| 2023-06-10 | 95 | 108 |
| 2023-06-11 | 92 | 102 |
| 2023-06-12 | 96 | 101 |
| 2023-06-13 | 94 | 103 |
| 2023-06-14 | 92 | 105 |
| 2023-06-15 | 94 | 100 |
| 2023-06-16 | 90 | 97 |
| 2023-06-17 | 91 | 98 |
| 2023-06-18 | 93 | 104 |
| 2023-06-19 | 92 | 109 |
| 2023-06-20 | 93 | 109 |
| 2023-06-21 | 93 | 110 |
| 2023-06-22 | 92 | 111 |
| 2023-06-23 | 94 | 115 |
| 2023-06-24 | 93 | 115 |
| 2023-06-25 | 94 | 112 |
| 2023-06-26 | 93 | 111 |
| 2023-06-27 | 93 | 112 |
| 2023-06-28 | 94 | 108 |
| 2023-06-29 | 98 | 110 |
| 2023-06-30 | 97 | 106 |
| 2023-07-01 | 98 | 108 |
| 2023-07-02 | 100 | 106 |
| 2023-07-03 | 100 | 103 |
| 2023-07-04 | 102 | 101 |
| 2023-07-05 | 102 | 106 |
| 2023-07-06 | 99 | 103 |
| 2023-07-07 | 100 | 106 |
| 2023-07-08 | 100 | 104 |
| 2023-07-09 | 100 | 104 |
| 2023-07-10 | 102 | 102 |
| 2023-07-11 | 103 | 103 |
| 2023-07-12 | 103 | 101 |
| 2023-07-13 | 102 | 104 |
| 2023-07-14 | 103 | 100 |
| 2023-07-15 | 101 | 105 |
| 2023-07-16 | 99 | 106 |
| 2023-07-17 | 98 | 108 |
| 2023-07-18 | 97 | 110 |
| 2023-07-19 | 95 | 107 |
| 2023-07-20 | 96 | 106 |
| 2023-07-21 | 93 | 107 |
| 2023-07-22 | 95 | 103 |
| 2023-07-23 | 96 | 104 |
| 2023-07-24 | 96 | 105 |
| 2023-07-25 | 95 | 100 |
| 2023-07-26 | 98 | 102 |
| 2023-07-27 | 98 | 100 |
| 2023-07-28 | 100 | 96 |
| 2023-07-29 | 100 | 97 |
| 2023-07-30 | 98 | 98 |
| 2023-07-31 | 98 | 98 |
| 2023-08-01 | 100 | 99 |
| 2023-08-02 | 98 | 99 |
| 2023-08-03 | 96 | 101 |
| 2023-08-04 | 95 | 103 |
| 2023-08-05 | 97 | 102 |
| 2023-08-06 | 95 | 100 |
| 2023-08-07 | 96 | 98 |
| 2023-08-08 | 97 | 96 |
| 2023-08-09 | 97 | 100 |
| 2023-08-10 | 98 | 96 |
| 2023-08-11 | 100 | 98 |
| 2023-08-12 | 98 | 98 |
| 2023-08-13 | 99 | 101 |
| 2023-08-14 | 99 | 105 |
| 2023-08-15 | 96 | 109 |
| 2023-08-16 | 99 | 105 |
| 2023-08-17 | 97 | 109 |
| 2023-08-18 | 99 | 111 |
| 2023-08-19 | 100 | 112 |
| 2023-08-20 | 100 | 110 |
| 2023-08-21 | 96 | 104 |
| 2023-08-22 | 96 | 106 |
| 2023-08-23 | 96 | 107 |
| 2023-08-24 | 97 | 107 |
| 2023-08-25 | 96 | 104 |
| 2023-08-26 | 98 | 98 |
| 2023-08-27 | 99 | 98 |
| 2023-08-28 | 101 | 101 |
| 2023-08-29 | 98 | 98 |
| 2023-08-30 | 95 | 99 |
| 2023-08-31 | 95 | 102 |
| 2023-09-01 | 92 | 102 |
| 2023-09-02 | 91 | 108 |
| 2023-09-03 | 91 | 109 |
| 2023-09-04 | 91 | 108 |
| 2023-09-05 | 95 | 109 |
| 2023-09-06 | 97 | 108 |
| 2023-09-07 | 98 | 106 |
| 2023-09-08 | 101 | 105 |
| 2023-09-09 | 104 | 104 |
| 2023-09-10 | 102 | 103 |
| 2023-09-11 | 107 | 105 |
| 2023-09-12 | 104 | 105 |
| 2023-09-13 | 104 | 103 |
| 2023-09-14 | 102 | 106 |
| 2023-09-15 | 100 | 107 |
| 2023-09-16 | 95 | 108 |
| 2023-09-17 | 98 | 107 |
| 2023-09-18 | 96 | 106 |
| 2023-09-19 | 95 | 106 |
| 2023-09-20 | 96 | 108 |
| 2023-09-21 | 96 | 102 |
| 2023-09-22 | 94 | 104 |
| 2023-09-23 | 95 | 106 |
| 2023-09-24 | 95 | 109 |
| 2023-09-25 | 94 | 105 |
| 2023-09-26 | 95 | 103 |
| 2023-09-27 | 97 | 102 |
| 2023-09-28 | 98 | 106 |
| 2023-09-29 | 100 | 105 |
| 2023-09-30 | 98 | 103 |
| 2023-10-01 | 96 | 102 |
| 2023-10-02 | 97 | 105 |
| 2023-10-03 | 98 | 106 |
| 2023-10-04 | 94 | 106 |
| 2023-10-05 | 95 | 105 |
| 2023-10-06 | 98 | 109 |
| 2023-10-07 | 104 | 109 |
| 2023-10-08 | 103 | 109 |
| 2023-10-09 | 105 | 108 |
| 2023-10-10 | 102 | 108 |
| 2023-10-11 | 103 | 108 |
| 2023-10-12 | 102 | 109 |
| 2023-10-13 | 97 | 104 |
| 2023-10-14 | 94 | 109 |
| 2023-10-15 | 96 | 107 |
| 2023-10-16 | 94 | 110 |
| 2023-10-17 | 95 | 112 |
| 2023-10-18 | 94 | 112 |
| 2023-10-19 | 95 | 113 |
| 2023-10-20 | 97 | 114 |
| 2023-10-21 | 96 | 112 |
| 2023-10-22 | 92 | 109 |
| 2023-10-23 | 93 | 108 |
| 2023-10-24 | 94 | 105 |
| 2023-10-25 | 96 | 109 |
| 2023-10-26 | 95 | 104 |
| 2023-10-27 | 94 | 105 |
| 2023-10-28 | 97 | 105 |
| 2023-10-29 | 99 | 106 |
| 2023-10-30 | 96 | 107 |
| 2023-10-31 | 94 | 107 |
| 2023-11-01 | 94 | 101 |
| 2023-11-02 | 95 | 104 |
| 2023-11-03 | 92 | 102 |
| 2023-11-04 | 87 | 104 |
| 2023-11-05 | 86 | 104 |
| 2023-11-06 | 88 | 103 |
| 2023-11-07 | 85 | 104 |
| 2023-11-08 | 83 | 105 |
| 2023-11-09 | 81 | 108 |
| 2023-11-10 | 83 | 106 |
| 2023-11-11 | 85 | 105 |
| 2023-11-12 | 81 | 107 |
| 2023-11-13 | 76 | 109 |
| 2023-11-14 | 76 | 108 |
| 2023-11-15 | 75 | 111 |
| 2023-11-16 | 74 | 108 |
| 2023-11-17 | 75 | 109 |
| 2023-11-18 | 74 | 106 |
| 2023-11-19 | 73 | 103 |
| 2023-11-20 | 74 | 101 |
| 2023-11-21 | 73 | 103 |
| 2023-11-22 | 76 | 105 |
| 2023-11-23 | 75 | 104 |
| 2023-11-24 | 71 | 106 |
| 2023-11-25 | 72 | 106 |
| 2023-11-26 | 75 | 111 |
| 2023-11-27 | 76 | 111 |
| 2023-11-28 | 80 | 110 |
| 2023-11-29 | 76 | 107 |
| 2023-11-30 | 74 | 106 |
| 2023-12-01 | 77 | 101 |
| 2023-12-02 | 77 | 100 |
| 2023-12-03 | 80 | 101 |
| 2023-12-04 | 78 | 102 |
| 2023-12-05 | 76 | 101 |
| 2023-12-06 | 77 | 99 |
| 2023-12-07 | 80 | 101 |
| 2023-12-08 | 78 | 105 |
| 2023-12-09 | 74 | 104 |
| 2023-12-10 | 72 | 102 |
| 2023-12-11 | 72 | 98 |
| 2023-12-12 | 69 | 99 |
| 2023-12-13 | 70 | 99 |
| 2023-12-14 | 68 | 103 |
| 2023-12-15 | 69 | 100 |
| 2023-12-16 | 71 | 98 |
| 2023-12-17 | 71 | 93 |
| 2023-12-18 | 70 | 92 |
| 2023-12-19 | 72 | 83 |
| 2023-12-20 | 72 | 79 |
| 2023-12-21 | 72 | 70 |
| 2023-12-22 | 72 | 65 |
| 2023-12-23 | 72 | 61 |
| 2023-12-24 | 71 | 65 |
| 2023-12-25 | 72 | 67 |
| 2023-12-26 | 71 | 69 |
| 2023-12-27 | 69 | 67 |
| 2023-12-28 | 71 | 63 |
| 2023-12-29 | 69 | 66 |
| 2023-12-30 | 67 | 64 |
| 2023-12-31 | 69 | 58 |
| 2024-01-01 | 68 | 54 |
| 2024-01-02 | 69 | 53 |
| 2024-01-03 | 68 | 53 |
| 2024-01-04 | 68 | 57 |
| 2024-01-05 | 66 | 54 |
| 2024-01-06 | 67 | 55 |
| 2024-01-07 | 66 | 54 |
| 2024-01-08 | 64 | 57 |
| 2024-01-09 | 64 | 57 |
| 2024-01-10 | 66 | 56 |
| 2024-01-11 | 62 | 53 |
| 2024-01-12 | 65 | 51 |
| 2024-01-13 | 64 | 50 |
| 2024-01-14 | 64 | 47 |
| 2024-01-15 | 65 | 43 |
| 2024-01-16 | 64 | 40 |
| 2024-01-17 | 66 | 41 |
| 2024-01-18 | 67 | 39 |
| 2024-01-19 | 66 | 38 |
| 2024-01-20 | 67 | 37 |
| 2024-01-21 | 67 | 41 |
| 2024-01-22 | 70 | 43 |
| 2024-01-23 | 69 | 43 |
| 2024-01-24 | 66 | 41 |
| 2024-01-25 | 63 | 40 |
| 2024-01-26 | 63 | 41 |
| 2024-01-27 | 61 | 40 |
| 2024-01-28 | 61 | 37 |
| 2024-01-29 | 61 | 34 |
| 2024-01-30 | 62 | 31 |
| 2024-01-31 | 62 | 31 |
| 2024-02-01 | 69 | 31 |
| 2024-02-02 | 68 | 31 |
| 2024-02-03 | 71 | 31 |
| 2024-02-04 | 71 | 30 |
| 2024-02-05 | 71 | 32 |
| 2024-02-06 | 70 | 35 |
| 2024-02-07 | 70 | 33 |
| 2024-02-08 | 66 | 33 |
| 2024-02-09 | 68 | 32 |
| 2024-02-10 | 67 | 35 |
| 2024-02-11 | 66 | 36 |
| 2024-02-12 | 64 | 34 |
| 2024-02-13 | 63 | 34 |
| 2024-02-14 | 67 | 34 |
| 2024-02-15 | 67 | 34 |
| 2024-02-16 | 69 | 34 |
| 2024-02-17 | 70 | 34 |
| 2024-02-18 | 67 | 33 |
| 2024-02-19 | 70 | 36 |
| 2024-02-20 | 70 | 35 |
| 2024-02-21 | 66 | 36 |
| 2024-02-22 | 64 | 37 |
| 2024-02-23 | 63 | 39 |
| 2024-02-24 | 61 | 36 |
| 2024-02-25 | 67 | 37 |
| 2024-02-26 | 67 | 37 |
| 2024-02-27 | 64 | 38 |
| 2024-02-28 | 67 | 36 |
| 2024-02-29 | 68 | 38 |
| 2024-03-01 | 66 | 34 |
| 2024-03-02 | 67 | 35 |
| 2024-03-03 | 62 | 36 |
| 2024-03-04 | 63 | 35 |
| 2024-03-05 | 65 | 32 |
| 2024-03-06 | 63 | 33 |
| 2024-03-07 | 64 | 32 |
| 2024-03-08 | 67 | 33 |
| 2024-03-09 | 66 | 30 |
| 2024-03-10 | 67 | 27 |
| 2024-03-11 | 69 | 28 |
| 2024-03-12 | 71 | 28 |
| 2024-03-13 | 72 | 29 |
| 2024-03-14 | 74 | 28 |
| 2024-03-15 | 72 | 29 |
| 2024-03-16 | 74 | 30 |
| 2024-03-17 | 72 | 32 |
| 2024-03-18 | 74 | 29 |
| 2024-03-19 | 72 | 29 |
| 2024-03-20 | 72 | 30 |
| 2024-03-21 | 69 | 30 |
| 2024-03-22 | 70 | 29 |
| 2024-03-23 | 71 | 29 |
| 2024-03-24 | 74 | 27 |
| 2024-03-25 | 69 | 29 |
| 2024-03-26 | 70 | 30 |
| 2024-03-27 | 70 | 31 |
| 2024-03-28 | 72 | 32 |
| 2024-03-29 | 71 | 32 |
| 2024-03-30 | 72 | 33 |
| 2024-03-31 | 71 | 34 |
| 2024-04-01 | 73 | 34 |
| 2024-04-02 | 72 | 33 |
| 2024-04-03 | 71 | 31 |
| 2024-04-04 | 73 | 30 |
| 2024-04-05 | 74 | 30 |
| 2024-04-06 | 71 | 30 |
| 2024-04-07 | 76 | 28 |
| 2024-04-08 | 75 | 27 |
| 2024-04-09 | 77 | 27 |
| 2024-04-10 | 79 | 27 |
| 2024-04-11 | 76 | 28 |
| 2024-04-12 | 74 | 28 |
| 2024-04-13 | 74 | 28 |
| 2024-04-14 | 73 | 29 |
| 2024-04-15 | 69 | 29 |
| 2024-04-16 | 68 | 28 |
| 2024-04-17 | 66 | 28 |
| 2024-04-18 | 66 | 28 |
| 2024-04-19 | 68 | 27 |
| 2024-04-20 | 68 | 26 |
| 2024-04-21 | 66 | 28 |
| 2024-04-22 | 70 | 29 |
| 2024-04-23 | 72 | 27 |
| 2024-04-24 | 75 | 26 |
| 2024-04-25 | 75 | 26 |
| 2024-04-26 | 75 | 29 |
| 2024-04-27 | 76 | 32 |
| 2024-04-28 | 77 | 30 |
| 2024-04-29 | 78 | 28 |
| 2024-04-30 | 76 | 31 |
| 2024-05-01 | 77 | 33 |
| 2024-05-02 | 78 | 33 |
| 2024-05-03 | 78 | 30 |
| 2024-05-04 | 78 | 27 |
| 2024-05-05 | 79 | 26 |
| 2024-05-06 | 78 | 27 |
| 2024-05-07 | 75 | 28 |
| 2024-05-08 | 73 | 28 |
| 2024-05-09 | 74 | 27 |
| 2024-05-10 | 71 | 27 |
| 2024-05-11 | 72 | 28 |
| 2024-05-12 | 73 | 29 |
| 2024-05-13 | 69 | 27 |
| 2024-05-14 | 73 | 25 |
| 2024-05-15 | 74 | 24 |
| 2024-05-16 | 75 | 25 |
| 2024-05-17 | 80 | 26 |
| 2024-05-18 | 79 | 28 |
| 2024-05-19 | 82 | 28 |
| 2024-05-20 | 84 | 30 |
| 2024-05-21 | 79 | 32 |
The Panama Canal and the Red Sea routes combined account for roughly 20% of global maritime trade volumes; finding alternative routes or transport modes can be costly. For example, beyond the Red Sea, the next best alternative for ships travelling from Asia to Northern Europe is to travel around the southern tip of Africa, a journey that adds an additional week or two to transit times. Delays of this length significantly impact fuel, insurance, and other costs.
By the end of February 2024, maritime freight prices had increased by 162% on average in response. Price increases for sailings from China to Northern Europe, one of the most affected routes, peaked at approximately 274% in mid-January. While this is a significant uptick, these events have, so far, had a much smaller impact than the COVID-19 pandemic, when prices increased nearly eight-fold given the simultaneous supply and demand shock.
Figure 1.4: Global maritime freight prices spike
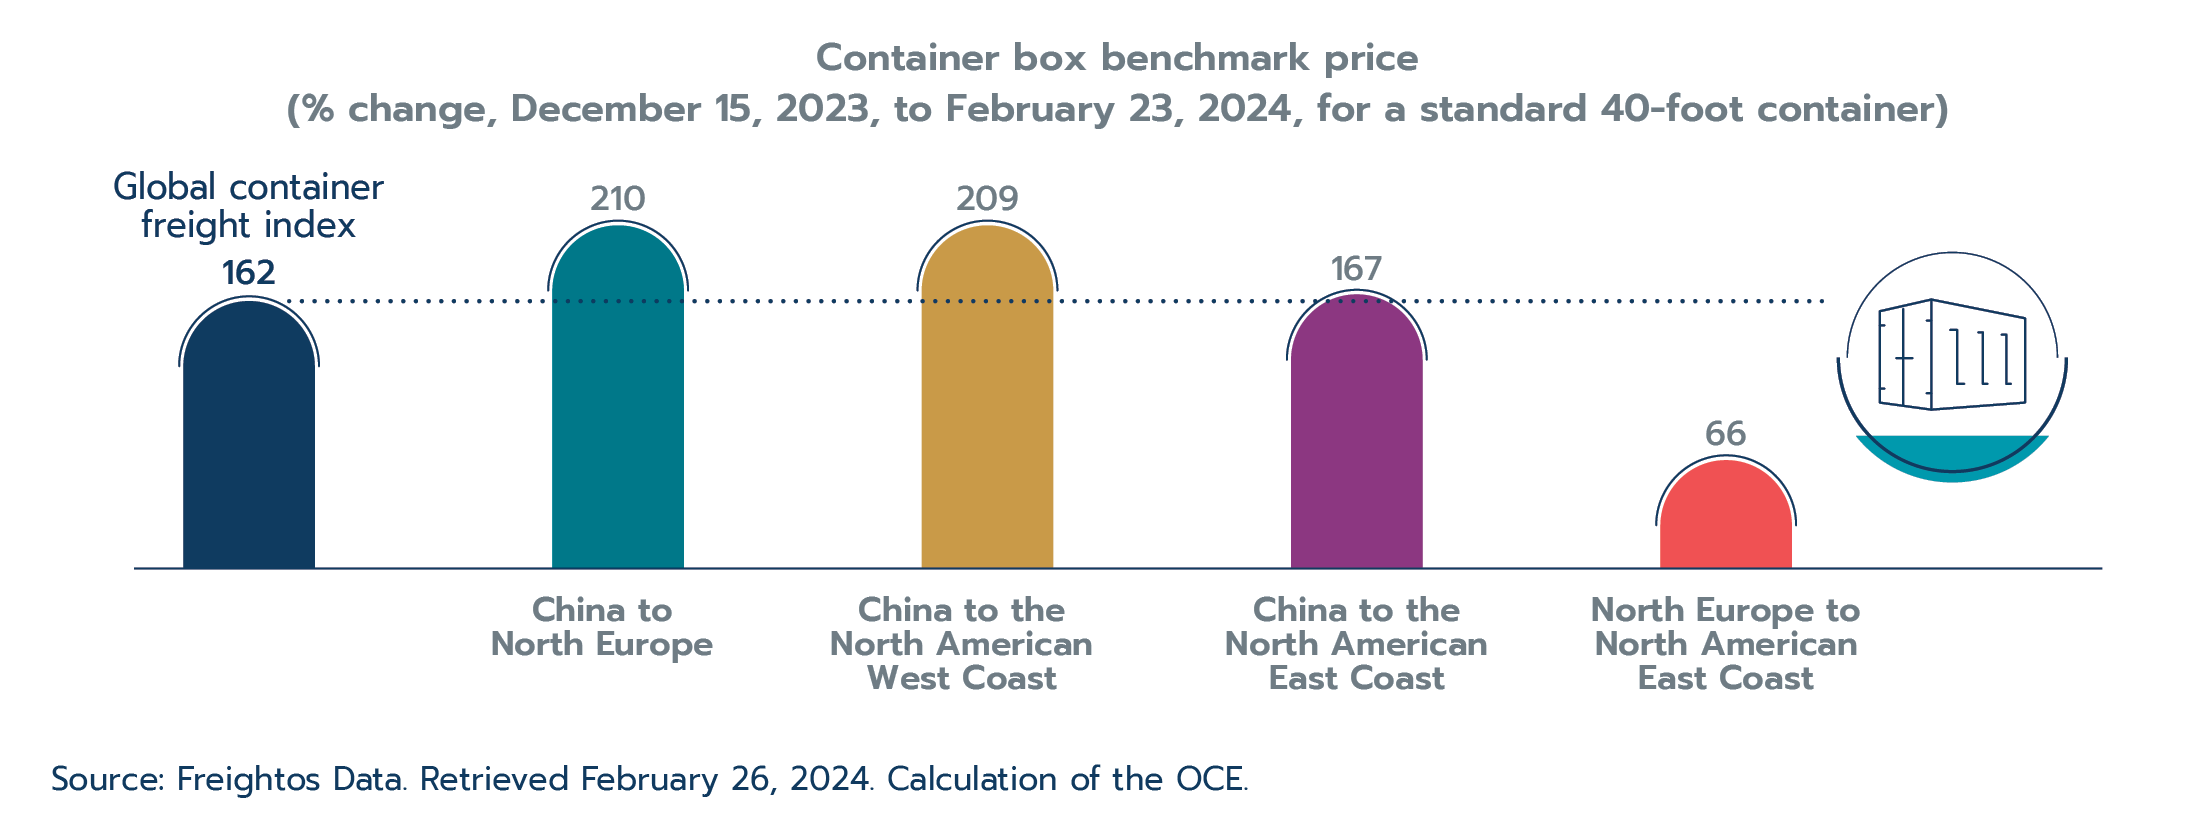
Source: Freightos Data. Retrieved February 26, 2024. Calculations of the OCE.
Text version - Figure 1.4
| Container box | Benchmark price |
|---|---|
| Global container freight index | 162 |
| China to North Europe | 210 |
| China to the North American West Coast | 209 |
| China to the North American East Coast | 167 |
| North Europe to North American East Coast | 66 |
Despite being smaller than the price increases seen in the wake of the COVID-19 disruptions, these events put upward pressure on the cost of goods globally at a time when much of the world continues to combat high inflation. The IMF estimates that when global shipping costs double, they add roughly 0.7 percentage points to the global inflation rate (Carrière-Swallow et al., 2022). In the case of the Panama Canal and the Red Sea disruptions, Oxford Economics estimates that they could add roughly 0.25 percentage points to U.S. inflation in 2024 (Sweet, 2024).
Adding fuel to the fire, 2023 also saw maritime shipping disrupted by strikes at major ports, including the Port of Vancouver and the Port of Prince Rupert. The strikes in British Columbia lasted for 13 days in the summer of 2023, causing major disruptions. Moreover, as of May 2024, there is a risk that longshore workers at the Port of Montréal and workers operating ports on the East Coast and Gulf Coast of the U.S. will strike. Shipping on the East Coast U.S. was also disrupted by the collapse of the Francis Scott Key Bridge in Baltimore on March 26, 2024. Trade volumes in the Port of Baltimore, which accounts for nearly 3% of U.S. maritime trade, fell sharply in the immediate aftermath (IMF PortWatch, 2024). The Port of Halifax is one of the top ten largest ports to send and receive ships from Baltimore and may experience higher unplanned volumes, which could result in delays. However, the disruptions are unlikely to have a significant impact on global shipping prices or the Canadian economy.
Ultimately, there have always been risks to maritime shipping, and the industry is used to adapting to disruptions, whether they are driven by environmental, geopolitical, labour, or other factors. Another recent example of this adaptation is when shippers rerouted from the Black Sea to ports on the Danube River in the wake of the war in Ukraine. However, if the frequency and severity of these risks increase, such as what might occur if environmental risks continue their current trajectory (Lee et al., 2023), trade transportation costs could increase in a more meaningful and permanent way. This would negatively impact global trade and economic growth.
With restrictive financial conditions globally and a continued rise in geopolitical fragmentation, global investment fell in 2023. Based on preliminary data from the United Nations Conference on Trade and Development (UNCTAD), global foreign direct investment (FDI) flows contracted by 18% once flows to European conduit economies are removed. In developed economies, flows contracted by 28% as flows to Europe and other developed economies contracted, while flows to North America posted zero growth. FDI flows to developing economies declined by 9%, led by a 12% contraction in flows to Asia. Importantly, FDI flows to China contracted by 6% in 2023, reflecting the country’s financial market and macroeconomic troubles that year.
Preliminary data also showed that cross-border mergers and acquisitions (M&A) sales contracted for the second year in a row (UNCTAD, 2024). The contraction was widespread across all major regions. Meanwhile, announcements for greenfield investments decreased in 2023 (-6%), but the value of projects announced increased (6%), which may support a recovery of FDI flows in 2024.
Looking ahead
While the global economy was more resilient than anticipated in 2023, it is on uncertain footing heading into 2024. The IMF expects global economic growth to remain at 3.2% in 2024 (Figure 1.1), with balanced upside and downside risks. If this growth rate materializes, it would be consistent with a soft landing (i.e., avoiding widespread, deep recessions).
Whether inflation successfully comes back into target range—the process for which is anticipated to be a tricky balancing act—is an important determinant of the IMF’s outlook. Several factors could fuel inflation in 2023. Trade logistics issues, such as those in the Red Sea and Panama Canal, could worsen. Multiple forces could cause global energy prices to spike again, such as an intensification of the ongoing conflict in the Middle East. Furthermore, labour market tightness could persist, or extreme weather events could lead to higher food prices. Any of these events might lead central banks to keep interest rates higher for longer. On the other hand, a faster easing of labour market tightness, stronger pass-through of lower energy prices, or a decrease in the corporate profit margin to avoid further price increases could all lead to a slowdown in the rate of inflation, resulting in central banks lowering interest rates sooner than anticipated.
In advanced economies, the IMF forecasts growth will pick up marginally from 1.6% in 2023 to 1.7% in 2024. The U.S. is forecast to lead growth as it continues to exceptional performance, increasing from 2.5% in 2023 to 2.7% in 2024. The euro area and the U.K. will continue to drag down growth in advanced economies, expanding by just 0.8% and 0.5%, respectively, in 2024. Growth in emerging markets and developing economies is forecast to slow marginally from 4.3% in 2023 to 4.2% in 2024. A slowdown in emerging Asia and Latin America is forecast to be offset by an uptick in the Middle East and Central Asia, as well as Sub-Saharan Africa. Despite its upswing in 2023, China’s economy faces several headwinds. China’s growth is forecast to slow from 5.2% in 2023 to 4.6% in 2024. Meanwhile, India is a potential beneficiary of global supply chain diversification. It will be a growth leader among emerging markets in 2024 but is still forecast to slow, from 7.8% in 2023 to 6.8% in 2024.
If the baseline outlook for the global economy holds and financial restrictions begin to ease, trade and investment should benefit. The IMF forecasts that goods and services trade volumes will rebound in 2024, advancing 3.0%. UNCTAD predicts that a modest increase in FDI flows in 2024 is also possible. Of course, if trade logistics issues persist, global debt burdens prove too much, or geopolitical fragmentation worsens, trade and investment may underperform these estimates.
Box 1.2: Harmful trade measures are rising
The year 2023 was another pernicious year for trade policy. Harmful trade measures are on the rise and industrial policies in many economies are increasingly protectionist. Over time, these measures could sap economic growth.
In 2023, nearly 3,400 new harmful trade and investment measures were implemented globally, while only 908 liberalizing measures were implemented.Footnote 2 The average number of new harmful measures implemented between 2020 and 2023 was three times higher compared to measures implemented between 2016 and 2019. China and Germany were the most affected countries, with over 1,100 harmful measures affecting them in 2023. Over 850 harmful measures affected Canada that year.
Figure 1.5: Protectionism has grown substantially post-pandemic
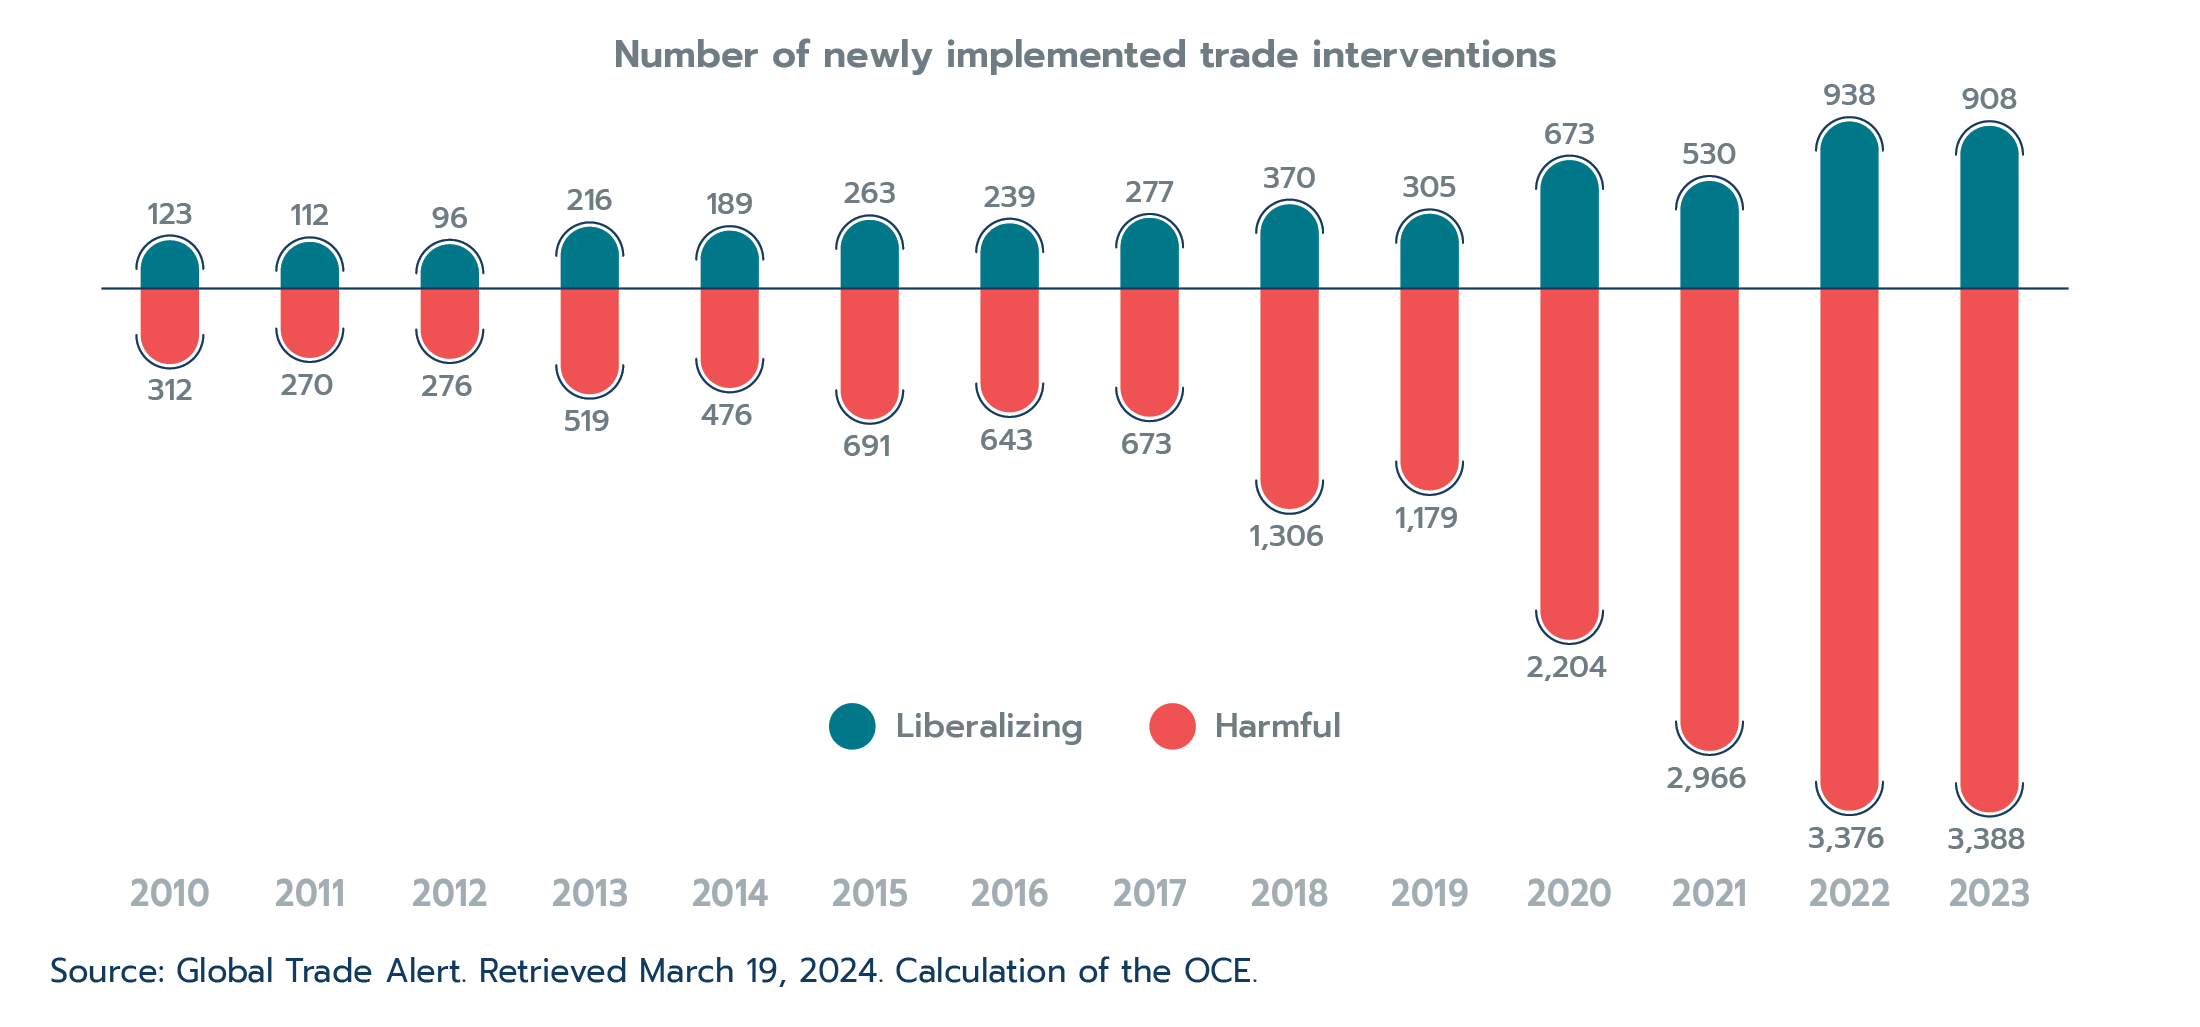
Source: Global Trade Alert. Retrieved March 19, 2024. Calculation of the OCE.
Text version - Figure 1.5
| Number of newly implemented trade interventions | Harmful | Liberalizing |
|---|---|---|
| 2010 | 312 | 123 |
| 2011 | 270 | 112 |
| 2012 | 276 | 96 |
| 2013 | 519 | 216 |
| 2014 | 476 | 189 |
| 2015 | 691 | 263 |
| 2016 | 643 | 239 |
| 2017 | 673 | 277 |
| 2018 | 1,306 | 370 |
| 2019 | 1,179 | 305 |
| 2020 | 2,204 | 673 |
| 2021 | 2,966 | 530 |
| 2022 | 3,376 | 938 |
| 2023 | 3,388 | 908 |
According to Global Trade Alert, the metal products, machinery, and equipment sector (33.6%) accounted for the greatest share of newly implemented harmful measures in 2023, with miscellaneous goods such as chemicals, wood products, and plastics (28.6%), and food products and textiles (22.4%) not far behind. Given their importance in construction, auto manufacturing, and other marquee industries, steel and iron products topped the list of harmful measures, as they have for at least the past decade. In recent years, however, advanced technologies, such as semiconductors or low-carbon technologies, have seen more restrictions placed on them. Overall, estimates suggest that the measures implemented in 2023 cover at least 22.0% of global trade (Evenett et al., 2024).
Figure 1.6: Metal and metal products continue to top the list of trade restrictions
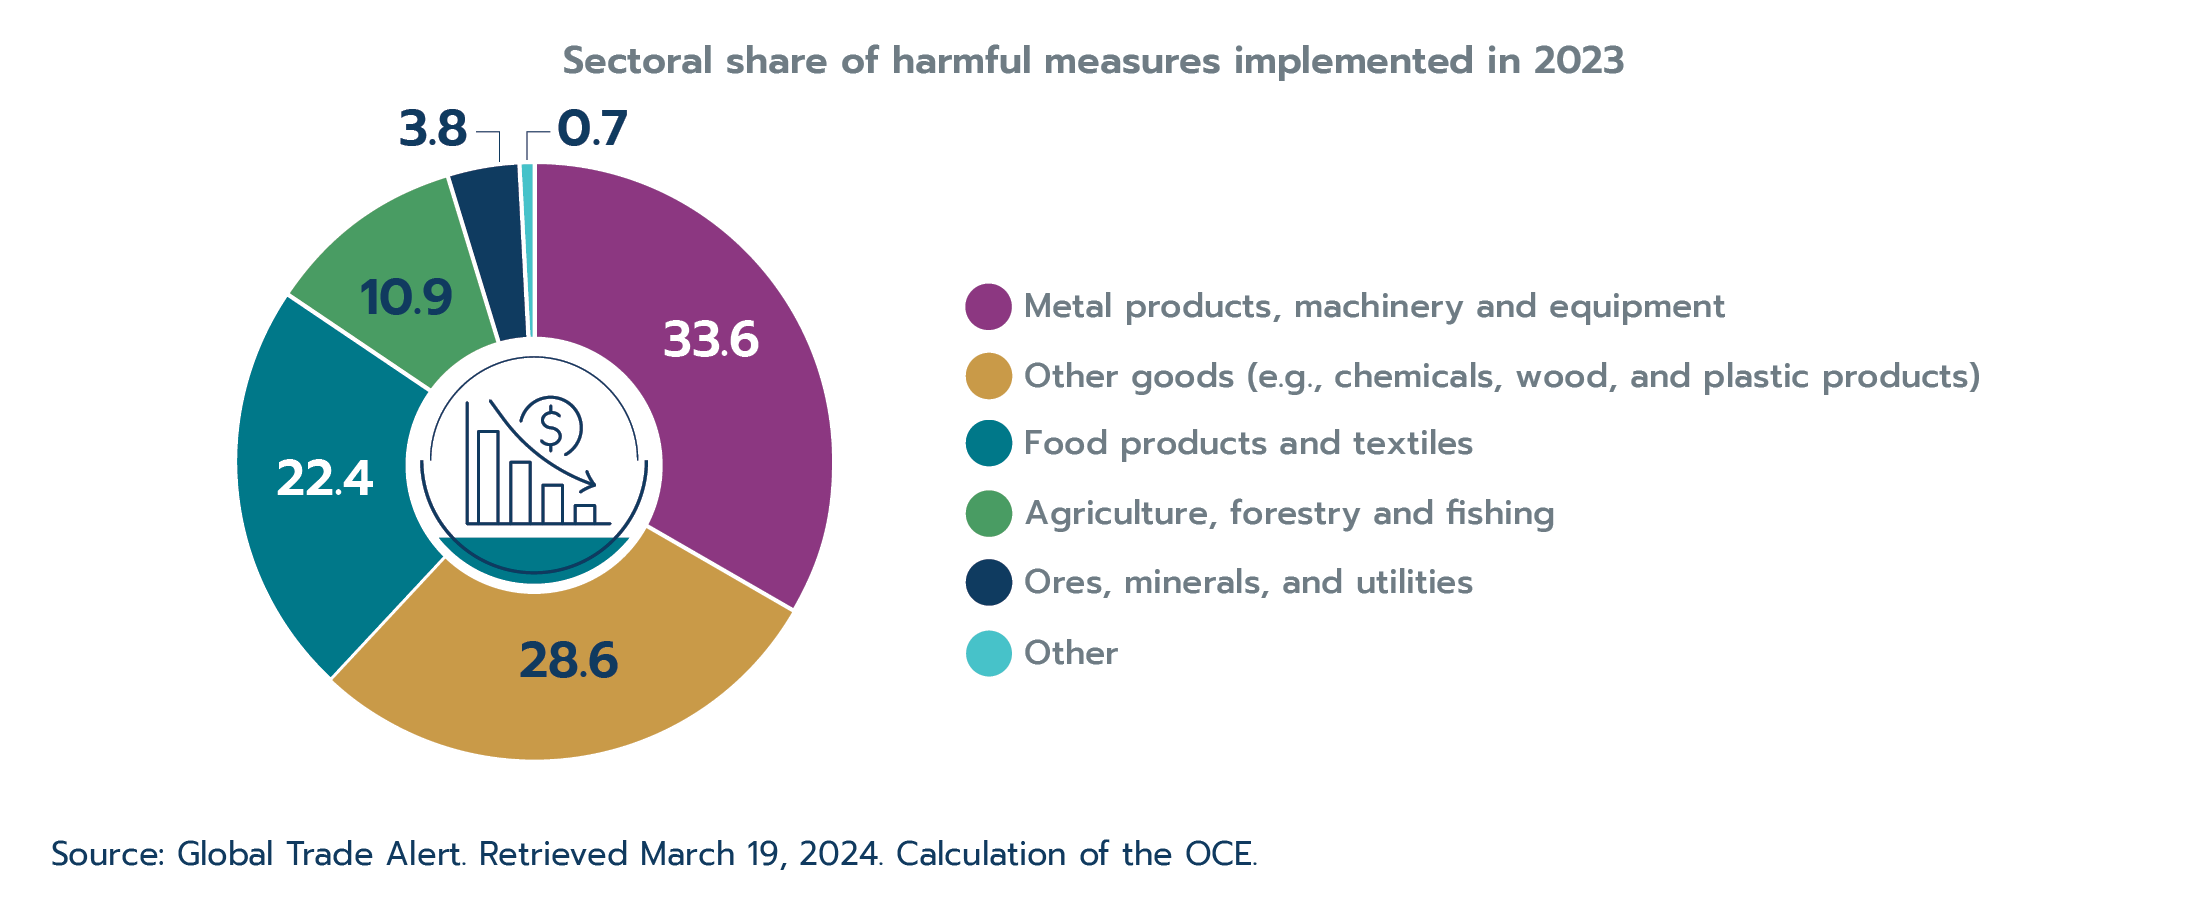
Source: Global Trade Alert. Retrieved March 19, 2024. Calculation of the OCE.
Text version - Figure 1.6
| Sector | Sectoral share of harmful measures implemented in 2023 |
|---|---|
| Metal products, machinery and equipment | 33.6% |
| Transportable goods (e.g., chemicals, plastics, wood) | 28.6% |
| Food products and textiles | 22.4% |
| Agriculture, forestry and fishing | 10.9% |
| Ores, minerals, and utilities | 3.8% |
| Other | 0.7% |
Over half (58.1%) of the harmful trade measures implemented in 2023 were in the form of non-export domestic subsidies, such as government loans, tax relief, or financial grants to businesses or industries.Footnote 3 Export-related measures (including export subsidies) only accounted for 13.4% of the harmful measures implemented. In 2023, most domestic subsidies were implemented by advanced economies, whereas emerging markets and developing economies are more likely to use import and export restrictions. This may change over time and may also reflect the lower fiscal capacity of emerging markets and developing economies to implement domestic subsidies.
The stated motivation for recently implemented harmful measures ranges from strategic competitiveness and geopolitical concerns to climate change mitigation and national security. Regardless of their motivation, protectionist industrial policies risk creating a tit-for-tat environment whereby all countries or country groups are competing to lead in the same industries. According to IMF researchers, for subsidies announced or implemented in 2023, there is a roughly 74.0% chance that if China, the E.U., or the U.S. implement a subsidy for a given product, another major economy will implement a retaliatory subsidy on that same product within one year (Evenett et al., 2024).
Not all restrictive trade measures are inherently bad, as they can sometimes be aimed at supporting other policy objectives. For instance, restricting trade in plastic packaging may help the climate transition, even though it would reduce trade overall. However, many export/import restrictions will raise the cost of goods and services globally and could slow progress towards other global objectives, such as climate change mitigation, by making needed technologies more expensive or by slowing their market entry. Furthermore, subsidies can result in duplication of efforts and oversupply, and they may not be a good use of limited fiscal space.
Ultimately, these harmful trade measures hinder trade and economic growth. The IMF estimates that an increase in trade restrictions could decrease global output from 0.2%, in a limited restriction scenario, to up to 7% of GDP in a high-restriction scenario (Aiyar, 2023). With deeper technological decoupling, the output losses could be as much as 12% for some countries. As Kristalina Georgieva, Managing Director of the IMF, put it, the rise of fragmentation is “a process that begins with increasing barriers to trade and investment and, in its extreme form, ends with countries’ breaking into rival economic blocs—an outcome that risks reversing the transformative gains that global economic integration has produced” (Georgieva, 2023).
1.3 Canadian economic performance
After two consecutive years of solid growth, the Canadian economy slowed from 3.8% growth in 2022 to 1.2% in 2023. The slowdown was expected as the impacts of high inflation and interest rates combined to soften demand and squash investment.
Robust household spending and exports helped the economy kick off 2023 on a high note, with gross domestic product (GDP) expanding by 3.4% (seasonally adjusted at annual rates) in the first quarter. Economic performance was then shaky throughout the rest of the year. GDP edged forward by just 0.7% in the second quarter before contracting by 0.3% in the third quarter. The economy ended 2023 on a flat note, expanding by just 0.1% in the fourth quarter. Overall, a technical recession was avoided in 2023, and a “soft landing” seems increasingly likely.
Throughout the year, household spending helped the Canadian economy avoid recession territory; however, this was largely driven by population growth. On a per-person basis, household spending decreased in 2023. Net exports, supported by a strong U.S. economy, were the greatest contributor to growth. Meanwhile, a decrease in business investment by 4.8% and a contraction in inventories were the largest detractors from growth in 2023.
After reaching a 40-year peak of 6.8% in 2022, inflation slowed to 3.9% in 2023. Driven by the post-pandemic resurgence in demand for in-person activities, services inflation (4.6%) outpaced goods inflation (3.1%). Energy prices played a significant role in slowing goods inflation; after increasing by 22.5% in 2022, energy prices contracted by 4.2% in 2023. Despite the overall inflation slowdown, food (7.5%) and shelter (5.6%) inflation were too high in 2023, which affected Canada’s vulnerable populations disproportionately. Lastly, inflation slowed sharply in the first six months of 2023 but its decline decelerated in the second half of the year. In its continued efforts to combat inflation, the Bank of Canada hiked the policy interest rate three times in 2023; it reached a 23-year high of 5.0% in July, where it remained as of May 2024. Early data for 2024 shows that inflation has dipped into the target range of 1.0% to 3.0%; however, the effects of past rate hikes are expected to linger. The impacts of monetary policy changes on the economy generally take between 18 and 24 months to fully materialize (Bank of Canada, 2021).
Overall, Canada posted the third strongest economic performance among G7 economies in 2023, behind only the U.S. and Japan (Figure 1.7). Looking ahead, the IMF forecasts Canadian economic growth to stay roughly at 1.2% in 2024; only the U.S. is expected to see a stronger performance among G7 countries.
Figure 1.7: Canada posts third-strongest growth among G7 countries in 2023, poised for second-strongest performance in 2024
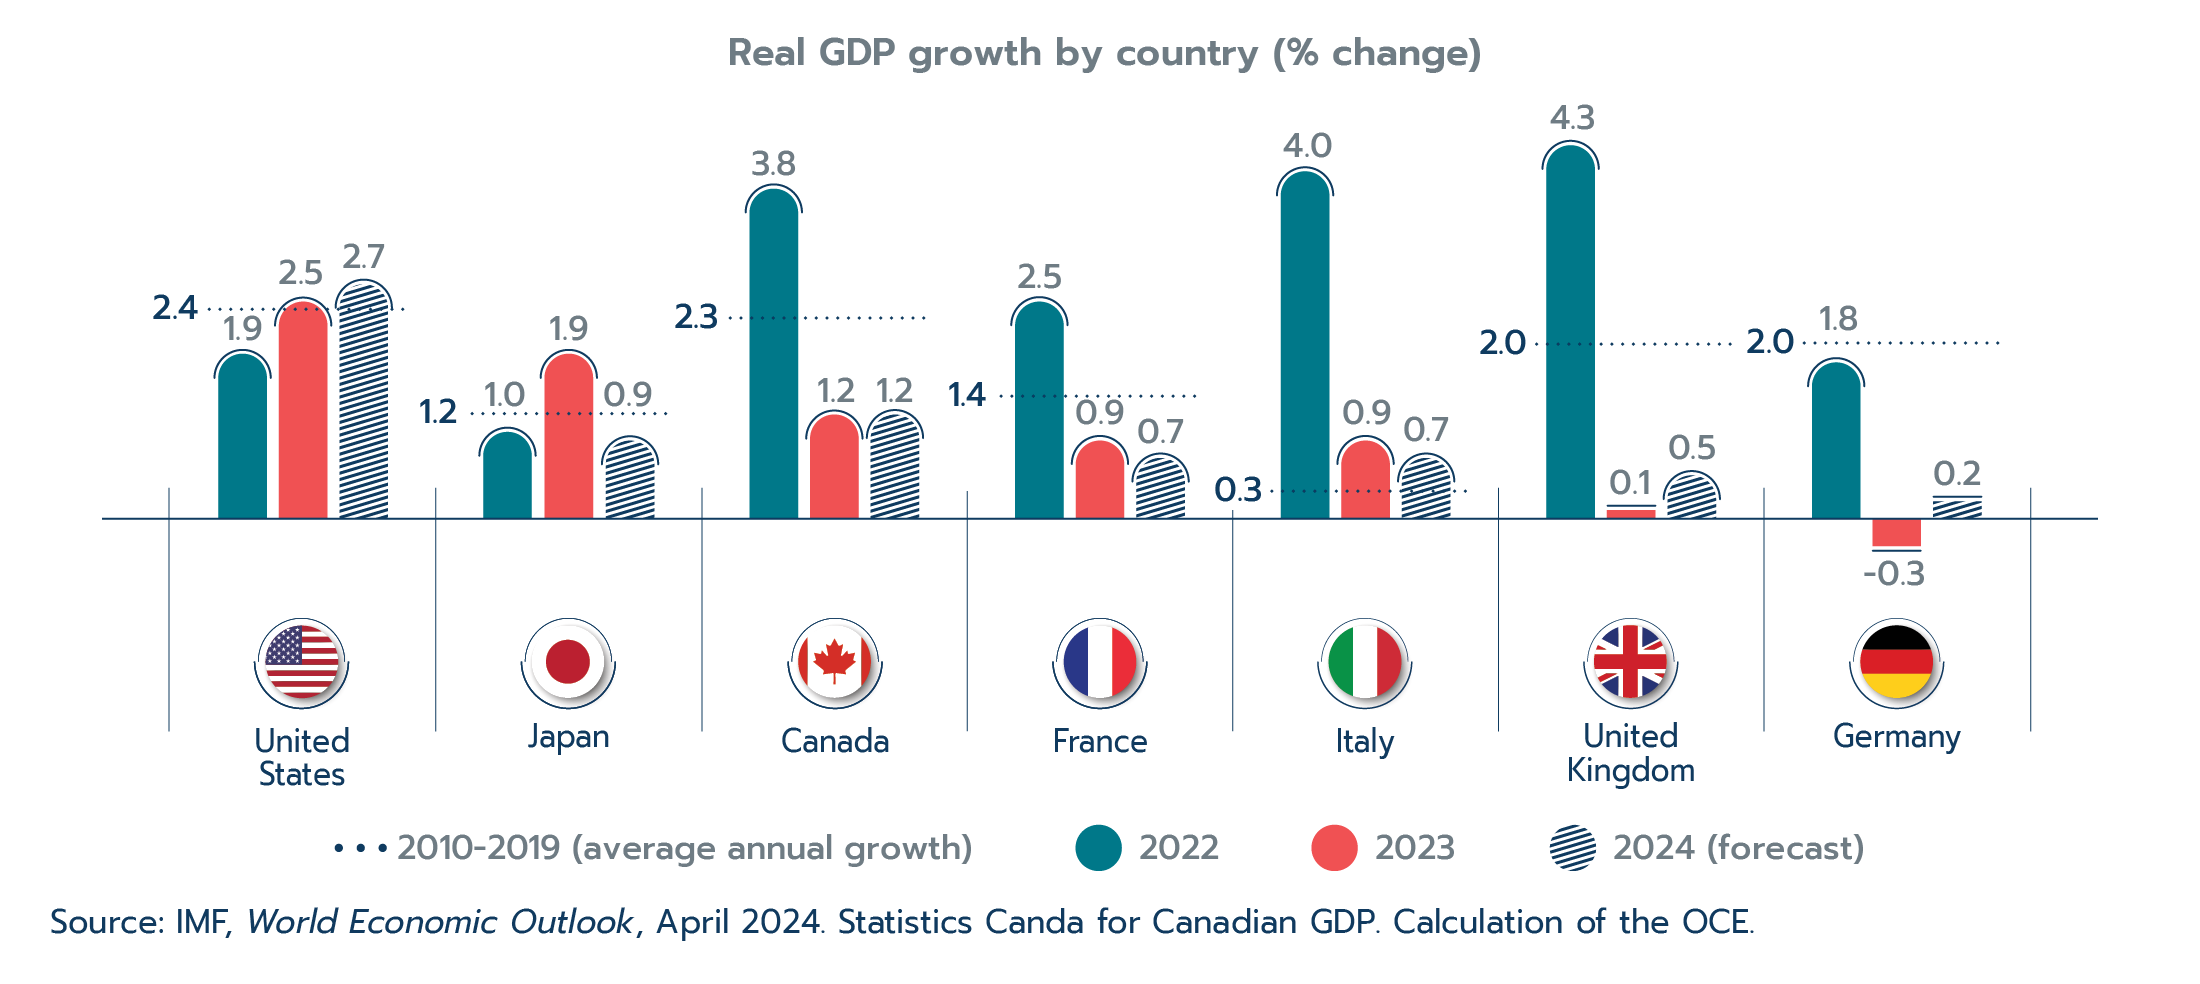
Text version - Figure 1.7
| Country | 2010–2019 (average annual growth) | 2022 | 2023 | 2024 (forecast) |
|---|---|---|---|---|
| Source: IMF, World Economic Outlook, April 2024. Statistics Canda for Canadian GDP. Calculation of the OCE. | ||||
| United States | 2.4 | 1.9 | 2.5 | 2.7 |
| Japan | 1.2 | 1.0 | 1.9 | 0.9 |
| Canada | 2.3 | 3.8 | 1.1 | 1.2 |
| Italy | 0.3 | 4.0 | 0.9 | 0.7 |
| France | 1.4 | 2.5 | 0.9 | 0.7 |
| United Kingdom | 2.0 | 4.3 | 0.1 | 0.5 |
| Germany | 2.0 | 1.8 | -0.3 | 0.2 |
Industry performance
After advancing by 3.8% in 2022, goods industries contracted by 1.2% in 2023. The contraction was widespread, with four of five major goods industries declining. The interest-rate-sensitive construction industry, driven by residential buildings, was the largest detractor from growth in 2023 (Figure 1.8). Dry conditions in Western Canada pushed down crop production, causing agriculture, forestry, and fishing to be the second largest contributor to the goods contraction. Manufacturing contracted for the first time since 2020. Declines across several subindustries, including plastics, wood, and paper manufacturing, outweighed robust growth in motor vehicle and machinery manufacturing. Mining, quarrying, and oil and gas extraction was the only goods industry to expand in 2023, albeit by a modest 0.2%.
Figure 1.8: Goods industries struggle in 2023
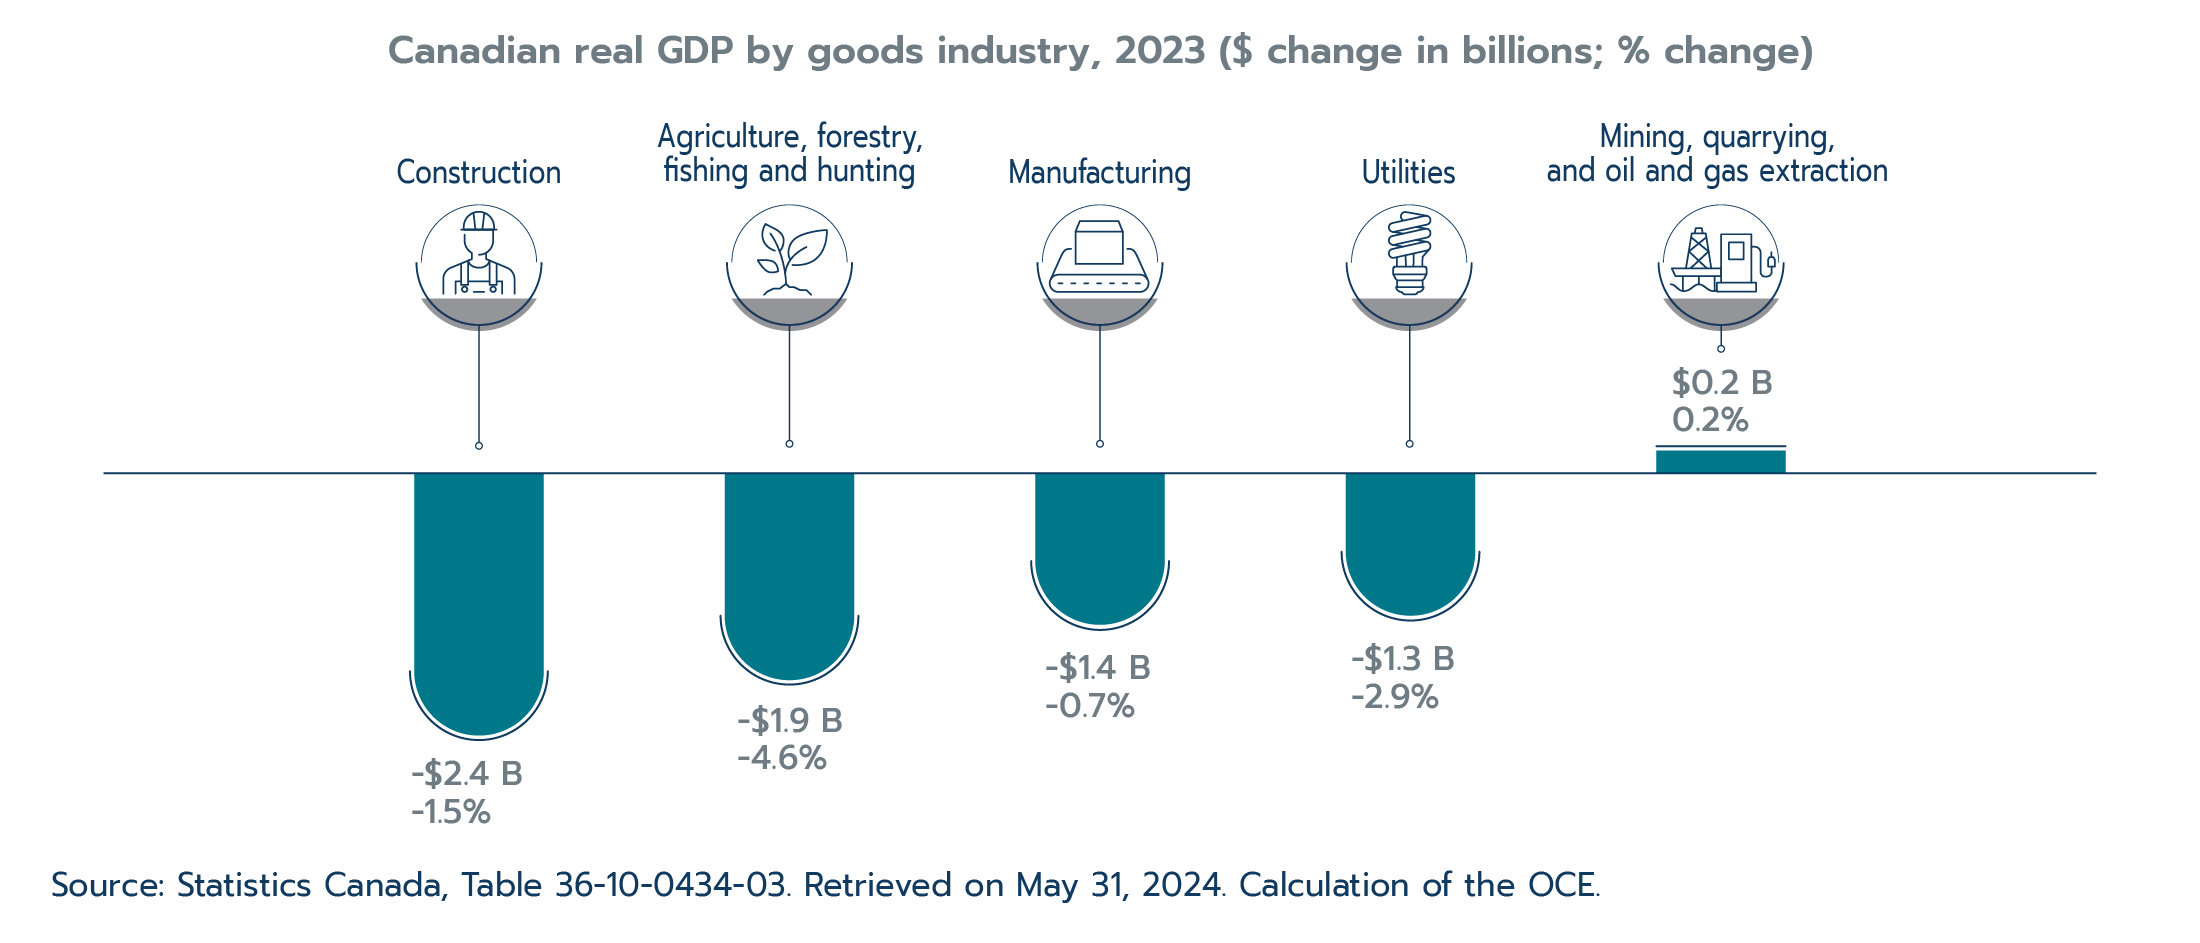
Text version - Figure 1.8
| Goods industry | 2023 vs. 2022 ($ change, billions) | 2023 vs. 2022 (% change) |
|---|---|---|
| Source: Statistics Canada, Table 36-10-0434-03. Retrieved on May 31, 2024. Calculation of the OCE. | ||
| Construction | -2.4 | -1.5% |
| Agriculture, forestry, fishing and hunting | -1.9 | -4.6% |
| Manufacturing | -1.4 | -0.7% |
| Utilities | -1.3 | -2.9% |
| Mining, quarrying, and oil and gas extraction | 0.2 | 0.2% |
Services industries led growth for the second consecutive year, advancing by 2.0% in 2023. Transportation and warehousing services and public administration, driven largely by gains in local, municipal, regional, provincial, and territorial administration, contributed the most to services growth (Figure 1.9). As the post-pandemic expansion in travel continued, and as more workers returned to the office, air travel and urban transit services drove the increase in transportation and warehousing. Professional and scientific services, real estate, and health care also contributed to services growth. Only information and cultural services and wholesale trade contracted in 2023.
Despite the continued momentum, several services industries remained below their pre-pandemic 2019 levels, including transportation and warehousing, administrative and waste management, and accommodation and food services.
Figure 1.9: Services industries lead growth
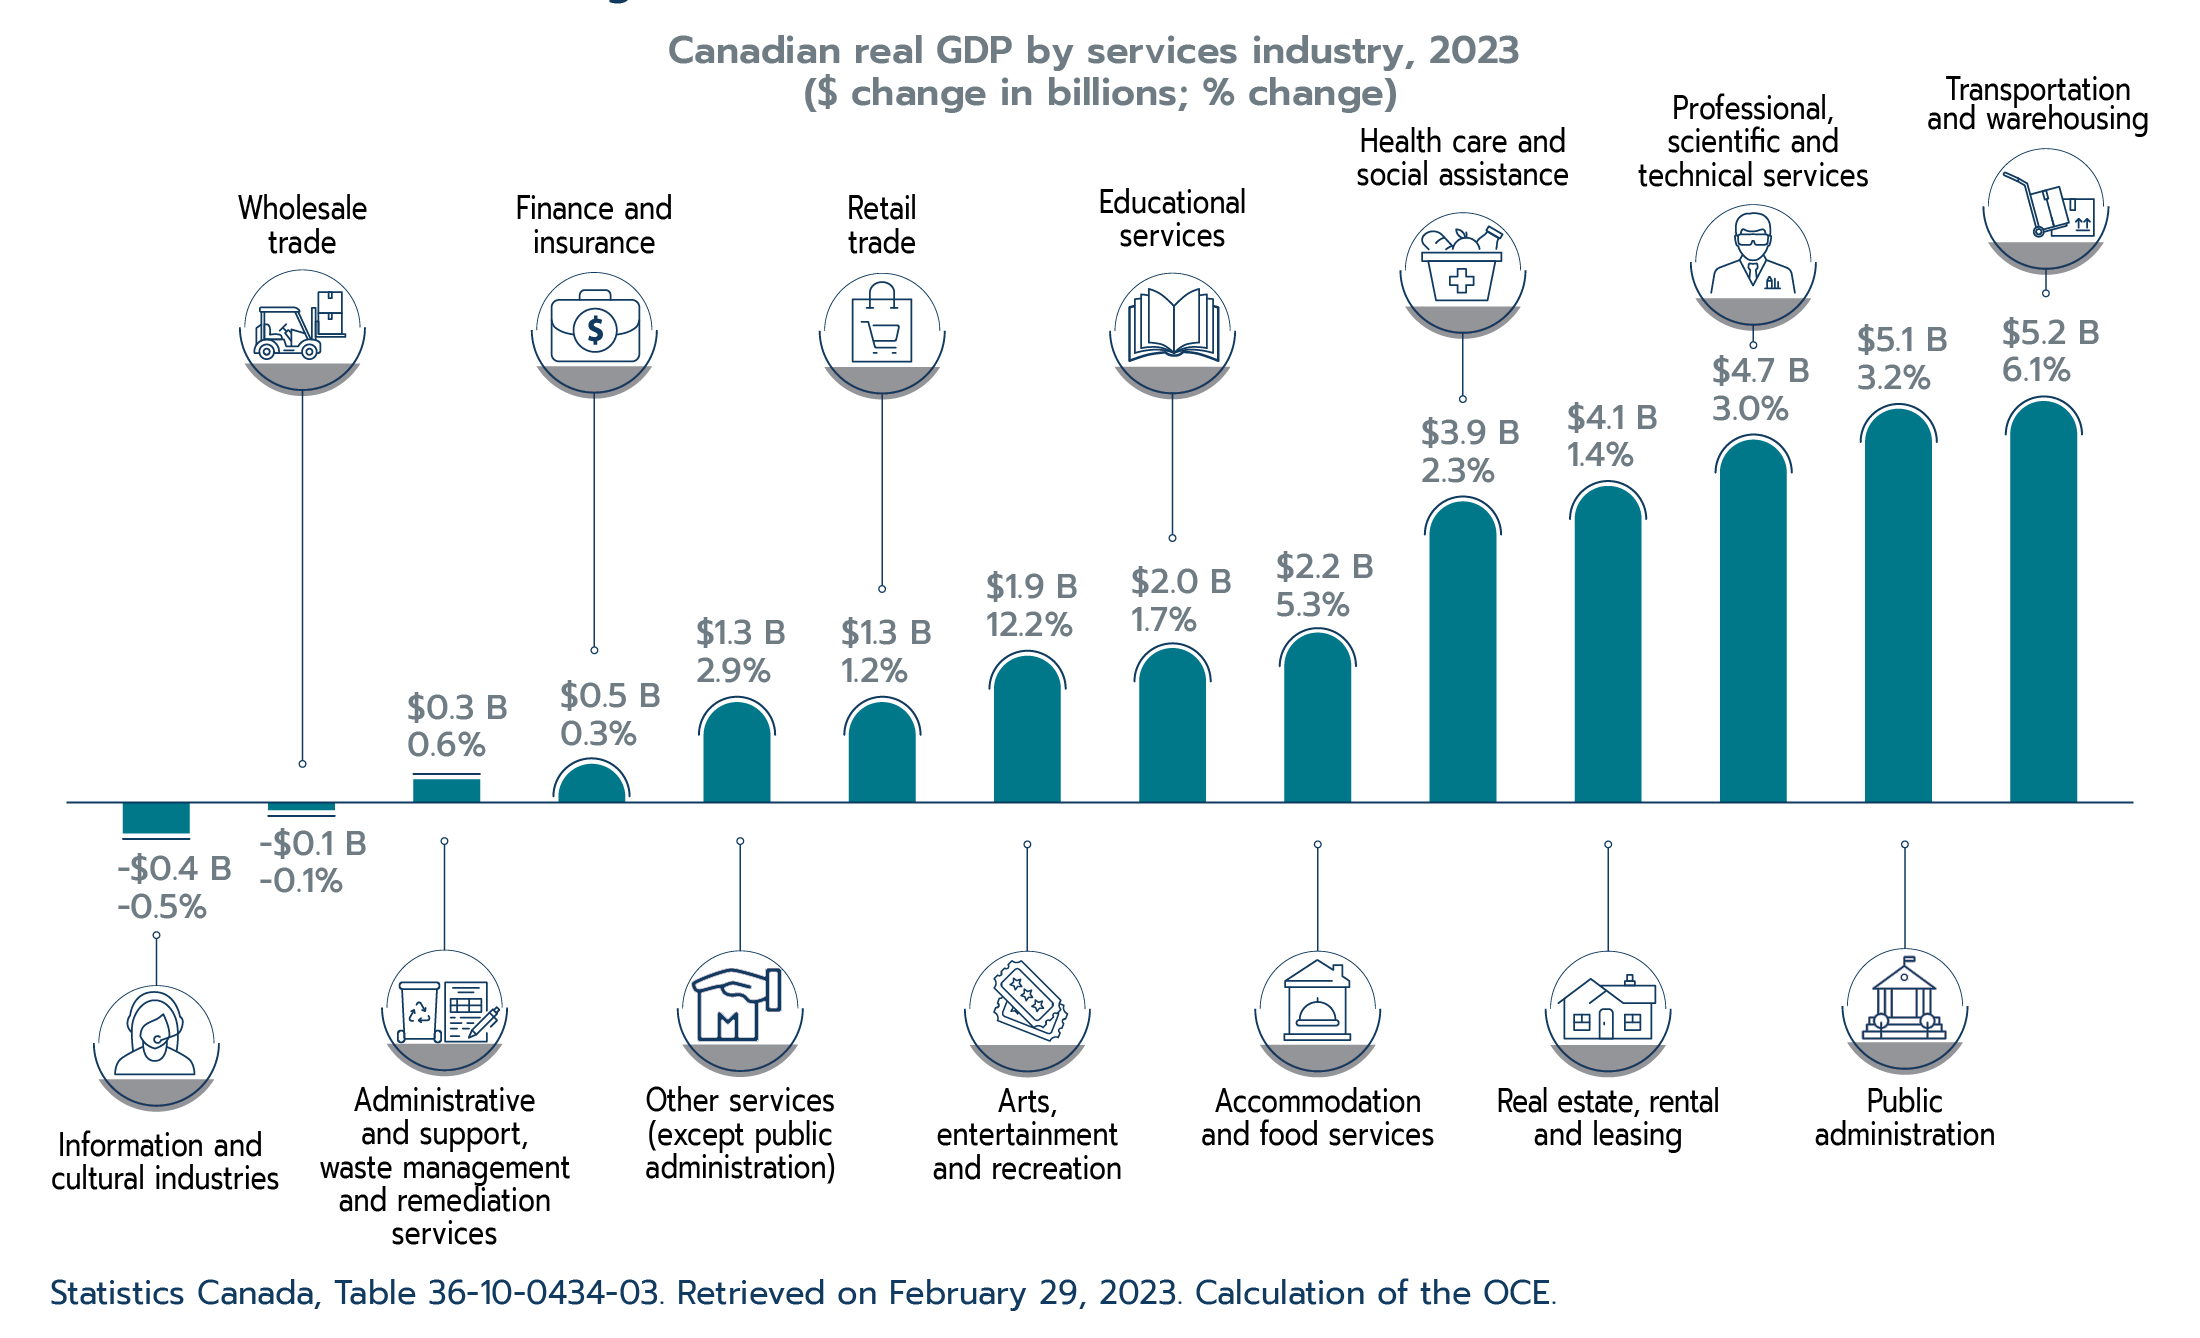
Text version - Figure 1.9
| Services industry | 2023 vs. 2022 ($ change, billions) | 2023 vs. 2022 (% change) |
|---|---|---|
| Source: Statistics Canada, Table 36-10-0434-03. Retrieved on May 31, 2024. Calculation of the OCE. | ||
| Information and cultural industries | -0.4 | -0.5% |
| Wholesale trade | -0.1 | -0.1% |
| Administrative and support, waste management and remediation services | 0.3 | 0.6% |
| Finance and insurance | 0.5 | 0.3% |
| Other services (except public administration) | 1.3 | 2.9% |
| Retail trade | 1.3 | 1.2% |
| Arts, entertainment and recreation | 1.9 | 12.2% |
| Educational services | 2.0 | 1.7% |
| Accommodation and food services | 2.2 | 5.3% |
| Health care and social assistance | 3.9 | 2.3% |
| Real estate and rental and leasing | 4.1 | 1.4% |
| Professional, scientific and technical services | 4.7 | 3.0% |
| Public administration | 5.1 | 3.2% |
| Transportation and warehousing | 5.2 | 6.1% |
Labour market performance
Coming off a record year, Canadian labour market tightness somewhat eased in 2023. The unemployment rate increased slightly from 5.3% in 2022 to 5.4% in 2023. However, the annual figure masks the uptick seen in the second half of 2023 and unemployment ended 2023 at 5.8% in December. Labour force participation (i.e., the number of working-age individuals working or looking for work) was essentially unchanged, and roughly 475,000 jobs were added to the economy in 2023, most of which were full-time positions. Finally, after reaching record levels in 2022, job vacancies (i.e., unmet demand for labour) decreased significantly in 2023. Altogether, the Canadian labour market appeared more balanced in 2023, and fears of widespread unemployment did not materialize.
Looking ahead
The Canadian economy is expected to see another year of weak growth in 2024, as high interest rates continue to weigh on spending and investment. A forecasted slowdown in wage growth is expected to reinforce declining per-capita consumption. Another year of soft global growth is also expected to mute Canada’s export performance. With weakening demand, the Bank of Canada expects labour markets to continue easing and inflation to end the year at roughly 2.2% (fourth quarter). However, several factors could lead to higher-than-expected inflation, including a worsening of the conflict in the Middle East, persistently high wage growth, or stronger-than-anticipated growth in house prices. On the flip side, if global or Canadian economic performance is worse than forecasted, inflation could come down faster than expected. Barring any surprises, the Canadian economy is forecasted to pick up in the second half of 2024.
1.4 Highlights of Canada’s trade performance
Despite another year of slow global growth and a contraction in global commodity prices, Canada’s international trade posted new records again in 2023, although growth was muted compared to 2022. Goods and services exports advanced by 1.4% to reach $965.1 billion, while imports increased by 3.1% to reach $978.2 billion. Canada posted a small trade deficit of $13.1 billion in 2023, and the ratio of trade-to-GDP edged down to 67.2%.
Strength in the recovering motor vehicle and parts and travel services sectors drove growth in Canada’s international trade throughout 2023. This section describes the year’s trends in goods and services trade on a balance-of-payments basis. See the Office of the Chief Economist (2024) for a review of Canada’s goods trade in 2023 on a customs basis.
Figure 1.10: Canada’s goods and services trade expands for another year in 2023
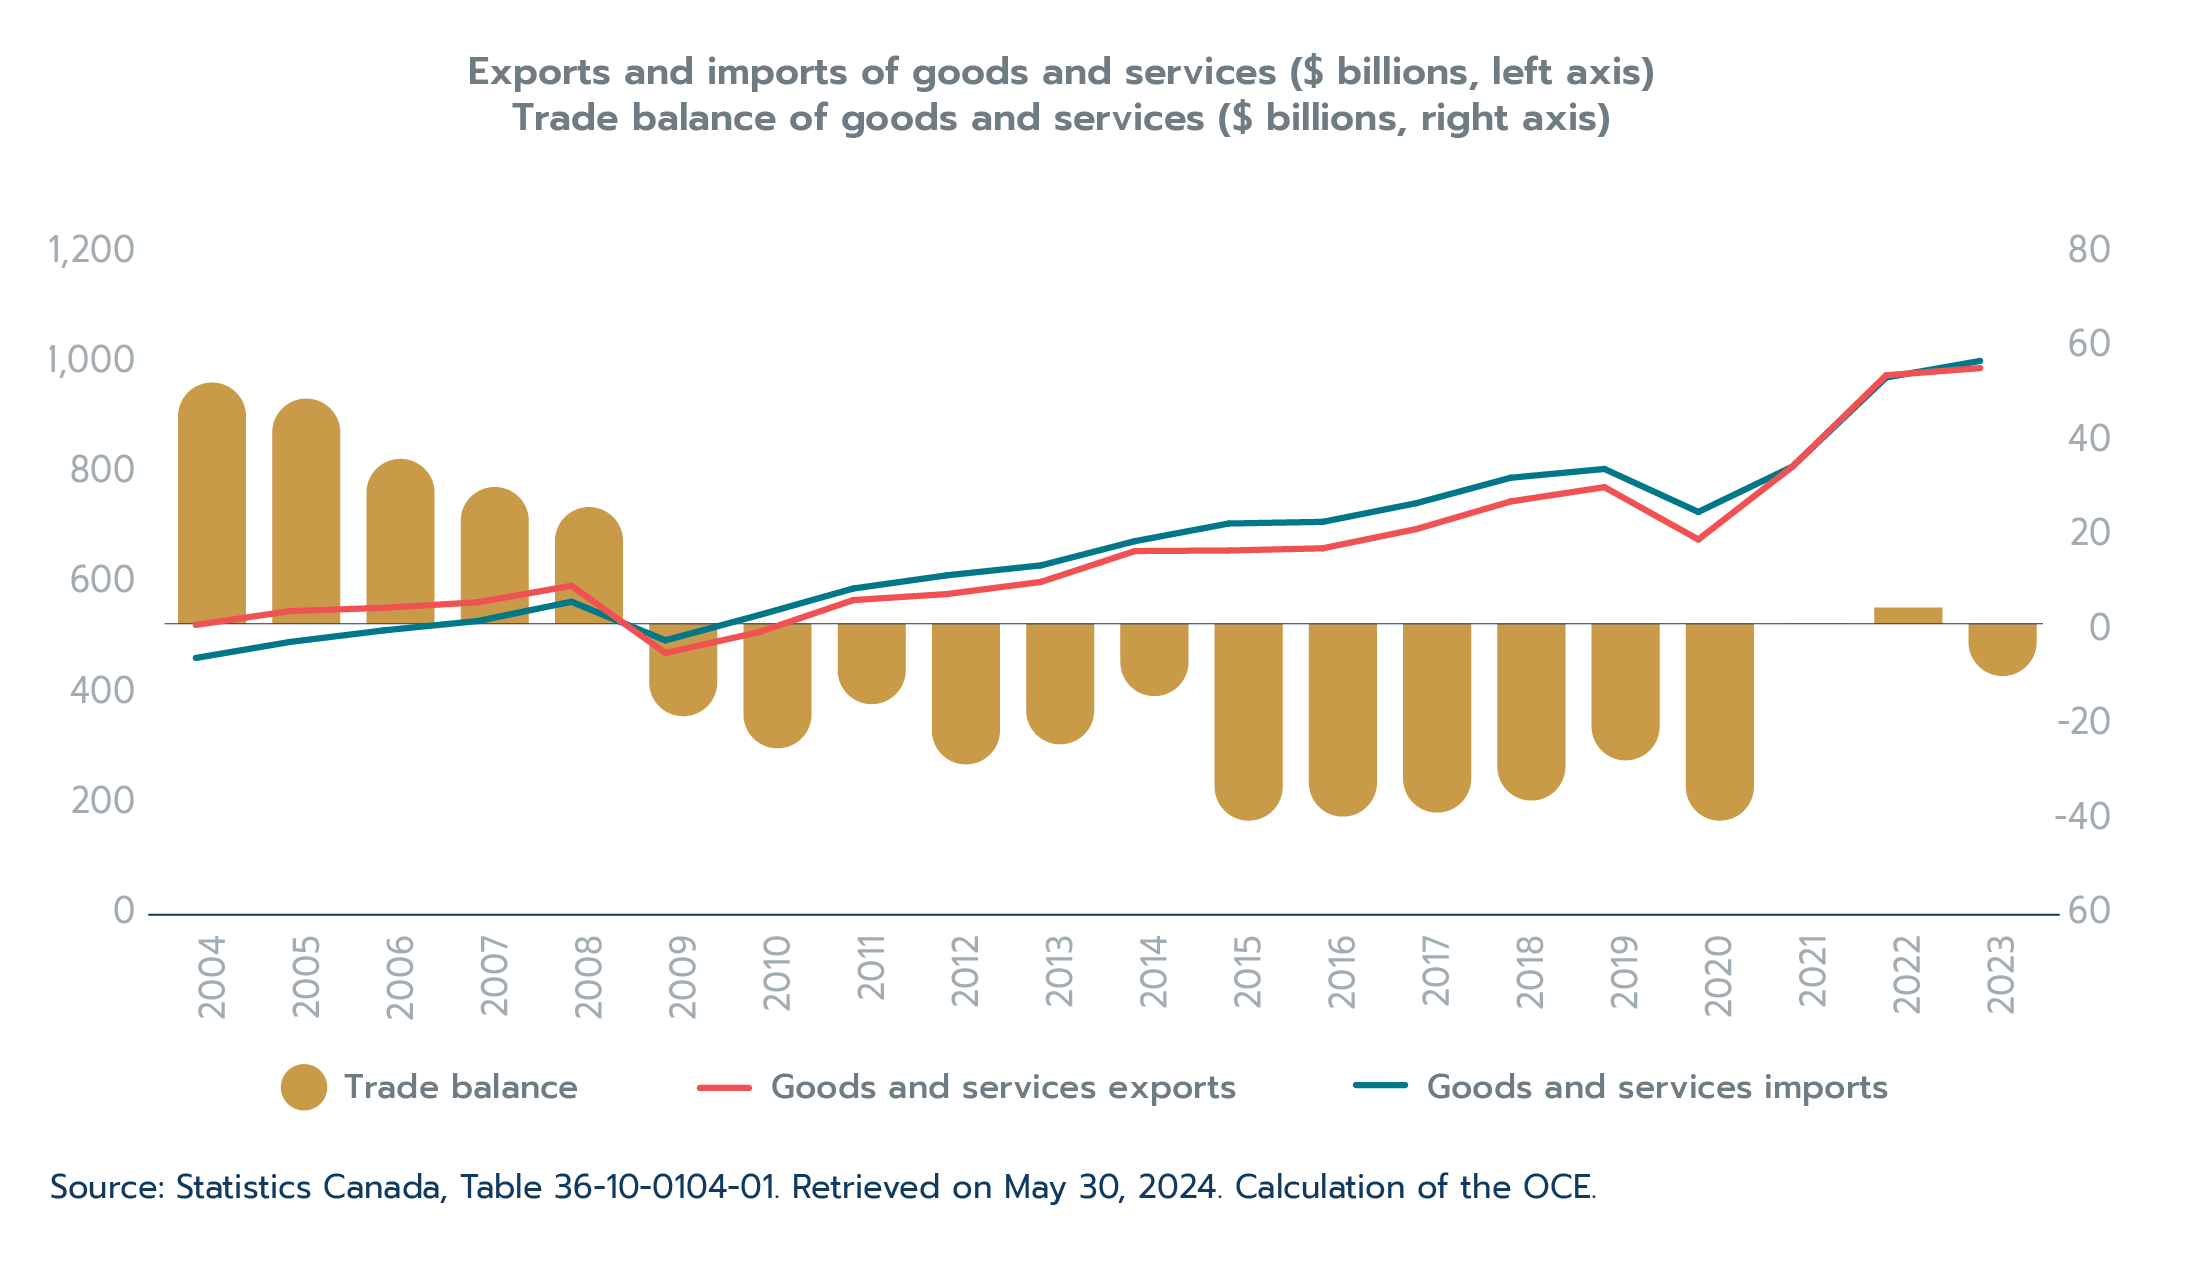
Text version - Figure 1.10
| Year | Goods and services exports | Goods and services imports | Goods and services trade balance |
|---|---|---|---|
| Source: Statistics Canada, Table 36-10-0104-01. Retrieved on May 31, 2024. Calculation of the OCE. | |||
| 2004 | 499 | 439 | 60 |
| 2005 | 524 | 468 | 56 |
| 2006 | 530 | 489 | 41 |
| 2007 | 540 | 506 | 34 |
| 2008 | 570 | 541 | 29 |
| 2009 | 448 | 471 | -23 |
| 2010 | 486 | 517 | -31 |
| 2011 | 544 | 565 | -20 |
| 2012 | 555 | 589 | -35 |
| 2013 | 577 | 607 | -30 |
| 2014 | 633 | 651 | -18 |
| 2015 | 634 | 683 | -49 |
| 2016 | 638 | 686 | -48 |
| 2017 | 673 | 720 | -47 |
| 2018 | 723 | 766 | -44 |
| 2019 | 749 | 782 | -34 |
| 2020 | 654 | 704 | -49 |
| 2021 | 786 | 786 | 0 |
| 2022 | 952 | 948 | 4 |
| 2023 | 965 | 978 | -13 |
Goods trade
Motor vehicles and parts trade drove growth as resource trade plummeted
While goods and services exports together expanded, Canada’s goods exports decreased by $10.9 billion (or 1.4%) in 2023, driven by a 9.9% contraction in resource exports. Energy product exports led this contraction, decreasing by $40.9 billion (-19.1%). After having spiked in 2022, partially driven by the outbreak of war in Europe, the price of a barrel of crude decreased from US$100.9 in 2022 to US$82.5 in 2023 (global price of Brent crude). The price of Western Canada Select, which is received by most Canadian producers, also contracted along with the price of natural gas. Canada’s energy export prices overall contracted by 20.9% in 2023. In volume terms, however, energy exports expanded by 2.2%. Moreover, despite the sharp contraction, the value of energy exports was still the second highest on record in 2023.
Non-resource exports partially offset the resource contraction, expanding by $36.9 billion (13.8%) in 2023. Supported by further improvement in international supply chains and pent-up demand, motor vehicles and parts exports led growth (+26.1%) (Table 1.1). Aircraft and other transportation equipment and parts (+25.5%) and industrial machinery and parts exports (+12.1%) also posted strong growth. Bucking the trend in resources, exports of farm and fishing products and intermediate food products (+6.5%) and metal and non-metallic mineral products (+6.2%) expanded, albeit at a slower pace compared to 2022. Farm, fishing, and intermediate food product growth slowed due, in part, to improved global supplies of wheat and canola that resulted in lower prices. Meanwhile, forestry products (-16.3%), metal ores and non-metallic minerals (-14.8%), and basic and industrial chemicals and plastic products (-5.6%) all contributed to the resource contraction.
Goods imports expanded by 1.4% in 2023, as growth in non-resource products (+6.0%) offset a contraction in resource imports (-6.6%). Imports increased in just 5 of 11 major product categories overall. Strong increases in imports of motor vehicles and parts (19.6%), aircraft and other transportation equipment and parts (11.3%), and industrial machinery and equipment products (8.5%) led growth. Meanwhile, consumer product imports (-3.3%) fell as Canadian consumers slowed spending. Energy products (-14.7%) also drove the contraction in resource imports, with import prices decreasing while volumes continued to expand. Apart from farm, fishing, and intermediate goods products (+0.5%), imports decreased in all resource sectors.
Table 1.1: Canada’s goods trade by major product category
| Trade | 2023 ($ billions) | 2023 vs. 2022 ($ change, billions) | 2023 vs. 2022 (% change) |
|---|---|---|---|
| Source: Statistics Canada, Table 36-10-0020-01. Retrieved on May 31, 2024. Calculation of the OCE. | |||
| Goods exports | |||
| Farm, fishing and intermediate food products | 61.1 | 3.7 | 6.5% |
| Energy products | 173.7 | -40.9 | -19.1% |
| Metal ores and non-metallic minerals | 29.3 | -5.1 | -14.8% |
| Metal and non-metallic mineral products | 90.9 | 5.3 | 6.2% |
| Basic and industrial chemical, plastic and rubber products | 42.5 | -2.5 | -5.6% |
| Forestry products, and building and packaging materials | 46.8 | -9.1 | -16.3% |
| Industrial machinery, equipment and parts | 51.4 | 5.6 | 12.1% |
| Electronic and electrical equipment and parts | 33.2 | 2.6 | 8.4% |
| Motor vehicles and parts | 102.0 | 21.1 | 26.1% |
| Aircraft and other transportation equipment and parts | 30.5 | 6.2 | 25.5% |
| Consumer goods | 86.0 | 1.4 | 1.7% |
| Total goods exports | 768.3 | -10.9 | -1.4% |
| Goods imports | |||
| Farm, fishing and intermediate food products | 28.5 | 0.2 | 0.5% |
| Energy products | 43.8 | -7.6 | -14.7% |
| Metal ores and non-metallic minerals | 18.7 | -0.4 | -2.1% |
| Metal and non-metallic mineral products | 64.0 | -1.0 | -1.5% |
| Basic and industrial chemical, plastic and rubber products | 59.7 | -7.0 | -10.4% |
| Forestry products, and building and packaging materials | 33.5 | -1.7 | -4.9% |
| Industrial machinery, equipment and parts | 90.0 | 7.1 | 8.5% |
| Electronic and electrical equipment and parts | 85.9 | 0.3 | 0.4% |
| Motor vehicles and parts | 141.8 | 23.2 | 19.6% |
| Aircraft and other transportation equipment and parts | 26.3 | 2.7 | 11.3% |
| Consumer goods | 150.1 | -5.1 | -3.3% |
| Total goods imports | 770.2 | 10.7 | 1.4% |
The U.K., Japan, U.S. pulled down Canada’s goods exports, while goods imports from the U.S. led growth
Canada’s total goods exports decreased by 1.4%, falling to $768.3 billion in 2023 (Table 1.2). Exports to the U.K. (-$4.8 billion) were the largest contributor to the overall goods export decrease in 2023. Despite robust U.S. economic growth, goods exports to the U.S. (-$2.1 billion) contracted in 2023, driven by a decrease in energy exports. Excluding energy, goods exports to the U.S. increased on a customs basis in 2023. Exports to Japan (-$2.3 billion) also posted a substantial and broad-based contraction. Supported by the reopening of its economy, goods exports to China (+$1.8 billion) posted the largest increase among all of Canada’s export partners in 2023. This was largely driven by a significant increase in oilseed exports, which surpassed 2018 levels to hit an all-time high in 2023. Exports to Hong Kong (+$1.5 billion) and the Netherlands (+$1.0 billion) also helped to moderate the overall contraction in goods exports.
Canada’s goods imports from all countries increased by $10.7 billion in 2023, a markedly smaller advance compared to the $125.2 billion increase in 2022. The U.S. (+$10.8 billion; mainly machinery, motor vehicles, and electrical machinery) and the EU (+$5.6 billion; led by machinery and motor vehicles) led growth. Imports from Mexico (+$4.4 billion) and Japan (+$3.2 billion) also experienced strong growth. Meanwhile, imports from China (-$9.4 billion; driven by several goods) contracted significantly, driven by a slowdown in consumer demand.
Table 1.2: Canada’s goods trade with top 10 trading partners
| Partners | 2023 ($ billions) | 2023 vs. 2022 ($ change, billions) | 2023 vs. 2022 (% change) |
|---|---|---|---|
| Source: Statistics Canada, Table 36-10-0023-01. Retrieved on May 30, 2023. Calculation of the OCE. | |||
| Goods exports | |||
| United States | 592.8 | -2.1 | -0.4% |
| China | 31.0 | 1.8 | 6.0% |
| Japan | 16.0 | -2.3 | -12.4% |
| United Kingdom | 15.2 | -4.8 | -23.9% |
| Mexico | 9.6 | -0.3 | -3.3% |
| Netherlands | 7.6 | 1.0 | 14.5% |
| Germany | 7.1 | -0.5 | -7.0% |
| South Korea | 7.1 | -1.8 | -20.0% |
| India | 5.2 | -0.2 | -3.7% |
| Hong Kong | 4.9 | 1.5 | 44.0% |
| All other countries | 72.0 | -3.1 | -4.2% |
| Total goods exports | 768.3 | -10.9 | -1.4% |
| Goods imports | |||
| United States | 484.0 | 10.8 | 2.3% |
| China | 60.2 | -9.4 | -13.6% |
| Mexico | 28.7 | 4.4 | 18.0% |
| Germany | 21.2 | 2.5 | 13.2% |
| Japan | 15.2 | 3.2 | 27.0% |
| South Korea | 11.5 | 0.6 | 5.4% |
| United Kingdom | 10.9 | 1.0 | 9.8% |
| Italy | 9.8 | 0.8 | 9.3% |
| Switzerland | 8.1 | 0.3 | 4.0% |
| Brazil | 8.0 | 0.5 | 7.0% |
| All other countries | 112.7 | -3.9 | -3.4% |
| Total goods imports | 770.2 | 10.7 | 1.4% |
Services trade
Travel services drive trade growth, surpassing 2019 levels for the first time since the start of the COVID-19 pandemic
Another year of robust growth in Canada’s services exports (+13.8%) outweighed the goods export contraction such that goods and services exports still expanded overall in 2023. Services exports increased across all four major categories, led by growth in travel services, to reach $196.8 billion in 2023 (Table 1.3). After a slow recovery, travel exports finally surpassed their 2019 levels (Figure 1.11), expanding by a robust 42.2% to reach $51.9 billion. Travel services accounted for nearly 65% of the growth in service exports overall in 2023. A 51.8% increase in the number of travellers entering Canada in 2023 reflects this trend; travellers from the U.S. and non-U.S. countries increased by similar amounts. Still, about 5.2 million fewer travellers visited Canada in 2023 compared to 2019. An increase in foreign visitor spending and spending by international students also supported travel services.
Figure 1.11: Travel services trade surpasses pre-pandemic levels for the first time since the start of the COVID-19 pandemic
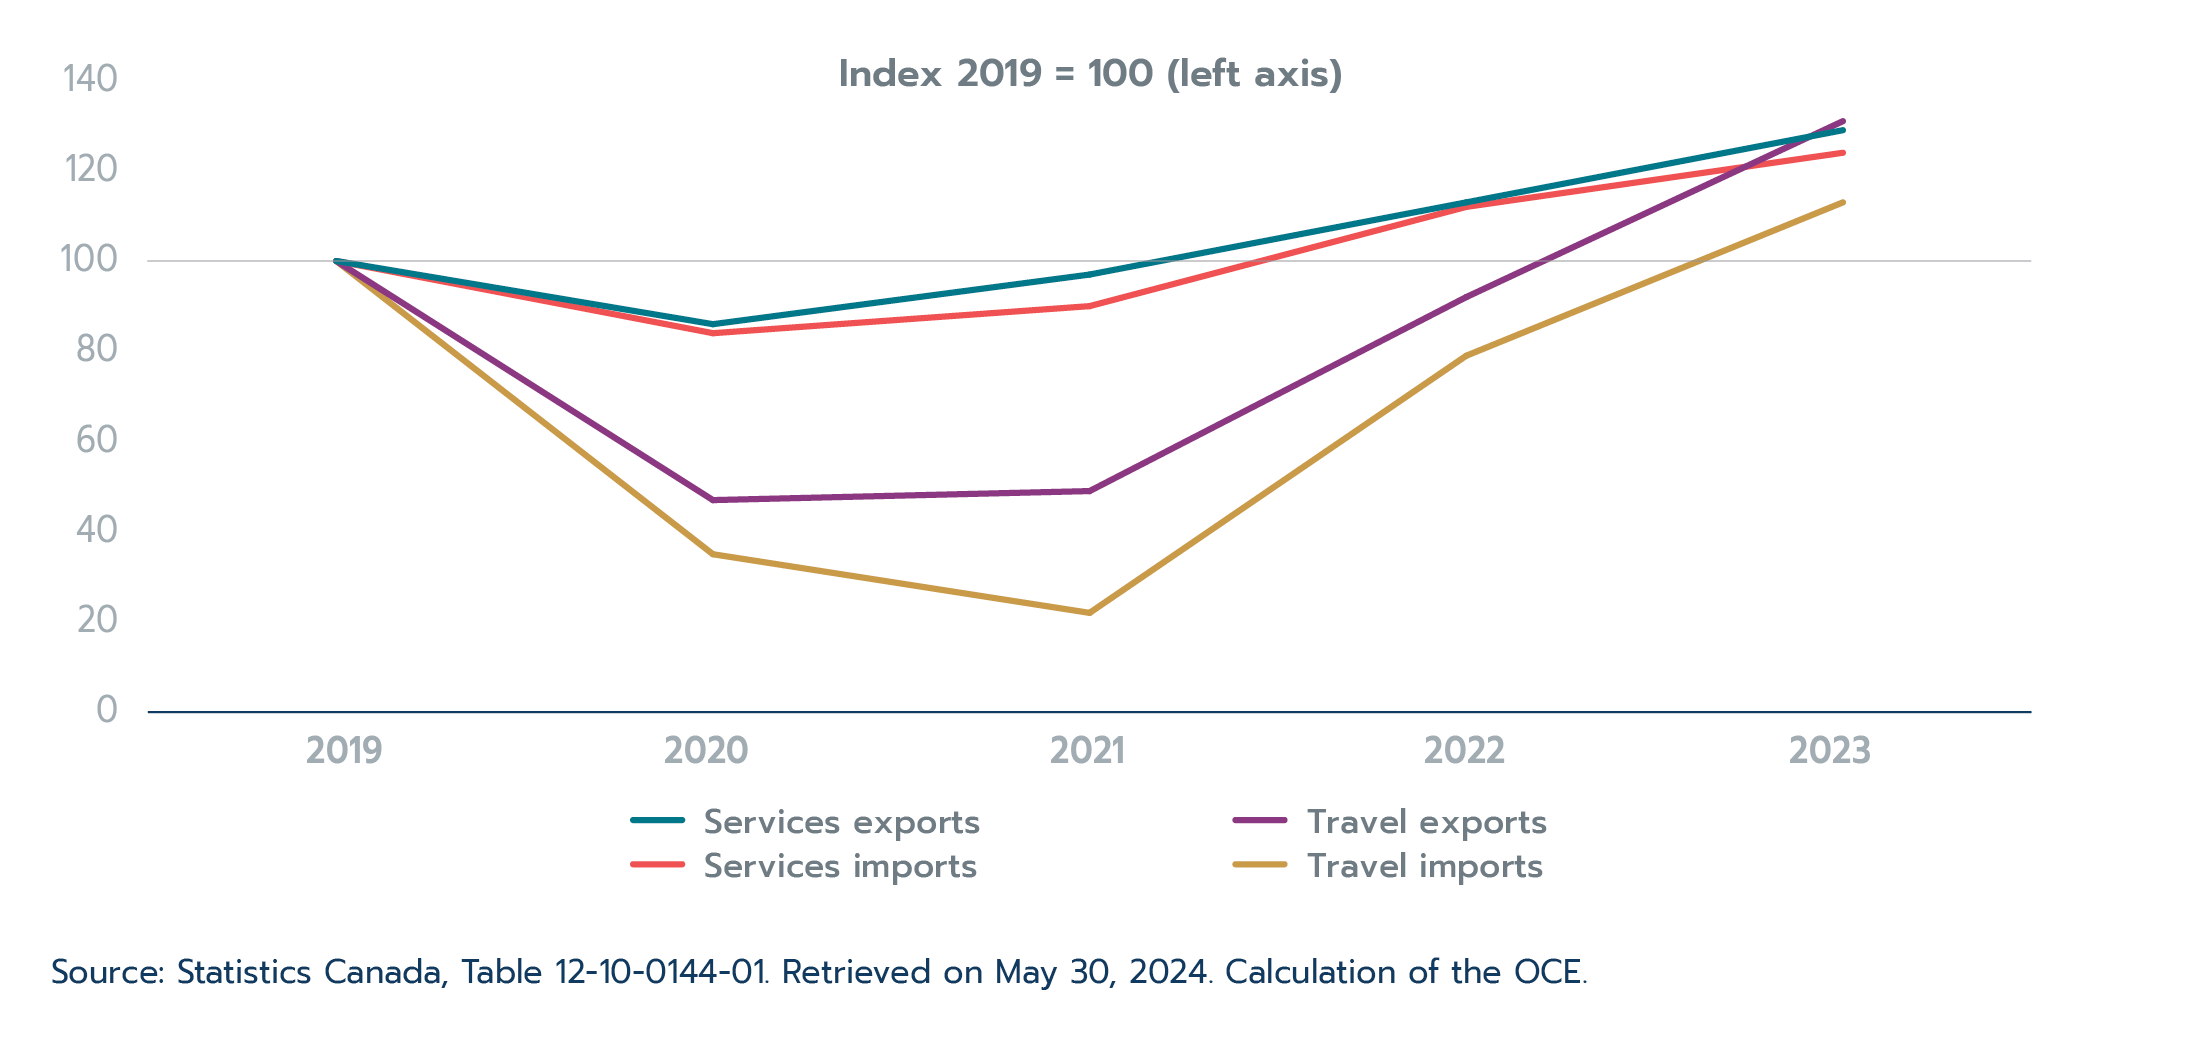
Text version - Figure 1.11
| Index 2019 = 100 | 2019 | 2020 | 2021 | 2022 | 2023 |
|---|---|---|---|---|---|
| Source: Statistics Canada, Table 12-10-0144-01. Retrieved on May 30, 2024. Calculation of the OCE. | |||||
| Services exports | 100 | 86 | 97 | 113 | 129 |
| Travel exports | 100 | 47 | 49 | 92 | 131 |
| Services imports | 100 | 84 | 90 | 112 | 124 |
| Travel imports | 100 | 35 | 22 | 79 | 113 |
Commercial services exports (+6.5%) continued to expand in 2023, supported by exports of digital business services. Exports to the U.S. (+$5.4 billion) and the EU (+$1.2 billion) accounted for 88.0% of the overall increase in commercial services exports. Transportation services exports (+4.3%), which, like travel, were also impacted by physical restrictions implemented during COVID-19, continued to increase. However, transportation services exports had already surpassed their pre-pandemic levels in 2022. Lastly, government services, which account for less than 1% of services exports, increased by 4.3% in 2023 but remained below pre-pandemic levels.
Table 1.3: Canada’s services trade by sector
| Service | 2023 ($ billions) | 2023 vs. 2022 ($ change, billions) | 2023 vs. 2022 (% change) | ||
|---|---|---|---|---|---|
| Source: Statistics Canada, Table 12-10-0144-01. Retrieved on April 4, 2023. Calculation of the OCE. | |||||
| Services exports | |||||
| Commercial services | 123.4 | 7.5 | 6.5% | ||
| Travel services | 51.9 | 15.4 | 42.2% | ||
| Transportation services | 19.7 | 0.8 | 4.3% | ||
| Government services | 1.8 | 0.1 | 4.3% | ||
| Total services exports | 196.8 | 23.8 | 13.8% | ||
| Services imports | |||||
| Commercial services | 118.7 | 4.9 | 4.3% | ||
| Travel services | 52.8 | 15.5 | 41.6% | ||
| Transportation services | 34.7 | -1.4 | -4.0% | ||
| Government services | 1.9 | 0.1 | 5.4% | ||
| Total services imports | 208.0 | 19.1 | 10.1% | ||
Services imports saw weaker growth than exports in 2023, but still increased by a robust 10.1% to reach $208.0 billion for the year (Table 1.3). Service imports increased in all categories except for transportation services. As with exports, travel services imports (+41.6%) far outpaced import growth overall. Expanding by $15.5 billion, travel services were the largest contributor to import growth in 2023. The number of Canadians travelling to the U.S. (+50.4%) and non-U.S. destinations (+39.9%) increased significantly in 2023. Still, fewer Canadians travelled abroad in 2023 than in 2019. The largest contributor to travel services import growth was Canadians spending abroad, largely in non-U.S. destinations. Overall, travel services imports ended 2023 at 12.5% above their 2019 levels, despite the number of Canadians travelling abroad still being subdued.
Commercial services imports, the second largest contributor to growth, increased by 4.3% in 2023. Commercial services imports from the U.S. (+$2.7 billion) were the largest contributor to growth, despite increasing at a slightly slower pace (+3.5%) compared to commercial services imports overall. Meanwhile, commercial services imports from the EU (+$1.5 billion) posted above-average growth (+11.6%) and were the second largest contributor to commercial services imports in 2023. Government services imports (+5.4%) also expanded. However, transportation services imports decreased by 4.0%; this was partially due to lower payments related to maritime transportation services for goods entering Canada.
Services export growth was robust across all of Canada’s top trading partners, while a contraction in service imports from several Asian economies partially offset gains elsewhere
Canada’s services exports increased by $23.8 billion in 2023, with services exports to the U.S. (+$11.4 billion) accounting for nearly half of this increase, despite posting slower growth than services exports overall (Table 1.4). India (+20.0%) held second place in Canadian services exports for the second year in a row, with exports to the country growing by $1.7 billion in 2023. Service exports to all other major trading partners increased as well, with Mexico (+50.4%), Australia (+36.6%), and France (+22.1%) all posting growth that was well-above average.
Services imports increased by $19.1 billion in 2023, with the U.S. (+$11.8 billion) accounting for over 60% of this increase. After the U.S., services imports from Mexico (+$ 1.4 billion) and Germany (+$0.7 billion) made the largest contributions to growth in 2023. Imports from Japan (+25.6%) increased at a rate that was well above average but remained below their 2019 levels. Service imports for several of Canada’s other top trading partners in Asia either contracted or posted weak growth. Imports from Hong Kong, the third largest source of service imports, decreased by $1.2 billion. Service imports from China ($0.2 billion) expanded marginally while imports from Singapore (-$0.4 billion) decreased.
Table 1.4: Canada’s services trade with top 10 trading partners
| Partner | 2023 ($ billions) | 2023 vs. 2022 ($ change, billions) | 2023 vs. 2022 (% change) | ||
|---|---|---|---|---|---|
| Source: Statistics Canada, Table 12-10-0157-01. Retrieved on May 31, 2024. Calculation of the OCE. | |||||
| Services exports | |||||
| United States | 104.6 | 11.4 | 12.3% | ||
| India | 10.1 | 1.7 | 20.0% | ||
| United Kingdom | 8.9 | 0.8 | 9.9% | ||
| China | 7.3 | 1.1 | 17.6% | ||
| France | 5.5 | 1.0 | 22.1% | ||
| Germany | 4.0 | 0.6 | 15.8% | ||
| Mexico | 3.2 | 1.1 | 50.4% | ||
| Switzerland | 2.9 | 0.2 | 7.5% | ||
| Australia | 2.7 | 0.7 | 36.6% | ||
| Hong Kong | 2.7 | 0.2 | 9.9% | ||
| All other countries | 44.8 | 5.0 | 12.5% | ||
| Total services exports | 196.8 | 23.8 | 13.8% | ||
| Services imports | |||||
| United States | 122.9 | 11.8 | 10.6% | ||
| United Kingdom | 9.6 | -0.3 | -2.6% | ||
| Hong Kong | 5.2 | -1.2 | -18.3% | ||
| Mexico | 5.0 | 1.4 | 38.9% | ||
| Germany | 4.2 | 0.7 | 20.1% | ||
| France | 4.1 | 0.6 | 18.1% | ||
| China | 4.1 | 0.2 | 4.4% | ||
| India | 3.4 | 0.4 | 14.3% | ||
| Japan | 3.0 | 0.6 | 25.6% | ||
| Singapore | 2.8 | -0.4 | -11.8% | ||
| All other countries | 43.7 | 5.1 | 13.2% | ||
| Total services imports | 208.0 | 19.1 | 10.1% | ||
Box 1.3: The export survival of Canadian exporters
While there is a lot of focus on getting firms to export and to grow exports both in terms of value and destinations, export survival—that is, the longevity of a firm’s export activity—has received less attention. It is just as important, since without export survival, a firm cannot participate consistently in the international markets and may struggle to grow its exports. A study by the OCE (Tran, forthcoming) explored the survival dynamic of exporting spells by Canadian firms. An exporting spell is the consecutive number of years that a firm exported. For example, if a firm exported every year between 2005 and 2008 but then did not export in 2009, those years of consecutive exporting would be considered one exporting spell of three years. If the firm then started to export again in 2011, this would be the beginning of a new exporting spell. Unfortunately, exporting spells by Canadian exporters do not last very long: about 40% of exporting spells lasted only one year. Furthermore, only about 30% are still exporting by the fifth year.
The study further classifies exporters into three types, based on their export strategy:
- “Gradual Global”: These are firms that focus on the domestic Canadian market first, then proceed to the export market.
- “Born Regional”: These are firms that export at a young age, but their early export sales are destined for the United States, Canada’s closest trading partner. Later in their export journey, these firms can potentially explore other destinations.
- “Born Global”: These are firms that export at a young age and, right from the onset of exporting, they have sales to more than just the United States.
According to the traditional internationalization model, a firm should first establish itself in its domestic market, and then incrementally increase its commitment and resources to the international market. However, in contrast to this traditional model, Tran (forthcoming) finds that Canadian Born Global and Born Regional firms generally have higher export values and export more products. Furthermore, exporting spells from Born Global firms lasted longer than exporting spells from Born Regional firms, which in turn survived longer than Gradual Global firms. However, once other control factors are included in the model (such as firm size, industry, export value, number of products exported, number of export destinations, etc.), it is exporting spells from Born Regional firms that had the highest survivor rate in the first few years (see Figure 1.12). The results show that in contrast to the advice from the traditional internationalization model, where firms should focus on the domestic market before exporting, young Canadian firms that focus on exporting from the onset can survive better in the export markets if the focus of early export is on the U.S.
Trade diversification, from both the point of having new exporters and more destinations, is an important policy goal of Canada. While this study seems to contrast the trade diversification goal, since the results show that young firms who focus on exporting to the U.S. early had a higher survival rate in the export market, trade diversification through the U.S. is a possibility. The OCE finds that about 20% of exporters to the U.S. eventually export to other markets. Therefore, one can encourage these young firms with higher export survival rate in the U.S. to explore diversifying to new markets.
Figure 1.12: Young firms that focus on the U.S. market early have a higher export survival rate
Text version - Figure 1.12
| Duration of export spell | Born Global | Born Regional | Gradual Global | ||||||
|---|---|---|---|---|---|---|---|---|---|
| Estimate | Min | Max | Estimate | Min | Max | Estimate | Min | Max | |
| Note: Error bar represents the 95% confidence interval. Estimate is the predicted survival rate, min is the lower value of the 95% confidence interval and max is the upper value of the 95% confidence interval. Source: Statistics Canada. Calculation of the OCE. | |||||||||
| 1st year | 70.7 | 68.0 | 73.1 | 78.0 | 76.0 | 79.9 | 67.0 | 65.0 | 69.0 |
| 3rd year | 38.5 | 35.3 | 41.6 | 46.8 | 43.5 | 49.9 | 40.8 | 38.1 | 43.4 |
| 4th year | 33.0 | 23.3 | 43.0 | 41.0 | 30.5 | 51.2 | 35.9 | 27.2 | 44.7 |
| 6th year | 24.7 | 8.1 | 46.0 | 32.2 | 12.4 | 54.0 | 28.4 | 11.7 | 47.7 |
1.5 Canadian foreign direct investment performance
In 2023, Canada's flows of foreign direct investment returned to growth, after a slight decline in 2022. More specifically, after declining 17.8% in 2022, Canadian direct investment abroad (CDIA) flows increased 1.8% to reach $110.0 billion in 2023, while foreign direct investment (FDI) flows in Canada increased 3.7% to reach $62.3 billion. As for 2022, their 2023 level are both above their respective 10-year average ($87.9 billion for CDIA and $55.6 billion for FDI flows), but below their 2021 level ($131.5 billion for CDIA, a historical record high, and $75.7 billion for FDI flows, a second historical record high).
The increase in CDIA flows in 2023 ($1.9 billion) was led by mergers and acquisitions (M&As), which surged 115.3% ($31.4 billion), . Reinvested earnings (REs) declined slightly by 0.4% ($245.0 million). While the rise in M&As in 2023 was the second highest since 2007 (after 241.1% in 2021), REs accounted for a larger value ($67.7 billion) in the total CDIA flows, compared to M&As ($58.6 billion). Other flows reduced the amount of the total CDIA flows by $29.2 billion (-226.3%) compared to 2022.
The rise of 3.7% ($2.2 billion) in FDI flows was mostly driven by the increase in the “other flows” category, which rebounded from a historical decrease in 2022
(-$21.0 billion) to $12.6 billion. Notably, REs in 2023 reduced the FDI flows by $13.7 billion.
As shown in Figure 1.13, CDIA flows outpaced FDI flows in 2023, the continuation of a trend observed since 2014.
Figure 1.13: Canada’s flows of foreign direct investment ($ billions)
Text version - Figure 1.13
| Year | Canadian direct investment abroad ($ billions) | Foreign direct investment in Canada ($ billions) |
|---|---|---|
| Source: Statistics Canada, Table 36-10-0025-01, Retrieved in May 2024. Calculation of the OCE. | ||
| 2013 | 59.1 | 71.5 |
| 2014 | 66.6 | 65.2 |
| 2015 | 86.2 | 56.1 |
| 2016 | 92.1 | 47.8 |
| 2017 | 98.9 | 29.6 |
| 2018 | 75.2 | 48.8 |
| 2019 | 102.8 | 67.1 |
| 2020 | 58.6 | 34.3 |
| 2021 | 131.5 | 75.7 |
| 2022 | 108.0 | 60.1 |
| 2023 | 110.0 | 62.3 |
| 10-year average 2013-2022 | 87.9 | 55.6 |
Sectoral composition
With respect to sectors, the finance and insurance sector represented the highest share of CDIA flows in 2023 at 45.9% ($50.5 billion), followed by management of companies and enterprises (20.3%), and energy and mining (11.9%). CDIA flows in the finance and insurance sector rose 7.4% to $50.5 billion in 2023, the highest level reached since the record of $54.3 billion in 2015.
In 2023, CDIA increased by $1.9 billion compared to 2022 (from $108.0 billion to $110.0 billion). This increase was mostly attributed to the finance and insurance sector (+$3.5 billion) and to a lesser extent, manufacturing (+$2.7 billion). Notably, flows can sometimes be negative as in the case of (i) divestitures and repatriation of earnings when money flows back to the foreign parent company, (ii) an affiliate making a loan to its parent company, or (iii) an affiliate reimbursing a loan it took from its parent company. Sometimes, the total value of the negative transactions by some affiliates can outweigh the total value of the positive transactions from other foreign affiliates, resulting in a negative outcome for that year’s total flows.
In 2023, FDI flows increased by $2.2 billion compared to 2022 (from $60.1 billion to $62.3 billion). Manufacturing and other industries contributed the most to this increase. On the one hand, the manufacturing sector posted an annual increase of $6.3 billion to reach $18.2 billion, while the other industries sector nearly quadrupled, with an annual increase of $12.0 billion to reach $16.1 billion. (Table 1.5).
Table 1.5: CDIA and FDI flows by sector (2023)
| Sector | Value ($B) | Change from 2022 ($B) | Change from 2022 (%) |
|---|---|---|---|
| Source: Statistics Canada, Table 36-10-0026-01. Retrieved in May 2024. Calculation of the OCE. | |||
| Canadian direct investment abroad | |||
| Energy and mining | 13.1 | -..9 | -40.5% |
| Manufacturing | 10.4 | 2.7 | 35.5% |
| Trade and transportation | 1.6 | -1.8 | -52.9 |
| Finance and Insurance | 50.5 | 3.5 | 7.4% |
| Management of companies and enterprises | 22.4 | 2.0 | 9.6% |
| Other industries | 12.1 | 4.5 | 58.4% |
| All industries | 110.0 | 1.9 | 1.8% |
| Foreign direct investment in Canada | |||
| Energy and mining | 7.7 | -5.8 | -43.0% |
| Manufacturing | 18.2 | 6.3 | 53.0% |
| Trade and transportation | 8.7 | 0.5 | 6.2% |
| Finance and Insurance | 5.5 | -2.6 | -32.2% |
| Management of companies and enterprises | 6.1 | -8.2 | -57.4% |
| Other industries | 16.1 | 12.0 | 298.0% |
| All industries | 62.3 | 2.2 | 3.7% |
Geographic composition
The United States remained the largest recipient country of CDIA, receiving 62.8% ($69.1 billion) of CDIA flows in 2023. After being the main driver of total CDIA flows decline in 2022, the United States led the CDIA increase with a contribution of $19.9 billion, which was its third highest increase since 2013.
The United Kingdom was the second largest destination of CDIA flows in 2023 with a 7.0% share of the total. Notably, the United Kingdom had occupied this ranking for the last 12 years, except for 2020 (10th) and 2021 (8th). Other main recipient countries in 2023 were Hong Kong (4.3%), Australia (3.8%) and Mexico (3.5%). Taken together, the top 5 destination countries of CDIA accounted for 81.5% of the total flows, an increase from 2021 (74.2%) and 2022 (66.6%). Compared to 2022, France is the only country that left the top 5 CDIA destinations in 2023, being replaced by Hong Kong.
Figure 1.14: Top 5 countries’ shares in total CDIA and FDI flows (2023)
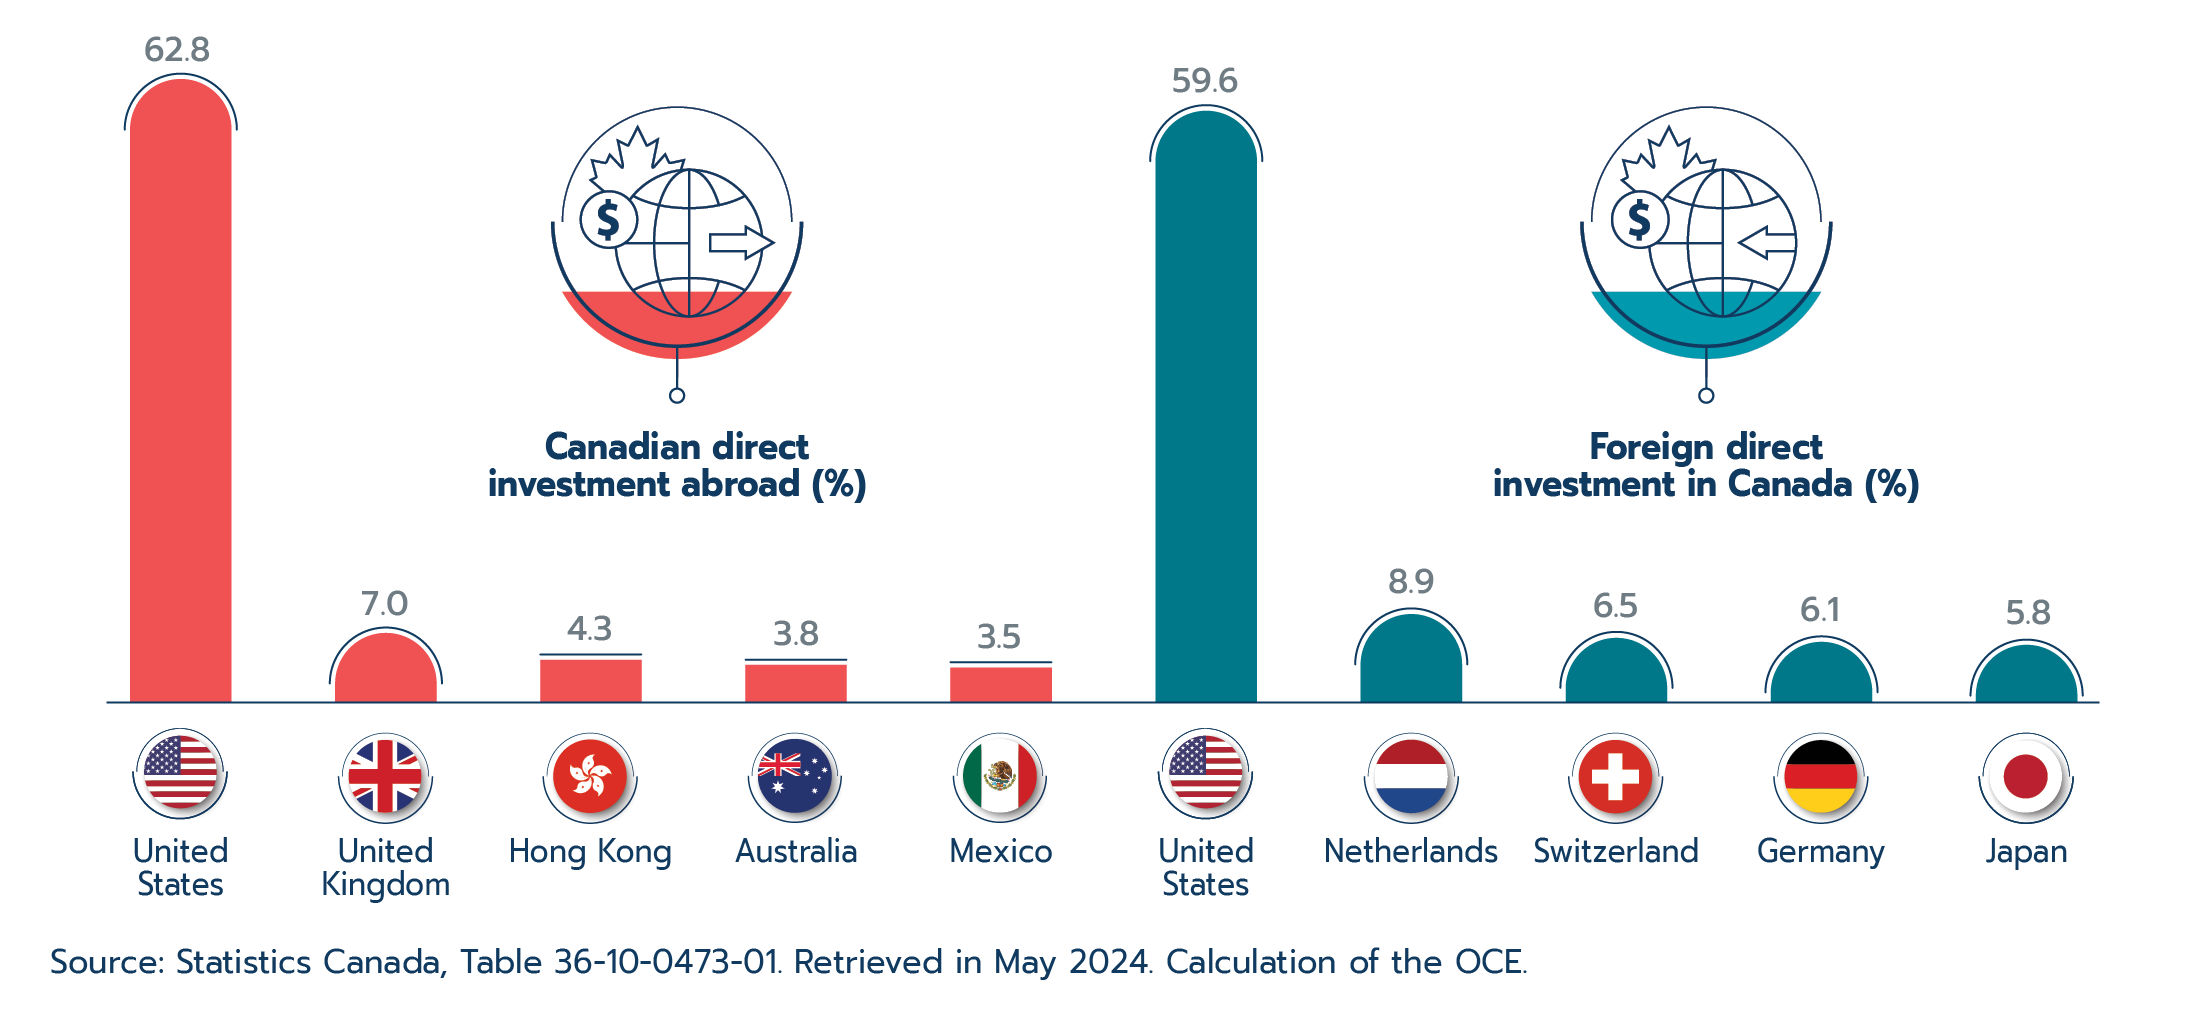
Text version - Figure 1.14
| Country | % |
|---|---|
| Source: Statistics Canada, Table 36-10-0473-01, Retrieved in May 2024. Calculation of the OCE. | |
| Canadian Direct Investment Abroad | |
| U.S. | 62.8% |
| U.K. | 7.0% |
| Hong Kong | 4.3% |
| Australia | 3.8% |
| Mexico | 3.5% |
| Foreign Direct Investment in Canada | |
| U.S. | 59.6% |
| Netherlands | 8.9% |
| Switzerland | 6.5% |
| Germany | 6.1% |
| Japan | 5.8% |
Similarly, the United States remained the largest investor in Canada in 2023, accounting for 59.6% of the total FDI flows, a share significantly above the average of the last decade (2013–2022: 41.0%).
The Netherlands (8.9%) ranked as the second largest investing country, a position it had held 9 times in the last 12 years. Switzerland (6.5%), Germany (6.1%) and Japan (5.8%) made up the rest of the top 5 FDI investing countries in 2023, replacing Luxembourg, Australia and France that were among the top 5 in 2022.
Table 1.6: CDIA and FDI flows (2023) – Top 5 Countries
| Country | Value ($B) | Change from 2022 ($B) | Change from 2022 (%) |
|---|---|---|---|
| Source: Statistics Canada, Table 36-10-0473-01. Retrieved in May 2024. Calculation of the OCE. | |||
| CDIA destinations | |||
| United States | 69.1 | 19.9 | 40.4% |
| United Kingdom | 7.0 | 2.6 | 50.8% |
| Hong Kong | 4.8 | 4.7 | 6012.8% |
| Australia | 4.2 | -1.3 | -24.3% |
| Mexico | 3.9 | 2.1 | 119.6% |
| All countries | 110.0 | 1.9 | 1.8% |
| FDI sources | |||
| United States | 37.1 | 10.8 | 41.2% |
| Netherlands | 5.6 | -5.5 | -49.6% |
| Switzerland | 4.0 | 3.8 | 1355.2% |
| Germany | 3.8 | 3.0 | 372.3% |
| Japan | 3.6 | 5.5 | -287.5% |
| All countries | 62,3 | 2.2 | 3.7% |
It should be noted that both CDIA and FDI flow data reflect the immediate destination/investor information and refer to the country through which the investment transited before reaching its destination. This is different from data based on the ultimate destination/investor, which are more accurate but not available for flows. As a result, flow data may not accurately reflect investments from countries that invest via intermediaries (e.g., China or Japan) or that act as intermediaries (e.g., the Netherlands, Hong Kong or Barbados). For more details on the difference between immediate and ultimate destination/investor, see Chapter 2 of Canada’s State of Trade 2021.
In conclusion, 2023 saw a rebound of Canada's flows of foreign direct investment after a slight decline in 2022. Otherwise, for 2023, both CDIA and FDI values were above their respective 10-year average but below their 2021 levels. In the year to come, CDIA and FDI flows will probably continue the positive trend from 2023, as there is a reduced likelihood of a severe economic downturn, a more balanced global growth outlook, and a potential for faster disinflation (IMF, 2024). Nevertheless, the increase could be modest as notable risks persist, including geopolitical uncertainties, elevated debt burdens in numerous nations, and additional fragmentation in the global economy (UNCTAD, 2024).
Part 2: Supply Chains
At a glance
2.1 Pre-pandemic: The evolution of international supply chains and their importance to Canada
- International supply chains have been an engine of global trade: Between 1990 and the global financial crisis in 2008, intermediates accounted for two-thirds of global export growth.
- International supply chains bring important benefits to Canada:
- Canadian businesses – International supply chains allow firms to focus on core tasks, gain access to specialized inputs, create knowledge spillovers, and increase competition, which results in increased productivity.
- Canadians – International supply chains help lower prices and increase choice and variety of products available.
- They also have potential draw backs – International supply chains can be a vector of contagion for global shocks.
- Trade, including in intermediates, slowed: Between 2008 and 2019, global exports grew at an average annual rate of only 2.0%, compared to 10.5% from 1995 to 2008. Intermediate goods and services exports, a measure of supply chain trade, lagged total export growth, gaining only 1.4% per year over this period.
2.2 International supply chains during COVID-19
- COVID created disruptions: The COVID-19 pandemic caused significant disruption to the world economy, causing border closures, travel restrictions, and shutdowns of plants and factories as workers were sent home to quarantine.
- Consumers shifted demand: Consumers in the United States and Canada shifted consumption away from services towards consumer durables. This in turn put pressure on transportation infrastructure, causing delays at ports and rising costs in maritime shipping.
- International supply chains remained strong: Although there were undoubtedly disruptions to supply chains during the pandemic that resulted in shortages, for example of personal protective equipment (PPE) and microchips, international supply chains demonstrated remarkable robustness in the face of such a large shock, and Canadians continued to have access to most of the goods and services that they required.
At a glance figure 4: Covid consumer
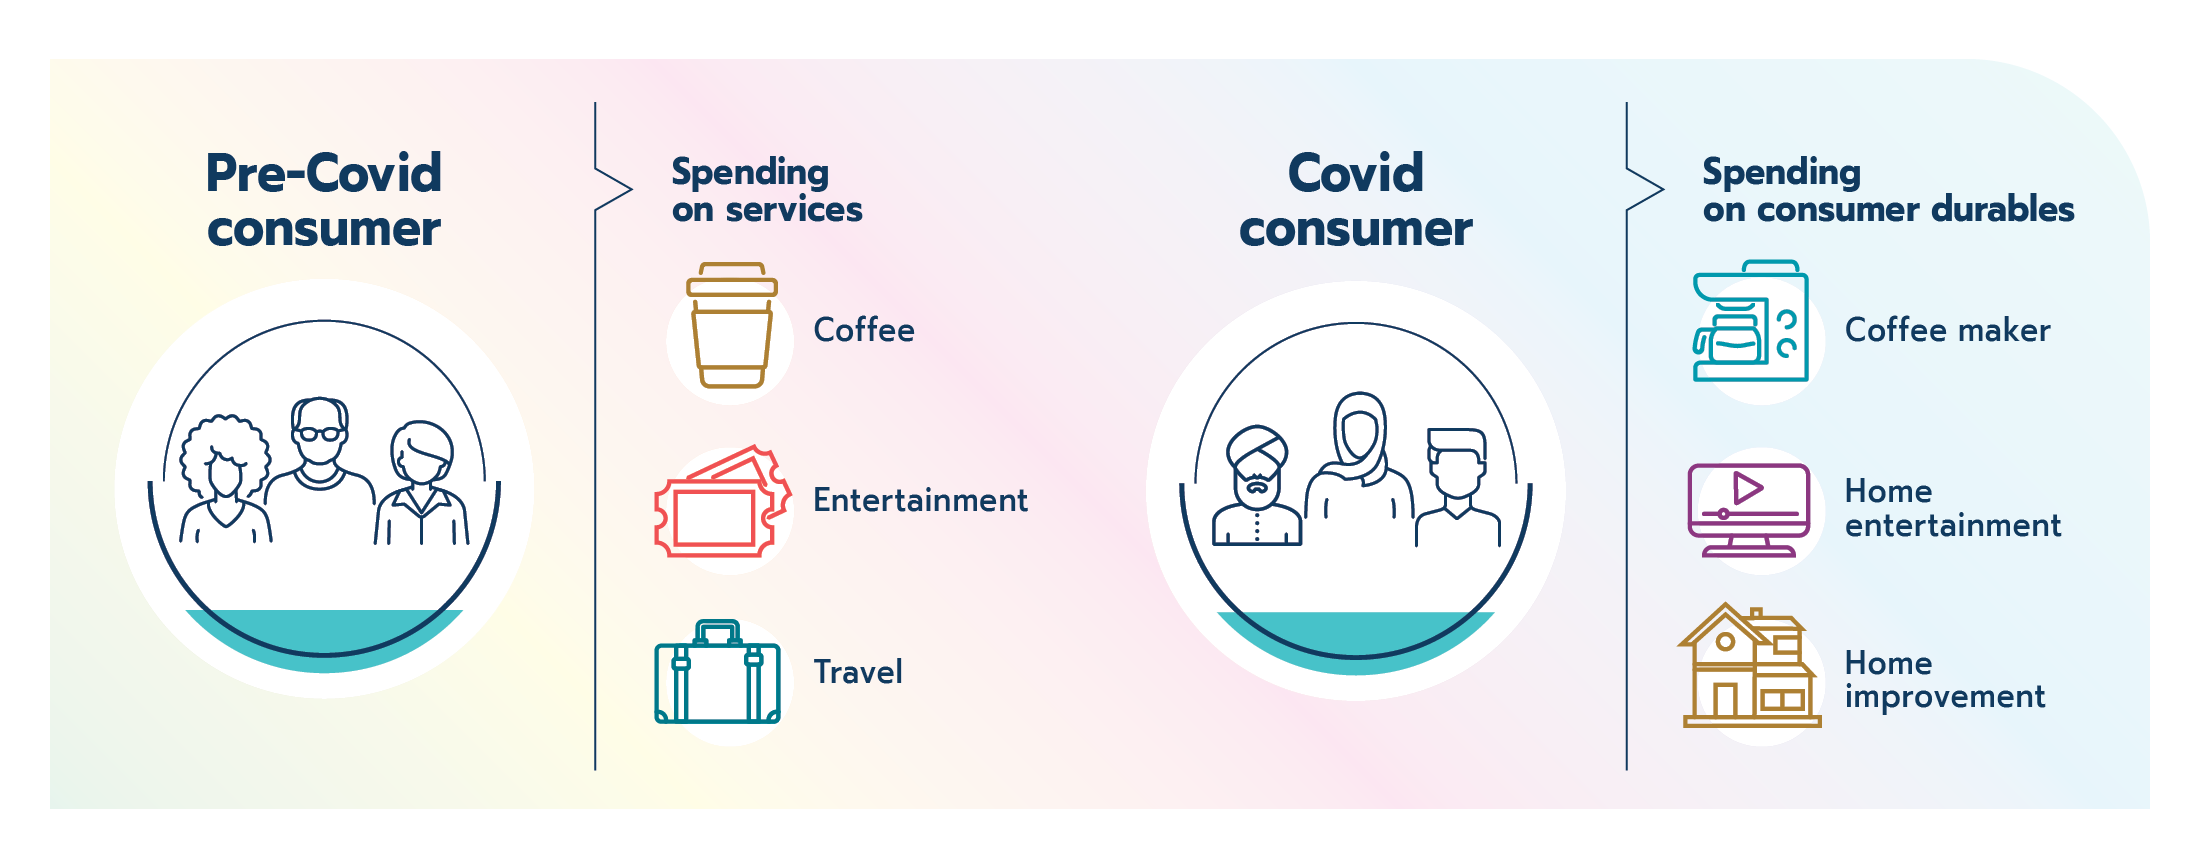
Text version - At a glance figure 4
Pre-Covid consumer: spending on services such as coffee, entertainment, and travel.
Post-Covid consumer: spending on consumer durables such as coffee makers, home entertainment, and home improvement.
2.3 International supply chains post-pandemic and into the future
- New risks have emerged: Risks and challenges to international supply chains can be grouped into four broad categories: natural disasters and climate change; human and organizational risks; environmental, social and corporate governance (ESG) concerns; and a changing geo-political environment.
- Improving supply chain resiliency: Some of the ways in which Canadian firms can mitigate the risks to their international supply chains include building up inventories, diversifying suppliers, innovating production processes, and changing the location of supply.
- Canadian SMEs are not immune to the challenges facing international supply chains: A Université Laval study finds that Canadian SMEs are deeply integrated into international supply chains. However, not all SMEs know exactly where their inputs are being sourced, with nearly a third of SME respondents reporting significant gaps in knowledge and visibility of their input sources.
2.4 Reshoring and other shoring strategies
- Little evidence of reshoring: The research and data available do not support the existence of broad reshoring trends in Canada or the U.S. While companies may be planning to reshore to increase the resiliency of their supply chains, they have yet to finalize and deploy plans.
- Relocation vs. reshoring: Relocation may offer greater benefits to reshoring. By shifting operations to alternative nations, companies can effectively mitigate their vulnerabilities while simultaneously leveraging other countries’ comparative advantages.
- Offshoring strategies evolution: Emerging trends in the outward Foreign Direct Investment data from Canada and the U.S. may be indicative of some nearshoring decisions. In addition, greenfield investments in China have been falling over the last decade, while they stayed constant in the Asian region.
2.1 Pre-pandemic: The evolution of supply chains and their importance to Canada
Many of the goods and services Canadians rely on daily are either trucked, shipped or flown in from far outside Canada’s borders. Further still, many of the products produced in Canada are made with inputs, materials or ingredients also sourced from abroad. In 2023, nearly half of Canada’s merchandise imports (47%) were intermediate goods. In short, Canada is fully integrated into a complex web of international supply chains. Significant events in recent years, such as the COVID-19 pandemic, the war in Ukraine and disruptions due to climate change (the B.C. flood, for instance), have highlighted the potential fragility of international supply chains to Canadians. What may be less evident to Canadians, however, are the many benefits and reasons behind why international supply chains—the production of goods and services across national borders—have become the common model for businesses across the globe, including here in Canada. The first part of this special feature looks at how international supply chains came about and the benefits that both Canadian firms and consumers gain from them.
Figure 2.1: “Canoe Manned by Voyageurs Passing a Waterfall”

Text version
Source: Library and Archives Canada/Frances Anne Hopkins fonds/c002771k
The term “international supply chain” can be defined as the cross-border organization of the activities required to produce goods or services and bring them to consumers through inputs and various phases of development, production, and delivery.Footnote 4 This is not a new concept. Indeed, the production of goods that are broken down into stages that are completed across many countries has been occurring for centuries. One only needs to look at the history of Canada to find a prime example: the fur trade. According to The Canadian Encyclopedia, the fur trade lasted for nearly 250 years, from the early 17th to the mid-19th centuries. It was primarily sustained by beaver trapping to satisfy the European demand for felt hats. Europeans traded with Indigenous Peoples to obtain beaver pelts, which were traded and shipped across the Canadian wilderness, then transported across the Atlantic. In Europe, the pelts were used by manufacturers in France or England to be made into stylish hats that were then sold to consumers across Europe. This fur trade supply chain is credited as playing an important role in the development of Canada. It was the motivation for early European exploration of Canada and remained the economic foundation of Western Canada until about 1870.Footnote 5
Felt hats for gentlemen may have fallen out of fashion, but international supply chains have not. In fact, they are more popular than ever and are behind most goods and services used by Canadians today. They are also, in most cases, much more complex than the historical example above. The term “chain” can be misleading: international supply chains are better thought of as a web of suppliers, producers, assembly, and distribution points needed to get a modern product to market. It is also important to note that while international supply chains still include the sourcing of raw materials for input, as in the fur trade example, they also encompass much more. Today, international supply chains include the sourcing of skills and knowledge, such as scientific R&D, legal services, and marketing. They also include high-tech inputs, such as semiconductors, computer and electronic systems, composite metals, and so on, which are vital components for many of today’s products.
Spread of international supply chains: From the 1990s to the 2008 global financial crisis (GFC)
These more complex and far-reaching international supply chains saw particularly strong growth and adoption as a business model in the early 1990s up to about 2008 (when the global financial crisis hit). There were several factors that helped spur the “unbundling” of production across borders. Baldwin (2013) points to major advancements in information and communication technology (ICT) in the mid-1980s and the melding of telecommunications, computers and organizational software, which allowed firms to coordinate “complexity” over further distances. While Baldwin writes that “the ICT revolution made it possible to coordinate complexity at distance,” the author then notes, “the vast wage differences between developed and developing nations made separation profitable.” While the growth of emerging markets—and the lower cost labour that is accessible through the—played a significant role in the buildup of international supply chains, they were not necessarily the key driver. Sydor (2011) points to other trends such as advancements in transportation, declining oil prices (early 1980s to 1998) and large drops in tariffs all playing an important role in enabling the fragmentation of production across borders.
An important aspect to the limit of labour costs as a driver of growth is in the very nature of supply chains themselves. For the most part, international supply chains are largely regional. Baldwin (2013) breaks international supply chains into three geographic areas: “Factory North America, Factory Europe, and Factory Asia.” International trade data show us that, for most countries, while some imported inputs are sourced from far away distances, the majority are sourced from close neighbours. Simply put, distance matters and countries still to this day trade more with their close neighbours. This is very evident when looking at Canada, as will be shown later in this chapter, whose supply chains are largely integrated with the U.S., with benefits arising from skills and technology rather than just low-cost labour.
Figure 2.2: Importance of intermediates in global exports
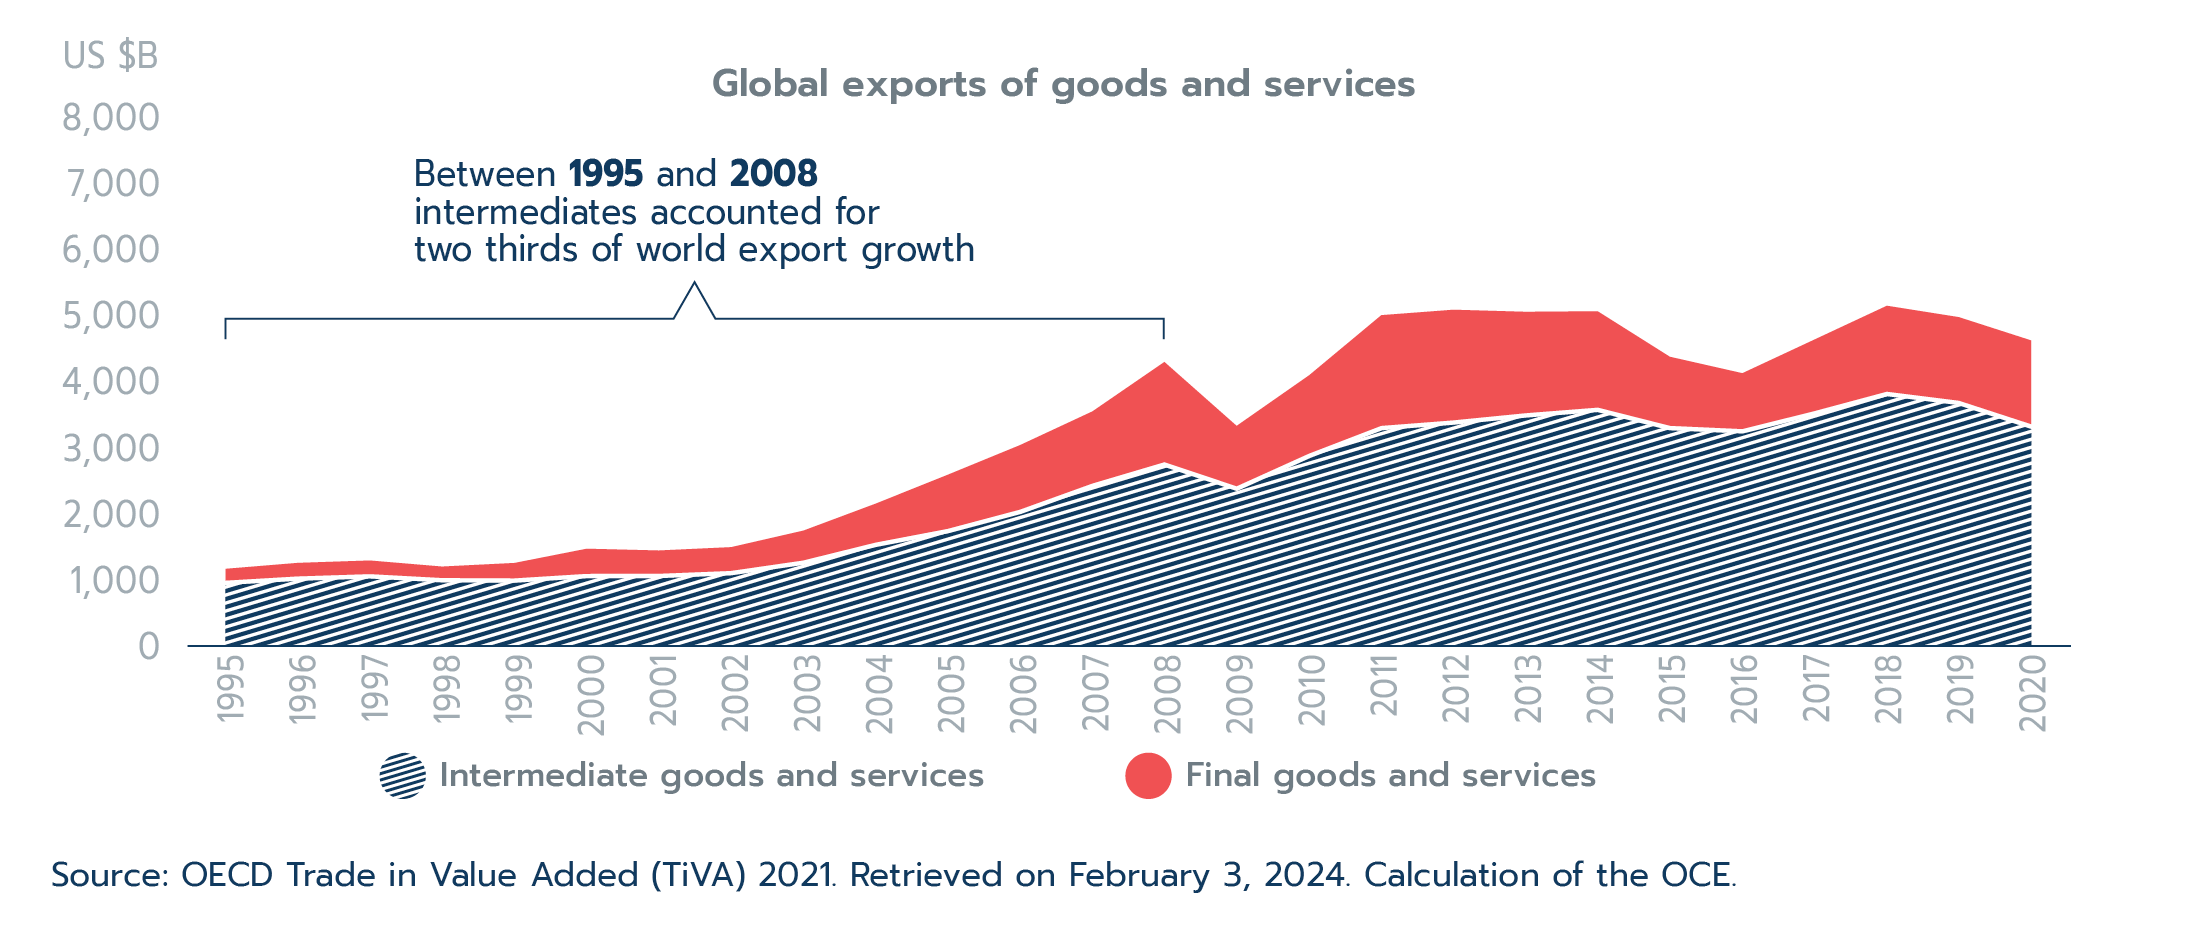
Text version - Figure 2.2
| Year | Intermediate goods and services (US$ billions) | Final goods and services (US$ billions) |
|---|---|---|
| Source: OECD Trade in Value Added (TiVA) 2021. Retrieved on February 3, 2024. Calculation of the OCE. | ||
| 1995 | 1,015 | 830 |
| 1996 | 1,104 | 894 |
| 1997 | 1,141 | 929 |
| 1998 | 1,049 | 870 |
| 1999 | 1,103 | 865 |
| 2000 | 1,319 | 933 |
| 2001 | 1,292 | 934 |
| 2002 | 1,342 | 977 |
| 2003 | 1,593 | 1,135 |
| 2004 | 2,001 | 1,405 |
| 2005 | 2,438 | 1,613 |
| 2006 | 2,886 | 1,904 |
| 2007 | 3,395 | 2,298 |
| 2008 | 4,146 | 2,621 |
| 2009 | 3,179 | 2,257 |
| 2010 | 3,941 | 2,750 |
| 2011 | 4,851 | 3,170 |
| 2012 | 4,933 | 3,255 |
| 2013 | 4,902 | 3,362 |
| 2014 | 4,910 | 3,447 |
| 2015 | 4,222 | 3,171 |
| 2016 | 3,974 | 3,122 |
| 2017 | 4,484 | 3,394 |
| 2018 | 4,994 | 3,688 |
| 2019 | 4,821 | 3,551 |
| 2020 | 4,469 | 3,195 |
The uptake in international supply chains over the 1990s to 2008 is evident when one looks at global trade data. The Organisation for Economic Co-operation and Development (OECD) Trade in Value Added (TiVA) database shows global goods and services exports more than tripling from US$1.8 trillion in 1995 to US$6.8 trillion in 2008. Moreover, as shown in Figure 2.2, two-thirds of this growth is accounted for by exports of intermediate goods and services—a common proxy for supply chain trade. These goods and services are “tangible and intangible products utilized as inputs in production, excluding fixed assets. Trade statistics on intermediate products reflect the exchanges of parts, components, accessories and intermediary services taking place within supply chains.”Footnote 6 In short, international trade in this period expanded rapidly and was largely driven by trade in intermediate inputs, giving rise to international supply chains.
Figure 2.3: Growth in global commercial services exports
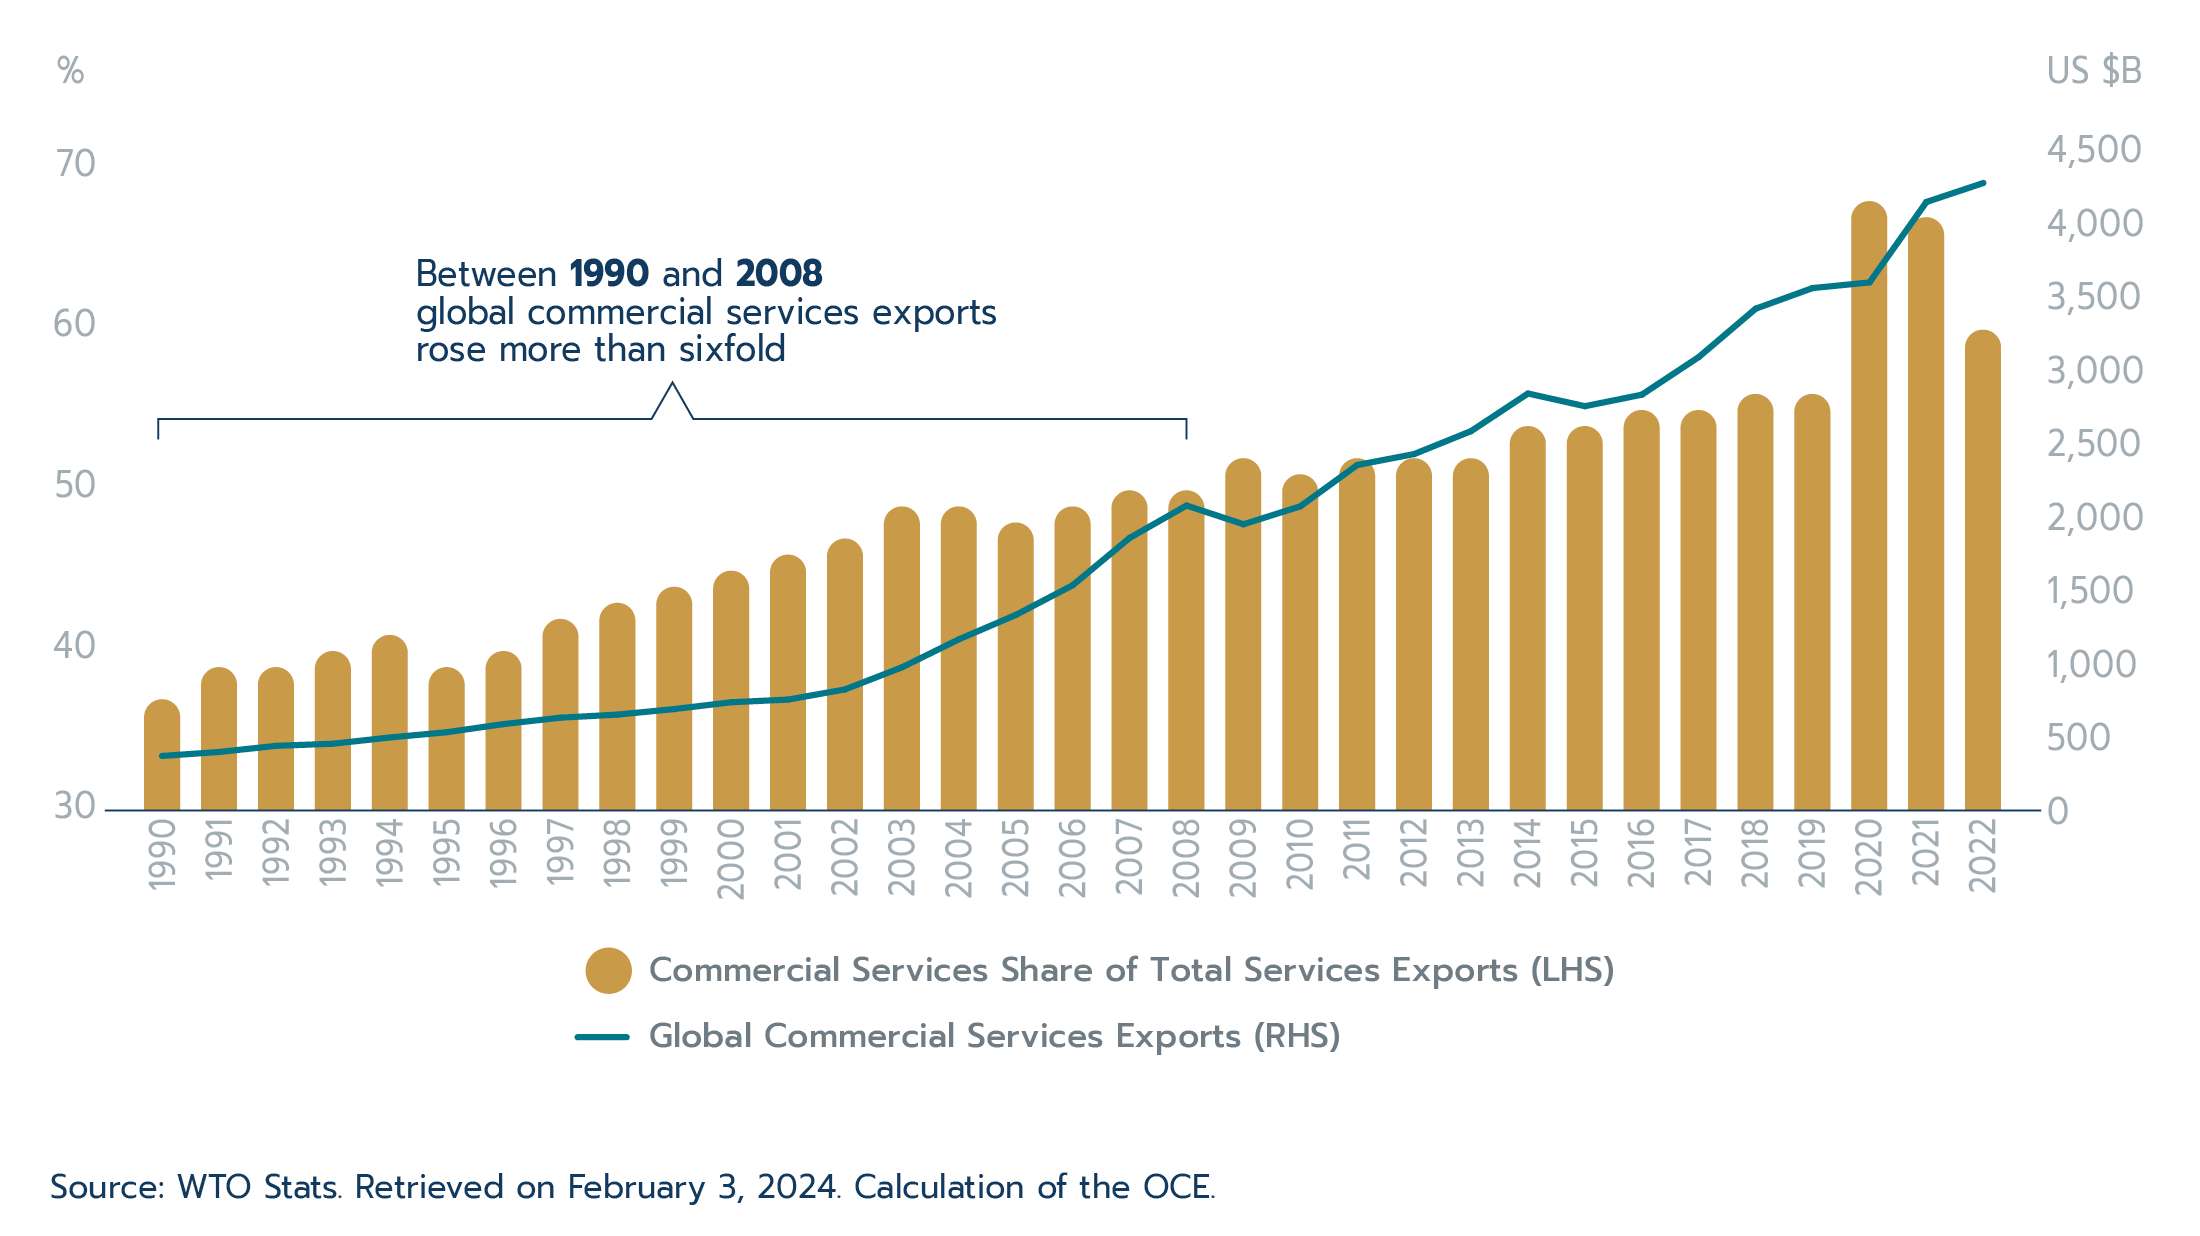
Text version - Figure 2.3
| Year | Commercial Services Share of Total Services Exports (LHS), percentage share | Global Commercial Services Exports (RHS), US$ billions |
|---|---|---|
| Source: WTO Stats. Retrieved on February 3, 2024. Calculation of the OCE. | ||
| 1990 | 36% | 303 |
| 1991 | 38% | 329 |
| 1992 | 38% | 371 |
| 1993 | 39% | 386 |
| 1994 | 40% | 428 |
| 1995 | 38% | 464 |
| 1996 | 39% | 519 |
| 1997 | 41% | 563 |
| 1998 | 42% | 584 |
| 1999 | 43% | 622 |
| 2000 | 44% | 668 |
| 2001 | 45% | 686 |
| 2002 | 46% | 755 |
| 2003 | 48% | 906 |
| 2004 | 48% | 1,096 |
| 2005 | 47% | 1,262 |
| 2006 | 48% | 1,464 |
| 2007 | 49% | 1,786 |
| 2008 | 49% | 2,007 |
| 2009 | 51% | 1,879 |
| 2010 | 50% | 2,001 |
| 2011 | 51% | 2,283 |
| 2012 | 51% | 2,357 |
| 2013 | 51% | 2,513 |
| 2014 | 53% | 2,769 |
| 2015 | 53% | 2,683 |
| 2016 | 54% | 2,761 |
| 2017 | 54% | 3,017 |
| 2018 | 55% | 3,346 |
| 2019 | 55% | 3,487 |
| 2020 | 67% | 3,525 |
| 2021 | 66% | 4,073 |
| 2022 | 59% | 4,202 |
Supply chains, however, are more than just the sourcing of physical inputs; they also include the sourcing of skills or services needed to produce products. While Figure 2.2 shows the growth in intermediate goods and services from 1995 to 2008, Figure 2.3 focuses on services alone. Commercial services—when excluding transport and travel—serve as a good measure of the types of skills and services used by businesses. They include a wide variety of services such as R&D, legal services, marketing and advertising, engineering, and computer and information services, just to name a few. Figure 2.3 shows global commercial services exports expanded more than sixfold from US$303 billion in 1990 up to US$2 trillion as of the global financial crisis (2008). This growth outpaced total services growth—which includes travel, transportation and government services—over this period, with commercial services expanding from one-third of global services to nearly half (49%), as seen by the bars in Figure 2.3.
Another dimension of the spread of international supply chains from the early 1990s to the late 2000s is also seen when one looks at trends in global foreign direct investment (FDI). This data shows two important trends highlighting growth in supply chains. Firstly, the overall strong growth in total global FDI over this period points to businesses expanding their plants and facilities abroad and establishing the capital and infrastructure required for international supply chains. According to data from the UNCTAD, the global stock of FDI grew more than sixfold between 1990 and 2008, outpacing growth in trade. Secondly, the other trend shown in the FDI data is the role of emerging and developing economies in supply chain growth. The share of inward FDI stock accounted for by developing economies increased from 23% to 27% over this period. While these 4 percentage points equated to a US$3.5 trillion increase in FDI stock in developing economies, it also indicated that the majority of FDI activities was still between developed economies, again indicating that there was more to the fragmentation of production across borders than just the search for low-cost labour. Within emerging and developing economies, China was the major recipient of FDI over this period, with its share of global FDI flows expanding from 2% in 1990 to 7% in 2008. The large influx of foreign investment in China over this period was driven by western firms’ utilization of China into their supply chains, which in turn made an important contribution to China’s incredible economic growth.
Several studies using more complex data and measurement methods also reveal strong growth and creation of supply chains from the early 1990s to 2008. One of these studies is Degain, Meng and Wang (2017), where the authors use world input-output tables to identify the foreign value-added content used in production that is then used for further export (i.e., crosses an international border twice). The authors found that these complex global value chains-related, cross-border, production-sharing activities drove globalization and gross domestic product (GDP) growth from 1995 to 2008.
The benefits and costs of international supply chains
The growth of supply chains from the early 1990s to 2008 was not a random occurrence or without reason. Supply chains were created by businesses, because the dissemination of business activities across borders came with great benefits. The benefit to these firms can be boiled down to increased productivity. Criscuolo and Timmis (2017) summarize several channels of firms’ productivity gains from international supply chains, which include access to imported inputs, knowledge spillovers, increased competitiveness from exposure to foreign competition and allowing for firms to focus on core tasks. Baldwin and Yan (2014) and Globerman (2011) propose that by allowing for the fragmentation of production across nations, firms gain a finer division of labour and specialization, and business activities can be carried out wherever the necessary skills and materials are available at the most competitive cost. Acemoglu and Tahbaz-Salehi (2020), for their part, propose that supply chains generate productivity gains by enabling input customization.
One might think that the main gain in productivity to firms would be sourcing intermediates from countries with lower cost labour; however, this may not necessarily be the case. Baldwin and Yan (2014) show that for Canadian manufacturers, productivity growth was higher for firms that imported intermediates from and exported products to other high-wage countries. For these authors, a major benefit of supply chains is the enabling of technological transfer. Namely, Canadian manufacturers gain access to better technology and know-how. When looking at Canadian data, we see that in 2022 over half (53%) of Canadian imports of intermediates goods and over two-thirds (69%) of imports of commercial services were sourced from the U.S., a country with similar labour costs to Canada, but known for their competitiveness in advanced technology, R&D, and a highly educated and skilled workforce.
The benefits from supply chains do not just reward firms. It has been shown that efficiency gains from international supply chains can be linked to lower and more stable prices through much of the 1990s and up to the global financial crisis. While these lower prices benefited consumers, they also allowed central banks to lower interest rates and spur economic growth. Soyres and Franco (2020) find evidence that trade integration led to lower inflation and that international supply chain participation led to higher correlation in inflation patterns between countries. Andrews, Gal and Witheridge (2018) find indications that international supply chains have put downward pressure on producer prices mainly by allowing firms to substitute domestic inputs with lower cost foreign inputs. The authors argue that international supply chain participation puts downward pressures on unit labour costs by raising productivity and reducing wages in the importing country, which is particularly evident when low-wage countries are integrated in supply chains. In the case of Canada, Kim (2020), looking at only products from China, finds that imports reduced prices in Canada by 1.2 percentage points between 2001 and 2011.
As with all things, this is not to say that international supply chains might not come without drawbacks or costs. As already pointed to in Andrews, Gal and Witheridge (2018), decreasing prices as a result of productivity gains may partly be due to declining wages. Other studies have shown that international supply chains may also be linked to job losses. Kennedy and Mazzocco (2022) review the findings of several influential studies on the impact of greater trade with China on U.S. jobs. They generally conclude that jobs were lost and that this had important implications for specific workers and U.S. regions, but they are unable to fully account for employment gains elsewhere and what contributed to those gains. For Canada, Kim (2020) finds evidence that Canadian workers were indeed displaced by increased import competition from China. However, it is important to also note that many workers start and stop employment in any given year and that this churn between jobs is an important part of economic growth.
International supply chains can also be a vector to transmit shocks or contagion across borders. This is described well in Acemoglu and Tahbaz-Salehi (2020): by developing a non-competitive model where customized supplier-customer relations increase productivity, they demonstrate that one firm’s failure can spread through suppliers and customers in the production network. In other words, international supply chains can help perpetuate a negative shock and, because of their global nature, possibly across borders. The 2008 global financial crisis (GFC) is a likely example, according to Sydor (2011): while the crisis initially started in financial and housing sectors in a limited number of countries and was mainly spread through financial sector, linkages through supply chains also likely contributed. The author uses the example that lower demand in the U.S. reduced production in China, which further reduced production in other supplier countries. Global real GDP declined 0.1% in 2009 and goods and services trade volumes declined 10.3%; however, both GDP and trade recovered in the following year, up 5.5% and 12.8% respectively, in 2010. International supply chains likely played a role here as well, with recovery in one country increasing demand for producers and suppliers in other countries.
Maturing international supply chains: Post global financial crisis to the 2019 pandemic
After the global financial crisis of 2008 there was a deceleration in the growth of supply chain trade. This is again evident in Figure 2.2 where, according to the OECD data, between 2008 and 2019, global exports grew at only a 2.0% annual average, compared to 10.5% from 1995 to 2008. Furthermore, while intermediate goods and services exports, our proxy for supply chain trade, outpaced total export growth in the pre-global financial crisis period, from 2008 to 2019, it lagged total export growth, gaining only 1.4% per year from 2008 to 2019. In addition, the complex international supply chain trade measure used by Degain, Meng and Wang (2017) showed a decline in complex supply chain trade between 2012 to 2015.
While the growth in supply chain trade lagged behind total trade over this period, it is not to say that the phenomena of international supply chains had reversed or that supply chains were being dismantled. More likely, it represents a maturing of supply chain trade, with many global corporations now fully utilizing this model of production and less new supply chains being created. In other words, it is a deceleration of growth, not a reversal. Another interesting aspect of this period is that while physical intermediates lagged behind export growth, commercial services did not follow this trend. As seen in Figure 2.3, after a small downtick in 2009, commercial services continued to grow in the period from 2008 to 2019, albeit at a slower pace (5.2% vs. 11.9% per year). More importantly, they continued to outpace total services, with commercial services going from accounting for 49% of total global services trade in 2008 to 55% as of 2019. So, while trade in physical inputs may have slowed, it appears business services continued to grow.
Figure 2.4: China’s share of global intermediate exports
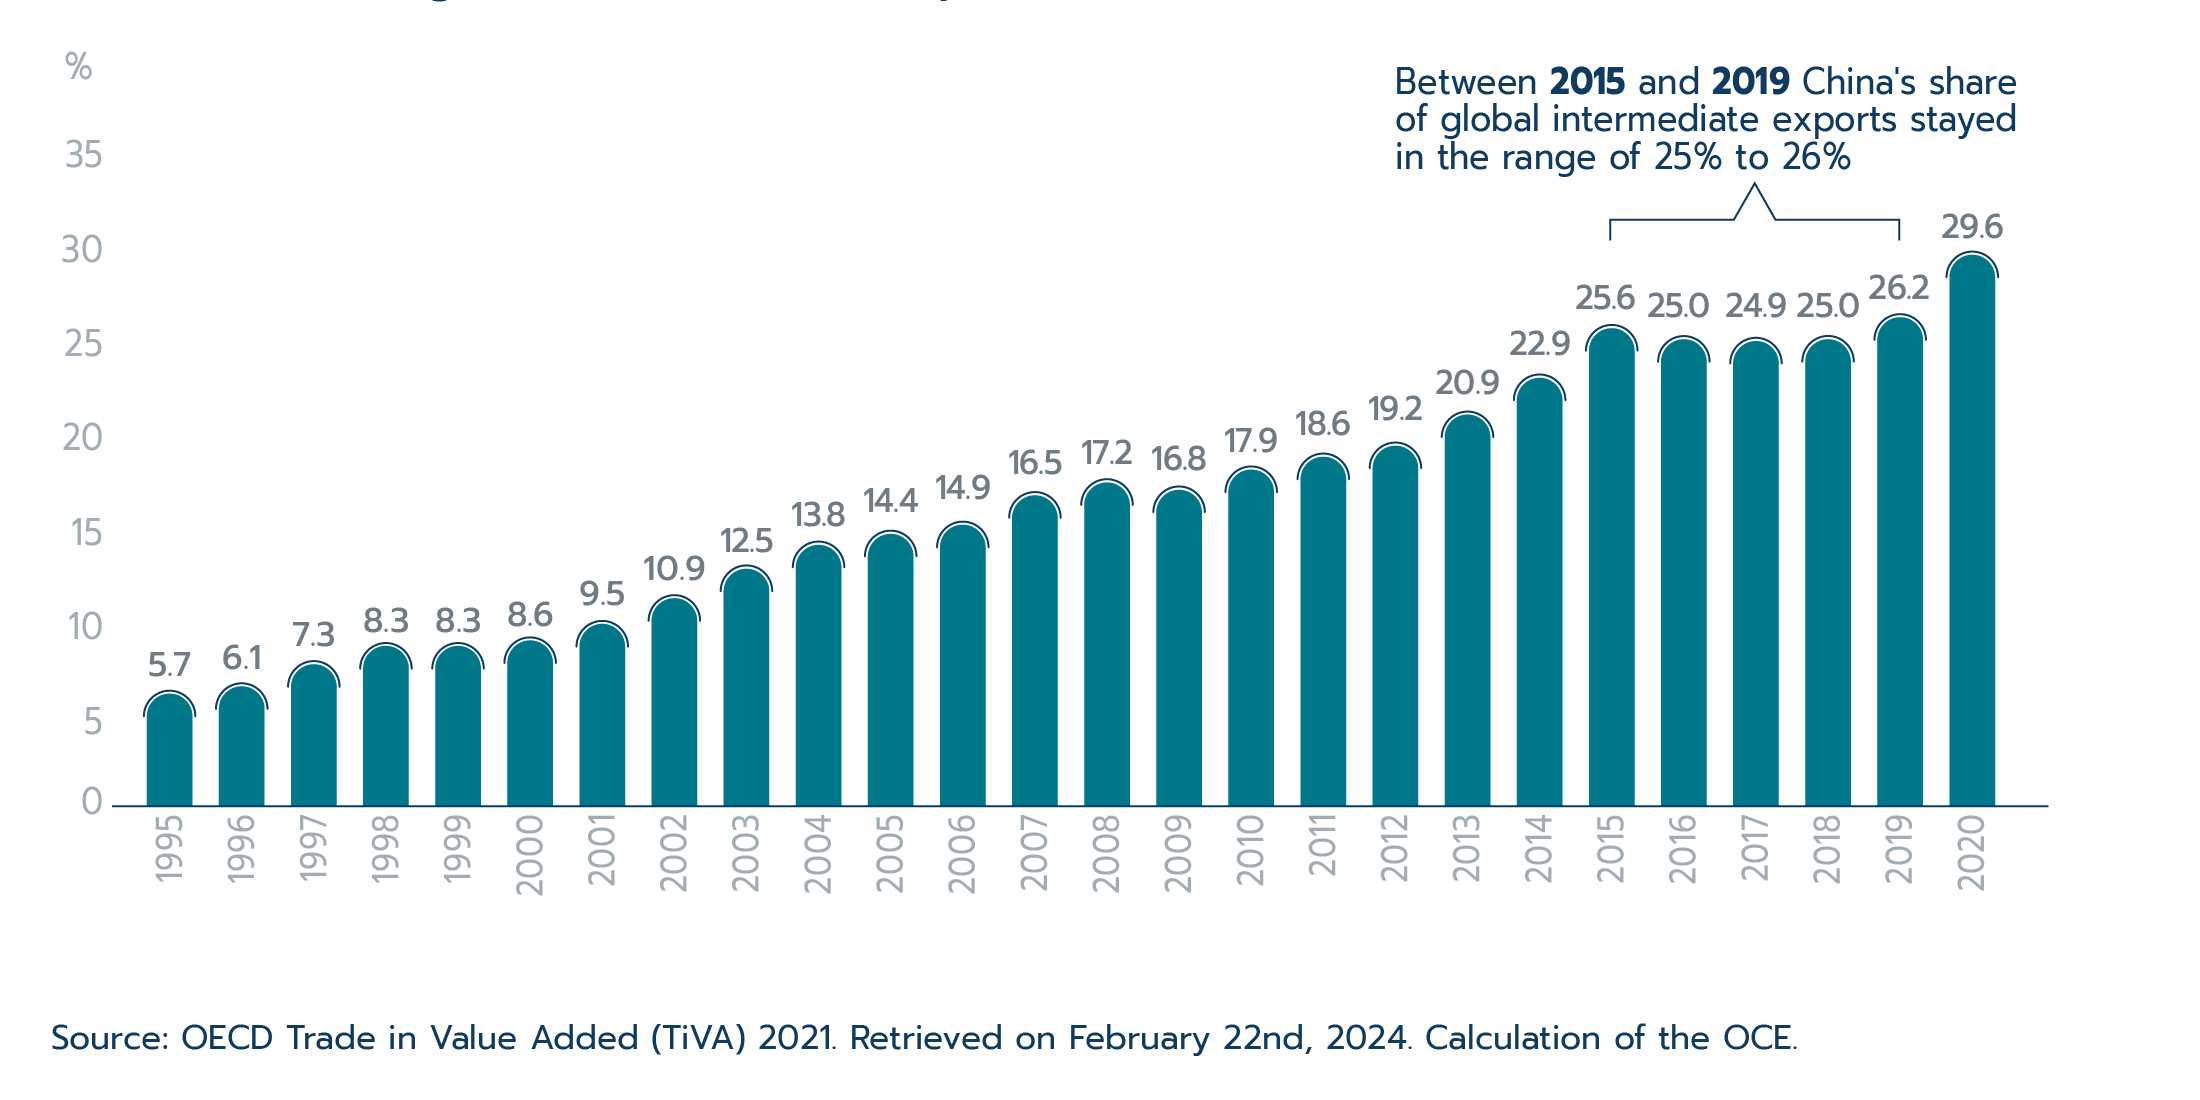
Text version - Figure 2.4
| Year | Percentage |
|---|---|
| Source: OECD Trade in Value Added (TiVA) 2021. Retrieved on February 22nd, 2024. Calculation of the OCE. | |
| 1995 | 5.7% |
| 1996 | 6.1% |
| 1997 | 7.3% |
| 1998 | 8.3% |
| 1999 | 8.3% |
| 2000 | 8.6% |
| 2001 | 9.5% |
| 2002 | 10.9% |
| 2003 | 12.5% |
| 2004 | 13.8% |
| 2005 | 14.4% |
| 2006 | 14.9% |
| 2007 | 16.5% |
| 2008 | 17.2% |
| 2009 | 16.8% |
| 2010 | 17.9% |
| 2011 | 18.6% |
| 2012 | 19.2% |
| 2013 | 20.9% |
| 2014 | 22.9% |
| 2015 | 25.6% |
| 2016 | 25.0% |
| 2017 | 24.9% |
| 2018 | 25.0% |
| 2019 | 26.2% |
| 2020 | 29.6% |
While China played a role in the growth of supply chain trade pre-global financial crisis, it may have also contributed to some of the slowdown after the crisis. As seen in Figure 2.4, while China’s share of global intermediate exports rose from 6 in 1995 to 26% in 2015, we see that it then stabilized and stayed at 25% to 26% for the next four years up to the COVID-19 pandemic. This is of note because China’s GDP continued to show strong growth over this period, which likely illustrates a deepening of the Chinese economy, with more intermediate trade within the country itself.
Growth in international supply chains over this period may have also been hindered by slower liberalization of trade policies and, in some cases, greater protectionism, particularly in the lead up to the COVID-19 pandemic. For instance, members’ notifications to the World Trade Organization (WTO) on domestic regulations that could impact international tradeFootnote 7 saw a 16% jump between 2017 and 2018, followed by a 9% increase the following year. In addition, the 5 years leading up to 2019 were marked with several significant events that were detrimental to trade, or that may have added uncertainty to firms’ supply chain strategies. Prime examples include Brexit (2016) and China-U.S. trade tensions (2018 to present).
The challenges facing international supply chains from trade tensions and protectionism are still felt today, but before discussing current supply chain challenges, part 2 of this special feature will look at a major test to the resiliency of international supply chains: the COVID-19 pandemic.
2.2 International supply chains during COVID-19
COVID-19 sheds a bright light on international supply chains
Coronavirus disease 2019 (COVID-19) was first identified in December 2019 and quickly spread across the globe in the early months of 2020. COVID-19 was the deadliest health pandemic seen since the Spanish flu of 1918–1920. It was also a significant disruption to the world economy, causing border closures, travel restrictions, and roving shutdowns of plants and factories as workers were sent home to quarantine. COVID-19 resulted in the largest and fastest fall in global economic output since the Great Depression. For Canada, it triggered a recession far deeper than any others of this recent generation, with Canadian real GDP falling almost three times as much as the global financial crisis (2008-2009) and in half the time (see Figure 2.5). It also shone a bright light on the potential vulnerability of international supply chains: what was once a dry topic of discussion solely for a few specialists was now being discussed at Canadians’ kitchen tables.
Figure 2.5: Canada’s quarterly recession patterns
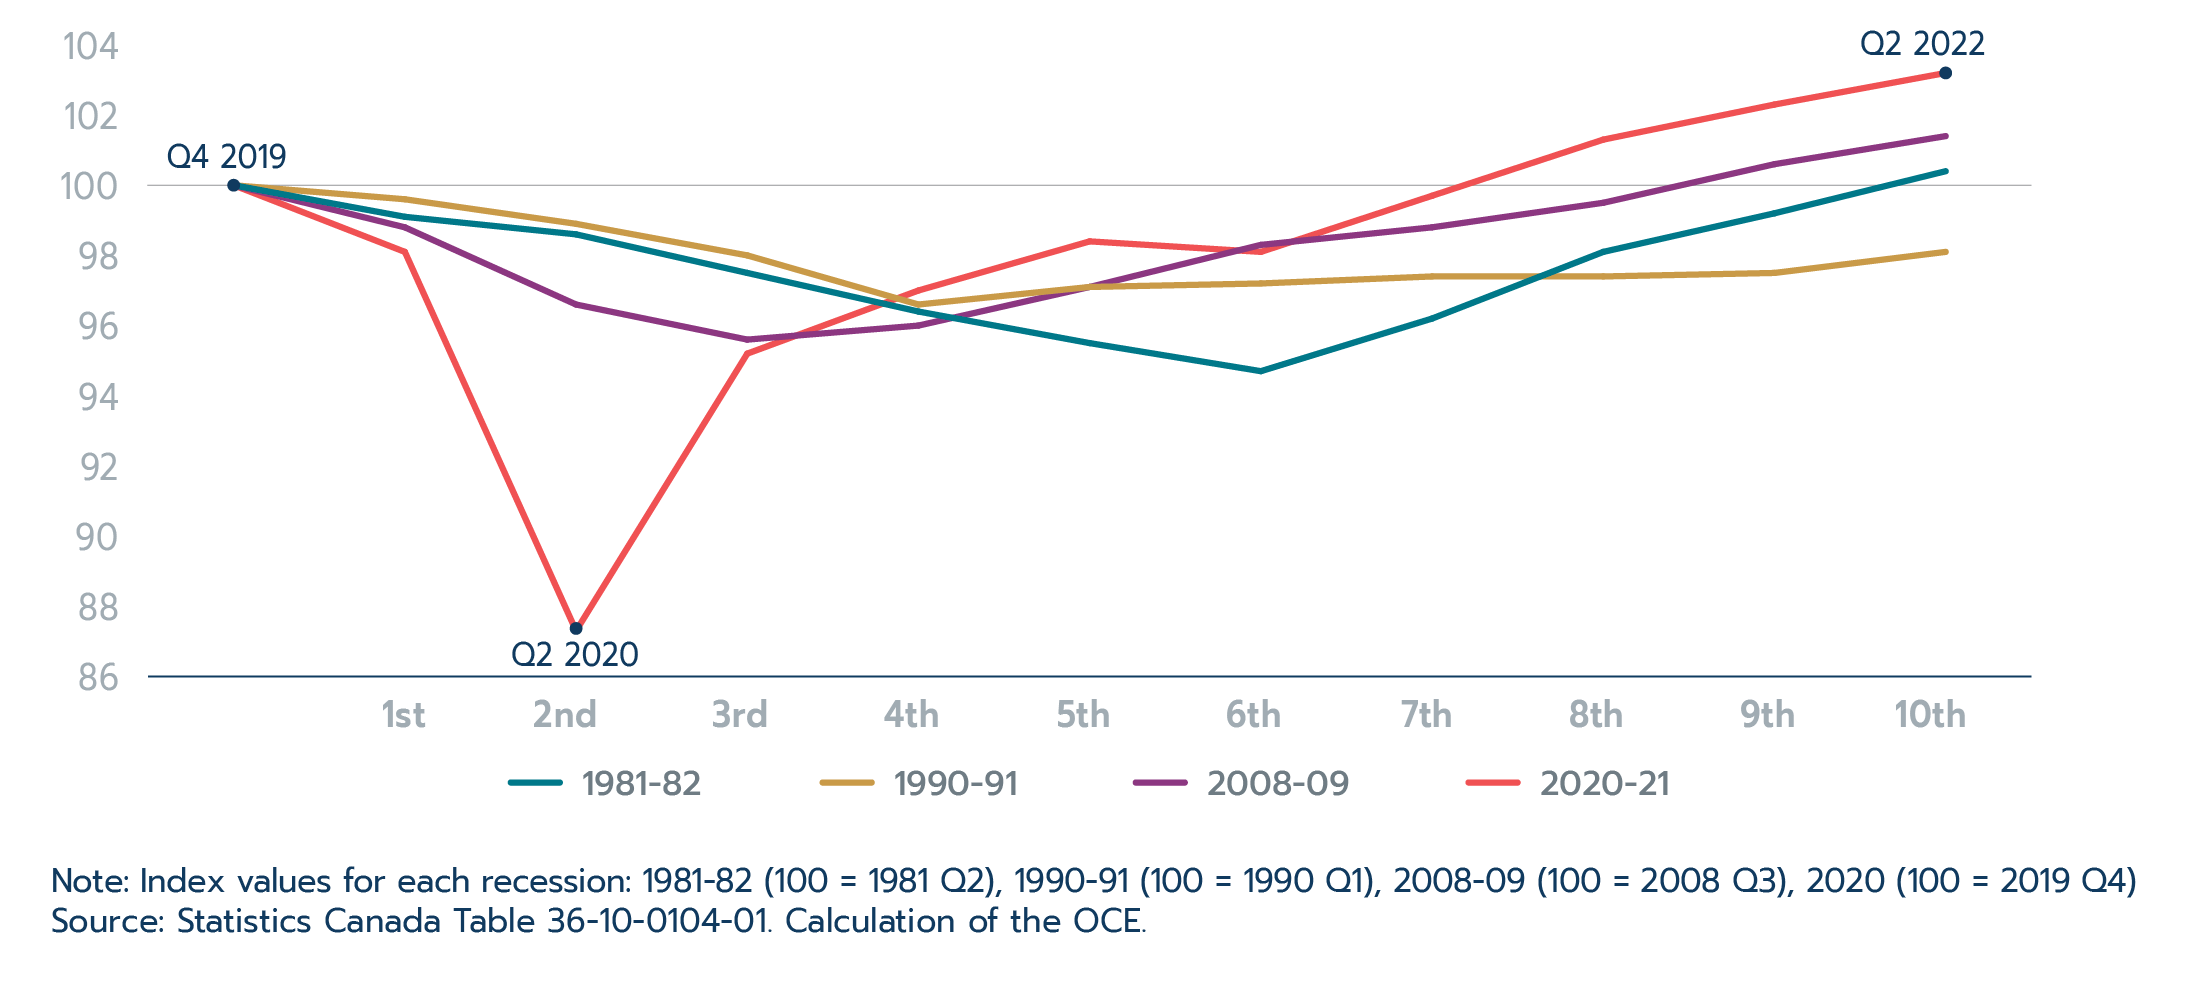
Text version - Figure 2.5
| 1981-82 | 1990-91 | 2008-09 | 2020-21 | |
|---|---|---|---|---|
| Note: Index values for each recession: 1981-82 (100 = 1981 Q2), 1990-91 (100 = 1990 Q1), 2008-09 (100 = 2008 Q3), 2020 (100 = 2019 Q4) Source: Statistics Canada Table 36-10-0104-01. Calculation of the OCE. | ||||
| 2019 - Q4 | 100.0 | 100.0 | 100.0 | 100.0 |
| 1st - 2020 - Q1 | 99.1 | 99.6 | 98.8 | 98.1 |
| 2nd - 2020 - Q2 | 98.6 | 98.9 | 96.6 | 87.3 |
| 3rd - 2020 - Q3 | 97.5 | 98.0 | 95.6 | 95.2 |
| 4th - 2020 - Q4 | 96.4 | 96.6 | 96.0 | 97.0 |
| 5th - 2021 - Q1 | 95.5 | 97.1 | 97.1 | 98.4 |
| 6th - 2021 - Q2 | 94.7 | 97.2 | 98.3 | 98.1 |
| 7th - 2021 - Q3 | 96.2 | 97.4 | 98.8 | 99.7 |
| 8th - 2021 - Q4 | 98.1 | 97.4 | 99.5 | 101.3 |
| 9th - 2022 - Q1 | 99.2 | 97.5 | 100.6 | 102.3 |
| 10th - 2022 - Q2 | 100.4 | 98.1 | 101.4 | 103.2 |
For the most part, however, international supply chains held up well during the pandemic. Indeed, throughout the COVID-19 pandemic, Canadians continued to have access to most goods and services they required. That is not to say there were no disruptions over this time, as there were some notable shortages in personal protective equipment (PPE), medicines, and microchips (see Box 2.1), just to name a few. Yet, for the most part, stores remained well stocked with essential goods,Footnote 8 and Canadian business continued to have access to the inputs needed to keep their factories, plants, warehouses, and corporate offices running, in the latter case with many Canadian office workers now logging in from home.
Box 2.1: Microchips cause macro problems
One of the most high-profile supply chain issues during the pandemic was that of microchips.Footnote 9 Like other products examined in this feature, the supply chain problems for microchips started with a demand shock. However, while the production for most other products quickly scaled up and the limiting factor was on the transportation network, microchip output could not be increased sufficiently to meet the spike in demand. The factories in which microchips are produced, often called “fabs,” require large capital investments and years of planning. Furthermore, the production process itself is difficult to scale up quickly as some processes take a fixed amount of time due to the physics involved. The end result was a supply shortage. Microchips have become a critical input for nearly all aspects of a modern economy, but potentially no sector was more impacted by the microchip shortage during the pandemic than that of automobiles.
When the pandemic began, auto manufacturers feared an economic down-turn and, anticipating a collapse in sales, quickly scaled back production and cancelled orders with suppliers, including microchip manufacturers. While auto sales fell sharply at first as the world saw a historically large and rapid fall in output and trade, fiscal and monetary stimulus provided by governments and a rapid shift to remote work resulted in a rebound that was equally historic. And with that rebound, there was an unexpectedly strong demand for cars.
Unfortunately, as auto manufacturers attempted to re-establish their supplies of microchips, they found that others, such as the makers of videogame consoles, exercise equipment, laptops etc., had already locked up supplies. It is estimated that global auto production fell short by 12.5 million vehicles over 2021 and 2022 due to the microchip shortage (S&P Global 2023). That production shortfall translates into under-used factories, empty dealerships, lost jobs, and unhappy consumers.
Auto production accounts for only about 10-15% of global microchip usage with the rest going in all other manner of products from smart phones to washing machines (MIT Management 2022). Microchips, however, are increasingly important for automotive production, being used in everything from improving engine efficiency to LED screens. The average modern car will have between 1,400 to 1,500 microchips with some having as many as 3,000 micro-chips (DRrex 2023). This makes it impossible to make a modern vehicle without them. Auto manufacturers did the best they could with what they had, often prioritizing the production of the higher-end and most profitable vehicles, but the economic impact was widely felt.
Microchip designers and manufacturers
Microchip producers also did as much as they could to meet the demand. Microchip production during the pandemic reached an all-time high as is reflected in global trade. Exports of microchips in 2022 were 65% higher than 2019, prior to the pandemic (see Figure 2.6). The “fabs” in which microchips are produced, however, require huge capital investments and take a long time to produce. Microchip production itself is a delicate process and relies on physical properties such as growing crystals that are impossible to increase over the short term. Supply could not increase sufficiently to meet the increased demand for microchips during the pandemic. Taken as a whole, microchip shortages during the pandemic may be mostly summarized as an inability to sufficiently scale up supply to meet a sudden spike in demand rather than necessarily a supply-chain problem.
Figure 2.6: Supply side perspective of the global chip shortage
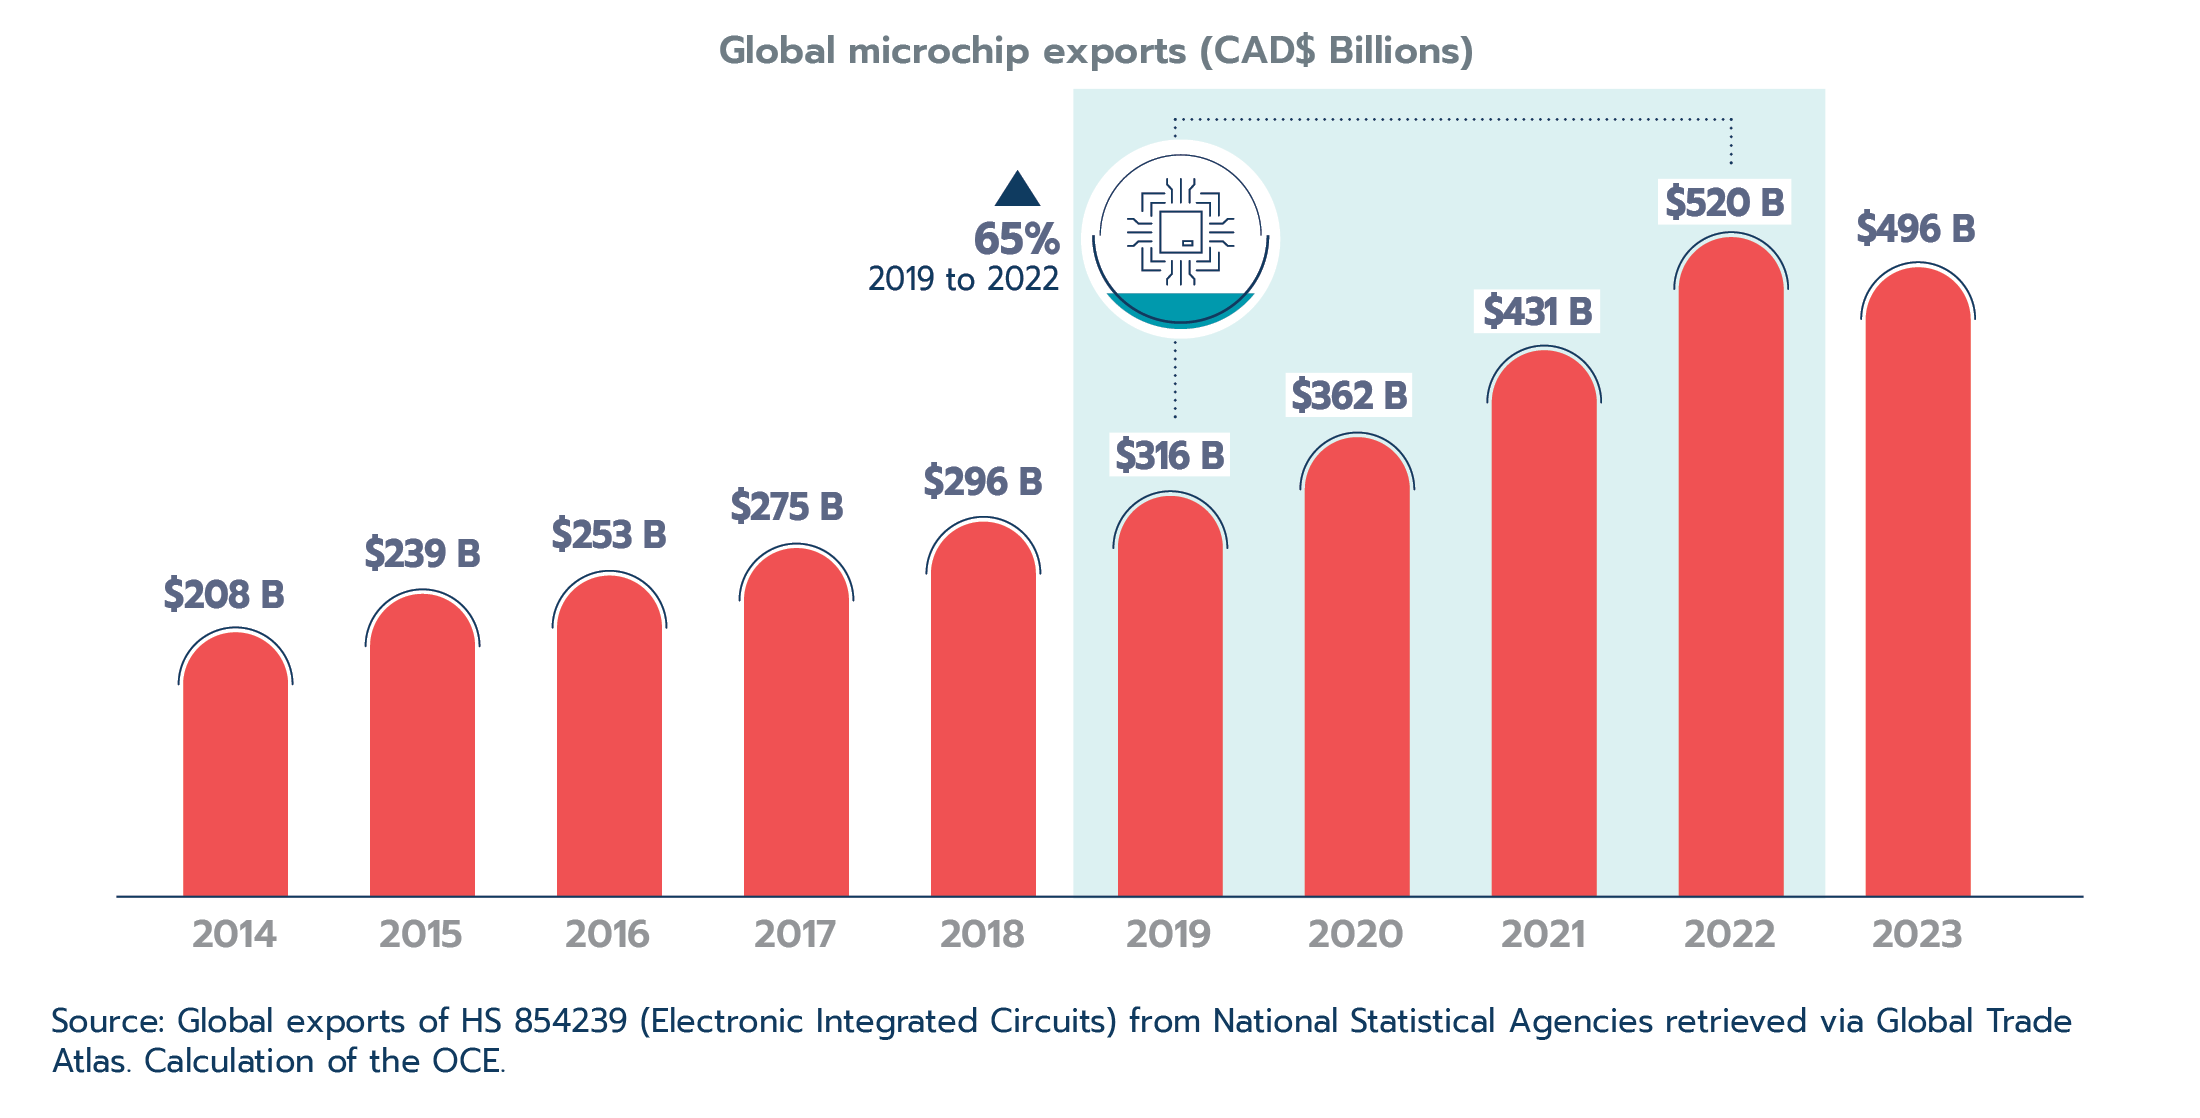
Text version - Figure 2.6
| Supply side perspective of the global chip shortage | Global microchip exports (CAD$ billions) |
|---|---|
| Source: Global exports of HS 854239 (Electronic Integrated Circuits) from National Statistical Agencies retrieved via Global Trade Atlas. Calculation of the OCE. | |
| 2014 | 208.4 |
| 2015 | 238.7 |
| 2016 | 253.1 |
| 2017 | 274.8 |
| 2018 | 295.6 |
| 2019 | 315.9 |
| 2020 | 362.2 |
| 2021 | 430.7 |
| 2022 | 519.9 |
| 2023 | 496.1 |
Broadly speaking, microchips can be broken into two types: memory and logic, with the former being in short supply during the pandemic and having garnered significant attention more recently. Furthermore, not all logic chips are of similar type. Those used in automotive production may not be the most sophisticated, but they must be very hardy, with the ability to withstand ongoing vibration and significant temperature swings. Meanwhile, the most advanced chips are on the leading edge of microchip production and often described in terms of nanometers because of how small transistors can be created and how close components can be fit together, and they must include other innovative factors such as rapid heat dissipation. These most advanced microchips are used to run data centres and train AI models. Although it is not these types of microchips that are used in most applications, and it was not these that saw shortages during the pandemic, they have garnered the most attention in the geo-political realm as countries worry about their role in the next generation of technologies.
Impact on Canada
In 2023, Canada’s imports of microchips totaled only $1.0 billion. However, this significantly understates Canada’s imports of microchips and their importance for the Canadian economy. Most microchips that cross Canada’s international borders are embedded in other products. In that same year, Canadian exports of microchips totaled $300 million, making Canada a significant net importer of microchips. Globally, microchip production is heavily concentrated in Asia with most production taking place in Taiwan, China, South Korea and Japan. Taiwan alone was responsible for 25.9% of Canadian microchip imports in 2023—that does not include those already embedded in other products.
Plans for domestic microchip manufacturing
As demand for electronics receded along with pandemic-induced restrictions, the shortage of microchips has abated. Microchips, however, have not become any less common in the headlines. More recently, the focus has been on U.S. efforts to reshore microchip production by using generous subsidies. Within the U.S., the share of modern semiconductor manufacturing capacity has eroded from 37% in 1990 to 12% today (U.S. Semiconductor Industry Association 2024). In July 2022, the U.S. government passed the CHIPS Act, which aims to strengthen domestic semiconductor manufacturing, design, and research, fortify the economy and national security, and reinforce America’s chip supply chains. However, the U.S. is not the only player in this game. Recently Japan has also provided subsidies to increase domestic production of leading-edge microchips. Microchips have thus become the backbone of most economies and of modern-day life. Microchips power not only smart phones, computers, and the Internet, which are all features of modern life, but also cars, washing machines, and any other product that uses microchips to some degree, including in health care. In short, microchips are critical to the economy and the health and security of Canadians. Ensuring a secure supply is thus essential.
COVID-19 causes a shift in consumer demand from services to goods
Looking back at this COVID-19 period, what we see is more a story of demand side shocks as opposed to supply side disruptions. The initial sharp decline in output quickly reversed as unprecedented fiscal and monetary stimulus across developed economies was beginning to take effect. As detailed in Makin and Layton (2021), the fiscal response to the crisis took various forms and varied by country, and it included: welfare payments to individuals, grants to small businesses, funding to firms to retain staff, and subsidized childcare, among other support programs. The IMF estimates global fiscal deficits increased by 6 percentage points from 2019 to 2020 to reach a high of 9.6% of world GDP. Monetary policy responses also varied by country; Saker (2020) details strong cuts in interest rates following the COVID-19 outbreak,Footnote 10 combined with various forms of asset purchases, credit and liquidity measures, as well as various macro-financial measures. This combination of robust fiscal and monetary support, and many economies being more resilient to COVID-19 than expected, led to strong recovery in the global economy. As seen in Figure 2.7, after falling 2.7% in 2020, global real GDP increased 6.5% in 2021.
Figure 2.7: Global real GDP growth (% change)
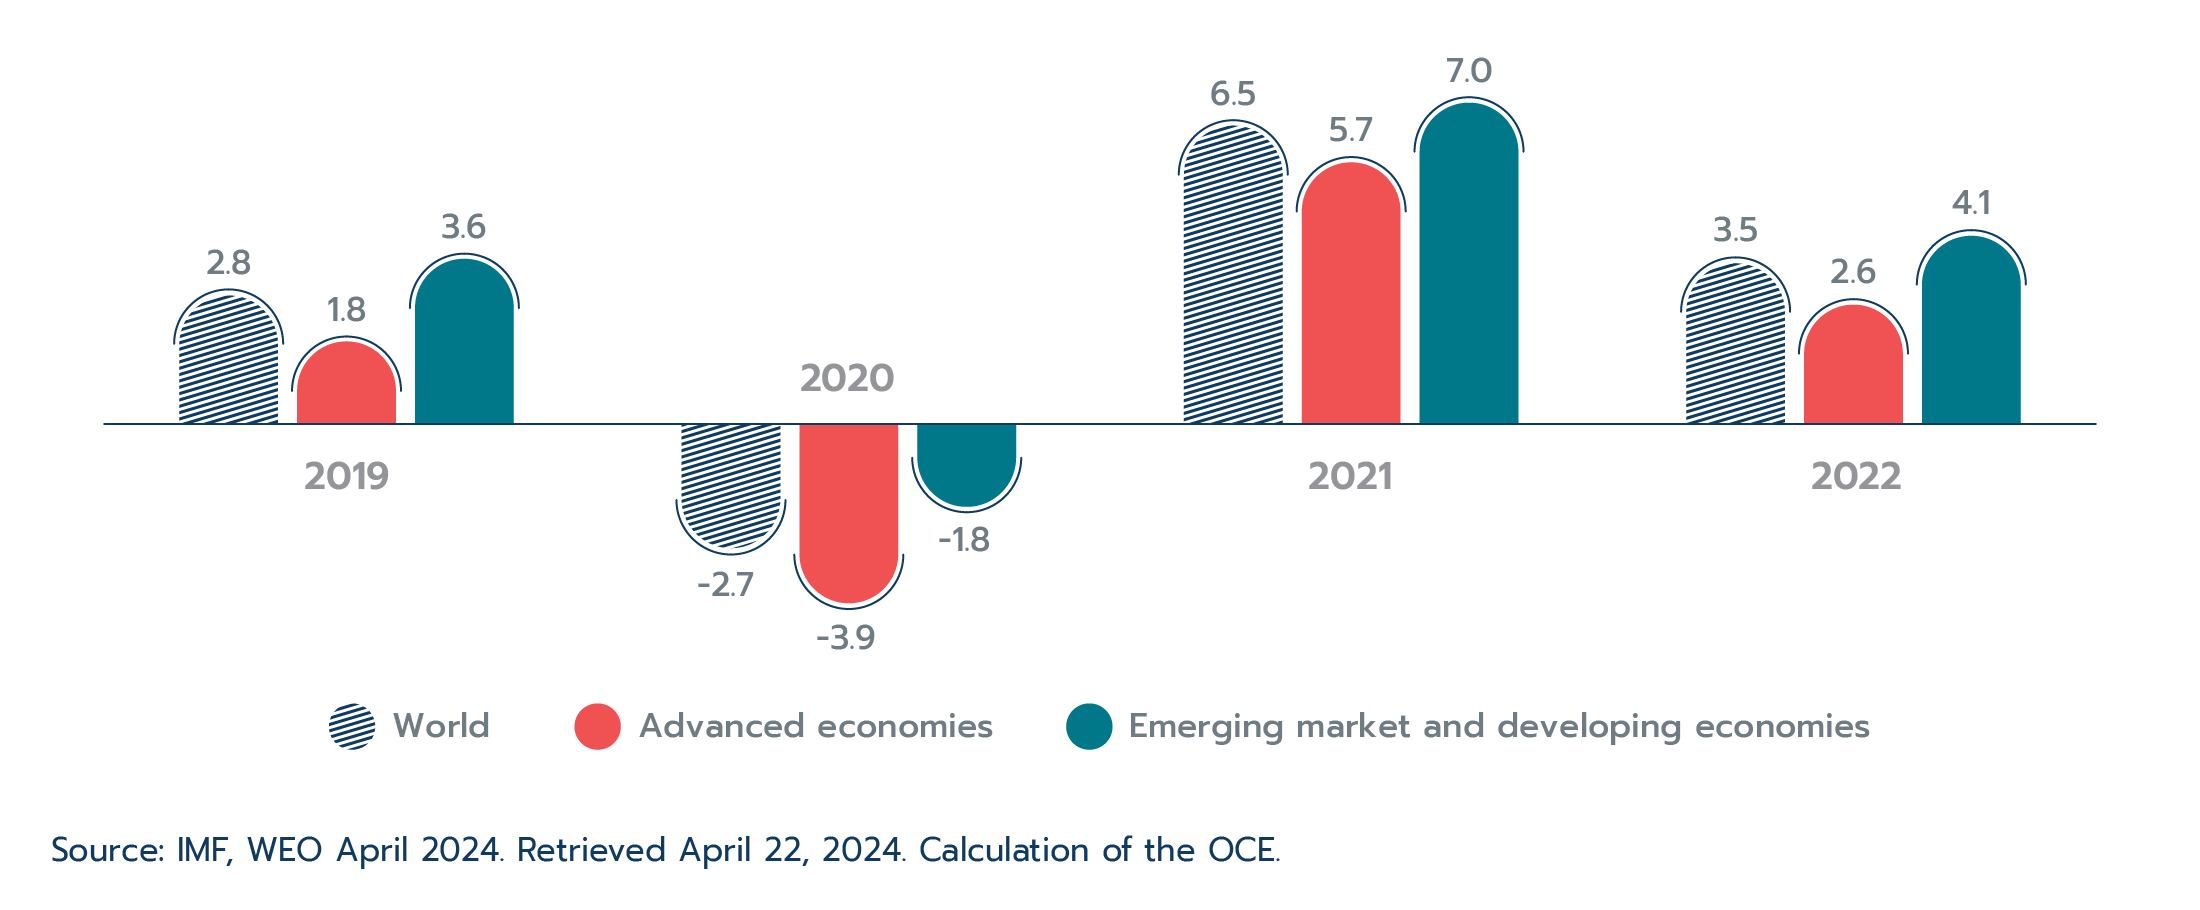
Text version - Figure 2.7
| Year | World | Advanced economies | Emerging market and developing economies |
|---|---|---|---|
| Source: IMF, WEO April 2024. Retrieved April 22, 2024. Calculation of the OCE. | |||
| 2019 | 2.8 | 1.8 | 3.6 |
| 2020 | -2.7 | -3.9 | -1.8 |
| 2021 | 6.5 | 5.7 | 7 |
| 2022 | 3.5 | 2.6 | 4.1 |
In addition to fiscal and monetary stimulus, consumer spending patterns also drastically changed. Consumers who were once spending large shares of their income on restaurant meals, movies, travel, and other services were now stuck at home looking for distractions. They purchased TVs, videogame machines, bread makers, exercise bikes, office chairs and started home improvement projects to make COVID-19 lockdowns more bearable. In short, stimulus, economic resilience, plus a change in lifestyles—which involved a shift from services to goods—led to a large demand side shock for consumer durables.
Figure 2.8 illustrates the significant shift in real personal consumption expenditures on goods during the COVID-19 pandemic in both Canada and the United States. In the U.S., the increase in consumer spending on goods was particularly strong, growing 18.6% from the fourth quarter of 2019 (start of the COVID-19 pandemic) to the fourth quarter of 2021. In the case of Canada, the increase is less pronounced but still considerable with goods expenditures increasing 11.7% from the first quarter of 2020 to the third quarter of 2021. However, as seen in Figure 2.8, when looking at a more detailed breakdown of Canadian consumer expenditures, exceptionally strong growth is seen in areas such as household furnishings, recreational goods, and products related to gardening and pet care, while, as mentioned, expenditures on services, particularly food beverage and accommodations services and travel expenditures, saw a sharp decline.
Figure 2.8: A large shift from services to goods
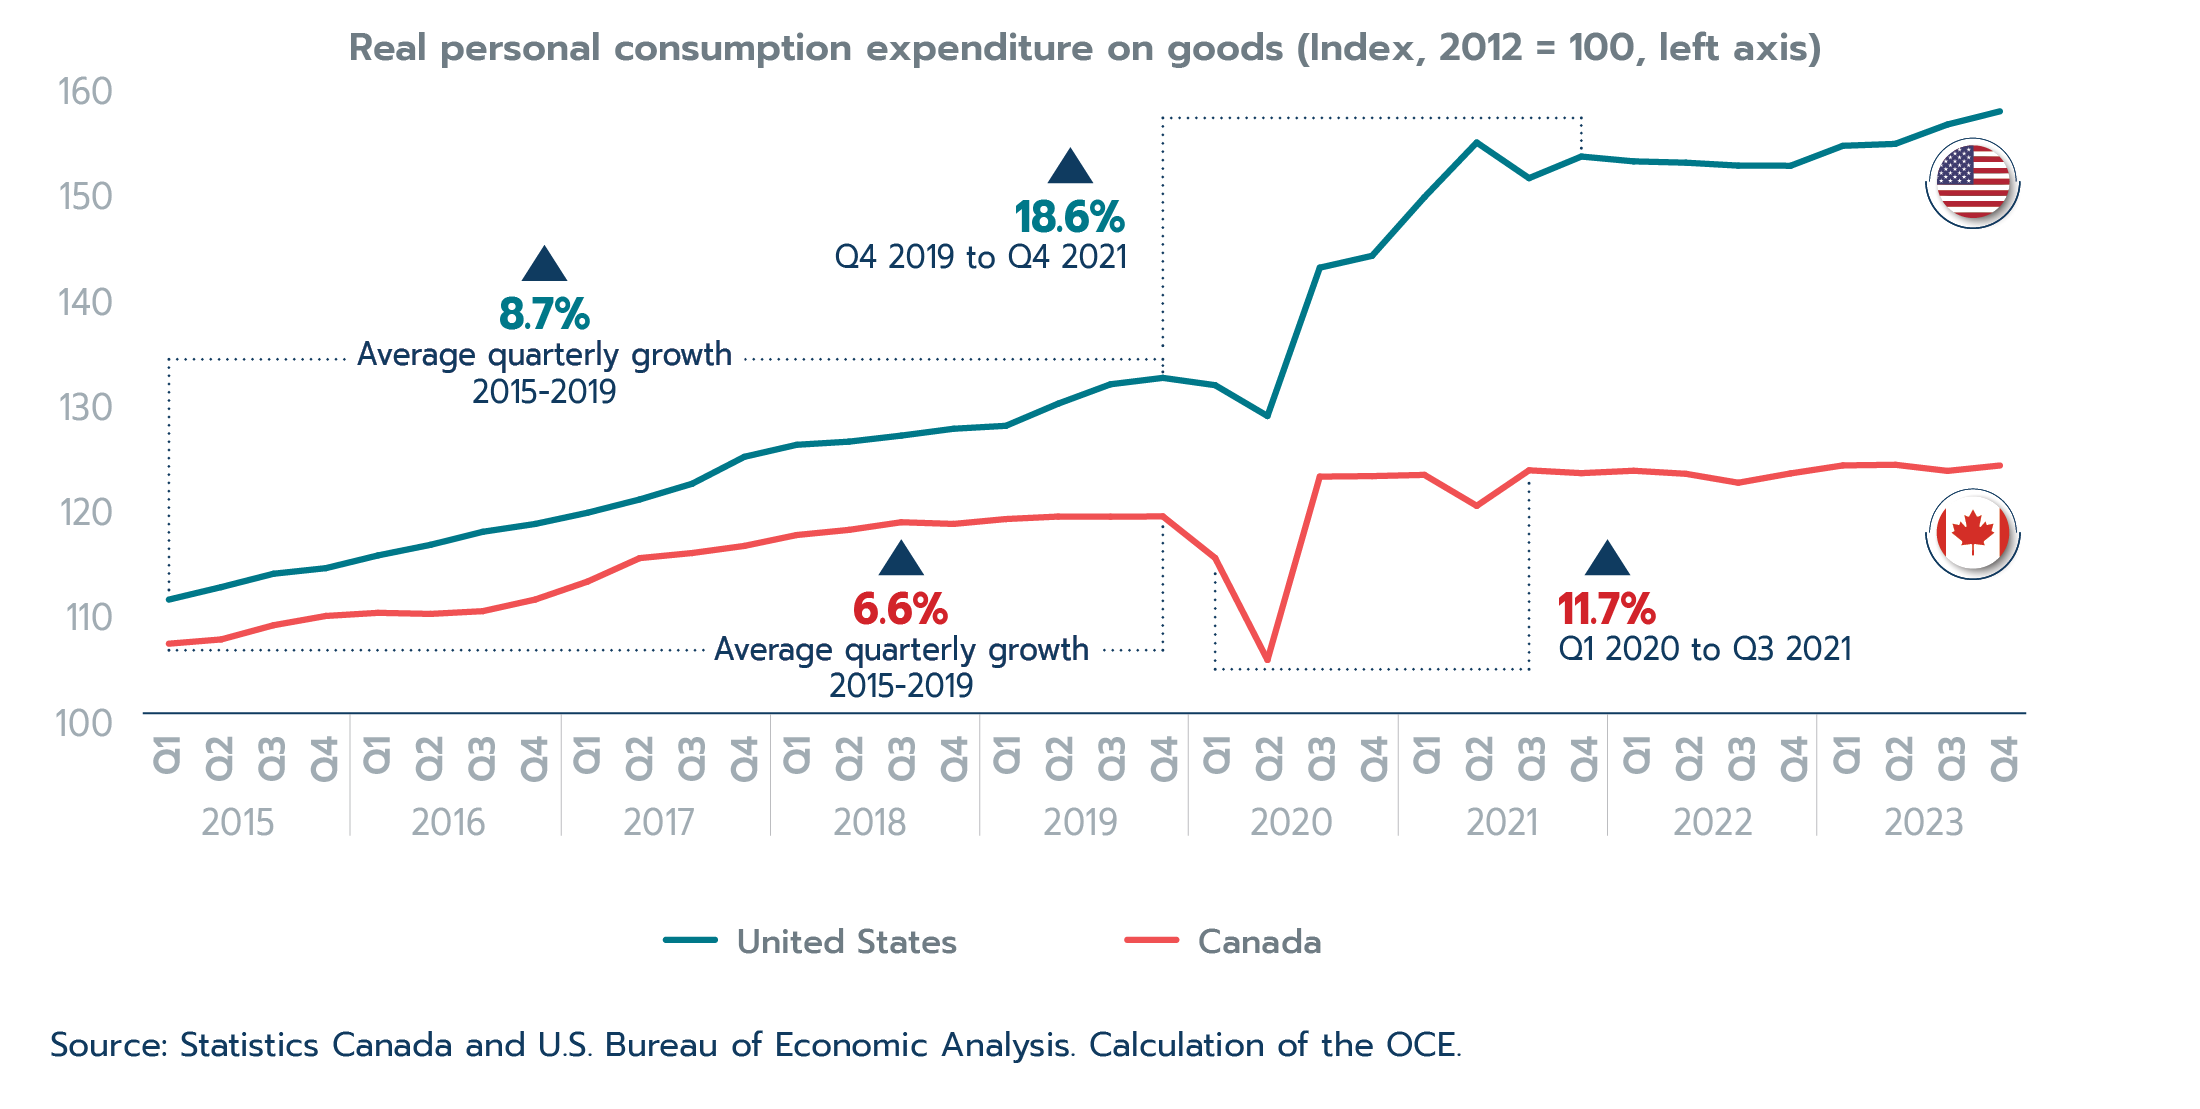
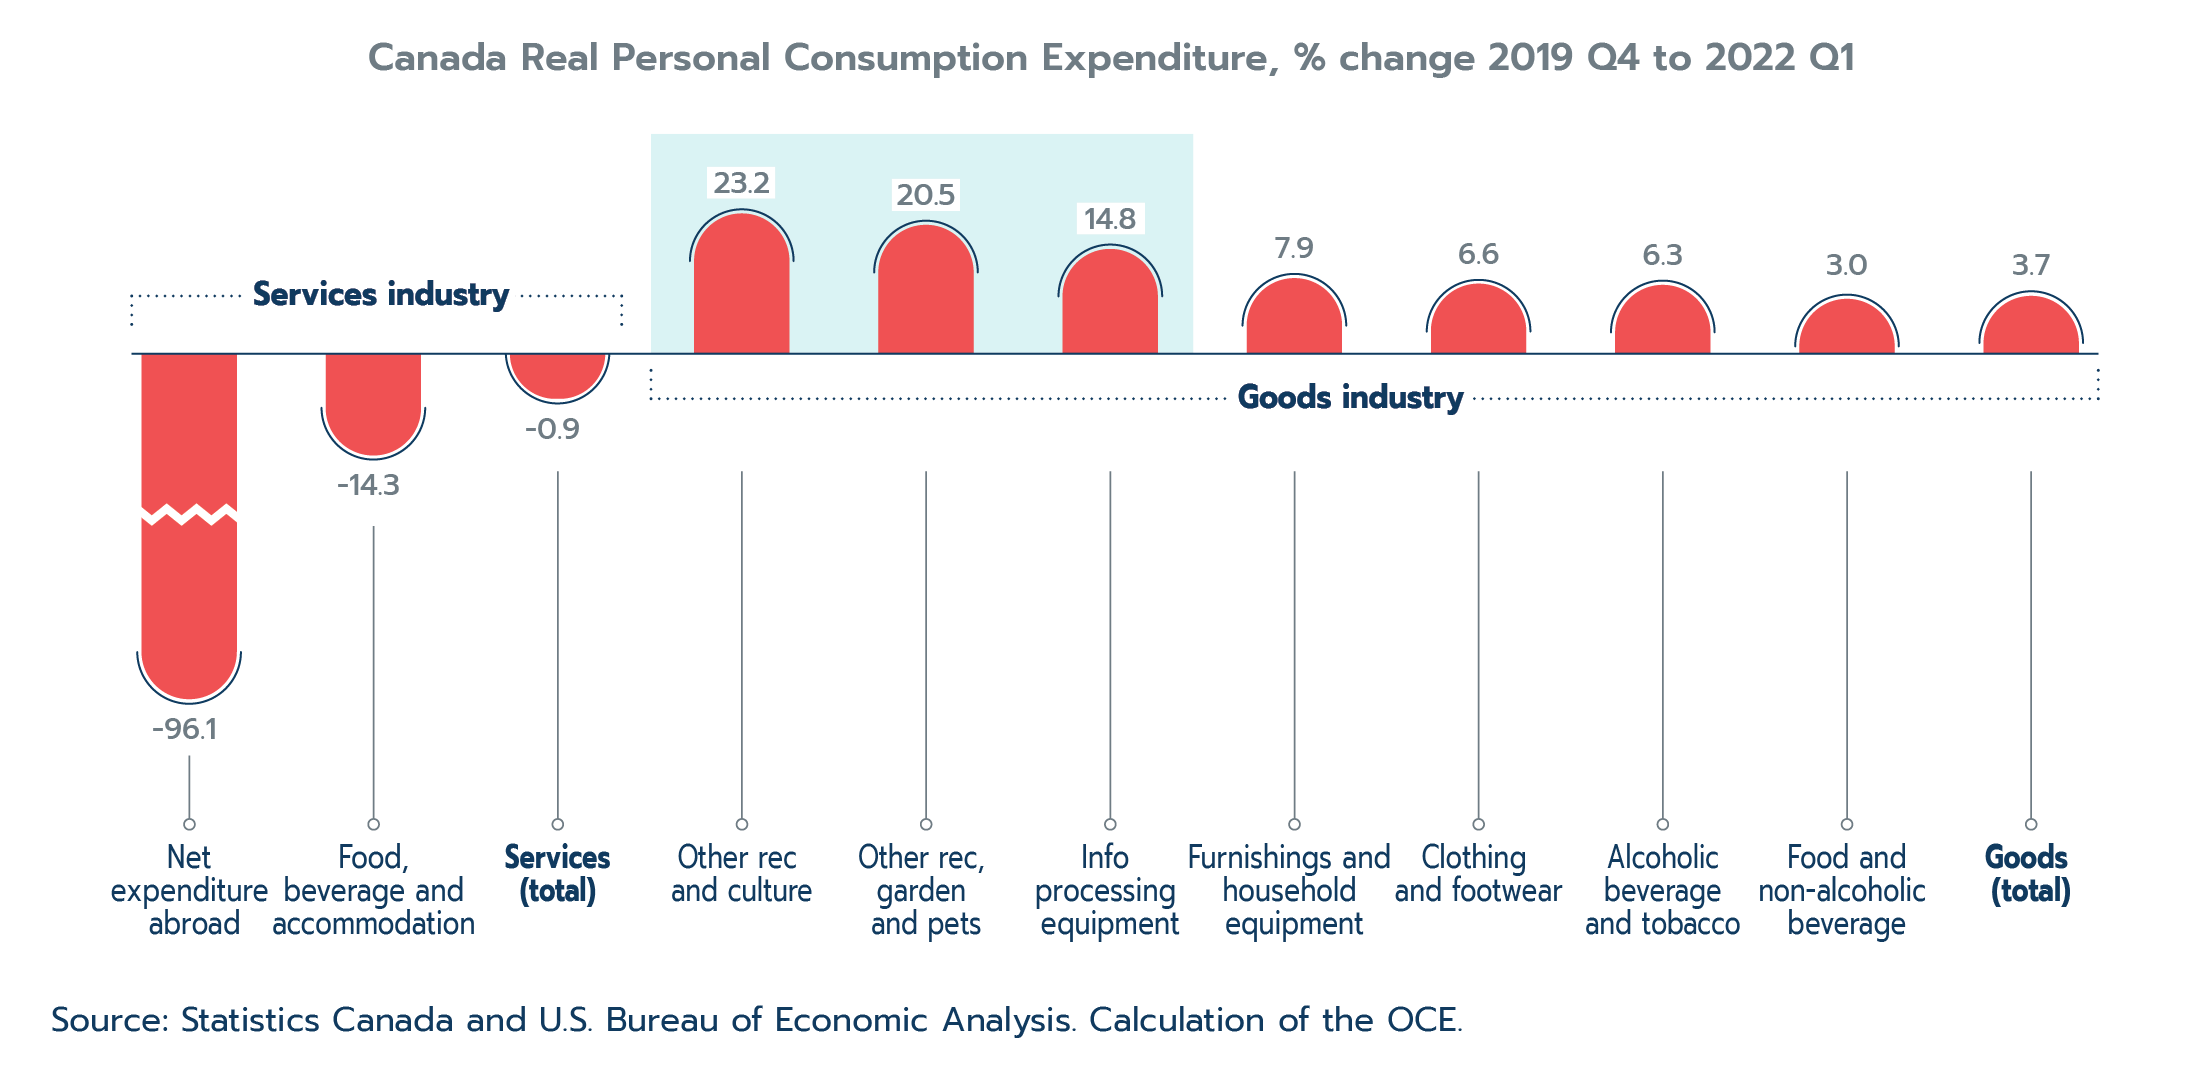
Text version - Figure 2.8
| Quarters | United States | Canada |
|---|---|---|
| Source: Statistics Canada and U.S. Bureau of Economic Analysis. Calculation of the OCE. | ||
| 2015: Q1 | 110.8 | 106.6 |
| 2015: Q2 | 112.0 | 107.0 |
| 2015: Q3 | 113.3 | 108.4 |
| 2015: Q4 | 113.8 | 109.3 |
| 2016: Q1 | 115.0 | 109.6 |
| 2016: Q2 | 116.0 | 109.4 |
| 2016: Q3 | 117.3 | 109.7 |
| 2016: Q4 | 118.0 | 110.8 |
| 2017: Q1 | 119.1 | 112.5 |
| 2017: Q2 | 120.3 | 114.8 |
| 2017: Q3 | 121.8 | 115.2 |
| 2017: Q4 | 124.4 | 115.9 |
| 2018: Q1 | 125.5 | 116.9 |
| 2018: Q2 | 125.8 | 117.4 |
| 2018: Q3 | 126.4 | 118.2 |
| 2018: Q4 | 127.0 | 118.0 |
| 2019: Q1 | 127.3 | 118.5 |
| 2019: Q2 | 129.4 | 118.7 |
| 2019: Q3 | 131.3 | 118.7 |
| 2019: Q4 | 131.9 | 118.7 |
| 2020: Q1 | 131.2 | 114.8 |
| 2020: Q2 | 128.3 | 105.1 |
| 2020: Q3 | 142.3 | 122.5 |
| 2020: Q4 | 143.5 | 122.5 |
| 2021: Q1 | 149.0 | 122.7 |
| 2021: Q2 | 154.2 | 119.7 |
| 2021: Q3 | 150.8 | 123.1 |
| 2021: Q4 | 152.9 | 122.8 |
| 2022: Q1 | 152.4 | 123.1 |
| 2022: Q2 | 152.3 | 122.8 |
| 2022: Q3 | 152.0 | 121.9 |
| 2022: Q4 | 152.0 | 122.8 |
| 2023: Q1 | 153.9 | 123.6 |
| 2023: Q2 | 154.1 | 123.6 |
| 2023: Q3 | 155.9 | 123.0 |
| 2023: Q4 | 157.2 | 123.5 |
| Average Quarterly Growth (2015-2019) | 8.7% | 6.6% |
| Growth Q1 2019 to Q4 2021 | 18.6% | N/A |
| Growth Q1 2020 to Q3 2021 | N/A | 11.7% |
| Quarters | % change |
|---|---|
| Source: Statistics Canada and U.S. Bureau of Economic Analysis. Calculation of the OCE. | |
| Net Expenditure Abroad | -96.1 |
| Food, Bev & Accommodation | -14.3 |
| Services (total) | -0.9 |
| Other Rec & Culture | 23.2 |
| Other Rec, Garden, & Pets | 20.5 |
| Info Processing Equipment | 14.8 |
| Furnishings & Household Equipment | 7.9 |
| Clothing & Footwear | 6.6 |
| Alcoholic Beverage, Tobacco and Cannabis | 6.3 |
| Food & Non-alcoholic Bev | 3 |
| Goods (total) | 3.7 |
A surge in Chinese exports
This shift from services to goods and a sharp uptick in demand for many consumer durables had a significant impact on international supply chains during COVID-19. Prior to COVID-19, many developed countries had been slowly moving away from manufacturing to more service-oriented economies. In the case of Canada, manufacturing as a share of GDP was already at 15% as of 1997 and had fallen further to 10% as of 2019. In contrast, Asian economies, and particularly China, had become major exporters of manufacturing products. According to OECD Trade in Value Added (TiVA) data, China’s share of global manufacturing exports increased from 2.7% in 1995 to 18.6% in 2019. Consequently, much of the increase in demand for consumer durables during COVID-19 was met by China.
Figure 2.9: Strong growth in China’s Exports
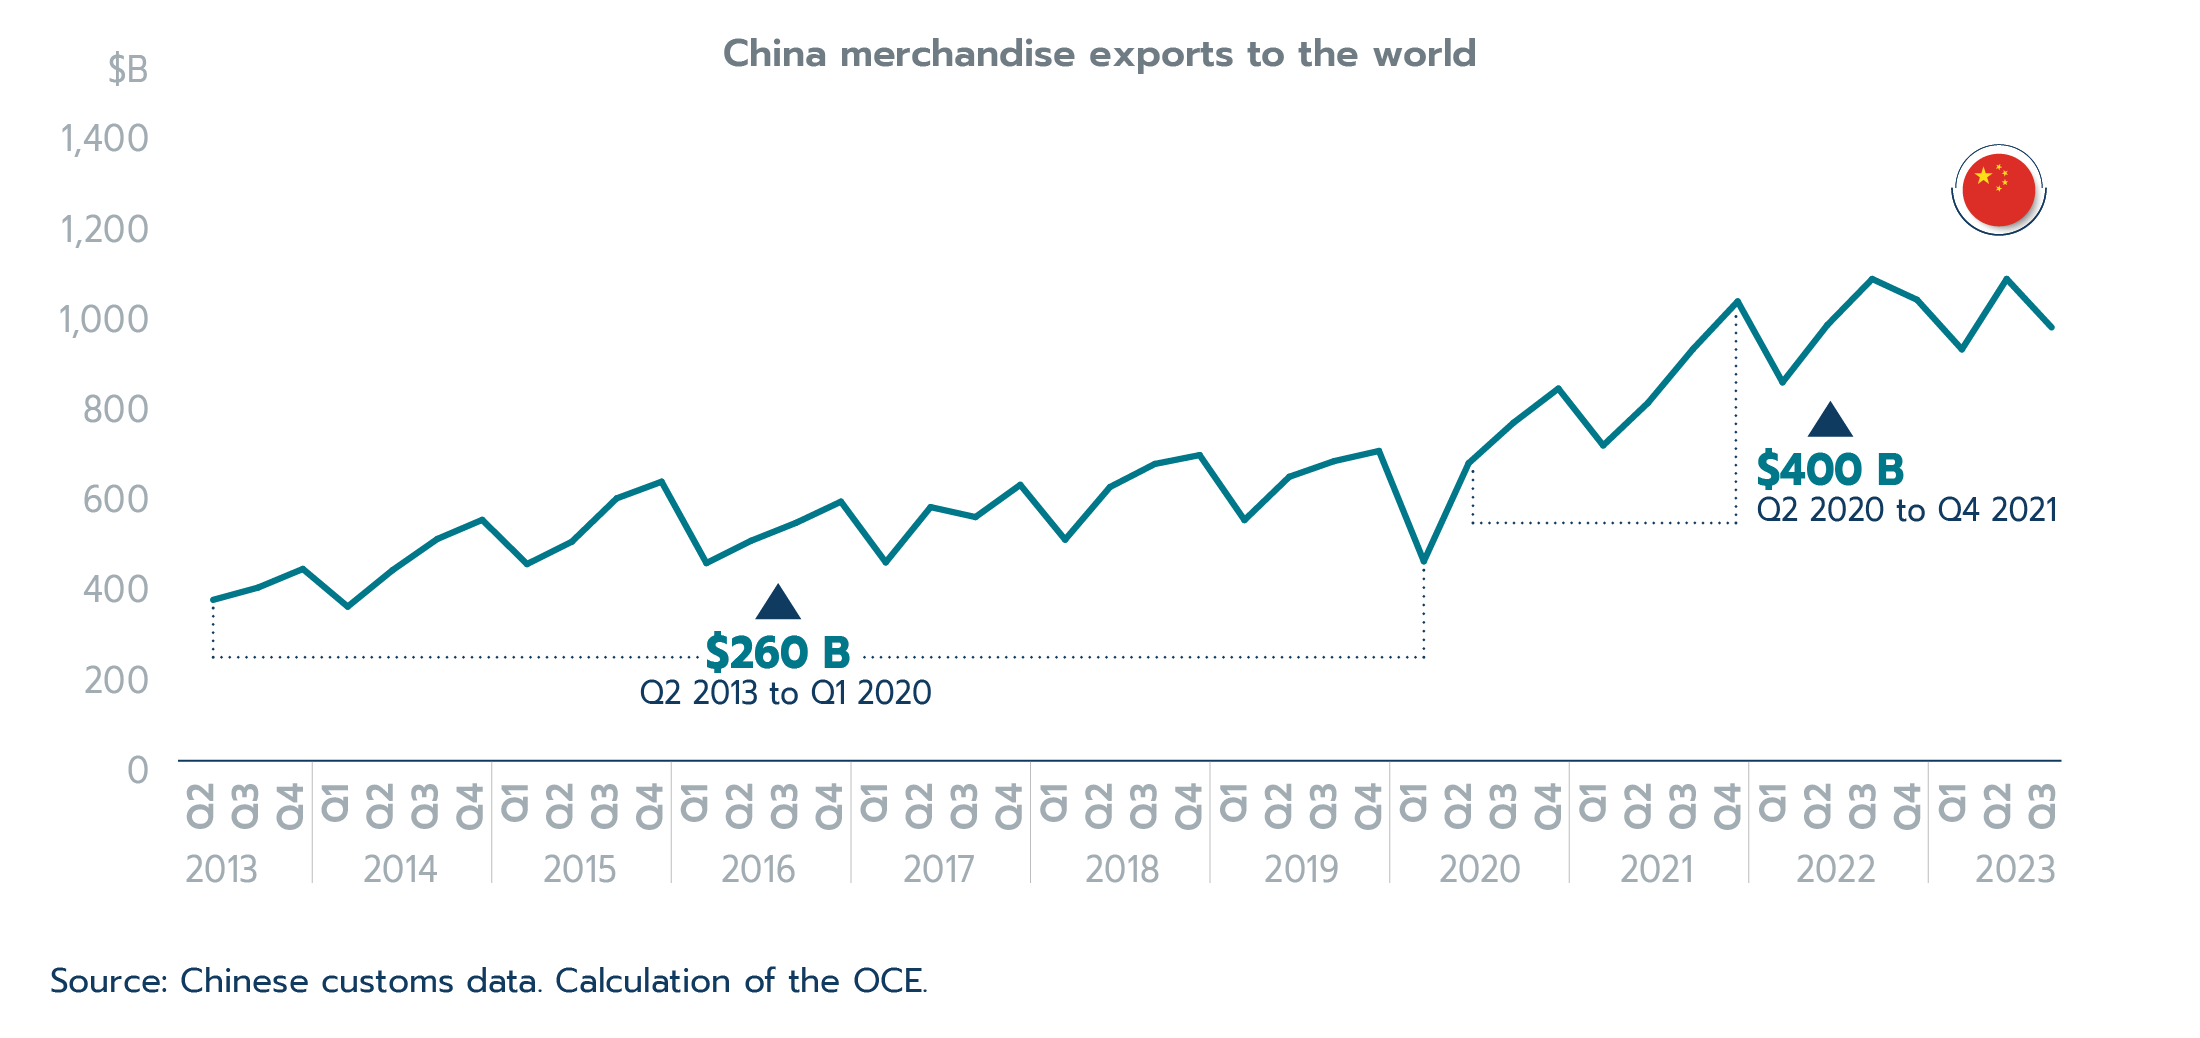
Text version - Figure 2.9
| Quarters | China merchandise exports, billions $ |
|---|---|
| Source: Chinese customs data. Calculation of the OCE. | |
| Q2 2013 | 556.7 |
| Q3 2013 | 583.8 |
| Q4 2013 | 625.2 |
| Q1 2014 | 541.7 |
| Q2 2014 | 622.5 |
| Q3 2014 | 691.7 |
| Q4 2014 | 734.0 |
| Q1 2015 | 636.0 |
| Q2 2015 | 685.7 |
| Q3 2015 | 781.7 |
| Q4 2015 | 818.6 |
| Q1 2016 | 638.1 |
| Q2 2016 | 687.8 |
| Q3 2016 | 727.5 |
| Q4 2016 | 774.4 |
| Q1 2017 | 639.8 |
| Q2 2017 | 762.3 |
| Q3 2017 | 740.2 |
| Q4 2017 | 811.7 |
| Q1 2018 | 690.2 |
| Q2 2018 | 806.8 |
| Q3 2018 | 857.9 |
| Q4 2018 | 877.6 |
| Q1 2019 | 733.6 |
| Q2 2019 | 829.5 |
| Q3 2019 | 864.2 |
| Q4 2019 | 886.8 |
| Q1 2020 | 642.2 |
| Q2 2020 | 859.7 |
| Q3 2020 | 949.3 |
| Q4 2020 | 1025.1 |
| Q1 2021 | 899.0 |
| Q2 2021 | 993.5 |
| Q3 2021 | 1112.4 |
| Q4 2021 | 1218.2 |
| Q1 2022 | 1039.0 |
| Q2 2022 | 1166.0 |
| Q3 2022 | 1268.0 |
| Q4 2022 | 1221.9 |
| Q1 2023 | 1112.1 |
| Q2 2022 | 1268.0 |
| Q3 2023 | 1160.8 |
Figure 2.9 shows the trend in Chinese exports before, during and after the COVID-19 period. It illustrates two interesting points. Firstly, while COVID-19 did initially impact Chinese exports, it was a short and limited disruption. Chinese exports fell by US$247 billion or 27.8% between the fourth quarter of 2019 to first quarter of 2020, but quickly recovered and surpassed pre-pandemic levels by the third quarter of 2020. Secondly, it shows the drastic increase in Chinese exports after the initial COVID-19 disruption, with exports increasing by $400 billion in the two years after the COVID-19 pandemic. In comparison, it took six years for Chinese exports to increase by $260 billion prior to COVID-19. Although, undoubtedly, the supply of some products from China was interrupted by strict lockdowns in that country. Chinese production and exports increased rapidly to meet the increased demand.
Transportation systems are slow to adjust to the demand shock
The growth in demand for goods, for which Asia—specifically China—played a significant role in meeting, put pressure on global shipping networks. This was one of the main choke points and complications to international supply chains during COVID-19. While production scaled up, transportation networks could not adjust at the same pace, as they require considerable capital and time to expand. Designed to grow at a steady rate, these networks were unable to cope with the sharp rise in goods being shipped. Komaromi, Cerdeiro and Liu (2022) show that, due to port congestion and delays, average maritime travel times began to rise after the onset of COVID-19, and by December 2021, they had risen by 25%. The authors find that these delays in shipping had a severe impact on world trade costs, estimating that the additional days in transit for the average shipment in December 2021 can be compared to an ad-valorem tariff of 0.9 to 3.1%.
The port delays seen globally were particularly acute on the west coast of Canada and the United States, with the ports of Vancouver, Prince Rupert, Seattle, Los Angeles and Long Beach all seeing large increases in transit times from mid-2020 into 2021. According to Transport Canada, the average end-to-end container transit time, as measured from Shanghai through the Port of Vancouver/Prince Rupert to Chicago, increased from an average of 25.4 days in 2019 to 29.1 days in 2020 and 33.8 days in 2021. This pressure on maritime shipping was also seen in escalating container shipping prices. According to the Baltic Freight Index, and seen in Figure 2.10, the price of maritime container shipping rose 385% or more than four-fold from November 2020 to September 2021. Delays at ports mean that goods must wait on ships longer, which causes prices to increase but also reduces availability of shipping, leading to the rapid shipping rate increase seen during the COVID-19 pandemic. Other transportation modes also saw increases in shipping prices, though not as significant as in maritime transport. In Canada, the Canadian rail transportation service index increased by 21% from November 2020 to July 2022 while the truck transportation service index rose 36% over the same period.
Figure 2.10: Rise and fall of maritime shipping costs
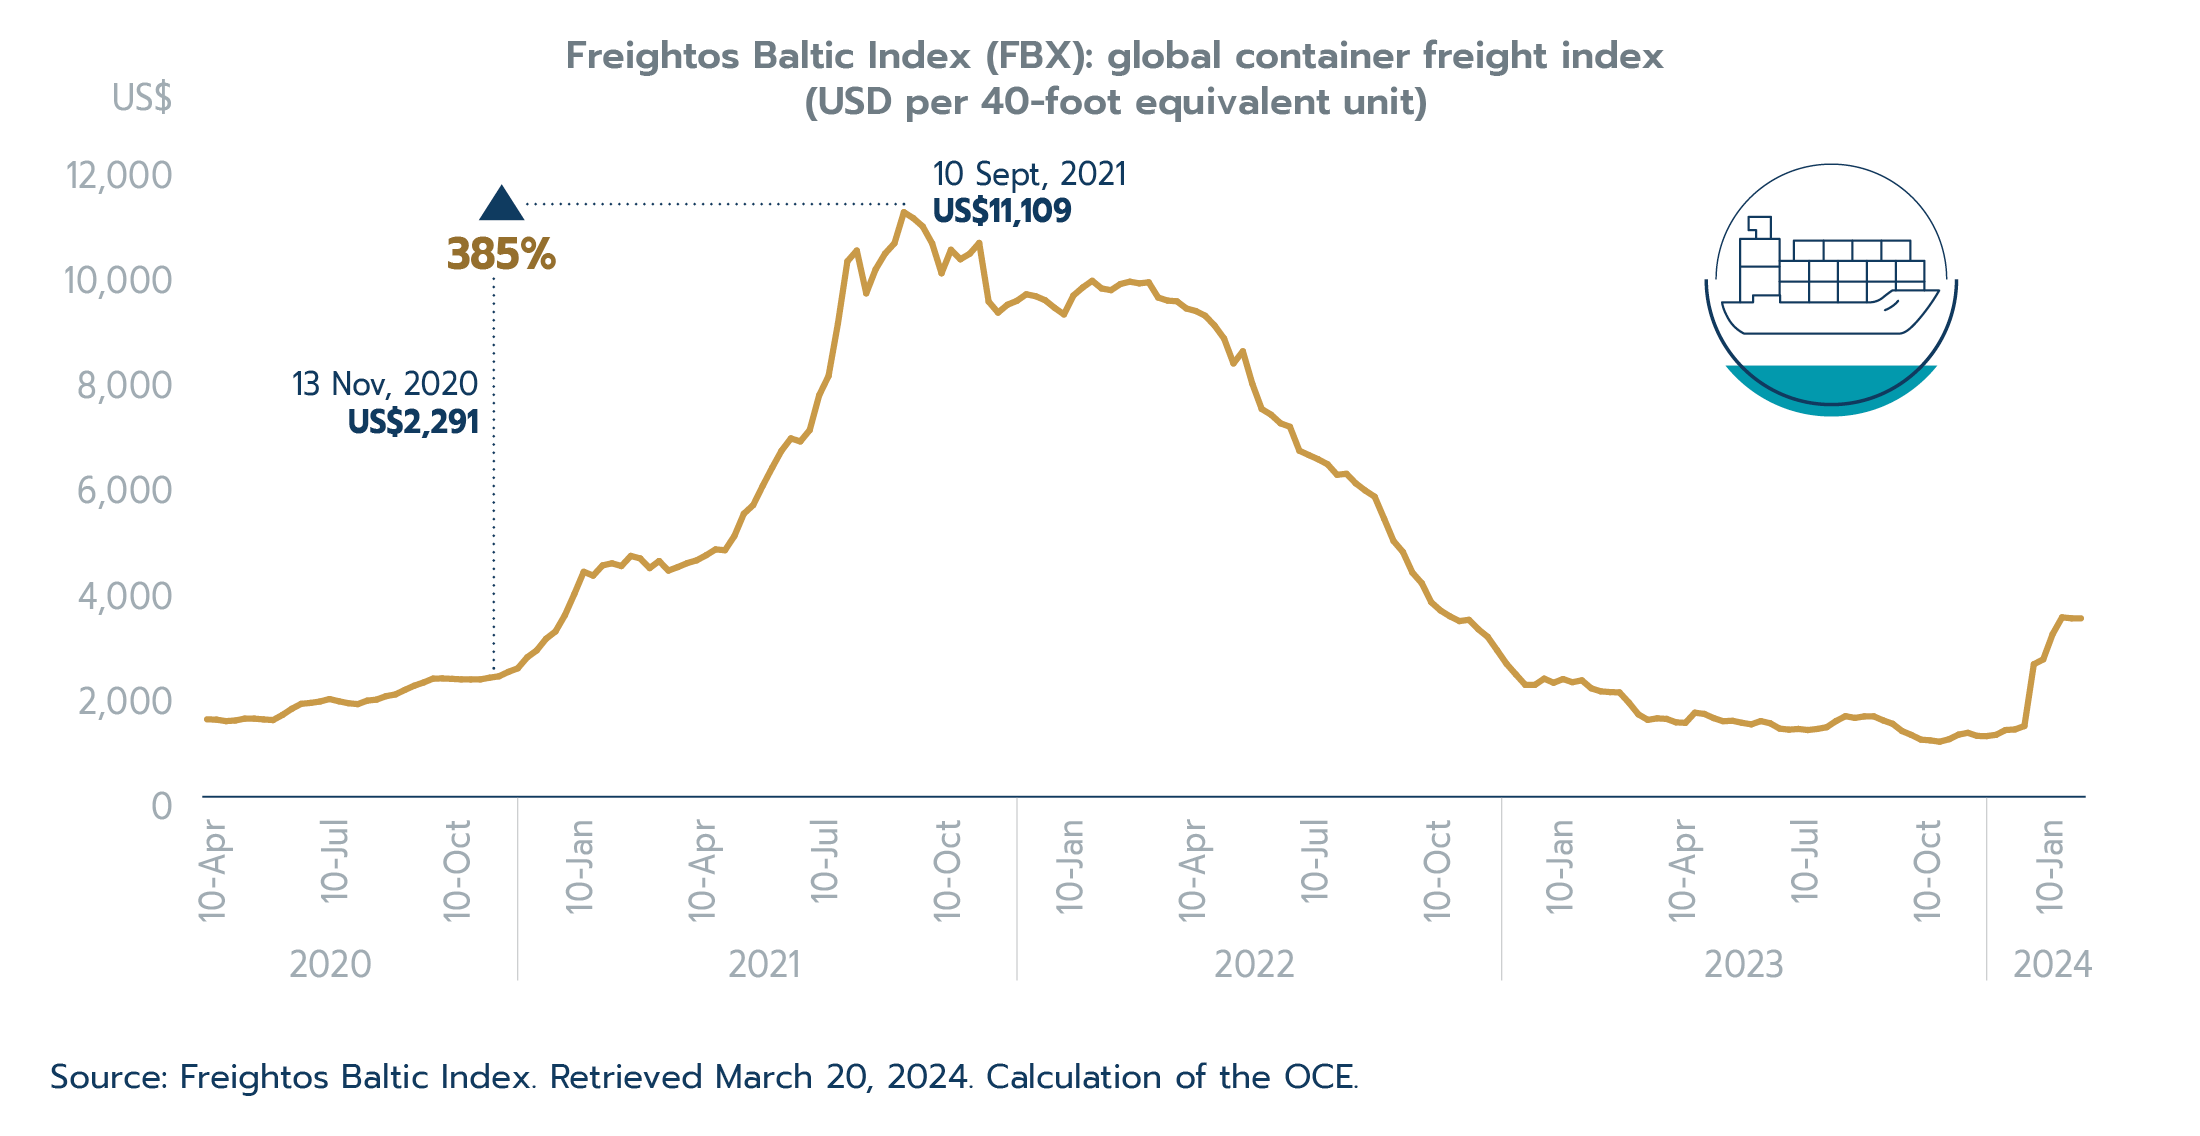
Text version - Figure 2.10
| Date | Freightos Baltic Index |
|---|---|
| Source: Freightos Baltic Index. Retrieved March 20, 2024. Calculation of the OCE. | |
| 10-Apr-20 | 1,473 |
| 17-Apr-20 | 1,467 |
| 24-Apr-20 | 1,439 |
| 01-May-20 | 1,451 |
| 08-May-20 | 1,487 |
| 15-May-20 | 1,487 |
| 22-May-20 | 1,471 |
| 29-May-20 | 1,459 |
| 05-Jun-20 | 1,556 |
| 12-Jun-20 | 1,674 |
| 19-Jun-20 | 1,768 |
| 26-Jun-20 | 1,785 |
| 03-Jul-20 | 1,812 |
| 10-Jul-20 | 1,859 |
| 17-Jul-20 | 1,816 |
| 24-Jul-20 | 1,779 |
| 31-Jul-20 | 1,762 |
| 07-Aug-20 | 1,828 |
| 14-Aug-20 | 1,848 |
| 21-Aug-20 | 1,913 |
| 28-Aug-20 | 1,946 |
| 04-Sep-20 | 2,032 |
| 11-Sep-20 | 2,112 |
| 18-Sep-20 | 2,174 |
| 25-Sep-20 | 2,247 |
| 02-Oct-20 | 2,250 |
| 09-Oct-20 | 2,242 |
| 16-Oct-20 | 2,232 |
| 23-Oct-20 | 2,230 |
| 30-Oct-20 | 2,231 |
| 06-Nov-20 | 2,264 |
| 13-Nov-20 | 2,291 |
| 20-Nov-20 | 2,375 |
| 27-Nov-20 | 2,443 |
| 04-Dec-20 | 2,652 |
| 11-Dec-20 | 2,782 |
| 18-Dec-20 | 3,004 |
| 25-Dec-20 | 3,143 |
| 01-Jan-21 | 3,452 |
| 08-Jan-21 | 3,854 |
| 15-Jan-21 | 4,277 |
| 22-Jan-21 | 4,204 |
| 29-Jan-21 | 4,398 |
| 05-Feb-21 | 4,438 |
| 12-Feb-21 | 4,386 |
| 19-Feb-21 | 4,578 |
| 26-Feb-21 | 4,530 |
| 05-Mar-21 | 4,347 |
| 12-Mar-21 | 4,481 |
| 19-Mar-21 | 4,300 |
| 26-Mar-21 | 4,367 |
| 02-Apr-21 | 4,442 |
| 09-Apr-21 | 4,495 |
| 16-Apr-21 | 4,591 |
| 23-Apr-21 | 4,702 |
| 30-Apr-21 | 4,686 |
| 07-May-21 | 4,957 |
| 14-May-21 | 5,379 |
| 21-May-21 | 5,545 |
| 28-May-21 | 5,908 |
| 04-Jun-21 | 6251 |
| 11-Jun-21 | 6,576 |
| 18-Jun-21 | 6,811 |
| 25-Jun-21 | 6,753 |
| 02-Jul-21 | 6,970 |
| 09-Jul-21 | 7,629 |
| 16-Jul-21 | 7,998 |
| 23-Jul-21 | 8,999 |
| 30-Jul-21 | 10,176 |
| 06-Aug-21 | 10,380 |
| 13-Aug-21 | 9,568 |
| 20-Aug-21 | 10,024 |
| 27-Aug-21 | 10,323 |
| 03-Sep-21 | 10,519 |
| 10-Sep-21 | 11,109 |
| 17-Sep-21 | 10,996 |
| 24-Sep-21 | 10,839 |
| 01-Oct-21 | 10,517 |
| 08-Oct-21 | 9,949 |
| 15-Oct-21 | 10,396 |
| 22-Oct-21 | 10,215 |
| 29-Oct-21 | 10,321 |
| 05-Nov-21 | 10,525 |
| 12-Nov-21 | 9,411 |
| 19-Nov-21 | 9,202 |
| 26-Nov-21 | 9,351 |
| 03-Dec-21 | 9,425 |
| 10-Dec-21 | 9,550 |
| 17-Dec-21 | 9,513 |
| 24-Dec-21 | 9,437 |
| 31-Dec-21 | 9,293 |
| 07-Jan-22 | 9,167 |
| 14-Jan-22 | 9,526 |
| 21-Jan-22 | 9,680 |
| 28-Jan-22 | 9,806 |
| 04-Feb-22 | 9,660 |
| 11-Feb-22 | 9,628 |
| 18-Feb-22 | 9,745 |
| 25-Feb-22 | 9,789 |
| 04-Mar-22 | 9,757 |
| 11-Mar-22 | 9,777 |
| 18-Mar-22 | 9,488 |
| 25-Mar-22 | 9,430 |
| 01-Apr-22 | 9,416 |
| 08-Apr-22 | 9,280 |
| 15-Apr-22 | 9,232 |
| 22-Apr-22 | 9,142 |
| 29-Apr-22 | 8,955 |
| 06-May-22 | 8,710 |
| 13-May-22 | 8,236 |
| 20-May-22 | 8,466 |
| 27-May-22 | 7,851 |
| 03-Jun-22 | 7,370 |
| 10-Jun-22 | 7,261 |
| 17-Jun-22 | 7,098 |
| 24-Jun-22 | 7,032 |
| 01-Jul-22 | 6,577 |
| 08-Jul-22 | 6,495 |
| 15-Jul-22 | 6,414 |
| 22-Jul-22 | 6,319 |
| 29-Jul-22 | 6,120 |
| 05-Aug-22 | 6,139 |
| 12-Aug-22 | 5,956 |
| 19-Aug-22 | 5,820 |
| 26-Aug-22 | 5,703 |
| 02-Sep-22 | 5,286 |
| 09-Sep-22 | 4,862 |
| 16-Sep-22 | 4,653 |
| 23-Sep-22 | 4,262 |
| 30-Sep-22 | 4,060 |
| 07-Oct-22 | 3,699 |
| 14-Oct-22 | 3,540 |
| 21-Oct-22 | 3,429 |
| 28-Oct-22 | 3,340 |
| 04-Nov-22 | 3,364 |
| 11-Nov-22 | 3,185 |
| 18-Nov-22 | 3,040 |
| 25-Nov-22 | 2,786 |
| 02-Dec-22 | 2,528 |
| 09-Dec-22 | 2,325 |
| 16-Dec-22 | 2,127 |
| 23-Dec-22 | 2,126 |
| 30-Dec-22 | 2,246 |
| 06-Jan-23 | 2,168 |
| 13-Jan-23 | 2,238 |
| 20-Jan-23 | 2,178 |
| 27-Jan-23 | 2,214 |
| 03-Feb-23 | 2,062 |
| 10-Feb-23 | 2,005 |
| 17-Feb-23 | 1,991 |
| 24-Feb-23 | 1,984 |
| 03-Mar-23 | 1,790 |
| 10-Mar-23 | 1,568 |
| 17-Mar-23 | 1,463 |
| 24-Mar-23 | 1,492 |
| 31-Mar-23 | 1,481 |
| 07-Apr-23 | 1,416 |
| 14-Apr-23 | 1,406 |
| 21-Apr-23 | 1,599 |
| 28-Apr-23 | 1,576 |
| 05-May-23 | 1,497 |
| 12-May-23 | 1,437 |
| 19-May-23 | 1,446 |
| 26-May-23 | 1,407 |
| 02-Jun-23 | 1,378 |
| 09-Jun-23 | 1,440 |
| 16-Jun-23 | 1,398 |
| 23-Jun-23 | 1,297 |
| 30-Jun-23 | 1,277 |
| 07-Jul-23 | 1,290 |
| 14-Jul-23 | 1,270 |
| 21-Jul-23 | 1,290 |
| 28-Jul-23 | 1,323 |
| 04-Aug-23 | 1,441 |
| 11-Aug-23 | 1,533 |
| 18-Aug-23 | 1,500 |
| 25-Aug-23 | 1,529 |
| 01-Sep-23 | 1,530 |
| 08-Sep-23 | 1,453 |
| 15-Sep-23 | 1,389 |
| 22-Sep-23 | 1,251 |
| 29-Sep-23 | 1,176 |
| 06-Oct-23 | 1,088 |
| 13-Oct-23 | 1,073 |
| 20-Oct-23 | 1,048 |
| 26-Oct-23 | 1,095 |
| 03-Nov-23 | 1,182 |
| 10-Nov-23 | 1,217 |
| 17-Nov-23 | 1,157 |
| 24-Nov-23 | 1,155 |
| 01-Dec-23 | 1,179 |
| 08-Dec-23 | 1,270 |
| 15-Dec-23 | 1,281 |
| 22-Dec-23 | 1,346 |
| 05-Jan-24 | 2,519 |
| 12-Jan-24 | 2,613 |
| 19-Jan-24 | 3,093 |
| 26-Jan-24 | 3,411 |
| 02-Feb-24 | 3,393 |
| 09-Feb-24 | 3,392 |
Are there lessons to learn from the COVID-19 pandemic?
It is often said that the global pandemic demonstrated the fragility of international supply chains. After examining the evidence, the opposite may in fact be a more accurate conclusion. The entire planet experienced a coordinated pandemic and, despite this, grocery store shelves in Canada remained stocked, basic needs were met, and even conspicuous consumption carried on. That is not to say that there were no issues. As seen in Figure 2.11, the onset of the COVID-19 pandemic caused a decline in world trade volumes of 16% from December 2019 to April 2020. There were indeed shortages, from microchips (see Box 2.1), medicines, and PPE to needed vaccines. Plant closures in China caused a domino effect, limiting needed inputs for production in other countries. But as also indicated in Figure 2.11, volume of world trade rebounded quickly and was already at its pre-COVID-19 level by November 2020. Although open for debate, it is indeed arguable that the COVID-19 pandemic illustrated both vulnerabilities but also strengths in international supply chains.
Figure 2.11: Decline and recovery in world trade
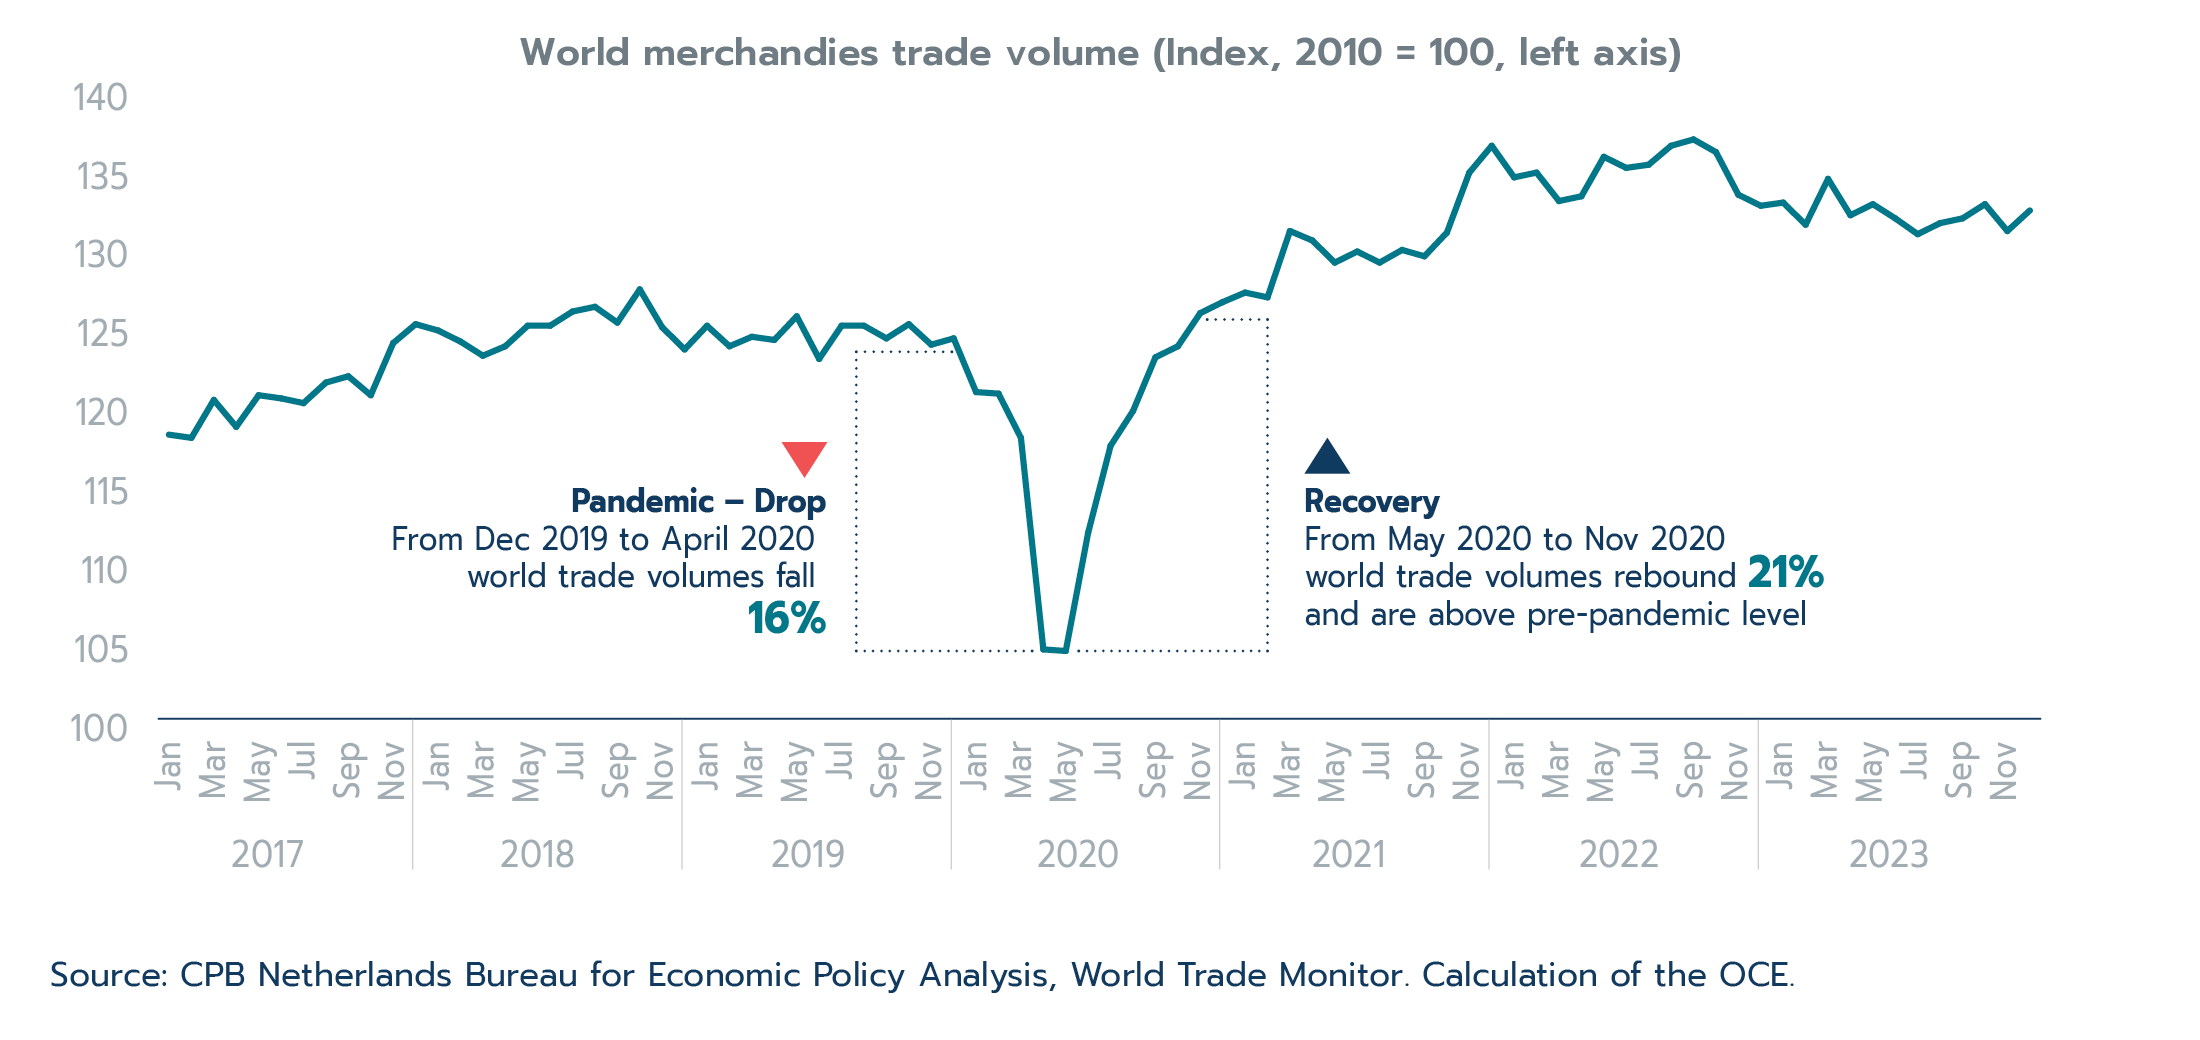
Text version - Figure 2.11
| Month | World merchandise trade volumes |
|---|---|
| Source: CPB Netherlands Bureau for Economic Policy Analysis, World Trade Monitor. Calculation of the OCE. | |
| 2017 - January | 118.0 |
| 2017 - February | 117.8 |
| 2017 - March | 120.2 |
| 2017 - April | 118.5 |
| 2017 - May | 120.5 |
| 2017 - June | 120.3 |
| 2017 - July | 120.0 |
| 2017 - August | 121.3 |
| 2017 - September | 121.7 |
| 2017 - October | 120.5 |
| 2017 - November | 123.8 |
| 2017 - December | 125.0 |
| 2018 - January | 124.6 |
| 2018 - February | 123.9 |
| 2018 - March | 123.0 |
| 2018 - April | 123.6 |
| 2018 - May | 124.9 |
| 2018 - June | 124.9 |
| 2018 - July | 125.8 |
| 2018 - August | 126.1 |
| 2018 - September | 125.1 |
| 2018 - October | 127.2 |
| 2018 - November | 124.8 |
| 2018 - December | 123.4 |
| 2019 - January | 124.9 |
| 2019 - February | 123.6 |
| 2019 - March | 124.2 |
| 2019 - April | 124.0 |
| 2019 - May | 125.5 |
| 2019 - June | 122.8 |
| 2019 - July | 124.9 |
| 2019 - August | 124.9 |
| 2019 - September | 124.1 |
| 2019 - October | 125.0 |
| 2019 - November | 123.7 |
| 2019 - December | 124.1 |
| 2020 - January | 120.7 |
| 2020 - February | 120.6 |
| 2020 - March | 117.8 |
| 2020 - April | 104.4 |
| 2020 - May | 104.3 |
| 2020 - June | 111.8 |
| 2020 - July | 117.3 |
| 2020 - August | 119.5 |
| 2020 - September | 122.9 |
| 2020 - October | 123.6 |
| 2020 - November | 125.7 |
| 2020 - December | 126.4 |
| 2021 - January | 127.0 |
| 2021 - February | 126.7 |
| 2021 - March | 130.9 |
| 2021 - April | 130.3 |
| 2021 - May | 128.9 |
| 2021 - June | 129.6 |
| 2021 - July | 128.9 |
| 2021 - August | 129.7 |
| 2021 - September | 129.3 |
| 2021 - October | 130.8 |
| 2021 - November | 134.6 |
| 2021 - December | 136.3 |
| 2022 - January | 134.3 |
| 2022 - February | 134.6 |
| 2022 - March | 132.8 |
| 2022 - April | 133.1 |
| 2022 - May | 135.6 |
| 2022 - June | 134.9 |
| 2022 - July | 135.1 |
| 2022 - August | 136.3 |
| 2022 - September | 136.7 |
| 2022 - October | 135.9 |
| 2022 - November | 133.2 |
| 2022 - December | 132.5 |
| 2023 - January | 132.7 |
| 2023 - February | 131.3 |
| 2023 - March | 134.2 |
| 2023 - April | 131.9 |
| 2023 - May | 132.6 |
| 2023 - June | 131.7 |
| 2023 - July | 130.7 |
| 2023 - August | 131.4 |
| 2023 - September | 131.7 |
| 2023 - October | 132.6 |
| 2023 - November | 130.9 |
| 2023 - December | 132.2 |
It is far from clear what lessons governments or firms should take from the pandemic in terms of supply chains. Building and maintaining extra capacity for production and consumption everywhere in the economy would come at great cost for what is, hopefully, an event that will never need to be experienced again. Investments in pandemic prevention may be preferable over building supply chain capacity. Other lessons from COVID-19 may include increasing transparency in supply chains: in order for firms to react to disruptions, they need to know how their supply chains operate and be able to identify their tier 1 and tier 2 suppliers. This may be particularly important for small and medium sized enterprises (SMEs) as discussed further in Box 2.2. The end of the COVID-19 pandemic does not mean that there are no future or existing threats to international supply chains. Challenges such as climate change and a changing geo-political landscape are reshaping international supply chains. But how exactly firms and governments react to these new challenges is important. There are many ways resilience can be built into supply chains, with some solutions more costly than others. Some possible ways to build resiliency and mitigate supply chain risks will be explored in the final two parts of this chapter.
2.3 International supply chains post-pandemic and into the future
After weathering the pandemic shock, international supply chains have now entered a period of new challenges and uncertainty. To be well functioning, international supply chains depend on the unobstructed free flow of goods and services across borders. Any barriers, risks or added costs to the movement of goods and services—be it intentional or unintentional, man-made or natural—will lower the benefits derived from international supply chains and the incentives for firms to use them. Further, supply chains are complex, and it may not be simple or easy for firms to adjust quickly to new barriers or disruptions in their supply chains, adding to the importance of identifying and having strategies ready to deal with these emerging risks. For this report, the current risks and challenges to international supply chains can be grouped into four broad categories: natural disasters and climate change; human and organizational risks; environmental, social and corporate governance (ESG) concerns; and a changing geo-political environment. Each of these risks and challenges will be discussed in turn before looking at how firms can adapt to these challenges and mitigate these risks.
The risks to international supply chains from climate change and natural disasters
Climate change and natural disasters are an ongoing and increasing risk to international supply chains. Boileau and Sydor (2020) show that even the simplest of international supply chains have many potential choke points. These include, but are not limited to, foreign production facilities, foreign borders, transportation systems and infrastructure, the Canadian border, and domestic production facilities and warehouses within Canada.Footnote 11 All these choke points are susceptible to natural disaster and climate change disruptions. Indeed, there have been countless disruptions due to climate events or natural disasters in recent years. Looking at just 2021 alone, Jacques Leslie (2022) lists a long line of disruptions due to climate-related eventsFootnote 12:
- A Texas deep freeze: Resulted in an electricity blackout that expounded the microchip shortage seen at that time (see Box 2.1).
- Disruption to the Rhine River: First snow melt and heavy rain broke the banks and caused shutdowns to the riverway, and then later droughts forced capacity limits to shipping. The Rhine is a major waterway for European manufacturing shipments and commerce.
- Flooding in central China: Caused disruptions to commodity and agriculture supply chains and forced a closure of a major automobile plant.
- Hurricane Ida: Struck the Gulf of Mexico coast damaging manufacturing plants that produce a range of products, including plastics and pharmaceuticals.
- Forest fires in British Columbia: Closed a transportation choke point at Fraser Canyon that idled thousands of rail cars and stranded their contents.
- BC floods: Cut off railroad and highway links to the Port of Vancouver and forced a regional oil pipeline to close.
- Flooding caused by a typhoon in Malaysia: Severely damaged Klang, Southeast Asia’s second-largest port, which disrupted the supply chain for Taiwanese microchips that are packaged in Malaysia before being shipped to the United States.
A more recent example of a climate-related disruption to international supply chains is the current (as of writing) low water levels in the Panama Canal, which is restricting commercial traffic and increasing wait times (see Box 1.1 for more details).
These climate change disruptions and natural disasters can have a wide range of impacts on international supply chains, but some have had measurably severe impacts on both supply chains and the greater economy. A well-studied example is the Great East-Japan Earthquake of 2011. Carvalho, Nirei, Saito and Alireza Tahbaz-Salehi (2021) looked at the upstream and downstream linkages of Japanese firms and found that the earthquake resulted in a 3.6 percentage point decline in growth rate of those firms with disaster-hit suppliers and a 2.9 percentage point decline in growth rate of firms with disaster-hit customers. The authors also estimate a 0.47% decline in Japanese GDP the year following the earthquake due to impacts propagated through the firms’ supply chains. Another study by Tokui, Kawasaki and Miyagawa (2017) used inter-regional input-output tables to estimate production losses amounting to at least 0.35% of Japan’s GDP.
Unfortunately, disruptions to international supply chains from climate-related events are likely to only increase in coming years. While firms will never be able to eliminate risks related to these disruptions, there are ways they may be able to mitigate these risks, some of which will be discussed later in the chapter. However, Tokui, Kawasaki and Miyagawa (2017) looked at the option of diversifying or adding redundancy in suppliers as one possible solution to the disruption of the Great East-Japan Earthquake. They write that “the provision of multiple supply chains could have mitigated the indirect damage to 60% of the size that would occur from such huge disaster as the Great East-Japan Earthquake.”
Figure 2.12: Canada’s merchandise trade by transportation mode (2023)
Text version - Figure 2.12
| Transportation mode | Import share | Export share |
|---|---|---|
| Source: Statistics Canada, via Global trade Atlas, retrieved March 7th, 2024. Calculation of the OCE. | ||
| Road | 52% | 40% |
| Water | 24% | 19% |
| Air | 12% | 18% |
| Rail | 9% | 13% |
| Pipeline & other | 3% | 10% |
With a relatively small population spread over a vast geographic area, Canada’s international supply chains may be particularly susceptible to climate-related disruptions. An added risk for Canada is the concentration of transportation infrastructure. Figure 2.12 shows the share of modes of transportation in Canadian merchandise imports and exports. For Canadian merchandise imports, road and water are the two most important modes of shipment into Canada.Footnote 13 In both cases, most of the imports shipped by these modes are concentrated through only a handful of ports or border crossings. For instance, according to Transport Canada, in the case of trade by road (also referred to as “trade by truck”), the top border crossing—the Windsor Ambassador bridge—accounted for 28% of two-way road trade (both imports and exports) in 2020. That is nearly a third of all of Canada’s trade by road and 12% of total two-way merchandise trade by all modes (see Table 2.1). The top 5 border crossingsFootnote 14 accounted for over two-thirds (68%) of two-way truck trade in 2020 and almost a third (31%) of total two-way merchandise trade. Although it is possible traffic could be diverted to alternative border crossings in case of a disruption, it is evident that Canadian truck trade is very concentrated at key entry points, therefore making it vulnerable to possible disruptions. This also includes non-climate-related disruptions, such as protests, as seen in the 2022 blockade of the Ambassador Bridge and other border entryways. The concentration of transport infrastructure is even more drastic when it comes to Canada’s maritime trade. According to Transport Canada, the Port of Vancouver-Fraser accounted for 42% of total cargo tonnage handled by all Canadian ports in 2022.
Table 2.1: Select border entries and ports of importance to Canadian trade
| Mode | Port of Entry/Clearance (PoE/PoC) | % Share of Total Trade (2023 Imports & Exports Combined) |
|---|---|---|
| Source: Statistics Canada. | ||
| Marine | Port of Vancouver | 5.7% |
| Port of Montreal | 4.2% | |
| Road | Windsor – Ambassador Bridge | 12.2% |
| Fort Erie / Niagara Falls | 7.4% | |
| Sarnia | 7.3% | |
| Emerson | 2.3% | |
| Lacolle | 2.3% | |
| Total of select PoEs/PoCs | 41.4% | |
On the export side, after road, pipeline is the second most important mode of shipment for Canadian exports. In 2023, Canada exported $193.2 billion worth of mineral fuels, making it Canada’s largest merchandise export. Most of these exports, at $134.4 billion, were crude oil, of which 92% is sent to the U.S. through pipelines. Canada has a limited number of key pipelines going from Canada to the United States, making this another mode of transportation that may be impacted by climate events or natural disasters.
Human and organizational risks to international supply chains
Human and organizational risks refer to risks facing international supply chains that come from people or unexpected events occurring within an organization. First, and simply put, supply chains can be disrupted by people, either intentionally or unintentionally. As mentioned earlier, international supply chains have many vulnerable choke points in which the disruption can cause a cascading domino effect along the chain. One example of this type of disruption was seen in March 2021, when a container ship ran aground in the Suez Canal resulting in blocked traffic of the important shipping lane for six days. A more malicious example was the cyber attack on the Colonial Pipeline. The pipeline, which ships refined oil products such as gasoline and jet fuel between Texas and New York, was cyber attacked in May of 2021, and this resulted in a six-day shutdown that caused fuel shortages in several airports and many gas stations in the United States. Ports, border crossings, production plants and other choke points can also be blocked by strikes, protests and even terrorist attacks. Canada has experienced blocked roads and railway lines because of protests, including the closure of border crossings, such as the Ambassador bridge during the convoy protests of 2022. In the same reasoning as climate change disruptions, the concentration of transportation infrastructure in Canada also makes Canada particularly vulnerable to human and organizational risks to international supply chains.
Environmental, social and corporate governance concerns (ESG) in international supply chains
Canadian firms are increasingly faced with demands to better manage and monitor their international supply chains to ensure their products are being produced both ethically and with environmentally sustainable methods. Concerns related to ethical and environmentally sustainable practices are often referred to as environmental, social and corporate governance or ESG for short. ESG considerations are being brought to the forefront of businesses’ strategies and operations, both internally within firms from employees and shareholders, and externally through demands from consumers as well as regulations and laws being passed by governments.
Moody’s Analytics (2022) identifies some common ESG risks and concerns that firms need to manage and be aware of within their wider supply chains.Footnote 15
Environment:
- Climate change and emissions: Firms are attempting to lower the carbon intensity along their supply chains.
- Natural resources and biodiversity: Many companies are trying to ensure their supply chains do not include activities, or limit activities, harmful to the environment, for example illegal deforestation, raw material depletion, or overuse of water.
- Pollution and waste: Firms need to consider the reusing and recycling of material as well as waste disposal in their supply chains.
Social:
- Human rights: This encompasses a broad class of risks businesses face related to ensuring UN universal Declaration of Human rights are respected, including right to life and liberty, health and safety, and the right to work.
- Labour standards: Companies face risks around working conditions and workers pay as well as concerns over forced labour and child labour within supply chains.
- Community impact: Firms need to consider the potential impact of operations, or suppliers’ operations on local communities; this can overlap with human rights, for example the rights of Indigenous People.
Governance:
- Corruption: Corruption within a supply chain can lead to legal action and reputational damage to a firm.
- Diversity and discrimination: Companies are being asked by shareholders and customers to promote diversity and inclusion in both their management and workforce.
There are many possible motivations for firms to address ESG concerns. According to Sprinkle and Maines (2010), these motivations can range from altruism to the appeasement of stakeholder groups in order to gain positive exposure, help recruit, motivate and retain employees, or meet customer demands. The authors note that focusing on environmental concerns may also lead to reductions in production costs. Finally, they may address ESG issues to meet legal or regulatory constraints or benefit from tax deductions or credits offered by governments for ESG efforts.
Governments can play an important role in addressing ESG concerns and risks in international supply chains. A good example of this relates to the concern of the use of forced labour within international supply chains. In recent years, many countries have been passing laws or regulations forcing domestic firms to have better transparency within their supply chains and ensure no materials or inputs along the supply chain are being produced using forced labour or child labour. In Canada, Bill S-211, An Act to enact the Fighting Against Forced Labour and Child Labour in Supply Chains Act and to amend the Customs TariffFootnote 16 came into force on January 1, 2024. This act will require certain entities in Canada, mainly larger sized firmsFootnote 17 and some government institutions, to file annual reports detailing their efforts to prevent and mitigate forced labour and child labour in their supply chains. Firms will face penalties if they fail to submit an annual report or if they include false or misleading information in their reports. Other economies such as the U.S. and EU have enacted or are in the process of enacting similar rules and regulations that essentially put the onus on domestic firms to do their due diligence in knowing how and where their down-stream inputs are sourced and ensure that the process to produce these inputs do not use forced labour. Forced labour is just one example of the ESG risks and concerns that are being addressed through government laws and regulations that could significantly re-shape international supply chains in the coming years.
The relationship between ESG risks and concerns and international supply chains is not necessarily one-way. While ESG is reshaping international supply chains, Schiller (2018) shows that international supply chains also act as a transmission mechanism for regulatory requirements and standards across borders. By using firm-level data sets on firms’ environmental and social policies along with data on supply chain networks/relationships between firms and toxic emissions data, the author shows that environmental and social policies propagate from customers to suppliers, and that this is especially the case when customers (in this case firms along the supply chain) have higher bargaining power and suppliers are in countries with lower ESG standards. In short, international supply chains can be a way to spread rules, regulations, standards, and consumer demands related to ESG across borders.
Changing geo-political landscape and international supply chains
The final broad category of challenge or risk facing international supply chains is geo-political. As by their very definition, international supply chains cross international borders. Therefore, the ever-changing relationships between countries, whether positive or negative, can have a significant impact on how international supply chains are set up and how they evolve over time. This category of risks can cover a wide array of events, from small changes of policies between countries, trade tensions, regional disputes to all out wars. Consequently, the risks and impact on international supply chains related to these events depend on their magnitude. Some examples of recent geopolitical events that have had significant impacts on international supply chains include Brexit (2016), China-U.S. trade tensions (2018 to present), the war in Ukraine, as well as the resulting sanctions on Russia (2022 to present), and more recently the 2023 Israel-Hamas war.
Geo-political risks or events like the ones above can impact a firm’s supply chain decisions in many ways. Often, as with the case of China-U.S. trade tensions, the dispute may not fully disrupt supply chains as much as increased costs of sourcing inputs from certain countries. If the dispute causes cost to rise too high or adds too much uncertainty to a supplier-customer relationship, it could result in firms needing to reconfigure their supply chain away from one or both countries involved in the dispute. Current geo-political instability and large subsidies for firms to relocate activities have made the possibility of large movements in the reshoring of supply chains a hot topic of conversation recently. The concept of large-scale reshoring and evidence of it occurring will be visited in the last section of this feature. While China-U.S. trade tariffs resulting in reshoring may be in question, it is evident that this continuing dispute has impacted international supply chains and, consequently, the broader economy at large. Using the OECD (Organisation for Economic Co-operation and Development) Inter-Country Input-Output Model, Wu, Wood, Oh and Jang (2021) estimate that five rounds of tariff escalations resulted in an indirect tariff burden of around US$23 billion. Interestingly, while the authors found the U.S. and China to be the main economic casualties of the dispute, the authors also show that EU, Canada and Mexico also incurred indirect tariff costs of around US$700 million to US$1.7 billion as tariff costs are passed through international supply chains to third party countries.
In the case of U.S.-China trade tensions, rising tariffs and export and import controls are the main risks to international supply chains. In the case of other types of geopolitical events, such as wars, the disruptions can be more direct and somewhat akin to those discussed under climate change and natural disasters, i.e., that borders can be closed, ports and other transport linkages may be blocked, and factories and distribution centres can be disrupted. The current war in Ukraine has significantly impacted supply chains in Europe and even across the globe. It has disrupted the movement of important commodities such as wheat, grains, metals, oil, and natural gas. It has also cut off suppliers in both Ukraine and Russia that supply inputs to countries across the globe. According to a study by Dun and Bradstreet (2022), at least 374,000 businesses worldwide rely on Russian suppliers and at least 241,000 businesses across the world rely on Ukrainian suppliers.
Along with wars and trade tensions, a current resurgence in industrial policy in many countries is also motivating firms to restructure their supply chains. In the wake of COVID-19, but also interrelated with geo-political tensions and competition, many developed countries have undertaken large government expenditure packages towards economic recovery but also to advance or promote certain critical sectors of their domestic economies and achieve their net-zero transition. These expenditures often target areas deemed important to national security or economic advancement (such as advance manufacturing, ICT, etc.) or promote goals such as lower dependence on fossil fuels; for instance, many governments, including here in Canada, are promoting investments in electric vehicle (EV) supply chains. Two notable spending packages initiated in recent years in the U.S. have been the CHIPS and Science Act (2022) and the Inflation Reduction Act (2022). The CHIPS and Science Act authorized up to US$280 billion in U.S. government funding towards domestic research and manufacturing of semiconductors in the United States. While Congress has not appropriated all of these funds, they are sufficiently capitalized to spur generational investments in domestic semiconductors and reorient R&D in critical and emerging technologies. The Inflation Reduction Act is broader but includes approximately US$369 billion (with a significant amount through tax credits) towards investments in clean energy, electric vehicles and advanced manufacturing among other sectors according to original estimates. Given a greater uptake of tax credits, the amount of support provided by the Inflation Reduction Act has been revised upwards by different estimates. While the impact of these acts is just starting to be seen, it is very likely that these large investments and spending packages will alter many international supply chains, particularly those in North America.
Improving supply chain resiliency
Climate change and natural disasters, human and organizational risks, ESG concerns, and an ever-changing geo-political environment all present challenges to international supply chains and are forcing firms across the globe, and here in Canada, to build better resilience and flexibility into their international supply chains. Reshoring is often given as an answer to limiting risk in supply chains and is the topic of the last section of this special feature, but this is likely one of the more costly ways for firms to lower risk, and it eliminates many of the benefits firms (and their customers) receive from using international supply chains. There may be other potential ways for a firm to mitigate risks of supply chain disruptions, which could include building up inventories, diversifying suppliers, or innovating production and internalizing supply to change supply needs or composition of inputs used. These three options will be discussed before turning more in-depth to the case of reshoring.
Building up of inventories
In most cases, firms will try to hold the least amount of inventory needed to effectively run their operations. This is commonly known as just-in-time (JIT) inventory management, and it is widely used by firms as it is efficient; firms hold just enough inventory to meet their operational demands and continuously re-order supplies as warranted by new customer orders. According to Forbes (2023), the main pros from using JIT include reduced waste, increased productivity, improvement in quality and more flexibility. However, one of the cons to JIT is the risk of supply chain disruptions. This downside to JIT has led some firms to a new inventory management strategy known as just-in-case (JIC). The concept of JIC is to prioritize preparedness over lean inefficiency, with firms stockpiling critical inputs in order to react or endure any disruptions to their supply chains.
Data on inventories of manufacturers in both Canada and the U.S. (see Figure 2.13) show a large build-up of inventories, of both raw and processed materials as well as finished goods, starting around January 2021, or the onset of the COVID-19 pandemic. What is interesting is that these higher levels of inventories have since stayed elevated post pandemic, possibly indicating the move from JIT to JIC to mitigate risks of supply chain disruptions. However, other factors, such as recent high inflation, may also play a role in firms deciding to hold more inventory. It is also difficult to distinguish between a switch to JIC versus involuntary inventory build-ups such as those caused by poor demand forecasts. In the U.S., there has been a greater build-up of raw and processed inventories than finished goods. A build-up of finished goods may be undesirable and reflect poorly forecasted demand.
The decision to hold more or less inventory is a fine balance as holding inventory is costly. For a firm, using JIC is like buying insurance against disruptions. Firms will do so if it is affordable and the probability of needing the insurance is high but will move back to JIT or somewhere between the two inventory management systems if the cost is too high and the probability of disruptions is too low.
Figure 2.13: Build-up of Canada and U.S. manufacturing inventories
Text version - Figure 2.13
| Monthly | Canadian Manufacturing Inventories | U.S. Manufacturing Inventories | ||||
|---|---|---|---|---|---|---|
| Raw | Processed | Finished | Raw | Processed | Finished | |
| Source: Statistics Canada and U.S. Census Bureau, retrieved April 3, 2024. Calculation of the OCE. | ||||||
| Jan-19 | 100.0 | 100.0 | 100.0 | 100.0 | 100.0 | 100.0 |
| Feb-19 | 99.2 | 100.9 | 100.9 | 100.1 | 101.2 | 100.4 |
| Mar-19 | 98.9 | 103.2 | 102.0 | 99.9 | 101.9 | 101.0 |
| Apr-19 | 100.5 | 104.8 | 103.7 | 99.8 | 102.9 | 101.1 |
| May-19 | 102.2 | 105.5 | 104.2 | 99.9 | 103.6 | 101.1 |
| Jun-19 | 100.0 | 105.5 | 101.8 | 100.2 | 103.3 | 101.6 |
| Jul-19 | 101.2 | 107.4 | 102.0 | 100.3 | 104.3 | 102.4 |
| Aug-19 | 101.8 | 108.7 | 102.1 | 100.4 | 105.1 | 102.3 |
| Sep-19 | 100.6 | 107.8 | 101.8 | 100.7 | 105.8 | 102.4 |
| Oct-19 | 100.0 | 106.8 | 101.5 | 100.7 | 106.6 | 102.1 |
| Nov-19 | 100.1 | 106.7 | 102.3 | 101.1 | 107.8 | 102.0 |
| Dec-19 | 99.6 | 108.5 | 101.7 | 101.3 | 108.5 | 102.4 |
| Jan-20 | 100.3 | 108.4 | 101.5 | 101.0 | 108.7 | 102.0 |
| Feb-20 | 98.5 | 108.4 | 100.8 | 101.0 | 108.3 | 101.3 |
| Mar-20 | 99.6 | 113.8 | 98.0 | 100.7 | 107.2 | 99.3 |
| Apr-20 | 100.8 | 111.0 | 97.0 | 101.5 | 106.2 | 98.4 |
| May-20 | 100.1 | 109.0 | 97.2 | 101.5 | 106.6 | 97.7 |
| Jun-20 | 97.9 | 109.5 | 97.0 | 101.0 | 107.6 | 98.2 |
| Jul-20 | 96.7 | 108.5 | 96.4 | 100.5 | 107.6 | 97.8 |
| Aug-20 | 96.6 | 107.5 | 96.6 | 100.5 | 108.1 | 98.0 |
| Sep-20 | 97.8 | 108.7 | 97.2 | 99.7 | 108.9 | 97.7 |
| Oct-20 | 97.6 | 107.9 | 97.9 | 99.7 | 108.5 | 98.3 |
| Nov-20 | 98.1 | 108.4 | 98.9 | 100.3 | 109.5 | 99.5 |
| Dec-20 | 98.8 | 106.2 | 98.3 | 101.6 | 109.1 | 99.6 |
| Jan-21 | 100.5 | 107.8 | 100.9 | 102.9 | 108.4 | 100.8 |
| Feb-21 | 101.4 | 109.3 | 100.5 | 105.3 | 109.7 | 101.9 |
| Mar-21 | 103.2 | 108.2 | 101.5 | 106.1 | 110.4 | 103.0 |
| Apr-21 | 104.1 | 108.9 | 101.1 | 107.4 | 110.9 | 103.4 |
| May-21 | 105.7 | 107.1 | 102.2 | 109.0 | 112.4 | 104.7 |
| Jun-21 | 106.6 | 108.9 | 102.9 | 110.8 | 114.0 | 105.9 |
| Jul-21 | 110.9 | 110.4 | 107.5 | 113.1 | 114.8 | 106.7 |
| Aug-21 | 114.3 | 113.1 | 109.8 | 115.2 | 115.6 | 107.9 |
| Sep-21 | 117.3 | 114.0 | 109.9 | 117.6 | 117.0 | 109.1 |
| Oct-21 | 118.5 | 115.8 | 113.5 | 119.9 | 117.7 | 110.0 |
| Nov-21 | 120.8 | 117.4 | 114.7 | 122.3 | 118.7 | 111.7 |
| Dec-21 | 125.9 | 119.0 | 116.7 | 123.8 | 119.7 | 112.6 |
| Jan-22 | 128.8 | 122.0 | 120.0 | 124.4 | 120.4 | 114.3 |
| Feb-22 | 130.7 | 121.4 | 122.5 | 125.9 | 121.6 | 115.3 |
| Mar-22 | 134.5 | 124.6 | 125.5 | 128.4 | 123.3 | 116.3 |
| Apr-22 | 136.7 | 127.9 | 127.6 | 129.5 | 123.1 | 116.7 |
| May-22 | 138.8 | 133.4 | 128.3 | 131.4 | 124.5 | 118.1 |
| Jun-22 | 143.3 | 134.2 | 131.4 | 132.3 | 124.6 | 118.9 |
| Jul-22 | 147.2 | 136.3 | 130.3 | 132.6 | 124.7 | 118.8 |
| Aug-22 | 150.5 | 136.1 | 133.4 | 132.7 | 125.3 | 118.1 |
| Sep-22 | 151.3 | 136.0 | 135.5 | 133.4 | 125.3 | 118.3 |
| Oct-22 | 152.8 | 136.7 | 135.1 | 133.9 | 125.6 | 118.8 |
| Nov-22 | 150.9 | 134.2 | 135.8 | 133.5 | 126.1 | 118.6 |
| Dec-22 | 150.4 | 135.1 | 136.9 | 133.5 | 126.7 | 118.2 |
| Jan-23 | 151.0 | 132.4 | 136.0 | 133.4 | 126.6 | 118.7 |
| Feb-23 | 151.0 | 135.5 | 140.1 | 133.1 | 126.7 | 118.8 |
| Mar-23 | 151.9 | 136.7 | 140.3 | 132.7 | 123.8 | 118.4 |
| Apr-23 | 151.4 | 136.7 | 140.3 | 132.5 | 125.7 | 118.4 |
| May-23 | 149.6 | 137.2 | 139.6 | 132.0 | 124.9 | 118.6 |
| Jun-23 | 148.5 | 138.3 | 140.9 | 132.1 | 124.6 | 118.2 |
| Jul-23 | 145.8 | 137.8 | 142.3 | 132.2 | 125.1 | 118.0 |
| Aug-23 | 144.9 | 139.0 | 141.4 | 132.2 | 126.2 | 118.2 |
| Sep-23 | 146.1 | 140.3 | 142.4 | 132.3 | 126.3 | 118.4 |
| Oct-23 | 147.3 | 138.8 | 142.5 | 132.4 | 126.3 | 118.4 |
| Nov-23 | 147.7 | 140.1 | 144.4 | 132.3 | 126.6 | 118.3 |
| Dec-23 | 146.5 | 136.7 | 142.7 | 131.5 | 127.5 | 118.4 |
| Jan-24 | 144.8 | 137.7 | 143.3 | 131.2 | 128.0 | 117.8 |
Diversify suppliers
Another possible hedge against supply chain disruptions is for a firm to diversify its suppliers or have backup suppliers at ready in case of a disruption. There are two possible aspects of diversification: one is to have a wider selection of firms, which allows for alternative suppliers in case of a problem or shutdown at the firm level. The other type is geographic, spreading suppliers across countries or regions, which would hedge against natural disaster risks, human and organizational risks, as well as geopolitical risks. As previously mentioned, Tokui, Kawasaki and Miyagawa (2017) estimated that in the case of the Great East-Japan Earthquake, adding redundancy to supply chains could have greatly mitigated the impacts.
Adding suppliers (company diversification) or diversifying the locations (geographic diversification) where a firm sources inputs may be more difficult in reality than in theory. The ability to add alternative suppliers for a needed input will depend on the nature of the input in question and the relationship between the supplier and customer firm. Generic or homogenous inputs may have a large selection of suppliers to chose from, whereas more unique heterogenous inputs may have fewer alternative suppliers available to select. Furthermore, more specialized inputs may require closer relationships between suppliers and customers. For instance, they may require complex customer schematics, changing standards, or even day-to-day collaboration between supplier and client, making the setup of alternatives more costly. Also, natural endowments may mean certain raw inputs are only found in a small number of key countries making geographic diversification of suppliers difficult or even impossible. For example, following Russia’s unprovoked and illegal invasion of Ukraine, it was found that Russia was the leading supplier of urea, a key nutrient additive in fertilizers. It was an especially important input for PEI potato growers and could not be easily substituted with domestic fertilizers, such as those comprised of potash. In the same vein, large sunk costs for setting up plants or other characteristics of natural monopolies may concentrate some inputs to a limited selection of source countries, as is the case with microchips (see Box 2.1).
Even if a firm can diversify its supply chain, the results may not be as straightforward as one may think. Diversifying suppliers may counter the creation of closer supplier-client relationships. A close working relationship between supplier and client can potentially help firms work together to solve problems and overcome obstacles. This is shown in Jain, Girotra, and Netessine (2022), where the authors write that “supplier diversification is associated with slower recovery from sourcing interruptions, while the use of long-term relationships is associated with faster recovery. A one standard deviation decrease in the former is associated with a 16% faster recovery, and a like increase in the latter is associated with a 20% faster recovery.” The same authors point to other studies (Sheffi 2005, Yang et al. 2012) showing that while diversification may lower the chances for disruption, it may increase the recovery period from disruption. In other words, while having many suppliers will lower chances of disruption occurring, having one or two trusted suppliers with close relationship may help a firm withstand a crisis or recover from a disruption faster, as the two firms will be able to work together better in order to overcome obstacles. As with building inventories, it seems adding diversity of suppliers may be a hedge with costs that need to be balanced with the probability of risks of disruption to a firm’s supply chain.
Figure 2.14: Diversification of import sources
Text version - Figure 2.14
| Number of import sources | 2018 (%) | 2022 (%) | Percentage point change |
|---|---|---|---|
| Source: Statistics Canada. Calculation of the OCE. | |||
| 1 partner country | 51.2 | 50.9 | -0.3 |
| 2 partner countries | 16.7 | 16.7 | 0.0 |
| 3 to 5 partner countries | 17.4 | 17.3 | -0.1 |
| 6+ Partners | 14.8 | 15.1 | 0.4 |
The ambiguous ability and gains from diversifying supply chains may also be seen in the data. In the case of Canada, as shown in Figure 2.14, Canadian importing firms have made a modest improvement in geographical diversification of suppliers since COVID‑19. In 2018 (before COVID-19), 51% of importing firms in Canada only sourced from one partner country. By 2022, this share had fallen modestly. Similarly, 15.1% of importers sourced from six or more geographical sources compared to 14.8% in 2018. Looking at the data more closely, medium-sized firms saw the largest increase in geographic diversification of suppliers. It is too early to say if these are just fluctuations in the data or the beginning of a trend.
Innovating production and internalizing supply
Another way a firm might react to the risk of disruption in its supply chains is to change the way it produces its product. This could include changing the way the product is made to limit or avoid a certain vulnerable input or in some cases to internalize supply by making the input in question domestically or gaining ownership over the supplier. While this may be a possible solution to supply chain disruptions, it is likely a much more costly one compared to building inventories or diversifying supply.
There does seem to be some examples of firms changing or innovating production to adjust their supply chains. One such cited example is Honda, a Japanese car manufacturer, innovating a hybrid vehicle engine to be manufactured without the use of certain rare earth metals normally used in hybrid engines. This is said to be in response to Chinese export controls placed on Japan in 2010. According to Forbes (2016), at the time, China was responsible for about 95% of global rare earth metals production and held half of the world’s reserves of these metals. Due to a territorial dispute, China reduced its export quota and blocked exports to Japan for two months. In response, Honda designed a new hybrid engine that did not require use of the rare earth metals blocked in 2010. However, it should be noted that this new engine was not announced until 2016, six years after the 2010 dispute, and there may be many motivations and factors behind the new design beyond the supply chain risk highlighted. Another early but more famous example of a change in production related to supply concerns comes from the soft drink industry. Rising prices of cane sugar in the early 1980s is believed to have led Coca-Cola, a popular soft drink producer, and other North American soft drink companies, to switch to using corn syrup in their drinks by the mid-1980s. While this was not necessarily a reaction to supply chain risk but rather due to the pricing of supplies, it does indicate that firms can and will innovate in light of supply chain pressures.
Gaining control over a supplier or producing a needed input in-house is another potential answer to supply chain risks. Taking control over a supplier, or the combination in one company of two or more stages of production normally operated by separate companies, is referred to as vertical integration. Measuring vertical integration as well as ascertaining the motivations behind it is a difficult undertaking. It is unclear whether greater vertical integration has resulted because of the perceived risks to supply chains in the wake of COVID-19 or new challenges highlighted in this chapter. One unique attempt to ascertain whether firms use vertical integration as a solution to supply chain challenges is found in an NBER working paper, where Ersahin, Giannetti and Huang (2023) use textual analysis of earnings conference calls of U.S. listed companies to identify firms that face supply chain risks and see how those firms react to those risks. The authors found that while firms facing greater supply chain risks tended to increase relationships with closer or domestic suppliers, those firms that did not face financial constraints become more likely to engage in vertical mergers and acquisitions. This is one indication that, at least in the U.S., firms may have internalized suppliers to limit supply chain risks.
Building inventories, diversifying supply, or innovation and vertical integration are some ways firms can mitigate risks in supply chains, but there may likely be others. More importantly, it needs to be noted that there are great benefits to supply chains that often outweigh the risks. One would be forgiven in assuming that it is only large, globally active firms that need to think about adapting to these risks, but in fact many small and medium-sized enterprises (SMEs) in Canada are also involved in international supply chains and are just as vulnerable to disruptions as large firms. However, SMEs may have unique challenges, particularly in their awareness of their upstream suppliers and their respective locations. Box 2.2 summarizes a study by Bazile, Toumi, Mohiuddin and Su (2024), who undertook a pan-Canadian survey of 465 Canadian manufacturing SMEs to gain better insight into the unique supply chain challenges these smaller Canadian firms face. Finally, the last section of this chapter looks at a more drastic answer to supply chain risks: reshoring, what it is, and whether it is happening in Canada.
Box 2.2: Challenges faced by Canadian SMEs in international supply chains
A recent study by a team of researchers,Footnote 18 led by Dr. Zhan Su of Université Laval, attempts to shed light on how Canadian SMEs are engaged in international supply chains and the challenges they face. By surveying 465 manufacturing SMEs across Canada between September 28 and October 23, 2023, the Université Laval research team was able to gain greater insight on: the level of dependence of Canadian SMEs on foreign inputs; the ability of Canadian SMEs to identify their direct and indirect suppliers and where they are located; and the strategies Canadian SMEs have in place to mitigate vulnerabilities to supply chain disruptions. Furthermore, the survey also distinguished how firm characteristics, such as revenue, company size, and supply chain knowledge levels, play a role in a firm’s vulnerability to supply chain disruptions. Below is a summary of some of the main results of the survey. The full report (PDF, 1.66MB) can also be reviewed.
Table 2.2: SME dependence on foreign inputs
| Percentage of intermediate inputs sourced from outside Canada | Number of SME respondents | Percentage share of respondents |
|---|---|---|
| Source: The challenges of Canadian SMEs in the face of global supply chain turbulence: Results from a Pan-Canadian survey, Bazile, Toumi, Mohiuddin and Su, Université Laval, 2024. | ||
| Less than 5% | 79 | 17.0% |
| 5% - 15% | 117 | 25.2% |
| 16% - 25% | 148 | 31.8% |
| More than 25% | 121 | 26.0% |
Canadian SMEs are heavily dependent on foreign inputs
International supply chains are not solely the domain of large companies. The Laval survey shows that most SME manufacturers are also deeply integrated into international supply chains, with 95% of survey respondents indicating they sourced directly from international markets. More than half (58%) of SME respondents indicated that they source more than 15% of their intermediate inputs from foreign sources (see Table 2.2). In many cases these inputs sourced from abroad can be key inputs needed for Canadian SME manufacturers, and they may not be able to find alternatives elsewhere. The survey found that a substantial portion of SMEs rely on hard-to-replace foreign inputs, increasing their exposure to production losses in the event of disruptions.
Those Canadian SMEs heavily dependent on foreign inputs (sourcing more than 25% of their inputs from abroad) tend to be larger and more established, and operate primarily in the computer and electronic manufacturing industry, food manufacturing, and fabricated metal manufacturing. However, larger SMEs—for instance SMEs with higher revenues, particularly those exceeding $10 million—show a stronger inclination towards engaging with international suppliers. This is important as it is found that stronger relationships between clients and suppliers can help firms overcome disruptions or shocks to their supply chains faster.
Canadian SMEs just rely not only on foreign markets for inputs, but they also sell into foreign markets. Nearly half of the surveyed SMEs have substantial export-based revenue, primarily targeting the United States, meaning Canadian SMEs face supply chain vulnerabilities through both imports and exports.
Canadian SME source from a wide range of countries, but supply chain visibility is often lacking
Canadian SMEs source inputs from a wide range of countries. In the survey, 47 different countries were listed as sources for intermediate inputs. However, the U.S. and China emerged as the primary suppliers. But not all Canadian SMEs know exactly where their inputs are being sourced. Of those SMEs that depend on foreign suppliers, a substantial portion (70%) claimed to have partial or precise knowledge of the source of their inputs. However, this means nearly a third (30%) of those SME respondents had significant gaps in knowledge and visibility of their input sources. Visibility in upstream supply chains is also a concern. While 75.7% of SMEs could identify at least one foreign customer country, reliance on intermediaries for exports limits their visibility into final markets. The study observes that companies that have better visibility of their supply chain, both upstream and downstream, tend to engage in practices such as increased collaboration with suppliers and direct contact with suppliers, thus reducing the need for intermediaries.
Canadian SMEs are implementing various strategies to mitigate vulnerabilities to supply chain disruptions
While the survey found Canadian SMEs are vulnerable to international supply chain disruptions by both dependence on foreign suppliers and by selling to foreign markets, the survey also found that many SMEs in Canada are implementing strategies to overcome the risks of disruptions in their supply chains. Firstly, SMEs are trying to diversify their suppliers. The survey results show that many SMEs reported that they were searching for new suppliers, with a notable 78.5% of SMEs having actively sought new suppliers, demonstrating a strategic shift towards diversifying supply sources. Secondly, Canadian SMEs are also trying to diversify their customer base, with 63.9% of SME respondents reporting that they identified new foreign customers, and 73.5% found new domestic ones. Thirdly, many Canadian SMEs are building up inventories as a buffer against potential shortages, 70% of SMEs have increased their storage capacities, with larger companies and those with hard-to-substitute inputs being more inclined towards significant inventory increases. Finally, over 68% of SMEs have undertaken modifications to their manufacturing processes or products to lessen dependence on specific foreign inputs or adapt to market changes.
Conclusion
These findings by the Université Laval unveil the deep integration of Canadian SMEs within international supply chains. More than half of companies surveyed in this work show a marked dependence on international inputs and many of those firms indicate that these inputs would be difficult to replace. In short, Canadian SMEs are very much dependent on international supply chains, and Canadian SMEs will play a large role in how Canada faces future challenges and risks to international supply chains.
2.4 Reshoring and other shoring strategies
As mentioned in the previous section, there are several ways in which firms can mitigate supply chain risks. Reshoring—or the relocation of production activities back to the home country—and alternative shoring strategies are ways in which companies may choose to reconfigure parts of their global supply chains in response to new or elevated risks, or evolving priorities. While various shoring options have drawn increased attention in recent years due to the supply chain challenges brought on by the pandemic, climate change, as well as geopolitical tensions and conflicts, they are not new strategies from the firm’s perspective. The decision of where to set up operations or from where to source, either domestically or abroad, is part of a firm’s location strategy, which can be reviewed and revised as needed.
When firms need inputs for production (that is, intermediate goods and services), they may choose to procure them from another firm, i.e., outsource, or produce them in-house (Figure 2.15). Firms that outsource may choose domestic suppliers, foreign suppliers, or a combination of both. Similarly, in-house production can be done domestically by the firm, or abroad, through the creation or acquisition of foreign affiliates, i.e., offshoring production. Given that firms may offshore outsourcing or production, or both, a distinction needs to be made between the reshoring of outsourcing—switching from procuring products or services from abroad to domestic procurement—and the reshoring of production—relocation of affiliates located abroad to the company’s home country.
Both the reshoring of production and the reshoring of outsourcing will impact trade. If Canadian companies choose to source or produce domestically, there will be a drop in Canadian companies’ imports of intermediate goods and services. Similarly, if foreign firms with affiliates or suppliers in Canada decide to switch to domestic sourcing or production, Canadian exports will be affected.
The reshoring of production will also impact foreign direct investment. A change in the strategies of foreign multinationals (FMNEs) could negatively impact Canada’s FDI if FMNEs decide to reshore their affiliate from Canada to their home country. Likewise, Canadian multinationals (CMNEs) may decide to bring some of their offshored activities back home, which would impact Canadian direct investment abroad (CDIA).
Figure 2.15: Reshoring what? Moving affiliates versus switching suppliers
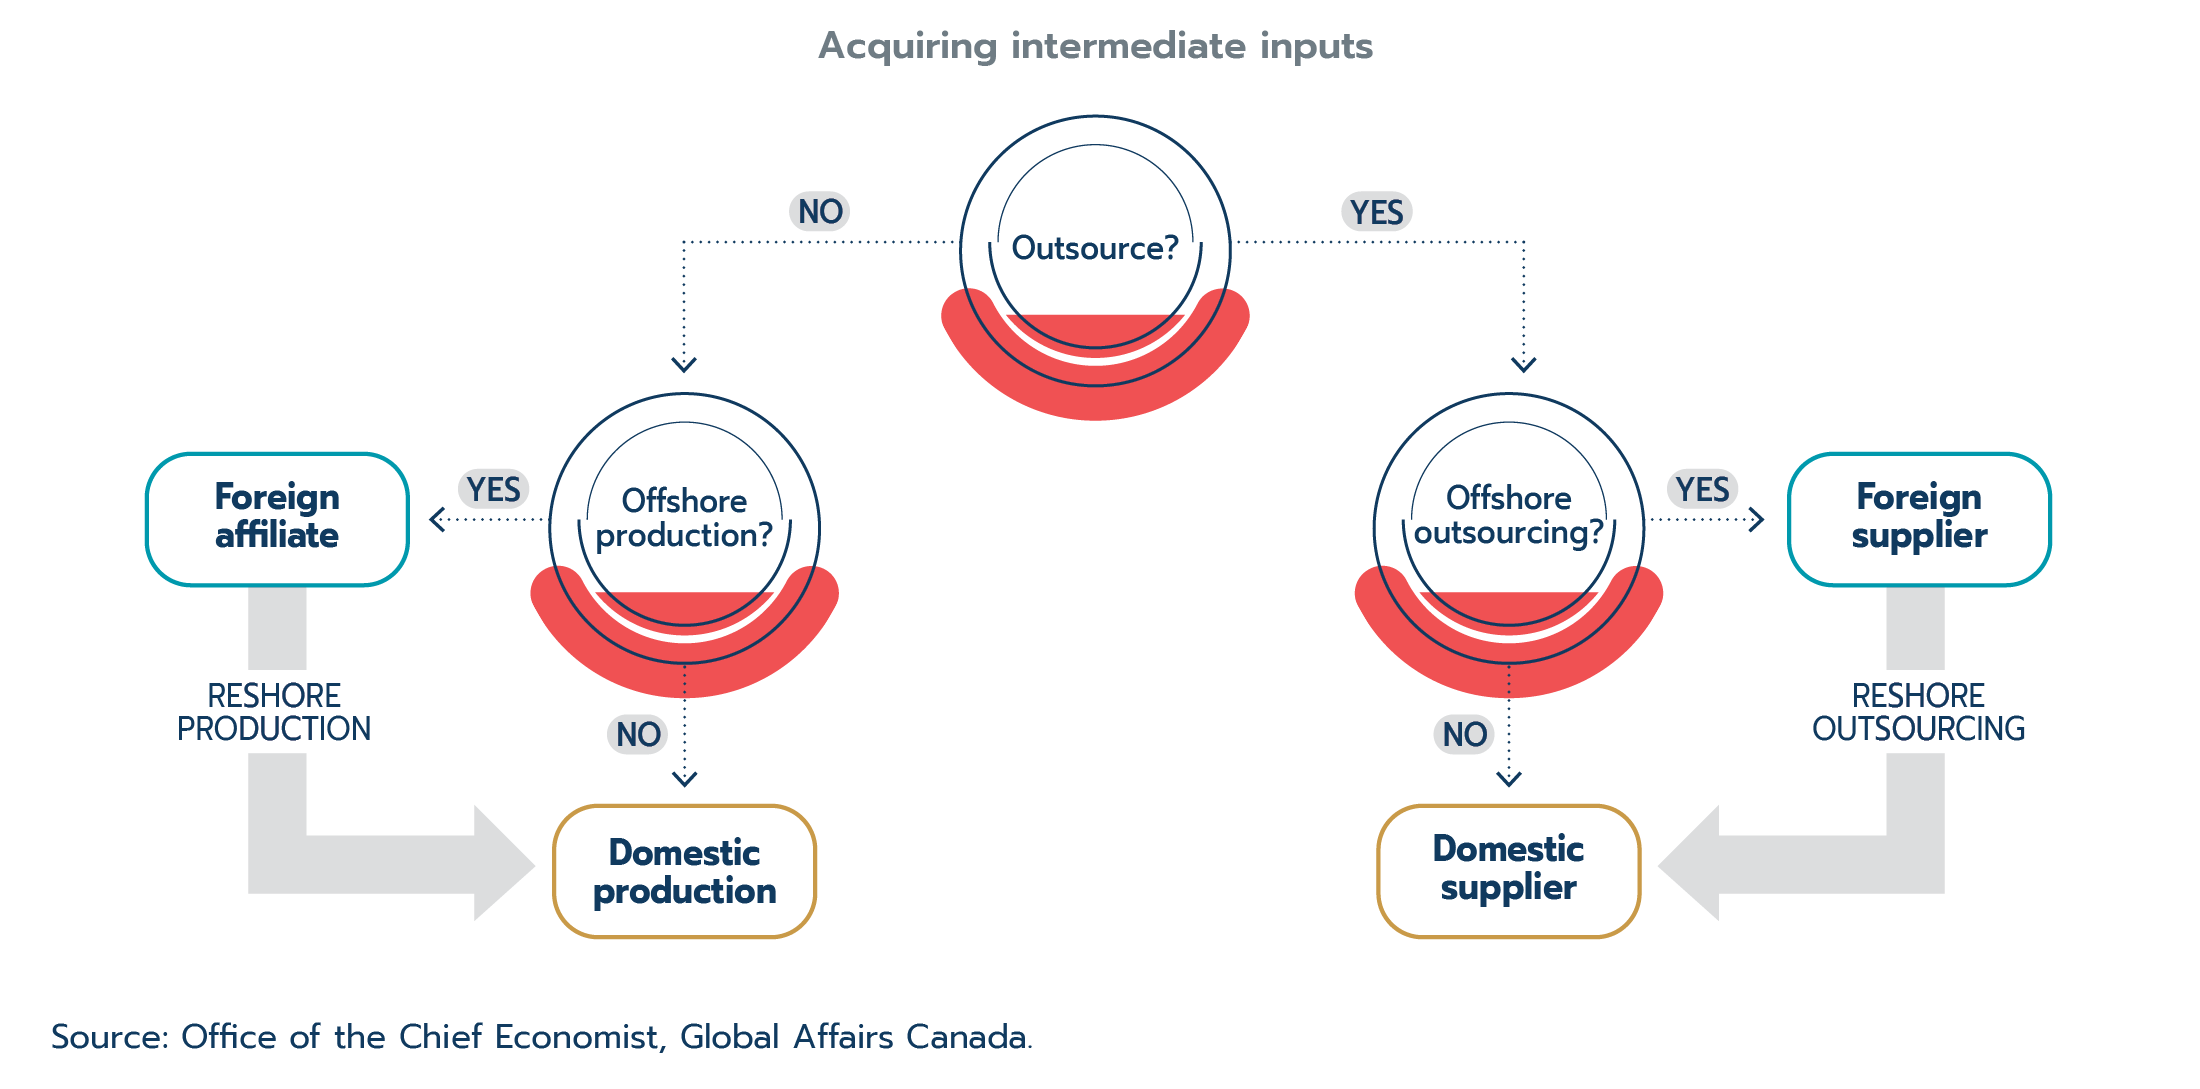
Text version - Figure 2.15
Reshoring what? Moving affiliates versus switching suppliers
This figure depicts the choices that firms make when acquiring intermediate inputs for production. The firm choices are shown in diamond shapes that present each of the main questions the firm must answer with arrows pointing to the outcome depending on whether the answer to the given question is “yes” or “no.” The first question shown in a diamond shape on the top left side is “Outsource?” If the decision is “no,” then the next question is whether to offshore production. This is shown with an arrow pointing downward to another diamond with the text “Offshore production?” If the answer to the first question is “yes,” then the next question is whether to offshore outsourcing. This is shown by an arrow pointing to the right to another diamond with the text “Offshore outsourcing?” The “Offshore production?” diamond has an arrow pointing to the left with a “no” above it. The arrow points to a box with the text “Domestic production.” This diamond also has an arrow pointing downward with a “yes” beside it. This arrow points to a box below the diamond with the text “Foreign affiliate.” There is an arrow from the “Foreign affiliate” box to the “Domestic production” box with the text “Reshore production” below. The “Offshore outsourcing” diamond has an arrow below it with a “no” beside it pointing to a box with the text “Domestic supplier.” This diamond also has an arrow to the right pointing to a box with the text “Foreign supplier.” There is an arrow from the “Foreign supplier” box to the “Domestic supplier” box with the text “Reshore outsourcing” below.
Source: Office of the Chief Economist, Global Affairs Canada.
Note that according to this definition of reshoring—whether it be the reshoring of production or the reshoring of outsourcing—there is a previous offshoring process that is being reversed (De Backer 2016). There are other definitions of reshoring that encompass other types of relocation decisions, including offshoring. Reshoring and relocation from one foreign country to another are sometimes even used as synonyms, without any distinction between where the business activity is ultimately being moved (i.e., domestically or elsewhere abroad). In this report, reshoring is considered as the movement of offshored activities back to the company’s home country.
Understanding the decision to relocate
Given that reshoring follows a prior decision to offshore, it helps to understand reasons for offshoring and the potential drivers behind reshoring. Companies’ reasons to offshore activities include access to resources, access to new markets and technologies, improved efficiencies, and other comparative advantages that various locations offer. According to the “ownership,” “location,” and “internalization” (OLI) framework (Dunning 1979), a firm will choose to invest abroad if it owns assets that give it a competitive edge in global markets; if a foreign location offers advantages such as skilled labour, favourable legislation, and access to key resources and markets; and if a firm possesses the key competencies and resources to perform and manage activities—the internalization advantage. If a firm does not have this internalization advantage, then setting up a contract with foreign suppliers, i.e., offshoring outsourcing, would be the preferred choice.
The OLI framework identifies reasons for which firms decide to offshore that describe these underlying motivations. First, setting up an affiliate abroad may help a firm access a new foreign market (market-seeking FDI). Second, offshoring can be used to gain access to specific resources, such as raw materials (resource-seeking FDI). Through offshoring, firms may also lower production costs by leveraging competitive advantages offered by another location (efficiency-seeking FDI). Finally, businesses may be able to gain access to strategic assets, notably through foreign acquisitions (strategic asset-seeking FDI). These four motivations for offshoring are not mutually exclusive. Firms often engage in FDI for a combination of reasons (Global Affairs Canada 2021).
The initial reason for offshoring impacts the company’s decision to reshore or relocate to another country (Barbieri et al. 2019). FDI that is primarily market-seeking in nature has a lower likelihood of being reshored (Fel et al. 2020) as does resource-seeking FDI. In both cases, the offshore location offers key advantages, such as access to a market or strategic resources that cannot be accessed elsewhere. Asset-seeking FDI may be reshored if the advantages associated with an affiliate location and its assets have been fully utilized or exhausted (e.g., advanced knowledge or technology) or if another location offers superior assets. Efficiency-seeking FDI may be reshored if savings associated with a location are lower than expected or when quality-related or other issues arise (Barbieri et al. 2019).
Drivers for the reshoring of affiliates can be classified in three broad categories: recognition of incorrect offshoring decision, change in external environment, and strategic shift (Barbieri et al 2018). Reshoring may be the reversal of an incorrect decision to offshore if management has not fully accounted for costs and/or performance or quality issues. A change in external environment encompasses everything from increased uncertainty due to new perceived risks (e.g., environmental, geopolitical, currency, etc.,) as well as increasingly unfavourable host-country conditions such as increased costs (e.g., higher wages, higher energy costs), or deteriorating delivery times or quality. Finally, reshoring may be the result of a change in firm strategy or priorities, such as the decision to pursue the development of new products or automate production.
These same drivers behind the reshoring of affiliates also apply to the reshoring of suppliers. Companies may choose to switch to domestic suppliers to correct an initial mistake in choosing a foreign supplier; because of changes in the external environment, such as currency fluctuations; or because of shifts in strategies or priorities.
Often-cited reasons behind multinationals’ (MNEs) decisions to reshore activities and suppliers include (Blais-Morisset and Rao 2024) include:
- Cost: Changes in the relative costs of foreign and domestic locations, and knowledge gained about initial cost assumptions;
- Quality: Issues with the quality of products and/or services from abroad, either from outsourced or offshored activities;
- Risk: A change in the risk associated with global sourcing and offshored activities (e.g., extreme weather events, geopolitical conflict, exchange rate fluctuations, threats to intellectual property, difficulty securing inputs, supply bottlenecks, etc.);
- Structural change: A structural change in the inputs required for production, such as through digitalization and process automation; and
- Values/branding: Firm values related to economic nationalism (i.e., made local), sustainability and carbon footprint reduction, as well inclusive sourcing within the domestic economy.
Ultimately, reshoring is a costly endeavor for businesses and a firm that does choose to relocate will not, realistically, do so in the short term. There is significant time associated with shifting activities to another location, whether at home or abroad. Building new facilities, hiring and training new employees, and finding new suppliers take time, as does ramping down production and selling buildings and/or equipment at the existing affiliate location. Firms may also face prohibitive penalties for breaking existing vendor contracts. Furthermore, the lost profits of activities not fully amortized make relocating operations a difficult choice in the short term. The restructuring of a globally integrated supply chain—whether it be through new suppliers, the relocation of affiliates, or both—is a gradual process and changes in firm strategies take time to observe (Barbieri et al. 2020). Given the sunk costs associated with offshoring, firms relocate production in response to demand shocks, trade costs, and/or foreign production costs only if the shocks are large and persistent (Di Stefano et al. 2022).
Businesses may find relocating to another country to be more advantageous to reshoring as they are able to address vulnerabilities while continuing to profit from other countries’ comparative advantages. Nearshoring—moving affiliates or suppliers from distant locations to countries in closer proximity—allows firms to lower transportation costs, decrease lead times, and improve communication and coordination, if operating within the same time zone (from country A to country B in Figure 2.16). Meanwhile, moving affiliates or switching suppliers to another location within the same region (from country A to country C, e.g., from China to Vietnam) may allow businesses to benefit from lower costs, such as operating costs. Of course, the parent company may also choose to relocate to an entirely different region to access the new location’s benefits or the strategic priorities (from country A to country D).
Figure 2.16: Shoring options
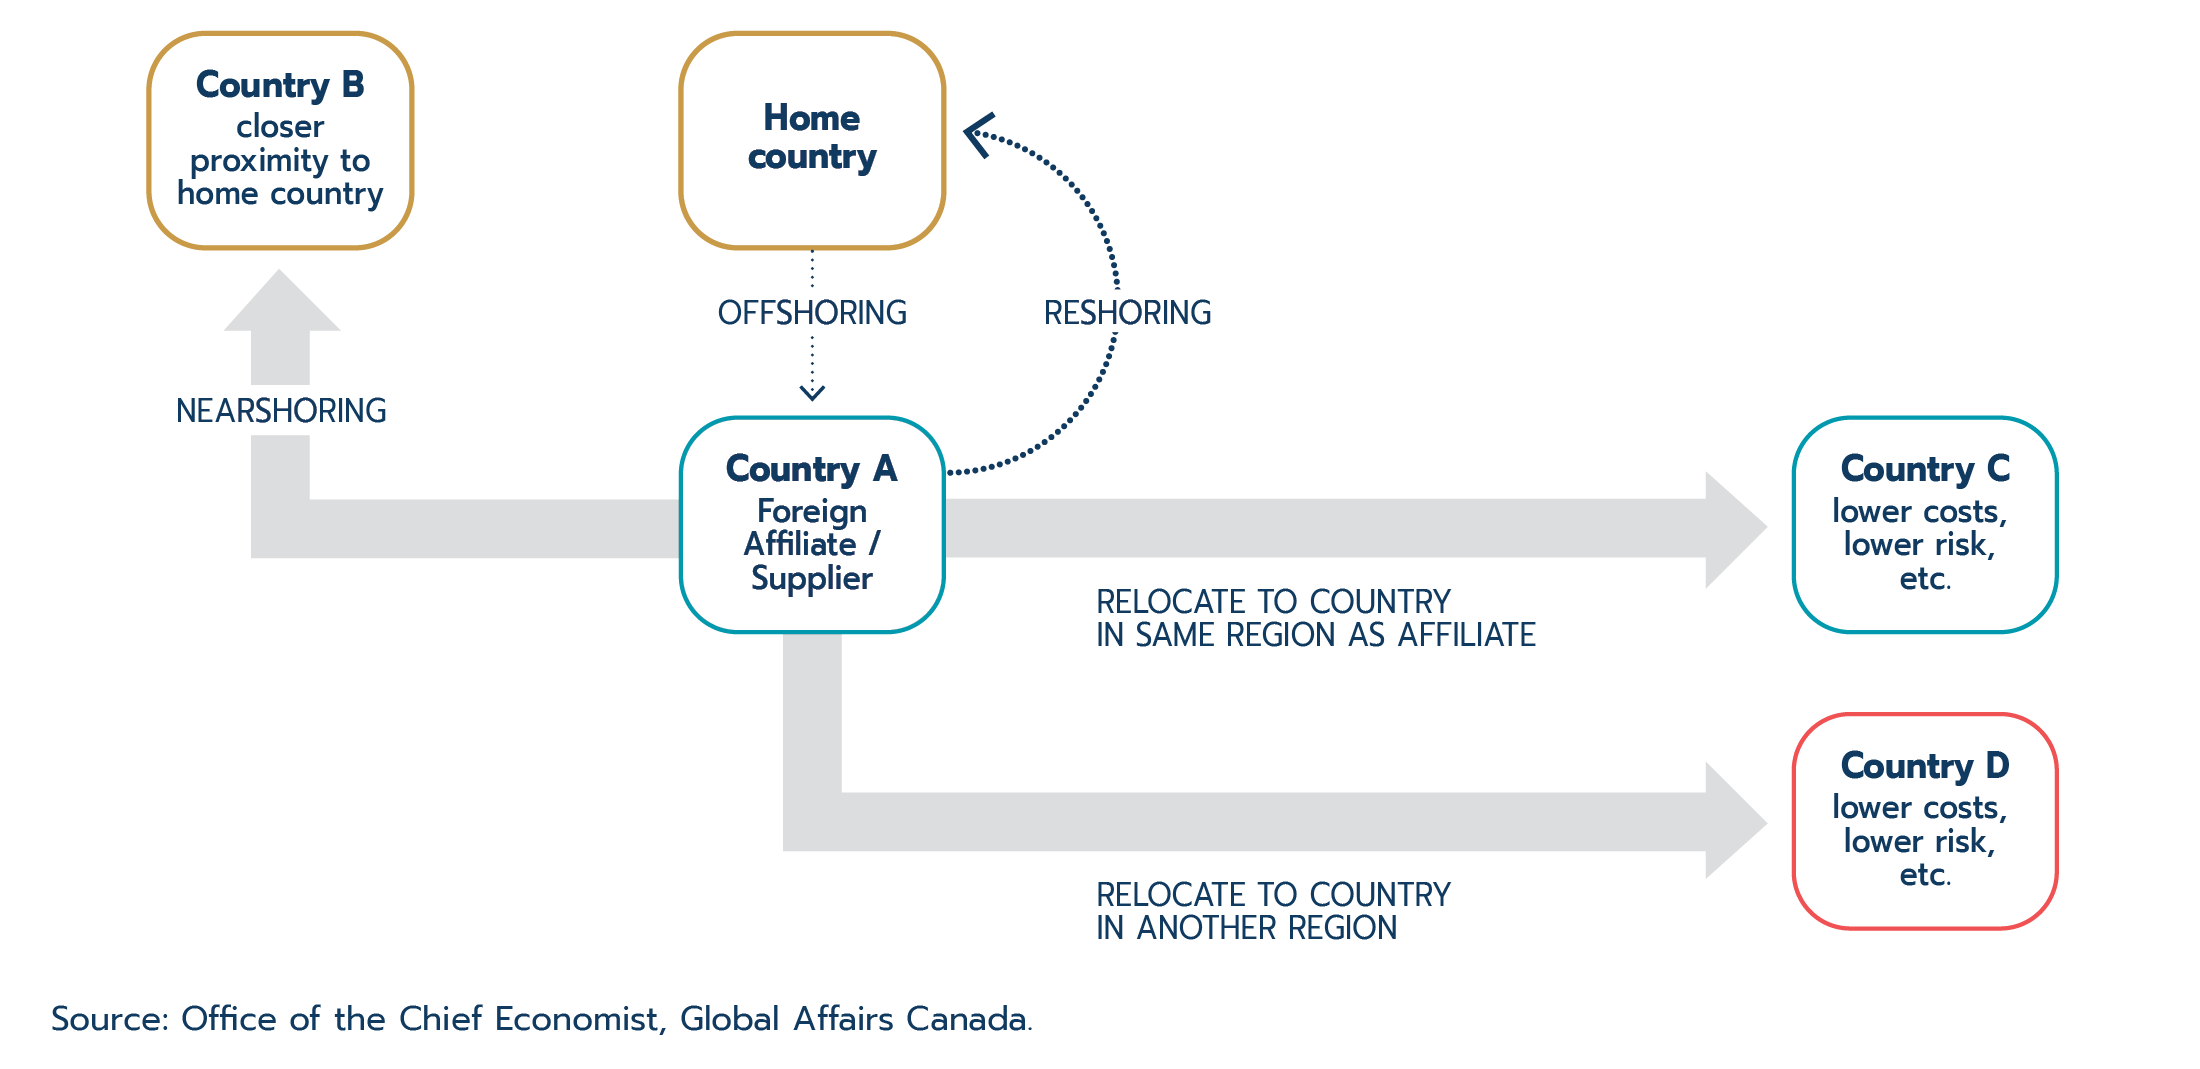
Text version - Figure 2.16
Shoring options
This figure depicts the various shoring options that are possible for a firm. A box at the top with the text “Home country” has an arrow below it with the text “Offshoring” beside it. This arrow points to a box that reads “Country A: Foreign Affiliate/Supplier.” There are four arrows pointing away from this box. One arrow points back to the “Home Country” box and has “Reshoring” written beside it. Another arrow points to the left and upwards with the text “Nearshoring” written beside it. This arrow leads to a box to the left of the “Home Country” box that reads “Country B: Closer proximity to home country.” The third arrow points to the right with the text “Relocate to country in same region as affiliate” written underneath. This arrow leads to a box with the text “Country C: Lower costs, lower risks, etc.” The last arrow is below the “Country A” box and points downwards and to the right with the text “Relocated to country in another region” below. This arrow points to a box that reads “Country D: Lower costs, lower risk, etc.”
Source: Office of the Chief Economist, Global Affairs Canada.
Evidence of reshoring is scarce
The growth of foreign direct investment, or offshoring, was strong in the 1990s and 2000s, as discussed in section 2.1. Since having made offshoring decisions, companies may have new information and reconsidered these decisions. The question is whether many companies have reconsidered and, more importantly, have taken action. The challenge in identifying reshoring and how it is evolving over time is finding the right data. Ideally, a database tracking business affiliates and suppliers over time would help track reshoring trends. In the absence of such data, other methods are used to try to determine whether firms are bringing operations back home and/or switching from foreign to domestic suppliers.
Import data are often examined to look for signs of reshoring at the economy level. An overall decrease in imports may signal a shift from production abroad (i.e., a decrease in imports of intermediate goods from foreign affiliates) to an increase in domestic production. A decrease in imports could also reflect a switch from foreign to domestic suppliers. A 2016 study (De Backer et al.) looked at import growth relative to domestic demand in major economies between 2005 and 2014 and found no decrease in the ratio that would suggest reshoring. While a decrease in this ratio could signal reshoring of affiliates or switching to domestic suppliers, it could also reflect an increase in domestic production without any relocation of foreign affiliates or supplier change.
Import data can also be used to examine changes in the ratio of domestic to foreign inputs. Another study (Krenz and Strulik 2021) shows an increase of this ratio on an aggregate global scale between 2000 and 2014 and interprets this increase as a sign of reshoring. However, an increase in the domestic to foreign ratio could be observed without reshoring taking place. This would be the case if, for example, an industry that does not outsource inputs from abroad grows (thus increasing demand for domestic inputs) while other industries maintain their demand of foreign-sourced inputs.
Alternatively, reshoring can be measured by looking at imports of manufactured goods as a share of domestic output, also known as the manufacturing import ratio (MIR). An increase in domestic output accompanied by a decrease in imports may signal reshoring since it could be an indication that inputs are increasingly being produced or sourced domestically rather than imported from foreign affiliates or suppliers abroad. Kearney publishes an annual reshoring index for the U.S. that represents a year-over-year change in the MIR for the overall economy. Their latest publication (2023) reports a 0.39 decrease in the MIR from 14.49 in 2021 to 14.10 for 2022, interpreting this as a sign of reshoring. However, a decrease in the MIR could also be a result of trends other than reshoring. For example, technological advancements, such as automation, could also drive an increase in domestic production, without a corresponding relocation of foreign affiliates or suppliers or decrease in imports. Furthermore, this one-year decrease follows a marked jump in the MIR between 2020 and 2021 (+1.54). Therefore, the latest decrease is much smaller in comparison to the previous increase. Additionally, the U.S. MIR has been following a decade-long upward trend and the 2022 MIR remains above the 10-year average (12.61).
A better measure is the MIR adjusted for inflation since it isolates changes in the ratio that may simply be reflective of price effects. Inflation-adjusted MIRs do not show reshoring on a macro scale in either Canada or the U.S., with both trending generally in upward directions between 2015 and 2023. There is a slight decline in the inflation-adjusted MIR in the U.S. in 2023, which may suggest the possibility of reshoring, but it is too early to determine if this is the start of a new trend. At the industry level in Canada, there were also some potential signs of reshoring for beverage and tobacco manufacturing (between 2018 and 2021) and petroleum and coal product manufacturing (between 2016 and 2022). However, these seem to be unlikely candidates for reshoring.
Affiliate shoring trends can also be examined using data on the activities of multinationals. If employment by multinationals and their assets are increasing at a greater rate domestically compared to abroad, this could be a sign of reshoring. In the 10 years between 2011 and 2021, CMNEs’ share of domestic employment fell in both goods and services industries due to much faster growth in employment abroad (Blais-Morisset and Rao 2024) (1.4% growth in CMNE domestic employment compared to 5.4% growth in CMNE employment by foreign affiliates). This trend is insufficient to rule out reshoring. Slower growth in domestic CMNE employment may reflect other factors such as the adoption of new technologies or restructuring of domestic industries. With respect to CMNE assets, growth abroad was faster compared to domestic growth over the past decade resulting in a decline in the CMNE domestic share in both goods and services industries. This further shows that Canadian businesses continue to expand their activities abroad.
CMNE asset data by sector show that for those sectors with a high foreign presence (finance and insurance; and mining, quarrying, and oil and gas extraction), there have been no signs of reshoring with shares of domestic assets decreasing. The transportation and warehousing sector also has a high foreign presence and has shown possible signs of reshoring in recent years with a decrease in the share of foreign assets. Meanwhile, manufacturing, the sector more commonly associated with reshoring, did not show any signs of companies relocating activities at home with foreign assets continuing to grow. The sector that did see a notable increase in its share of domestic assets is agriculture, forestry, fishing, and hunting. Overall, however, this sector has a very small foreign presence (14% of CMNE assets and 1.2% of Canada’s total share of corporate sector assets).
Statistics Canada collects data on goods imports by firms in Canada from “related” and “unrelated” parties that may provide additional insight on reshoring activity. A “related” party is defined as a company in which the importing firm has 5% ownership or more. Thus, this is a broader measure than direct investment for which at least 10% ownership is required. Nonetheless, CMNE imports from related parties is a good proxy for CMNE imports from affiliates, while unrelated party imports are a measure of firm imports from non-affiliates, i.e., foreign suppliers.
Looking at CMNE imports reveals that since 2016, the earliest year of data available, imports from related parties have grown at a faster average annual rate (11%) compared to imports from unrelated parties (7.4%). The growth in both imports indicates that reshoring does not appear to be a widespread trend among CMNEs.Footnote 19 Relative to sales, however, related party imports have remained stagnant, while unrelated party imports have fallen (Figure 2.17). Therefore, CMNE sales have been increasing at a greater rate than imports from non-affiliates. This may be indicative of greater sourcing from domestic suppliers and/or increased domestic production, compared to foreign suppliers, but not a decrease in inputs from foreign affiliates.
Figure 2.17: The share of CMNE imports from affiliates relative to sales has remained constant
Text version - Figure 2.17
| Year | Imports from unrelated parties (billions CAN$) | Imports from related parties (billions CAN$) | Imports from unrelated parties as a share of total CMNE sales (%) | Imports from related parties as a share of total CMNE sales (%) |
|---|---|---|---|---|
| * Note: CMNEs are defined as enterprises based in Canada that own more than 50% of the voting shares of a foreign affiliate. A related party is defined as a party for which there is at least 5% control or more of the outstanding voting stock or shares. The CMNE “related party” imports represent goods imports from foreign businesses with which the CMNE has at least a 5% relationship. Source: Statistics Canada, custom order and Tables 36-10-0470-01, 36-10-0356-01. Retrieved February 2024. Calculation of the OCE. | ||||
| 2016 | 57 | 9 | 3.5 | 0.5 |
| 2017 | 59 | 10 | 3.4 | 0.6 |
| 2018 | 67 | 12 | 3.3 | 0.6 |
| 2019 | 69 | 13 | 3.2 | 0.6 |
| 2020 | 63 | 12 | 3 | 0.6 |
| 2021 | 71 | 14 | 3.1 | 0.6 |
Statistics Canada’s Survey of Innovation and Business Strategy provides further insight on reshoring activity. This survey collects information on the strategic decisions and global value chain activities of businesses in Canada. Results from the 2021 release reveal that between 2017 and 2019, only 1.2% of businesses surveyed moved activities from outside Canada to a Canadian location, an even smaller share than between 2015 and 2017 (1.5%). Furthermore, a greater share of businesses reported having affiliates abroad in 2019 (8.9%) compared to 2017 (5.3%).
U.S. data also do not provide clear evidence of reshoring trends. Data on the activities of U.S. multinationals tell a mixed story. U.S. MNE domestic employment remained relatively constant while MNE domestic assets grew. The latter could be attributed to some reshoring by U.S. multinationals. However, the increase in domestic assets could also reflect growth in the domestic market without significant reshoring activity (Blais-Morisset and Rao 2024). Data on imports from affiliates and non-affiliates reveal that U.S. multinationals appear to be decreasing foreign sourcing, and possibly reshoring outsourcing, but offshore affiliate activity does not seem to have fallen. However, relative to total U.S. MNE sales, both imports from non-affiliates and affiliates as a share of sales have fallen between 2011 and 2021. In other words, overall sales activity by U.S. MNEs has been increasing at a greater rate than U.S. MNE inputs from abroad. This could be indicative of greater sourcing from domestic suppliers and/or increased domestic production.
As of the first half of 2024, the data available do not support the existence of broad reshoring trends in Canada or the U.S. Companies may be planning to reshore to increase the resiliency of their supply chains, both in terms of sourcing and production, but have yet to finalize and deploy plans (Box 2.3).
Box 2.3: Companies’ intentions—different strategies to increase future resiliency
Decisions concerning reshoring are part of a business’s long-term strategy. In the short term, it is less likely that a firm will reshore, given the associated costs and time it takes to shift operations back home or the costs to break existing contracts with suppliers and find new domestic suppliers. Thus, companies’ decisions to relocate affiliates or switch suppliers since the start of the pandemic or following recent geopolitical conflicts may not yet be reflected in the data. Recent surveys on business intentions may provide insight into future trends.
Survey results for Canadian businesses show modest interest in reshoring. In 2023, only 4.4% of respondents of Statistics Canada’s Survey of Business Conditions (2023, Q2) reported that they intend to relocate supply chain activities to Canada. Intentions are slightly higher for firms in manufacturing (7.5%) and information and cultural (8.5%) industries. Firms appear to have other ideas to increase supply chain resiliency. There seems to be slightly increased leaning towards relocation to other countries. The share of firms that intend to relocate supply chain activities outside of Canada was slightly higher overall (5.6%), again with a share that is higher among firms in manufacturing industries (23%). Aside from changing shoring strategies, companies are looking at adjusting supply chains by working with suppliers to improve timeliness (36%), partnering with new suppliers (31%), or substituting inputs (27% of respondents). The latter two strategies are not mutually exclusive to switching affiliate or supplier locations.
Looking south of the border, U.S. business leaders seem to be considering relocating supply chain activities more than their Canadian counterparts. A recent survey of U.S. executives (ABB 2022) found that 37% of respondents were considering moving production back home. Nearshoring is also a popular option being considered, with 33% considering relocating nearby. Meanwhile, another survey of U.S. CEOs and business leaders (Kearney 2023) reveals a very strong leaning towards reshoring manufacturing operations with most respondents (96%) reporting having reshored, planning to reshore, or evaluating whether to reshore some of their operations. The definition of reshoring used for this survey includes both a relocation to the affiliates’ home country and the switch to domestic suppliers.
Not coming back home, but maybe still relocating
As noted, relocating to other locations rather than back to the home country may be preferable to moving production and sourcing back home. Companies may choose to nearshore (Figure 2.16). This may be the chosen strategy for several reasons, including reduced shipping delays, decreased transportation costs, and improved communications (by operating in the same time zone, for example). Nearshoring allows companies to continue to benefit from production efficiencies available to them. Data on the assets of Canadian multinationals abroad do not show any clear sign of nearshoring with respect to affiliates. While the share of CMNE assets in the U.S. has grown, so have the shares in Asian countries. Furthermore, growth in assets in the rest of Asia (not including China) (17.6%) outpaced growth in CMNE assets in the U.S. (11.7%) over the past 5 years. Similarly, data on U.S. MNE activities do not support the nearshoring narrative. Over the past decade, the shares of assets in neighbouring countries, Canada and Mexico, have both shrunk (Blais-Morisset and Rao 2024) while countries in Europe and Asia have seen growth of U.S. assets.
If a notable proportion of Canadian firms are nearshoring affiliates, the share of FDI stock in countries that are closer in proximity would increase relative to the shares in those that are further away. Therefore, another way to look for the presence of the nearshoring phenomenon is to examine how shares in FDI stock abroad are changing relative to host-country distances. This is done by calculating an “average distance,” which represents the sum of the distances of each FDI destination weighted by their respective shares of FDI stock. The average distance of CDIA stock trended upwards until 2012, increasing by 1.3 times compared to two decades prior (Figure 2.18). From 2012 onwards the distance began to shrink (17% drop between 2012 and 2022), which may be indicative of nearshoring. Conversely, the average distance of U.S. direct investment abroad did not change as markedly, with a decrease of 3.1% between 1996 and 2003 and 2.4% between 2006 and 2011, followed by an upwards trend until 2019 (3.7% growth between 2011 and 2019). There may have been nearshoring of U.S. affiliates in recent years with the distance of investment abroad gradually decreasing. Interestingly, the average distance of investment abroad is higher for the U.S. than for Canada. In other words, overall, the U.S. has more FDI stock in more distant locations relative to countries in closer proximity. Canada’s much lower average distance reflects the fact that half of its CDIA stock is in the country within the closest proximity: neighbouring U.S.
It is important to keep in mind that outward FDI stock data do not necessarily represent the final investment destination. Sometimes companies channel funds through a subsidiary or an offshore financial centre (OFC), so the destination country recorded may not be the ultimate host country. This results in investments in some countries being overstated while those in others may be understated (State of Trade 2021). Excluding data for countries that are widely recognized to be OFCs (Torslov et al. 2021) partially accounts for the lack of final host country data. For both Canada and the U.S., the average distances of FDI stock excluding OFCs follow a similar pattern to the original data.
Figure 2.18: More of Canada’s outward direct investment is in closer countries, namely the U.S.
Text version - Figure 2.18
| Year | Canada | Canada excl. OFCs | U.S. | U.S. excl. OFCs |
|---|---|---|---|---|
| Note: 2004 figure for U.S. investment in Australia has been suppressed to avoid disclosure of data of individual companies. Given that Australia accounts for a significant share of U.S. direct investment abroad, this year was excluded from the chart. Source: Statistics Canada, Tables 36-10-0008-01; Bureau of Economic Analysis; CEPII. Retrieved December 2023. Calculation of the OCE. | ||||
| 1987 | 3,111 | 2,868 | 6,428 | 6,708 |
| 1988 | 3,339 | 3,094 | 6,394 | 6,664 |
| 1989 | 3,319 | 3,135 | 6,340 | 6,678 |
| 1990 | 3,415 | 3,194 | 6,454 | 6,718 |
| 1991 | 3,450 | 3,262 | 6,545 | 6,783 |
| 1992 | 3,498 | 3,287 | 6,623 | 6,883 |
| 1993 | 3,671 | 3,453 | 6,732 | 6,966 |
| 1994 | 3,829 | 3,636 | 6,798 | 7,065 |
| 1995 | 3,922 | 3,749 | 6,928 | 7,135 |
| 1996 | 3,877 | 3,709 | 6,956 | 7,182 |
| 1997 | 3,803 | 3,671 | 6,904 | 7,082 |
| 1998 | 3,816 | 3,670 | 6,941 | 7,130 |
| 1999 | 3,679 | 3,516 | 6,857 | 7,048 |
| 2000 | 3,785 | 3,682 | 6,819 | 6,982 |
| 2001 | 3,871 | 3,851 | 6,780 | 6,837 |
| 2002 | 3,922 | 3,969 | 6,767 | 6,817 |
| 2003 | 4,116 | 4,194 | 6,743 | 6,809 |
| 2004 | 3,968 | 4,016 | ||
| 2005 | 3,830 | 3,884 | 6,880 | 6,952 |
| 2006 | 3,735 | 3,793 | 6,942 | 7,035 |
| 2007 | 3,846 | 3,898 | 6,775 | 7,003 |
| 2008 | 3,854 | 3,797 | 6,744 | 7,064 |
| 2009 | 4,129 | 4,142 | 6,669 | 7,061 |
| 2010 | 4,300 | 4,369 | 6,795 | 7,143 |
| 2011 | 4,052 | 4,254 | 6,773 | 7,094 |
| 2012 | 4,436 | 4,553 | 6,842 | 7,075 |
| 2013 | 4,291 | 4,375 | 6,931 | 7,099 |
| 2014 | 4,173 | 4,242 | 6,951 | 7,130 |
| 2015 | 4,039 | 4,037 | 7,004 | 7,108 |
| 2016 | 4,009 | 3,990 | 7,021 | 7,132 |
| 2017 | 3,980 | 3,941 | 7,013 | 7,118 |
| 2018 | 3,945 | 3,870 | 6,954 | 7,131 |
| 2019 | 3,939 | 3,924 | 7,023 | 7,140 |
| 2020 | 3,913 | 3,739 | 6,999 | 7,128 |
| 2021 | 3,755 | 3,511 | 6,960 | 7,041 |
| 2022 | 3,687 | 3,430 | 6,948 | 6,968 |
Instead of moving operations back home, or to a country within closer proximity, firms may choose to relocate to another country within the region where the affiliate is located or to another distant location. This would be the case if trying to take advantage of lower costs (such as wages) or increased efficiencies. Firms may also choose to relocate in response to changing global or regional strategies. The increase in both CMNE and U.S. MNE assets in Asian countries may be a sign of relocations of North American affiliates within Asia. However, this could also simply reflect increased offshoring, period. Still, there are signs that multinationals are changing their offshoring strategies within Asia. While there have been no notable trends in divestments of existing assets in China, new FDI project announcements by American and Western European companies have been falling for over a decade (Figure 2.19). Meanwhile, project announcements in other Asian economies grew. This suggests that Western firms are shifting their offshoring strategies and switching to locations where the net benefits are higher, possibly due to a combination of lower costs and lower risks.
Figure 2.19: Project announcements in China have been falling while other Asian countries are seeing increased investments
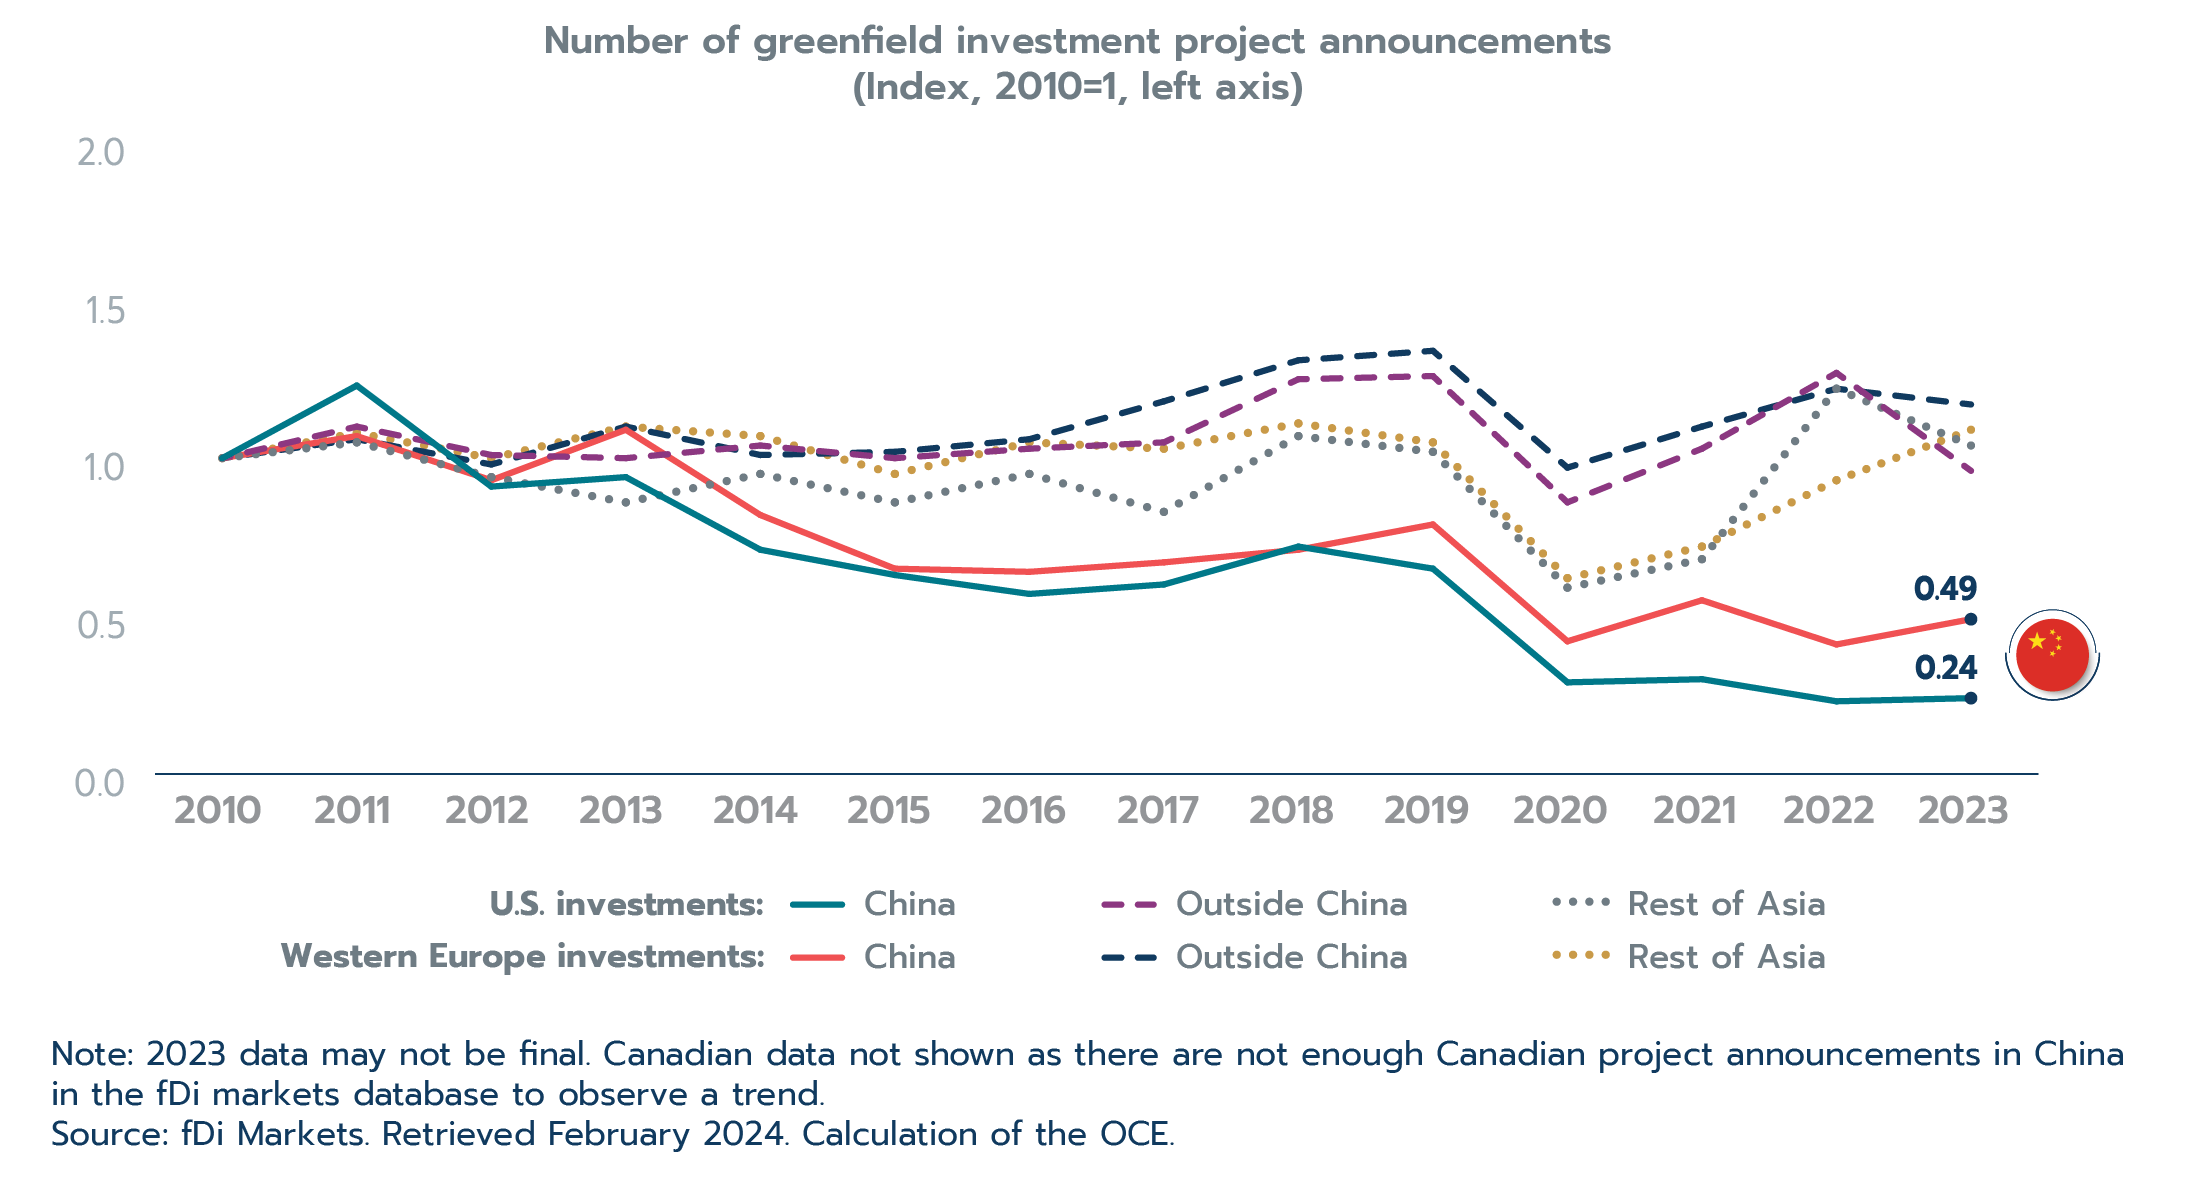
Text version - Figure 2.19
| Year | U.S. investments | Western Europe investments | ||||
|---|---|---|---|---|---|---|
| China | Outside China | Rest of Asia | China | Outside China | Rest of Asia | |
| Note: 2023 data may not be final. Canadian data not shown as there are not enough Canadian project announcements in China in the fDi markets database to observe a trend. Source: fDi Markets. Retrieved February 2024. Calculation of the OCE. | ||||||
| 2010 | 1.00 | 1.00 | 1.00 | 1.00 | 1.00 | 1.00 |
| 2011 | 1.23 | 1.10 | 1.05 | 1.07 | 1.06 | 1.08 |
| 2012 | 0.91 | 1.01 | 0.94 | 0.93 | 0.98 | 1.00 |
| 2013 | 0.94 | 1.00 | 0.86 | 1.09 | 1.10 | 1.10 |
| 2014 | 0.71 | 1.04 | 0.95 | 0.82 | 1.01 | 1.07 |
| 2015 | 0.63 | 1.00 | 0.86 | 0.65 | 1.02 | 0.95 |
| 2016 | 0.57 | 1.03 | 0.95 | 0.64 | 1.06 | 1.05 |
| 2017 | 0.60 | 1.05 | 0.83 | 0.67 | 1.18 | 1.03 |
| 2018 | 0.72 | 1.25 | 1.07 | 0.71 | 1.31 | 1.11 |
| 2019 | 0.65 | 1.26 | 1.02 | 0.79 | 1.34 | 1.05 |
| 2020 | 0.29 | 0.86 | 0.59 | 0.42 | 0.97 | 0.62 |
| 2021 | 0.30 | 1.03 | 0.68 | 0.55 | 1.10 | 0.72 |
| 2022 | 0.23 | 1.27 | 1.22 | 0.41 | 1.22 | 0.93 |
| 2023 | 0.24 | 0.96 | 1.04 | 0.49 | 1.17 | 1.09 |
2.5 Conclusion
International supply chains play an important role in the Canadian economy. While Canada has been involved in international supply chains since before Confederation, today’s supply chains are vastly more complex and sophisticated, often consisting of a complicated web of suppliers, producers, assembly, and distribution points. While supply chains present challenges, as they can transmit external shocks to the Canadian economy, Canada also derives important benefits from international supply chains.
Literature cited in this feature illustrates how international supply chains improve the productivity of Canadian firms by allowing for access to foreign inputs and giving more choice in variety and customization of inputs. Furthermore, international supply chains allow firms to benefit from knowledge spillovers and help raise their productivity by increasing exposure to foreign competition and allowing domestic firms to focus on core tasks. Due to the productivity gains to firms, Canadian consumers gain from international supply chains through a greater variety of product choices and lower, more stable prices.
At the onset of the COVID-19 pandemic, Canadians were worried that shutdowns in factories across the globe could cause shortages at stores down the street. Many of the issues seen during the pandemic were due to a significant shift in demand from services to consumer durables, which in turn put pressure on transportation infrastructure, causing delays at ports and rising maritime shipping costs. Nonetheless, the pandemic showed just how robust supply chains were, given the size of the shock; Canadians were broadly able to continue to access most of the goods and services they needed.
While international supply chains recovered quickly from COVID-19 disruptions, they now face new challenges and risks. These risks can be grouped into four broad categories: climate change and natural disasters; human and organizational risks; environmental and social governance (ESG) concerns, and a changing geopolitical landscape. While these new risks are considerable, and in some cases—such as with climate change—on the rise, there are many ways firms can prepare for and try to mitigate these risks. Building up inventories, diversifying suppliers and innovating production processes were some of the strategies adopted by firms to mitigate their supply chain risks and build resilience into international supply chains.
Companies may also choose to reconfigure parts of their supply chains by relocating production activities back to the domestic economy, or reshoring. While reshoring is a possible response to the current risks facing international supply chains, it is a costly endeavour for businesses, as it forgoes many of the benefits derived from international supply chains. Based on data available at the time of writing, there is little evidence in the data that Canadian firms are reshoring on a large scale. Rather than bring activities back home, businesses instead may choose to relocate to another country, allowing them to address supply chain vulnerabilities while continuing to profit from other countries’ comparative advantages. There is some indication that firms may be relocating some input sources to other countries, though data is limited. Ultimately, a firm that does choose to relocate will not, realistically, do so in the short term. Whether it be through changing suppliers or relocating affiliates, the restructuring of globally integrated supply chains is a gradual process and changes in firm strategies typically take time to materialize.
How international supply chains will evolve into the future is yet unknown, as firms alter strategies in response to risks, challenges and changing priorities. What we do know is that international supply chains have been around for a long time and are likely to continue for a long time. We also know there are a great deal of benefits from using this system of production. Companies will continue to restructure and change their production process to compete and grow. International supply chains will likely become more complex and more sophisticated as companies continue to innovate and adopt new technologies, such as digitalization and artificial intelligence. For Canadian firms to remain competitive, they must learn to adapt, build resilient supply chains, and have strategies in place for when disruptions occur. The role of international supply chains in the Canadian economy will likely only increase in importance into the future, and Canadian businesses will continue to source needed inputs from abroad and, in turn, export their goods and services across the globe.
Bibliography
ABB Robotics and Discrete Automation. (2022). ABB supply chain survey. https://www.globenewswire.com/en/news-release/2022/06/28/2470499/0/en/ABB-survey-finds-70-of-US-businesses-looking-to-bring-production-closer-to-home-robotic-automation-and-workforce-upskilling-essential-to-return-of-operations.html.
Acemoglu, D. and Tahbaz-Salehi, A. (2020). Firms, failures, and fluctuations: The macroeconomics of supply chain disruptions. NBER Working Paper No. 27565, National Bureau of Economic Research, Cambridge, MA, USA.
Aiyar, M. S., Chen, M. J., Ebeke, C., Ebeke, M. C. H., Garcia-Saltos, M. R., Gudmundsson, T., ... & Trevino, M. J. P. (2023). Geo-economic fragmentation and the future of multilateralism. Washington, DC: IMF.
Andrews, D., Gal, P., and Witheridge, W. (2018). A genie in a bottle?: Globalisation, competition and inflation. OECD Economics Department Working Papers, No. 1462, OECD Publishing, Paris, https://doi.org/10.1787/deda7e54-en.
Baldwin, J. Yan, B. (2014). Global value chains and the productivity of Canadian manufacturing firms. Economic analysis (EA) research paper series1703-0404 No. 90. https://publications.gc.ca/collections/collection_2014/statcan/11f0027m/11f0027m2014090-eng.pdf.
Baldwin, R. (2013). Global supply chains: Why they emerged, why they matter, and where they are going. CTEI Working Papers, The Graduate Institute Geneva, Centre for Trade and Economic Integration.
Baluch, A. and Bottorf, C. (2023). What is just in time inventory (jit)? Forbes Advisor. https://www.forbes.com/advisor/business/just-in-time-inventory/#:~:text=Reduce%20waste.,Increase%20productivity.
Bank of Canada. (2021). Understanding how monetary policy works. Ottawa, ON. https://www.bankofcanada.ca/2021/04/understanding-how-monetary-policy-works/.
Barbieri, P., Ciabuschi, F., Fratocchi, L., and Vignoli, M. (2018). What do we know about manufacturing reshoring? Journal of Global Operations and Strategic Sourcing, Vol.11 No.1, 79-122. doi: 10.11108/JGOSS-02-2017-0004.
Barbieri, P., Elia, S., Fratocchi, L., and Golini, R. (2019). Relocation of Second Degree: Moving Towards a New Place or Returning Home? Journal of Purchasing and Supply Management, 25(3). doi: 10.1016/j.pursup.2018.12.003.
Barbieri, P., Boffelli, A., Elia, S. Fratocchi, L., Kalchschmidt. M., and Samson D. (2020). What can we learn about reshoring after Covid-19? Operations Management Research, 13(3-4), 131-136. doi: 10.1007/s12063-020-00160-1.
Bazile, J. Toumi, S. Mohiuddin, M. Su, Z. (2024). The challenges of Canadian SMEs in the face of global supply chain turbulence: Results from a Pan-Canadian survey. Université Laval. https://sites.fsa.ulaval.ca/www4/document/recherche/chaire-gestion-affaires-internationales/Final-report-team-ZhanSu.pdf.
Blais-Morisset, P. and Rao, S. (2024). Reshoring trend? What the evidence shows. Ottawa: Global Affairs Canada. https://www.international.gc.ca/trade-commerce/economist-economiste/analysis-analyse/reshoring_trend-tendance_rapatriement.aspx?lang=eng.
Boileau, D. and Sydor, A. (2020). Vulnerability of Canadian industries to disruptions in global supply chains. Ottawa: Global Affairs Canada. https://www.international.gc.ca/trade-commerce/economist-economiste/analysis-analyse/supply-chain-vulnerability.aspx?lang=eng.
Carrière-Swallow, Y., Deb, P., Furceri, D., Jiménez, D., & Ostry, J. D. (2022). How soaring shipping costs raise prices around the world. Washington, DC: IMF.
Carvalho, V. M., Nirei, M., Saito, Y. U., and Tahbaz-Salehi, A. (2021). Supply chain disruptions: Evidence from the great east Japan earthquake. The Quarterly Journal of Economics, 136(2), 1255-1321.
Criscuolo, C. and Timmis, J. (2017). The relationship between global value chains and productivity. International Productivity Monitor, 32, issue , 61-83, https://EconPapers.repec.org/RePEc:sls:ipmsls:v:32:y:2017:4.
De Backer, K., Menon, C., Desnoyers-James, I., and Moussiegt, L. (2016). Reshoring: Myth or reality? OECD Science, Technology and Industry Policy Papers, No. 27, OECD Publishing, Paris. doi: 10.1787/23074957.
De Soyres, F. and Franco, S. (2019). Inflation dynamics and global value chains. World Bank Policy Research Working Paper, (9090).
Degain, C., Meng, B., and Wang, Z. (2017). Recent trends in global trade and global value chains. In the World Bank Group. In Global Value Chain Development Report 2017: Measuring and Analyzing the Impact of GVCs on Economic Development, 37-68.
Di Stefano, E., Giovannetti, G., Mancini, M., Marvasi, E. and Vannelli, G. (2022). Reshoring and plant closures in Covid-19 times: Evidence from Italian MNEs. International Economics, 172, 255-277. doi: 10.1016/j.inteco.2022.09.009.
DRex. (2023). How many semiconductor chips in a modern car? https://www.icdrex.com/how-many-semiconductor-chips-in-a-modern-car/.
Dun and Bradstreet. (2022). Russia-Ukraine crisis implications for the global economy and businesses. https://www.dnb.co.uk/content/dam/english/dnb-data-insight/DNB_Russia_Ukraine_Crisis_UK.pdf.
Dunning, J. (1979). Explaining Changing Patterns of International Production: In Defence of the Eclectic Theory. Oxford Bulletin of Economics and Statistics.
Ersahin, N., Giannetti, M., and Huang, R. (2023). Supply chain risk: Changes in supplier composition and vertical integration (No. w31134). National Bureau of Economic Research.
Evenett, S., Jakubik, A., Martín, F., and Ruta, M. (2024). IMF working paper: The return of industrial policy in data. Washington, DC: IMF.
Fel, F., Cayla, J., and Carbonne, V. (2020). L’industrie 4.0 peut-elle favoriser une relocation de la production en France. Logistique and Management. 28(1), 18-28. doi: 10.1080/12507970.2019.1683477.
Forbes. (2016). How Honda's new innovation gives it a huge edge. https://www.forbes.com/sites/greatspeculations/2016/07/13/how-hondas-new-innovation-gives-it-a-huge-edge/?sh=4a7ff3247a00.
Foster, J., and Eccles, W. (2019). Fur Trade in Canada. In The Canadian Encyclopedia. https://www.thecanadianencyclopedia.ca/en/article/fur-trade.
Georgieva, K. (2023). The price of fragmentation: Why the global economy isn’t ready for the shocks ahead. Foreign Affairs, 102, 131.
Global Trade Alert. (2024). Global Dynamics Database. https://www.globaltradealert.org/global_dynamics. [Accessed March 2024]
Globerman, S. (2011). Global value chains: economic and policy issues. In Global Value Chains: Impacts and Implications, ed. A. Sydor, 17-42. Ottawa: Department of Foreign Affairs and International Trade.
Greer, J. (2022). The biggest ESG risks in your supply chain. Moddy’s Analytics. https://www.moodysanalytics.com/articles/2022/top-esg-risks-in-supply-chain.
International Labour Office. (2016). Report IV Decent work in global supply chains. https://webapps.ilo.org/public/libdoc/ilo/2016/116B09_43_engl.pdf.
International Monetary Fund. (2023). World economic outlook: Navigating global divergences (October 2023). Washington, DC: IMF. https://www.imf.org/en/Publications/WEO/Issues/2023/10/10/world-economic-outlook-october-2023.
International Monetary Fund. (2024). World economic outlook: Steady but slow: Resilience amid divergence (April 2024). Washington, DC: IMF. https://www.imf.org/en/Publications/WEO/Issues/2024/04/16/world-economic-outlook-april-2024.
Jain, N., Girotra, K., and Netessine, S. (2022). Recovering global supply chains from sourcing interruptions: The role of sourcing strategy. Manufacturing & Service Operations Management, 24(2), 846-863.
Kearney. (2023). America is ready for reshoring. Are you? 2022 Reshoring Index. https://www.kearney.com/service/operations-performance/us-reshoring-index/2022.
Kennedy, S. and Mazzocco, I. (2022). Has trade with China really cost the U.S. jobs? Harvard Business Review. https://hbr.org/2022/11/has-trade-with-china-really-cost-the-u-s-jobs.
Kim, M. (2018). Rising Import Competition in Canada and its Employment Effect by Skill Group: Evidence from the 'China Shock'. Centre for the Study of Living Standards.
Kim, M. (2020). The Price Effect of Trade: Evidence of the China Shock and Canadian Consumer Prices (no. 2020-02). Centre for the Study of Living Standards.
Komaromi, A., Cerdeiro, D. A., Cerdeiro, M. D. A., and Liu, Y. (2022). Supply chains and port congestion around the world. International Monetary Fund.
Krenz, A., and Strulik, H. (2021). Quantifying reshoring at the macro-level—Measurement and applications. Growth and Change, 52(3), 1230-1250. doi: 10.1111/grow.12513.
Lee, H., Calvin, K., Dasgupta, D., Krinner, G., Mukherji, A., Thorne, P., ... and Park, Y. (2023). IPCC, 2023: Climate Change 2023: Synthesis Report, Summary for Policymakers. Contribution of Working Groups I, II and III to the Sixth Assessment Report of the Intergovernmental Panel on Climate Change [Core Writing Team, H. Lee and J. Romero (eds.)]. IPCC, Geneva, Switzerland.
Leslie, J. (2022). How climate change is disrupting the global supply chain. Yale Environment 360. https://e360.yale.edu/features/how-climate-change-is-disrupting-the-global-supply-chain.
Makin, A. J., and Layton, A. (2021). The global fiscal response to COVID-19: Risks and repercussions. Economic Analysis and Policy, 69, 340-349.
MIT Sloan School of Management. (2022). How auto companies are adapting to the global chip shortage. https://mitsloan.mit.edu/ideas-made-to-matter/how-auto-companies-are-adapting-to-global-chip-shortage#:~:text=The%20response%3A%20retrofitting%2C%20reworking%2C,arise%20from%20this%20indiscriminate%20approach.
Office of the Chief Economist. (2011). Canada’s State of Trade: The evolution of Global Value Chains. https://www.international.gc.ca/trade-commerce/economist-economiste/state_of_trade-commerce_international/special_feature-2011-article_special.aspx?lang=eng.
Office of the Chief Economist. (2021). State of Trade 2021: A Closer Look at Foreign Direct Investment. Ottawa: Global Affairs Canada. /docs/state-trade-commerce-international/2021.aspx?lang=eng.
Office of the Chief Economist. (2024). Highlights of Canada’s merchandise trade performance - 2023 update. https://www.international.gc.ca/trade-commerce/economist-economiste/analysis-analyse/merchandise_trade-commerce_marchandises-2023.aspx?lang=eng.
Organisation for Economic Co-operation and Development. (2023). Trade in Value Added (TiVA) 2023 edition: Principal indicators. https://www.oecd.org/sti/ind/measuring-trade-in-value-added.htm#access.
Panama Canal Authority. (2024). Advisory to shipping no. A-07-2024. https://pancanal.com/wp-content/uploads/2024/01/ADV07-2024-MONTHLY-FEB.pdf.pdf.
Public Safety Canada. (2024). Forced Labour in Canadian Supply Chains. https://www.publicsafety.gc.ca/cnt/cntrng-crm/frcd-lbr-cndn-spply-chns/index-en.aspx.
S&P Global. (2023). The semiconductor shortage is – mostly – over for the auto industry. https://www.spglobal.com/mobility/en/research-analysis/the-semiconductor-shortage-is-mostly-over-for-the-auto-industry.html.
Schiller, C. (2018). Global supply-chain networks and corporate social responsibility. In 13th Annual Mid-Atlantic Research Conference in Finance (MARC) Paper.
Semiconductor Industry Association. (2022). Congress Passes Investments in Domestic Semiconductor Manufacturing, Research & Design. https://www.semiconductors.org/chips/#:~:text=The%20share%20of%20modern%20semiconductor,the%20U.S.%20government%20has%20not.
Sheffi, Y. (2005). The resilient enterprise: overcoming vulnerability for competitive advantage. Pearson Education India.
Sprinkle, G. B., and Maines, L. A. (2010). The benefits and costs of corporate social responsibility. Business Horizons, 53(5), 445.
Sweet, S. (2024). US: The inflation risks from global shipping disruptions. Oxford Economics.
Tokui, J., Kawasaki, K., and Miyagawa, T. (2017). The economic impact of supply chain disruptions from the Great East-Japan earthquake. Japan and the World Economy, 41, 59-70.
Torslov, T., Wier, L., and Zucman, G. (2022). The Missing Profits of Nations. Review of Economic Studies. doi: 10.1093/restud/rdac049.
Tran, T. (forthcoming). The export survival of young Canadian firms. Ottawa: Office of the Chief Economist, Global Affairs Canada.
United Nations Conference on Trade and Development. (2024). Global investment trends monitor: Issue 46. Geneva: UNCTAD. https://unctad.org/publication/global-investment-trends-monitor-no-46.
World Bank Group. (2024). Pink sheet data. World Bank, Washington, DC. https://www.worldbank.org/en/research/commodity-markets. [Accessed May, 2024]
World Trade Organization. (2024). Trade in commercial services. https://stats.wto.org/.
Yang, Z., Aydın, G., Babich, V., and Beil, D. R. (2012). Using a dual-sourcing option in the presence of asymmetric information about supplier reliability: Competition vs. diversification. Manufacturing & Service Operations Management, 14(2), 202-217.
- Date modified: